

Petrography and Fluid Inclusions for Petroleum System Analysis of Pre-Salt Reservoirs in the Santos Basin, Eastern Brazilian Margin

 ,
,  ,
,  , ,
, ,
Abstract
1. Introduction
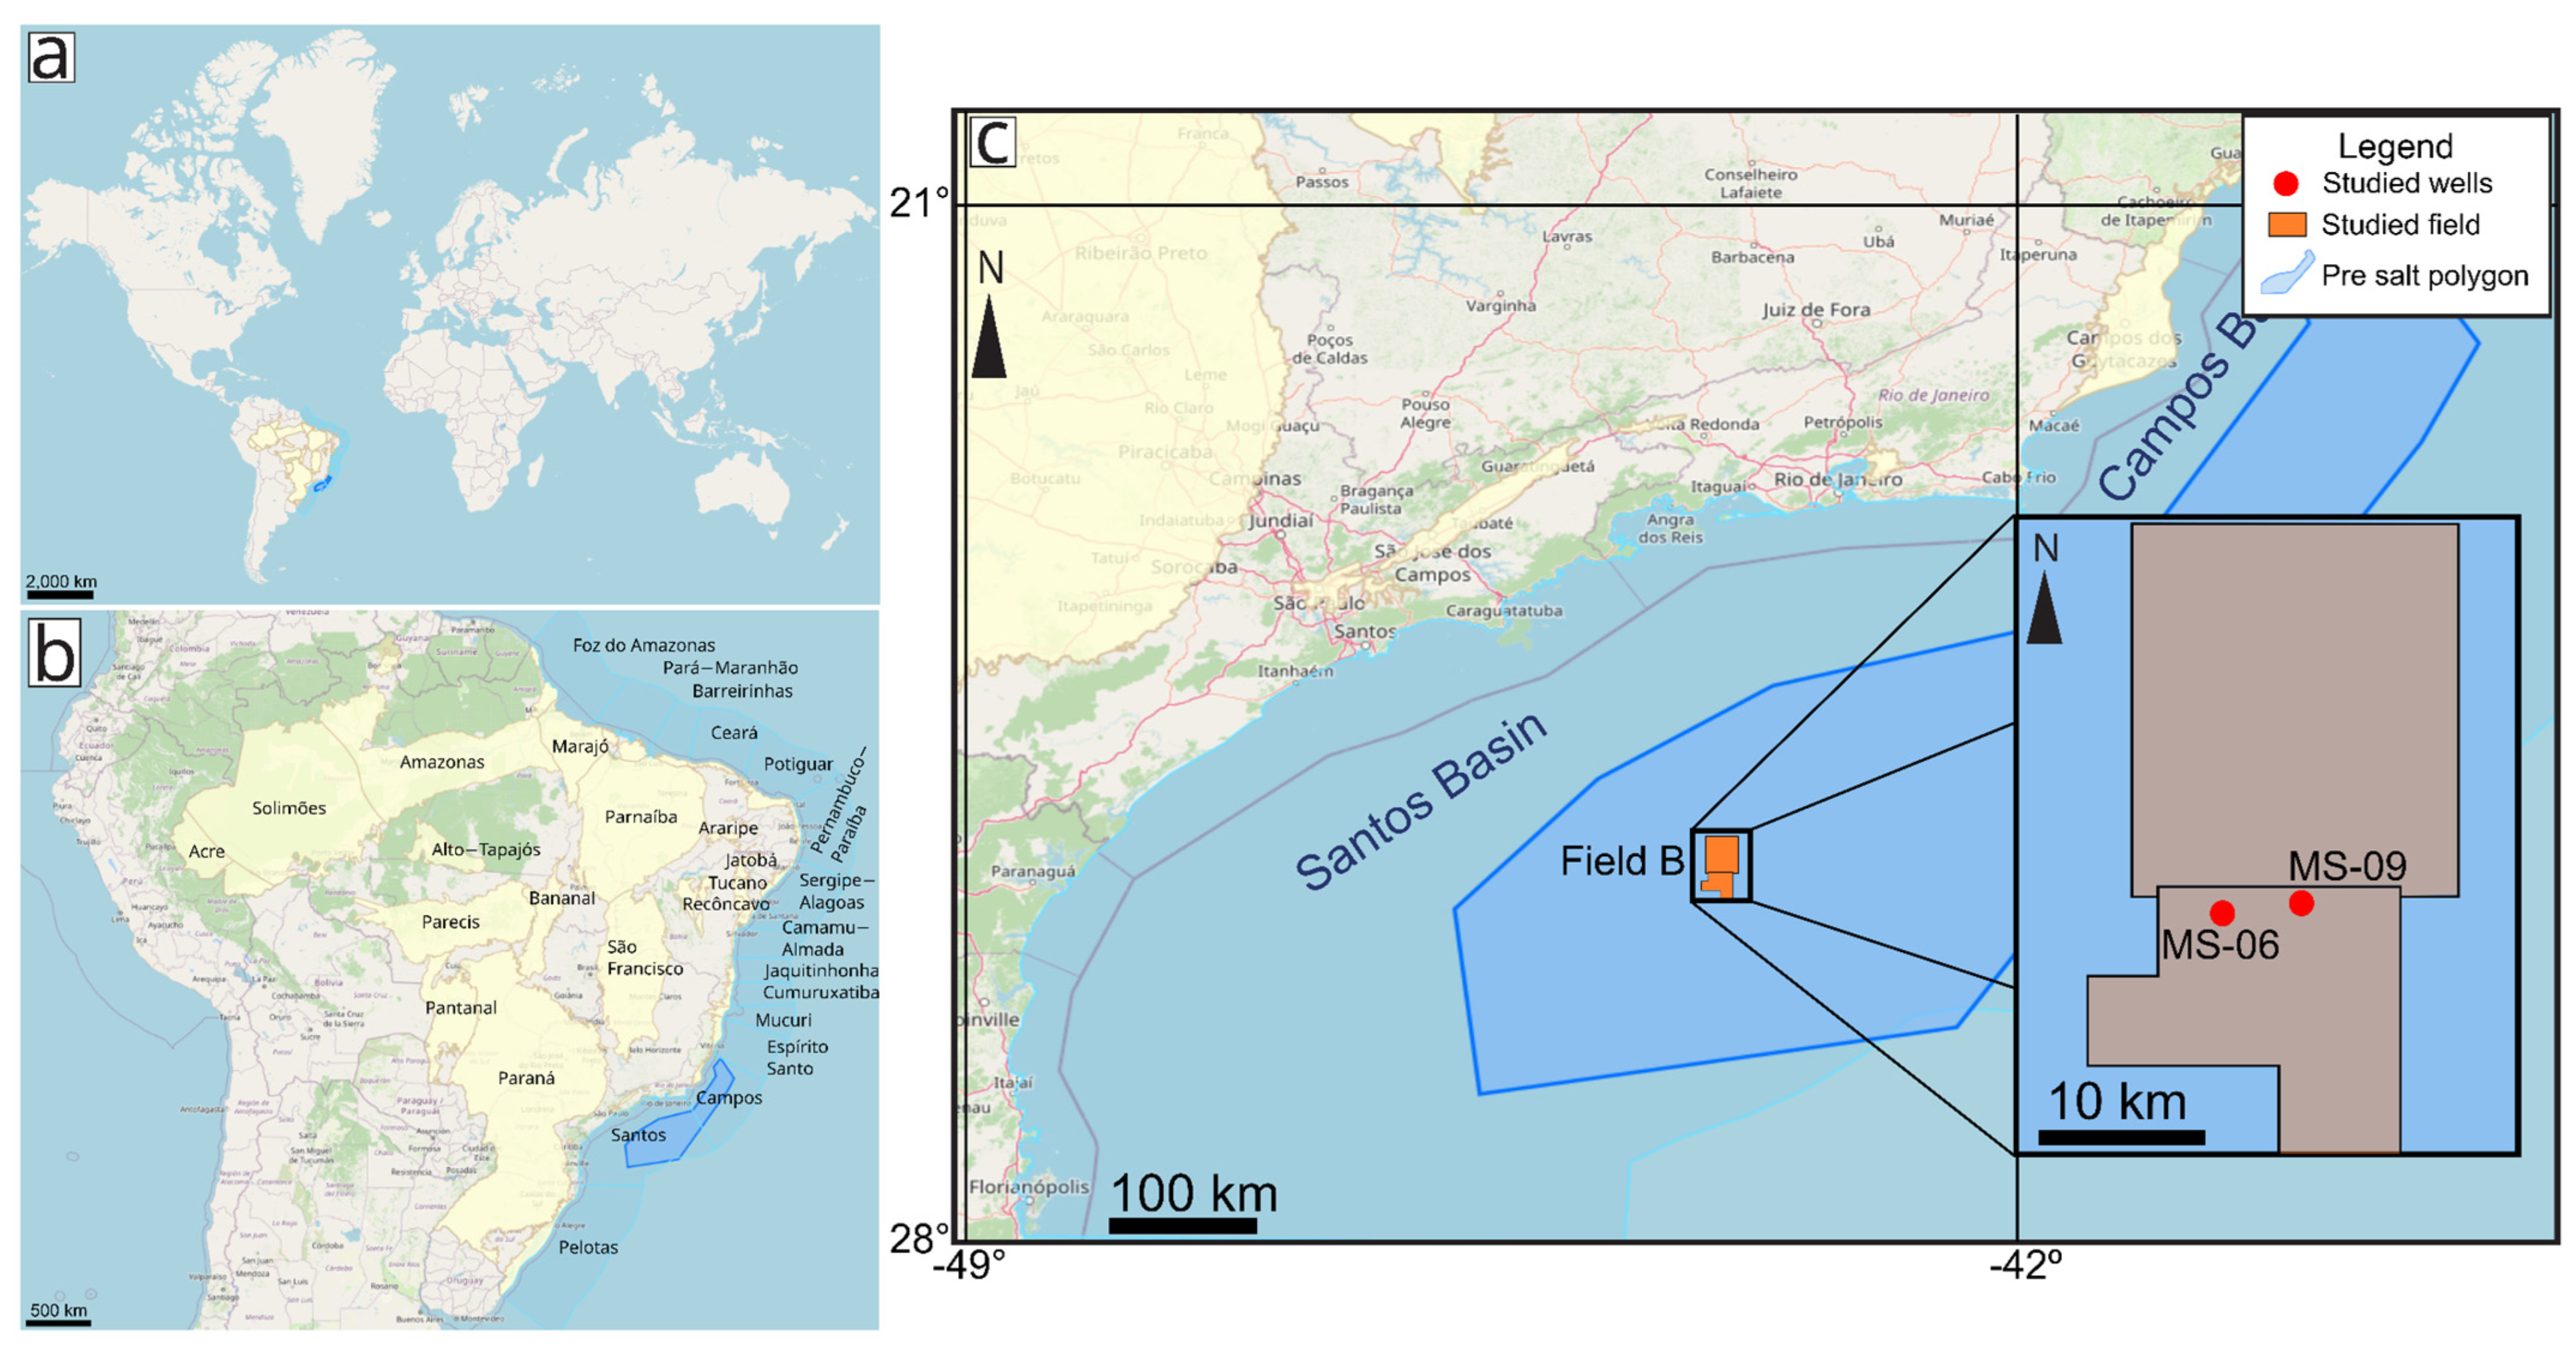
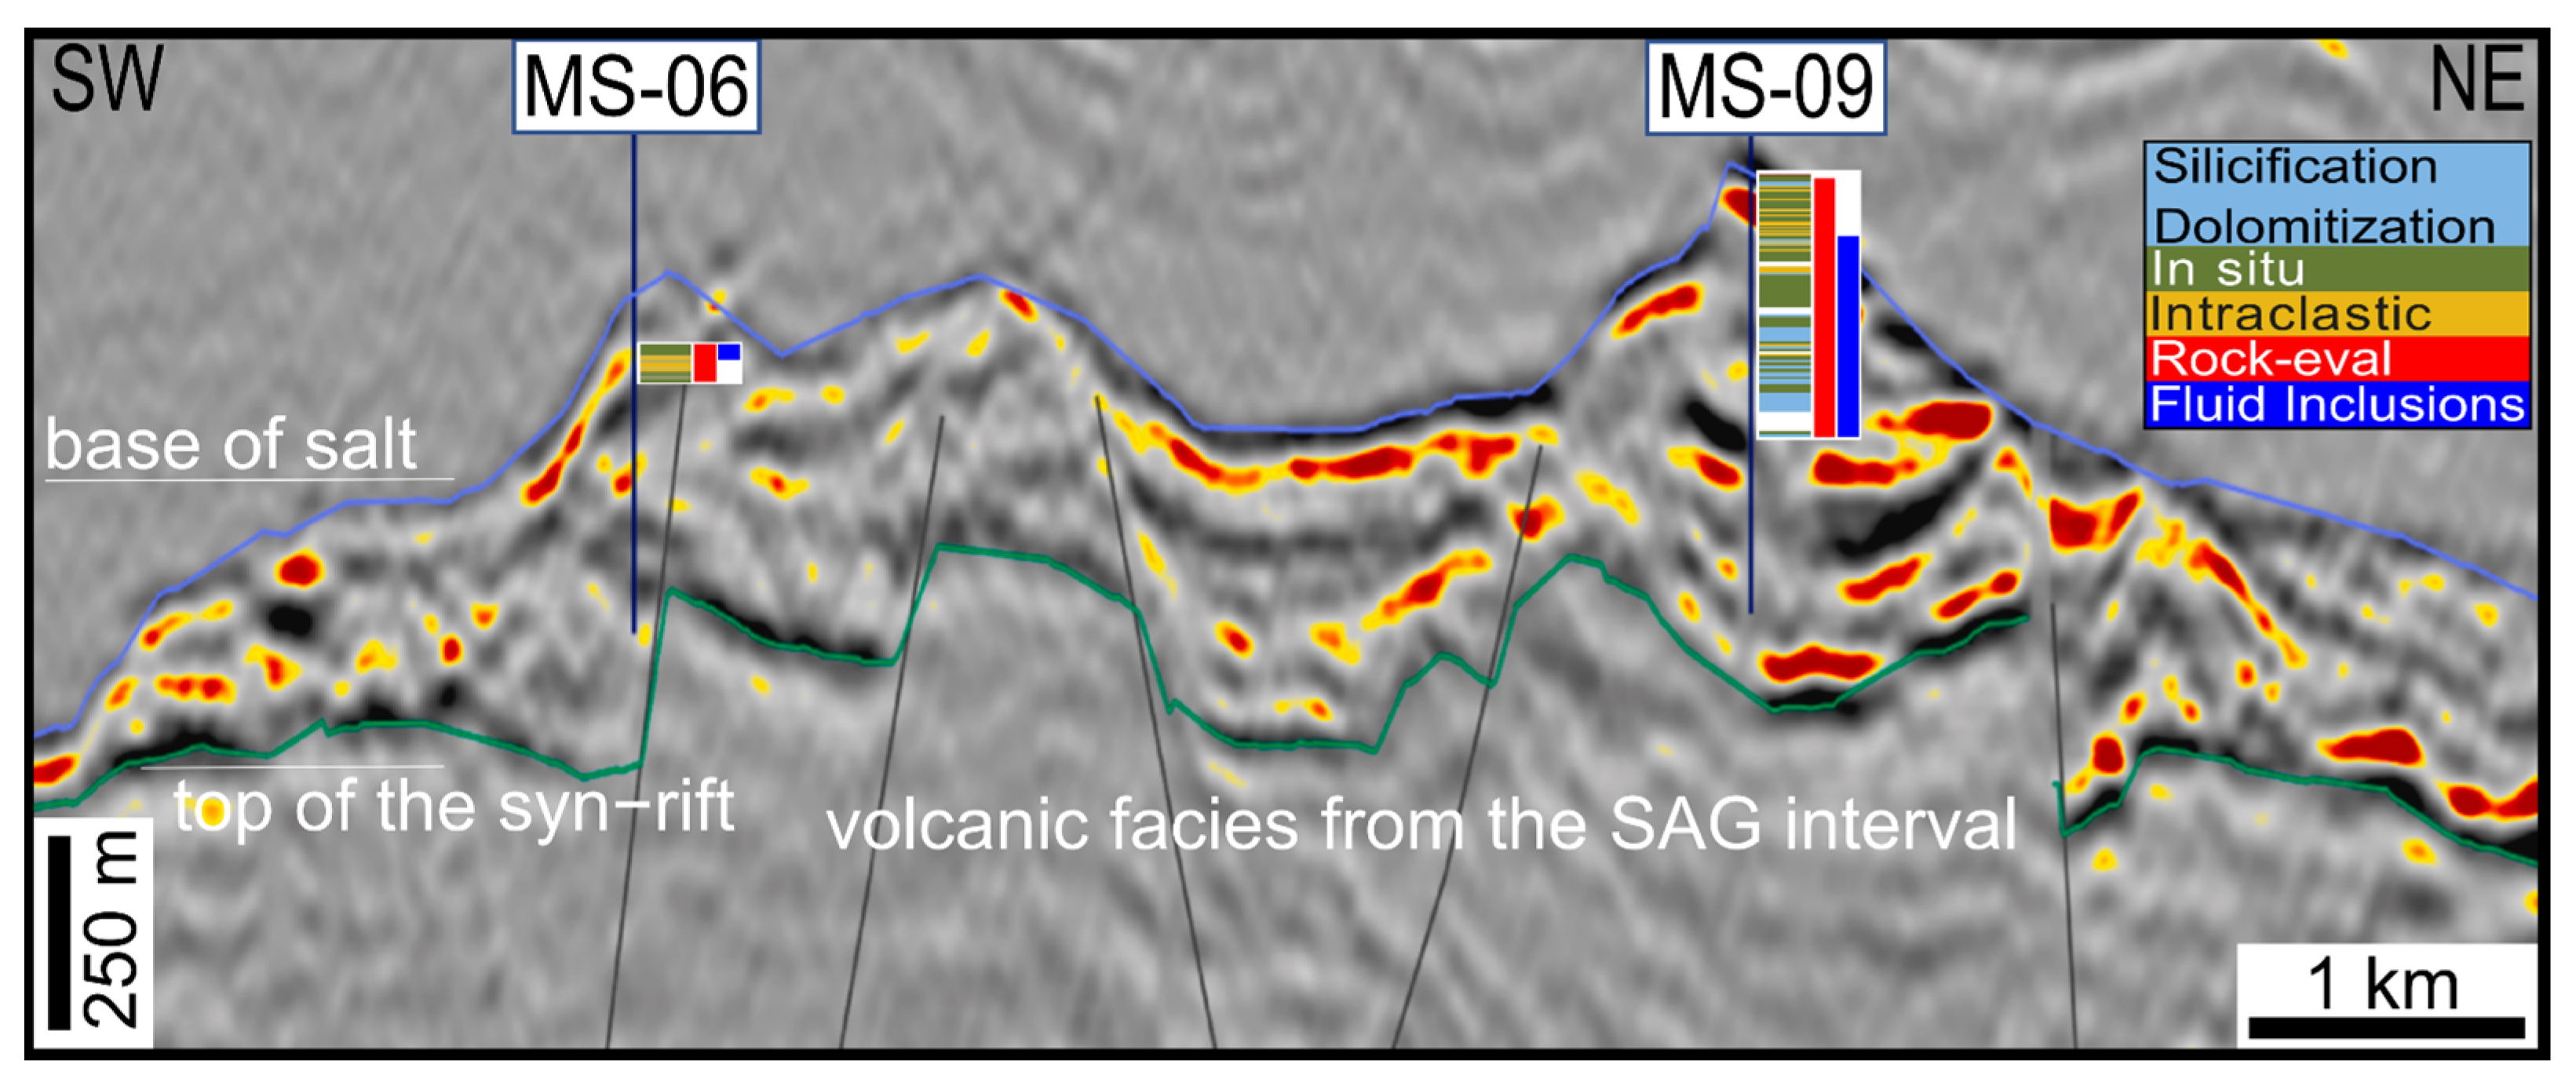
Geologic Setting
2. Materials and Methods
2.1. Petrography
2.2. Rock-Eval
2.3. Fluid Inclusions
3. Results
3.1. Petrography
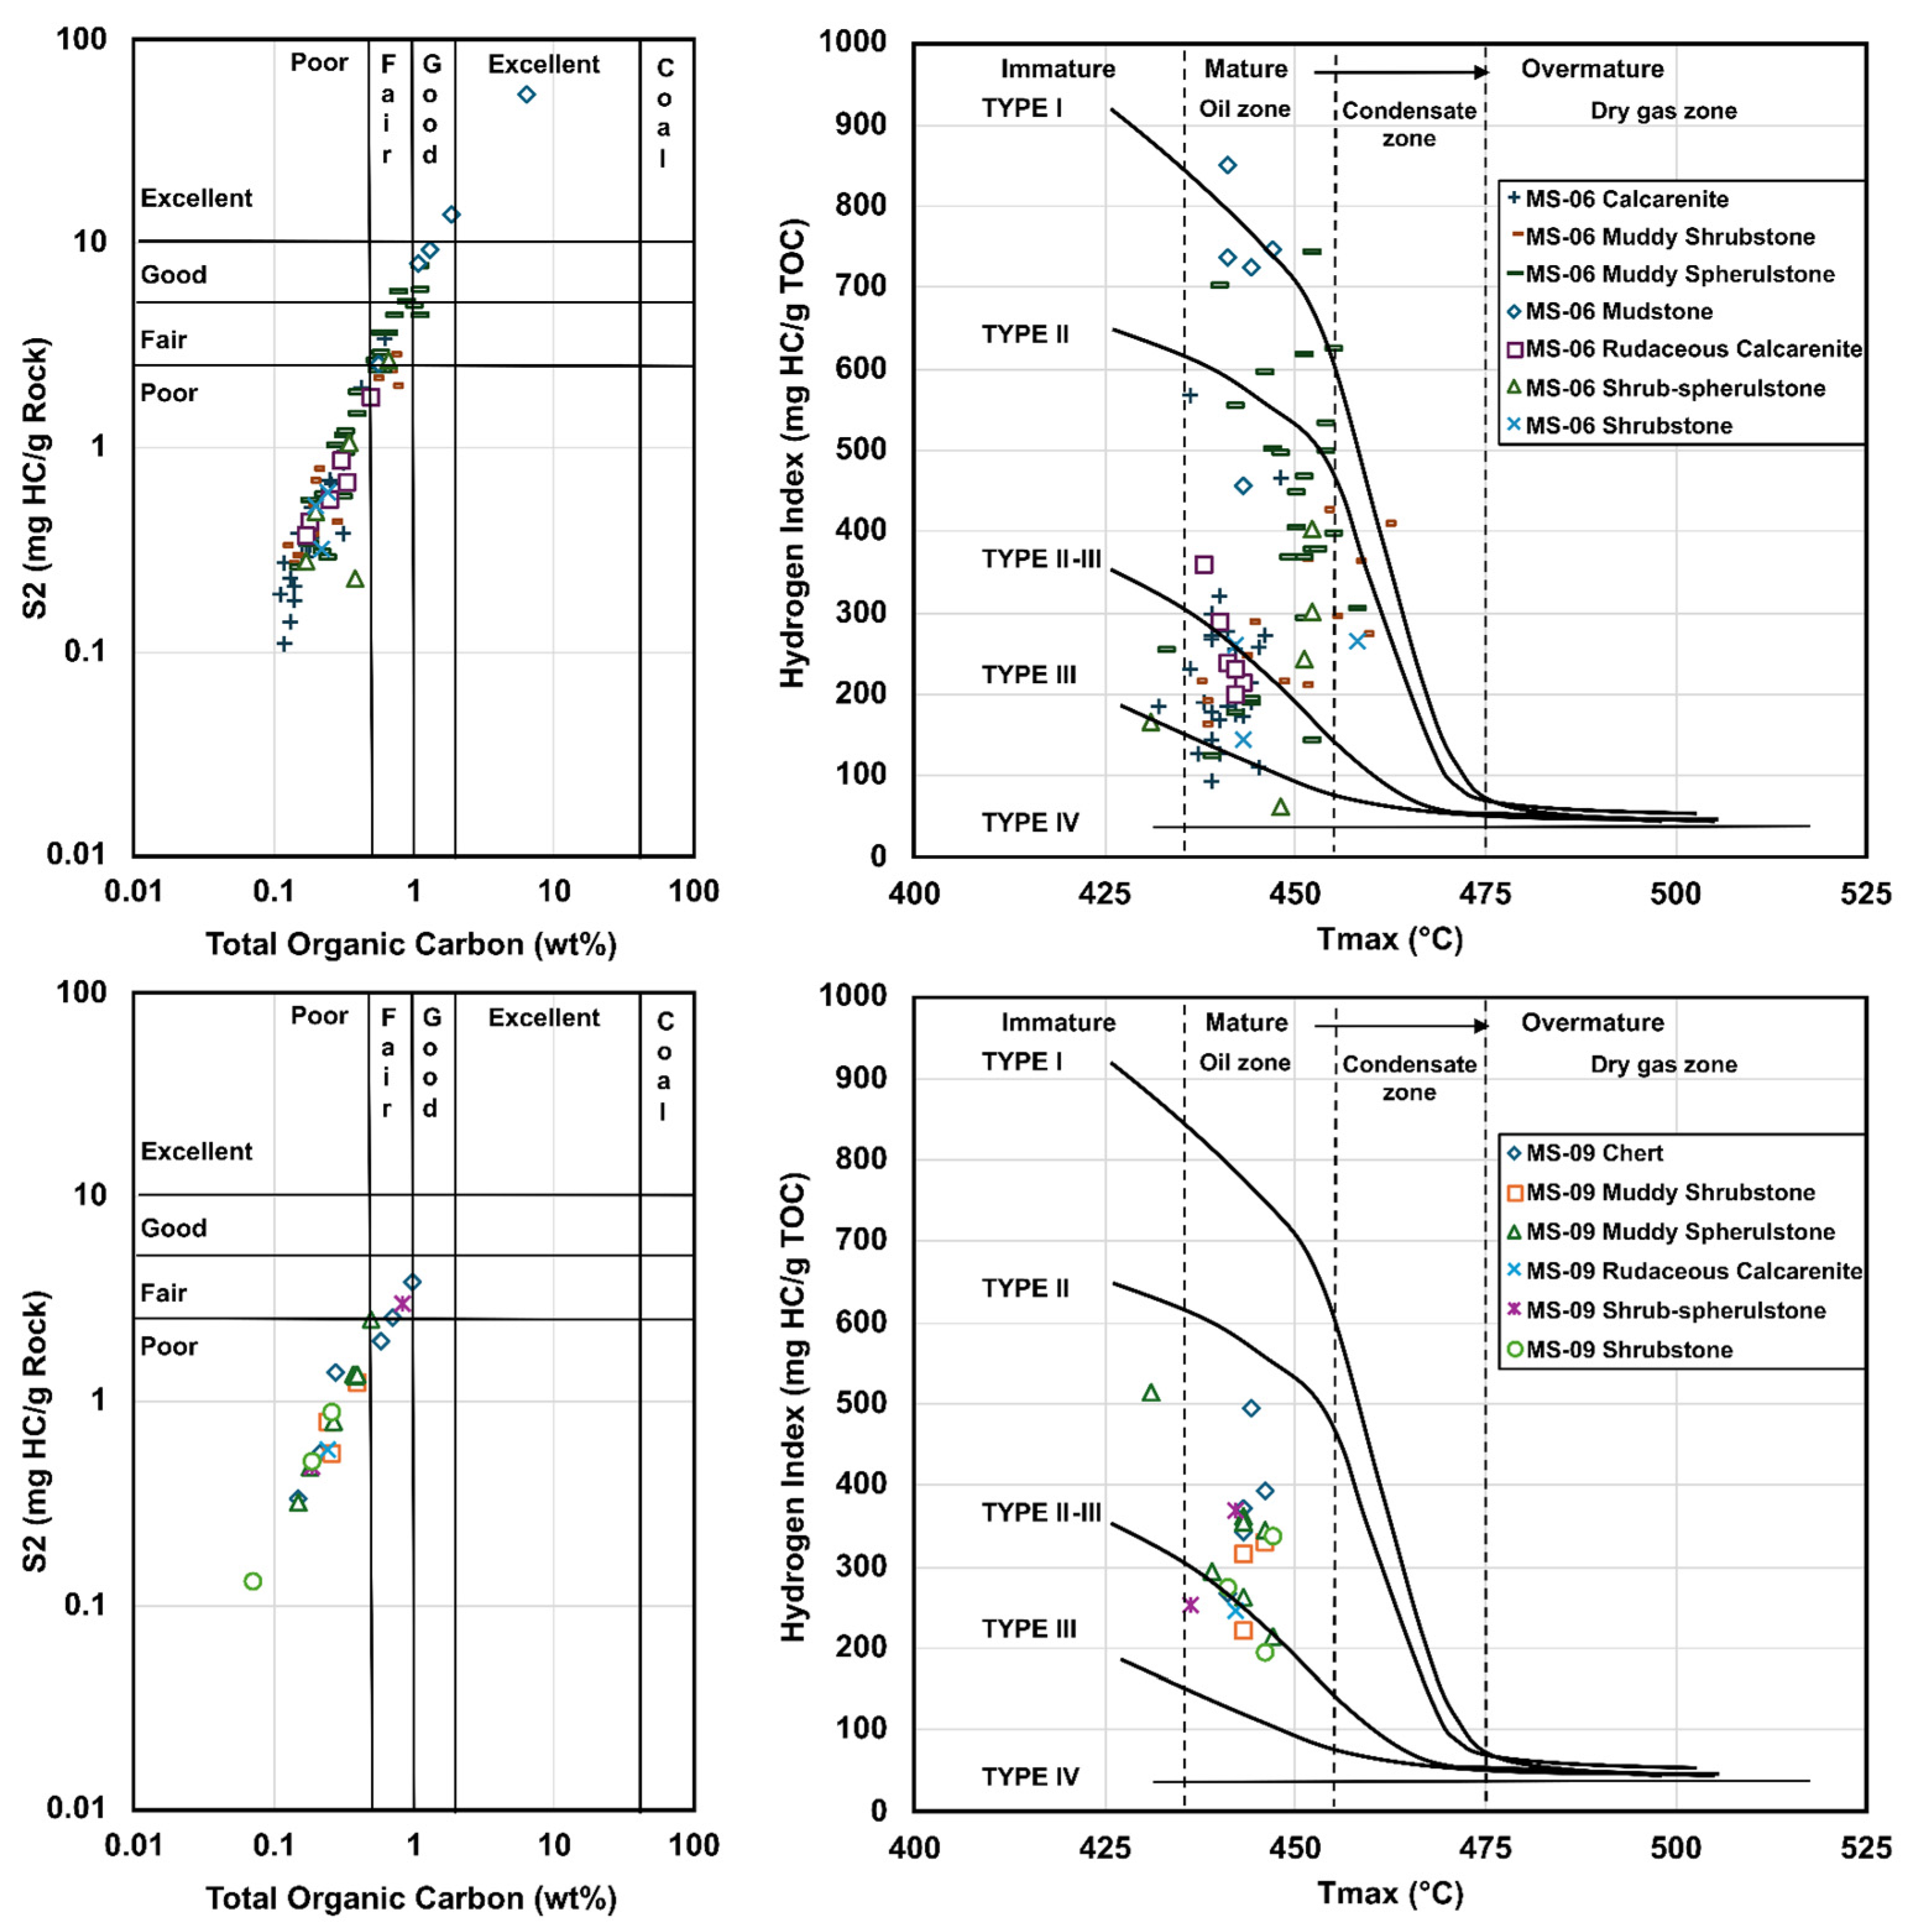
3.2. Rock-Eval
3.3. Fluid Inclusions
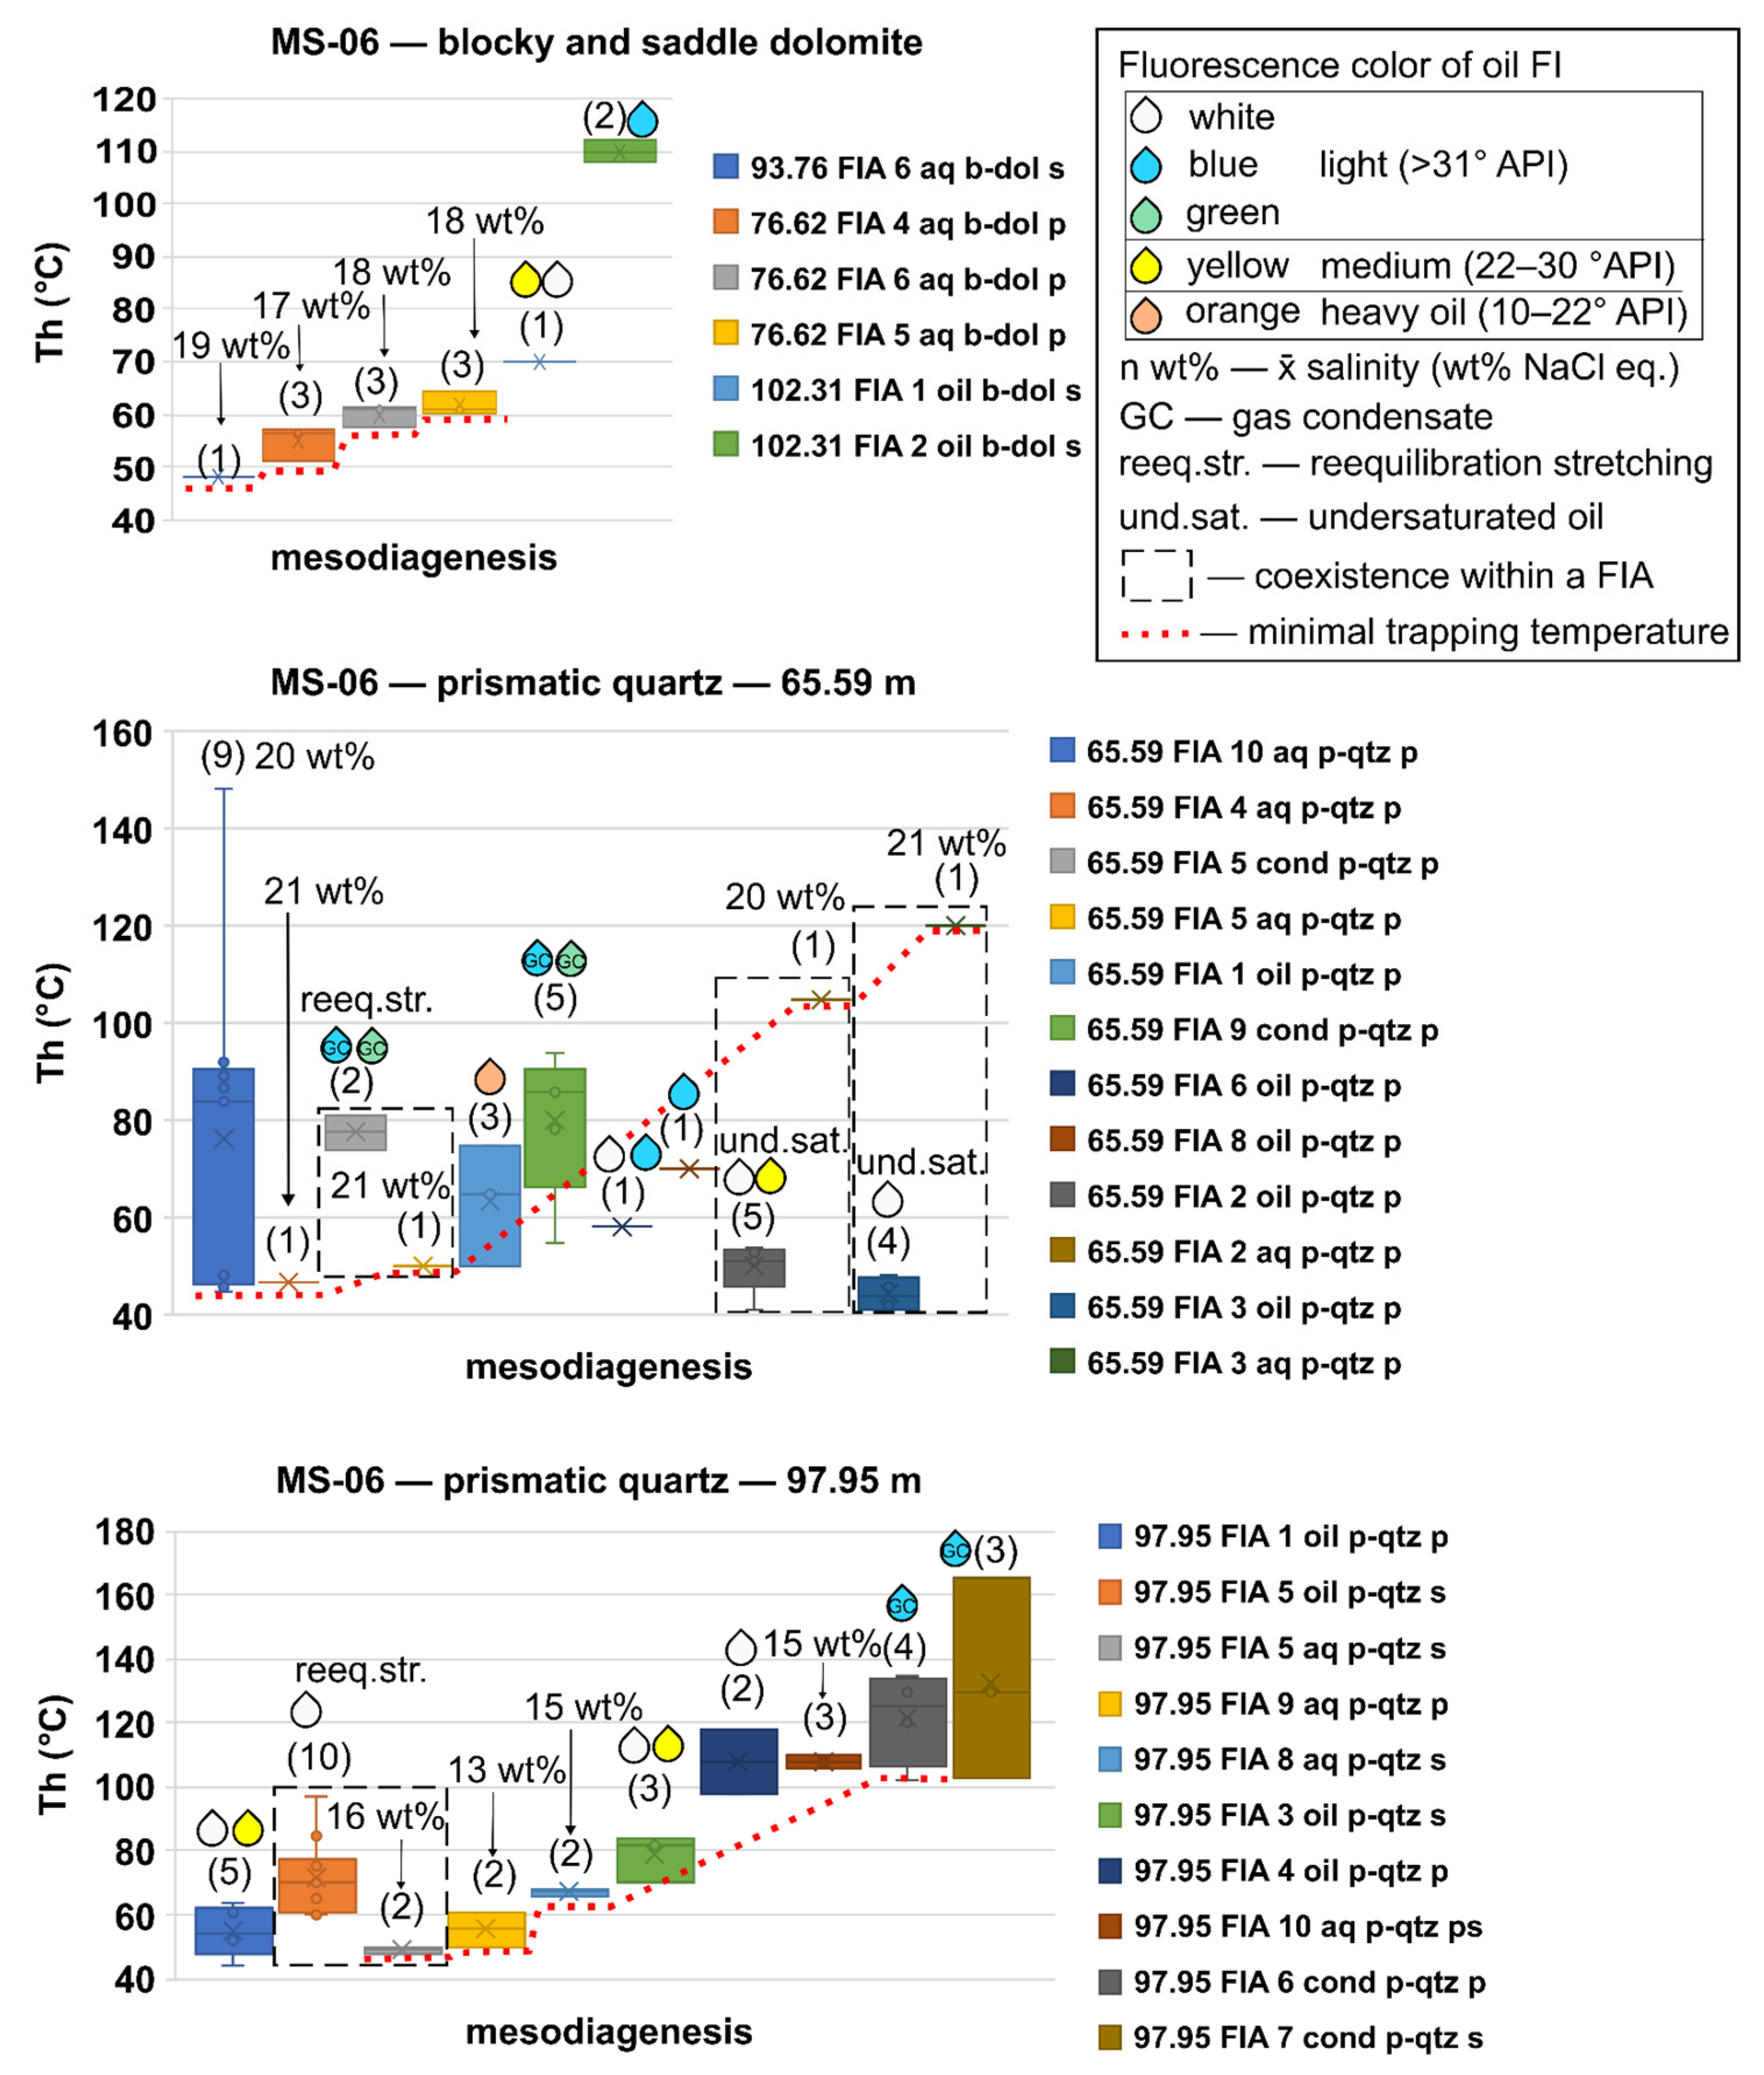
3.3.1. Well MS-06
3.3.2. Well MS-09
4. Discussion
4.1. Organic Potential and Content
4.2. Fluid Event Implications
4.3. Fluid Percolation History and Organic Maturation
5. Conclusions
Supplementary Materials
Author Contributions
Funding
Data Availability Statement
Acknowledgments
Conflicts of Interest
References
- Alabere, A.O.; Soufiane, M.; Alsuwaidi, M. Pore to Core Plug Scale Characterization of Porosity and Permeability Heterogeneities in a Cretaceous Carbonate Reservoir Using Laboratory Measurements and Digital Rock Physics, Abu Dhabi, United Arab Emirates. Mar. Pet. Geol. 2025, 172, 107214. [Google Scholar] [CrossRef]
- Morad, S.; Al-Aasm, I.S.; Nader, F.H.; Ceriani, A.; Gasparrini, M.; Mansurbeg, H. Impact of Diagenesis on the Spatial and Temporal Distribution of Reservoir Quality in the Jurassic Arab D and C Members, Offshore Abu Dhabi Oilfield, United Arab Emirates. GeoArabia 2012, 17, 17–56. [Google Scholar] [CrossRef]
- Jamil, M.; Ullah, I.; Rahim, H.U.; Khan, I.; Abbas, W.; Rehman, M.U.; Rashid, A.; Umar, M.; Ali, A.; Siddiqui, N.A. Tracking Depositional Architecture and Diagenetic Evolution in the Jurassic Carbonates, Trans Indus Ranges, NW Himalayas. Minerals 2024, 14, 1170. [Google Scholar] [CrossRef]
- Ehrenberg, S.N.; Morad, S.; Yaxin, L.I.U.; Chen, R. Stylolites and Porosity In A Lower Cretaceous Limestone Reservoir; Onshore: Abu Dhabi, United Arab Emirates, 2016; pp. 1228–1247. [Google Scholar]
- Formigli, J. Pre-Salt Reservoirs Offshore Brazil: Perspectives and Challenges. In Proceedings of the Energy Conference (2007), Petrobras, Houston, TX, USA, 30 April 2007. [Google Scholar]
- Carminatti, M.; Wolff, B.; Gamboa, L. New Exploratory Frontiers in Brazil. In Proceedings of the 19th World Petroleum Congress, Madrid, Spain, 29 June–3 July 2008; WPC-19-2802. p. 19. [Google Scholar]
- Saller, A.; Rushton, S.; Buambua, L.; Inman, K.; McNeil, R.; Dickson, J.A.D.T. Presalt Stratigraphy and Depositional Systems in the Kwanza Basin, Offshore Angola. Am. Assoc. Pet. Geol. Bull 2016, 100, 1135–1164. [Google Scholar] [CrossRef]
- Alvarenga, R.S.; Iacopini, D.; Kuchle, J.; Scherer, C.M.S.; Goldberg, K. Seismic Characteristics and Distribution of Hydrothermal Vent Complexes in the Cretaceous Offshore Rift Section of the Campos Basin, Offshore Brazil. Mar. Pet. Geol. 2016, 74, 12–25. [Google Scholar] [CrossRef]
- Herlinger, R.; Zambonato, E.E.; De Ros, L.F. Influence of Diagenesis on the Quality of Lower Cretaceous Pre-Salt Lacustrine Carbonate Reservoirs from Northern Campos Basin, Offshore Brazil. J. Sediment. Res. 2017, 87, 1285–1313. [Google Scholar] [CrossRef]
- De Luca, P.H.V.; Matias, H.; Carballo, J.; Sineva, D.; Pimentel, G.A.; Tritlla, J.; Esteban, M.; Loma, R.; Alonso, J.L.A.; Jiménez, R.P.; et al. Breaking Barriers and Paradigms in Presalt Exploration: The Pão de Açúcar Discovery (Offshore Brazil). AAPG Memoir 2017, 113, 177–193. [Google Scholar] [CrossRef]
- Lima, B.E.M.; Tedeschi, L.R.; Pestilho, A.L.S.; Santos, R.V.; Vazquez, J.C.; Guzzo, J.V.P.; De Ros, L.F. Deep-Burial Hydrothermal Alteration of the Pre-Salt Carbonate Reservoirs from Northern Campos Basin, Offshore Brazil: Evidence from Petrography, Fluid Inclusions, Sr, C and O Isotopes. Mar. Pet. Geol. 2020, 113, 104143. [Google Scholar] [CrossRef]
- Lima, B.E.M.; De Ros, L.F. Deposition, Diagenetic and Hydrothermal Processes in the Aptian Pre-Salt Lacustrine Carbonate Reservoirs of the Northern Campos Basin, Offshore Brazil. Sediment Geol. 2019, 383, 55–81. [Google Scholar] [CrossRef]
- Strugale, M.; Lima, B.E.M.; Day, C.; Omma, J.; Rushton, J.; Olivito, J.P.R.; Bouch, J.; Robb, L.; Roberts, N.; Cartwright, J. Diagenetic Products, Settings and Evolution of the Presalt Succession in the Northern Campos Basin, Brazil; Special Publications: London, UK, 2024; Volume 548, ISBN 0000000159. [Google Scholar]
- Pietzsch, R.; Oliveira, D.M.; Tedeschi, L.R.; Queiroz Neto, J.V.; Figueiredo, M.F.; Vazquez, J.C.; de Souza, R.S. Palaeohydrology of the Lower Cretaceous Pre-Salt Lacustrine System, from Rift to Post-Rift Phase, Santos Basin, Brazil. Palaeogeogr. Palaeoclimatol. Palaeoecol. 2018, 507, 60–80. [Google Scholar] [CrossRef]
- De Ros, L.F. Syngenetic, Diagenetic and Hydrothermal Processes in the Pre-Salt Sag Section of Santos and Campos Basins. In Proceedings of the 2nd EAGE Conference on Pre-Salt Reservoir, Online, 8–10 September 2021. [Google Scholar] [CrossRef]
- Farias, F.; Szatmari, P.; Bahniuk, A.; França, A.B. Evaporitic Carbonates in the Pre Salt of Santos Basin: Genesis and Tectonic Implications—A Reply. Mar. Pet. Geol. 2021, 133, 10–12. [Google Scholar] [CrossRef]
- Pietzsch, R. Comment on Evaporitic Carbonates in the Pre-Salt of Santos Basin—Genesis and Tectonic Implications. Mar. Pet. Geol. 2021, 133, 104963. [Google Scholar] [CrossRef]
- Guzzo, J.V.P.; Rocha, Y.S.; Menezes, T.R.; Pestilho, A.L.S.; Binotto, R.; Matos, T.F.; Parizek Silva, M.Y.; Tonietto, S.N.; Silva Filho, R.P.; Carvalho, B.R.B.M. Hydrothermal Petroleums and Solid Reservoir Bitumens: Recognition of an Atypical Petroleum System in the Brazilian Pre-Salt Deposits (Santos Basin). In Proceedings of the XV Latin American Congress on Organic Geochemistry, Salvador, Brazil, 4–7 November 2018; p. 4. [Google Scholar]
- Farias, F.; Szatmari, P.; Bahniuk, A.; França, A.B. Evaporitic Carbonates in the Pre-Salt of Santos Basin—Genesis and Tectonic Implications. Mar. Pet. Geol. 2019, 105, 251–272. [Google Scholar] [CrossRef]
- Renaut, R.W.; Jones, B. Hydrothermal Environments, Terrestrial. In Encyclopedia of Geobiology; Springer: Berlin/Heidelberg, Germany, 2011; ISBN 1402092113. [Google Scholar]
- Carvalho, A.M.A.; Collard, N.; Hamon, Y.; Meiller, C. Assessing the Role of Local versus Regional Fluid Circulation in the Pre-Salt Sag Section of Santos Basin (Brazil): Insights from Reactive Transport Modeling. Mar. Pet. Geol. 2024, 162, 106711. [Google Scholar] [CrossRef]
- Su, A.; Chen, H.; Zhao, J.X.; Feng, Y. xing Integrated Fluid Inclusion Analysis and Petrography Constraints on the Petroleum System Evolution of the Central and Southern Biyang Sag, Nanxiang Basin, Eastern China. Mar. Pet. Geol. 2020, 118, 104437. [Google Scholar] [CrossRef]
- Reed, M.H. Hydrothermal Alteration and Its Relationship to Ore Fluid Composition. In Geochemistry of Hydrothermal Ore Deposits; John Wiley Publications: New York, NY, USA, 1997; pp. 303–366. [Google Scholar]
- Henley, R.W.; Ellis, A.J. Geothermal Systems Ancient and Modern: A Geochemical Review. Earth Sci. Rev. 1983, 19, 1–50. [Google Scholar] [CrossRef]
- Yuan, F.; Tian, J.; Hao, F.; Liu, Z.; Zhang, K.; Wang, X. Fault Characterization and Its Significance on Hydrocarbon Migration and Accumulation of Western Tazhong Uplift, Tarim Basin: Insight from Seismic, Geochemistry, Fluid Inclusion and in Situ U-Pb Dating. Mar. Pet. Geol. 2024, 170, 107137. [Google Scholar] [CrossRef]
- Yang, P.; Ren, Z.; Nuriel, P.; Nguyen, A.D.; Feng, Y.X.; Zhou, R.; Zhao, J.X. Cenozoic Faulting Leading to Petroleum Escape in SW Ordos Basin, China: Evidence from Fault-Related Calcite in Situ U-Pb Dating, Rare Earth Elements and Fluid Inclusions. Mar. Pet. Geol. 2024, 170, 107071. [Google Scholar] [CrossRef]
- Davies, G.R.; Packard, J.; McAuley, R. Hydrothermal (Thermobaric) Dolomitization: Rock Fabric and Organic Petrology Support for Emplacement under Conditions of Thermal Transients, Shear Stress, High Pore Fluid Pressure with Abrupt Pressure Transients, Hydro Fracturing, Episodic Rapid Fluid Flo. In Proceedings of the Dolomite Seminar and Core Conference, Canadian Society of Petroleum Geologists, Calgary, AL, Canada, 13–15 January 2004; p. 20. [Google Scholar]
- Simoneit, B.R.T. Hydrothermal Alteration of Organic Matter in Marine and Terrestrial Systems. In Organic Geochemistry: Principles and Applications; Engel, M.H., Macko, S.A., Eds.; Springer Science & Business Media: Berlin/Heidelberg, Germany, 1993; pp. 397–418. [Google Scholar]
- Neilson, J.E.; Oxtoby, N.H. The Relationship between Petroleum, Exotic Cements and Reservoir Quality in Carbonates—A Review. Mar. Pet. Geol. 2008, 25, 778–790. [Google Scholar] [CrossRef]
- Davies, G.R.; Smith, L.B. Structurally Controlled Hydrothermal Dolomite Reservoir Facies: An Overview. Am. Assoc. Pet. Geol. Bull. 2006, 90, 1641–1690. [Google Scholar] [CrossRef]
- Li, K.; Gong, B.; Zhang, X.; Jiang, H.; Fan, J.; Tan, Y. A Comparison of Hydrothermal Events and Petroleum Migration between Ediacaran and Lower Cambrian Carbonates, Central Sichuan Basin. Mar. Pet. Geol. 2023, 150, 106130. [Google Scholar] [CrossRef]
- Moreira, J.L.P.; Madeira, C.V.; Gil, J.A.; Machado, M.A.P. Bacia de Santos. Bol. Geocienc. Petrobras 2007, 15, 531–549. [Google Scholar]
- De Freitas, V.A.; Travassos, R.M.; Cardoso, M.B. Bacia de Santos: Sumário Geológico e Setores em Oferta; Superintendência de Definição de Blocos; ANP: Rio de Janeiro, Brazil, 2019. [Google Scholar]
- Fetter, M.; Penteado, H.; Madrucci, V.; Spadini, A. The Paleogeography of the Lacustrine Rift System of the Pre-Salt in Santos Basin, Offshore Brazil. In Proceedings of the AAPG 2018 Annual Convention & Exhibition, Salt Lake City, UT, USA, 20–23 May 2018; Search and Discovery Article #11137. p. 11137. [Google Scholar] [CrossRef]
- Agência Nacional do Petróleo, Gás Natural e Biocombustíveis. Biocombustíveis. GeoMaps ANP © 2025. Available online: https://geomaps.anp.gov.br/ (accessed on 13 April 2025).
- Wright, V.P.; Barnett, A.J. The Textural Evolution and Ghost Matrices of the Cretaceous Barra Velha Formation Carbonates from the Santos Basin, Offshore Brazil. Facies 2020, 66, 7. [Google Scholar] [CrossRef]
- Milani, E.J.; Rangel, H.D.; Bueno, G.V.; Stica, J.M.; Winter, W.R.; Caixeta, J.M.; Neto, O.C.P. Bacias Sedimentares Brasileiras: Cartas Estratigráficas. Bol. Geocienc. Petrobras 2007, 15, 183–205. [Google Scholar]
- Gamboa, L.A.P.; Machado, M.A.P.; Da Silveira, D.P.; De Freitas, J.T.R.; Da Silva, S.R.P.; Mohriak, W.; Szatmari, P.; Anjos, S. Evaporitos Estratificados No Atlântico Sul: Interpretação Sísmica e Controle Tectono-Estratigráfico Na Bacia de Santos. In Sal: Geologia E Tectônica Exempo Nas Bacias Brasileiras; Beca: São Paulo, Brasil, 2008; pp. 340–359. [Google Scholar]
- Terra, G.J.S.; Spadini, A.R.; Franca, A.B.; Sombra, C. Carbonate Rock Classification Applied to Brazilian Sedimentary Basins. Bol. Geocienc. Petrobras 2010, 18, 9–29. [Google Scholar]
- Wright, V.P.; Barnett, A.J. An Abiotic Model for the Development of Textures in Some South Atlantic Early Cretaceous Lacustrine Carbonates. Geol. Soc. Spec. Publ 2015, 418, 209–219. [Google Scholar] [CrossRef]
- Mohriak, W.U. Bacias Sedimentares Da Margem Continental Brasileira. Geol. Tectônica E Recur. Minerais Brasil 2003, 3, 87–165. [Google Scholar]
- Gordon, A.C.; Mohriak, W.U.; Stanton, N.; Santos, A.C. Magmatic Cycles in Santos Basin (S.E. Brazil): Tectonic Control in the Temporal-Spatial Distribution and Geophysical Signature. J. South Am. Earth Sci. 2023, 121, 104111. [Google Scholar] [CrossRef]
- Gordon, A.C.; Santos, A.C.; Caitano, G.R.; Stanton, N.; Mohriak, W.U. Magmatic Cycles in Santos Basin (S.E. Brazil): Geochemical Characterization and Magmatic Sources. J. S. Am. Earth Sci. 2023, 126, 104323. [Google Scholar] [CrossRef]
- Brito, J.P.S.; Santos, R.V.; Gonçalves, G.O.; Barbosa, P.F.; Souza Cruz, C.E.; Ushirobira, C.A.; Souza, V.S.; Richter, F.; Abreu, C.J. U-Pb Dating of Barra Velha Carbonates Reveals the Influence of Santos Basin Sedimentary and Tectonothermal History on Pre-Salt Carbonate Ages. Mar. Pet. Geol. 2024, 168, 107035. [Google Scholar] [CrossRef]
- Flügel, E. Microfacies Analysis of Limestones; Springer Science & Business Media: Berlin/Heidelberg, Germany, 2012; ISBN 3642684238. [Google Scholar]
- De Ros, L.F.; Goldberg, K.; Abel, M.; Victorinetti, F.; Mastella, L.; Castro, E. Advanced Acquisition and Management of Petrographic Information from Reservoir Rocks Using the Petroledge® System. In Proceedings of the AAPG Annual Conference and Exhibition, AAPG Search and Discover Article #90063©2007 Extended Abstracts, Long Beach, CA, USA, 1–4 April 2007; Volume 6. [Google Scholar]
- Dickson, J.A.D. A Modified Staining Technique for Carbonates in Thin Section. Nature 1965, 205, 587. [Google Scholar] [CrossRef]
- De Ros, L.F.; Oliveira, D.M. An Operational Classification System for the South Atlantic Pre-Salt Rocks. J. Sediment. Res. 2023, 93, 693–704. [Google Scholar] [CrossRef]
- Morad, S.; Ketzer, J.M.; De Ros, L.R. Spatial and Temporal Distribution of Diagenetic Alterations in Siliciclastic Rocks: Implications for Mass Transfer in Sedimentary Basins. Sedimentology 2000, 47, 95–120. [Google Scholar] [CrossRef]
- Morad, S.; Ketzer, J.M.; De Ros, L.F. Linking Diagenesis to Sequence Stratigraphy: An Integrated Toolfor Understanding and Predicting Reservoir Quality Distribution; Wiley: Hoboken, NJ, USA, 2013; ISBN 9781118485347. [Google Scholar]
- Behar, F.; Beaumont, V.; Penteado, H.L.B. Rock-Eval 6 Technology: Performances and Developments. Oil Gas Sci. Technol. 2001, 56, 111–134. [Google Scholar] [CrossRef]
- Peters, K.E. Guidelines for Evaluating Petroleum Source Rock Using Programmed Pyrolysis. Am. Assoc. Pet. Geol. Bull. 1986, 70, 318–329. [Google Scholar] [CrossRef]
- Benoit, Y.; Dalmazzone, C.; Audibert-Hayet, A. Pollut-Eval: An Innovative Tool for Direct Hydrocarbon Characterization in Oil Base Mud & Cuttings. In Proceedings of the SPE Annual Technical Conference and Exhibition, San Antonio, TX, USA, 29 September 2002; pp. 1223–1234. [Google Scholar] [CrossRef]
- Hartkopf-Fröder, C.; Königshof, P.; Littke, R.; Schwarzbauer, J. Optical Thermal Maturity Parameters and Organic Geochemical Alteration at Low Grade Diagenesis to Anchimetamorphism: A Review. Int. J. Coal. Geol. 2015, 150–151, 74–119. [Google Scholar] [CrossRef]
- IFP Energies Nouvelles; Vinci Technologies IFPEN-160000 Reference Values Rock-Eval 7. Available online: https://www.ifpenergiesnouvelles.fr/sites/ifpen.fr/files/inline-images/Innovation%20et%20industrie/Bassin/VA-IFPEN-160000-Reference-values-Rock-Eval-7-Sulfur.pdf (accessed on 13 April 2025).
- Roedder, E. Volume 12: Fluid Inclusions. Rev. Mineral. 1984, 12, 644. [Google Scholar]
- Stasiuk, L.D.; Snowdon, L.R. Fluorescence Micro-Spectrometry of Synthetic and Natural Hydrocarbon Fluid Inclusions: Crude Oil Chemistry, Density and Application to Petroleum Migration. Appl. Geochem. 1997, 12, 229–241. [Google Scholar] [CrossRef]
- Goldstein, R.H.; Reynolds, T.J. Systematics of Fluid Inclusions in Diagenetic Minerals; SPEM Short; SEPM—Society for Sedimentary Geology: Tulsa, OK, USA, 1994; Volume 126, ISBN 1565760085. [Google Scholar]
- Fall, A.; Bodnar, R.J. How Precisely Can the Temperature of a Fluid Event Be Constrained Using Fluid Inclusions? Econ. Geol. 2018, 113, 1817–1843. [Google Scholar] [CrossRef]
- Thiéry, R.; Pironon, J.; Walgenwitz, F.; Montel, F. PIT (Petroleum Inclusion Thermodynamic): A New Modeling Tool for the Characterization of Hydrocarbon Fluid Inclusions from Volumetric and Microthermometric Measurements. J. Geochem. Explor. 2000, 69–70, 701–704. [Google Scholar] [CrossRef]
- Schrank, A.B.S.; Dos Santos, T.; Altenhofen, S.D.; Freitas, W.; Cembrani, E.; Haubert, T.; Dalla Vecchia, F.; Barili, R.; Rodrigues, A.G.; Maraschin, A.; et al. Interactions between Clays and Carbonates in the Aptian Pre-Salt Reservoirs of Santos Basin, Eastern Brazilian Margin. Minerals 2024, 14, 35. [Google Scholar] [CrossRef]
- Langford, F.F.; Blanc-Valleron, M.M. Interpreting Rock-Eval Pyrolysis Data Using Graphs of Pyrolizable Hydrocarbons vs Total Organic Carbon. AAPG Bull. 1990, 74, 799–804. [Google Scholar]
- Hunt, J.M. Petroleum Geochemistry and Geology, 2nd ed.; W. H. Freeman: New York, NY, USA, 1995; ISBN 0716724413. [Google Scholar]
- Altenhofen, S.D.; Rodrigues, A.G.; Borghi, L.; De Ros, L.F. Dynamic Re-Sedimentation of Lacustrine Carbonates in the Búzios Field, Pre-Salt Section of Santos Basin, Brazil. J. South Am. Earth Sci. 2024, 138, 104863. [Google Scholar] [CrossRef]
- Tyson, R.V. Sedimentary Organic Matter: Organic Facies and Palynofacies; Springer Science & Business Media: Berlin/Heidelberg, Germany, 1995; ISBN 9401107394. [Google Scholar]
- Mello, M.R.; Rostirolla, S.P.; Elias, V.; Ferreira, M.; Ahualli, A.P.; Becker, S.; Dahl, J.E.; Moldowan, J.M. Chapter 2: Lacustrine Source Rocks and Oil Systems Present in the Lower Cretaceous Pre-Salt Section of the Santos Basin, Brazil. In Memoir 124: The Supergiant Lower Cretaceous Pre-Salt Petroleum Systems of the Santos Basin, Brazil; AAPG: Tulsa, OK, USA, 2021; pp. 35–76. [Google Scholar]
- Lenz, R.; Schmidt, J.; Maraschin, A.; Barili, R.; Dalla Vecchia, F.; Silva, T. Paleoenvironmental Implications on the Deposition of Organic Matter-Rich Rocks from the Barra Velha Formation (Santos Basin, Brazil). In Proceedings of the IMOG 2023, Montpellier, France, 10 September 2023; European Association of Geoscientists & Engineers: Utrecht, The Netherlands, 2023; pp. 1–2. [Google Scholar] [CrossRef]
- Lenz, R.; Schmidt, J.; Silva, T.; Dos Santos, T.; Cembrani, E.; Altenhofen, S.; Schrank, A.; Freitas, W.; Maraschin, A.; Barili, R.; et al. Geochemical Characterization of the Pre-Salt Barra Velha—Barra Velha (.) Petroleum System (Santos Basin, Brazil). In Proceedings of the IMOG 2023, Montpellier, France, 10 September 2023; European Association of Geoscientists & Engineers: Utrecht, The Netherlands, 2023; pp. 1–2. [Google Scholar] [CrossRef]
- Goldstein, R.H. Fluid Inclusions in Sedimentary and Diagenetic Systems. Lithos 2001, 55, 159–193. [Google Scholar] [CrossRef]
- Chi, G.; Diamond, L.W.; Lu, H.; Lai, J.; Chu, H. Common Problems and Pitfalls in Fluid Inclusion Study: A Review and Discussion. Minerals 2021, 11, 7. [Google Scholar] [CrossRef]
- Munz, I.A. Petroleum Inclusions in Sedimentary Basins: Systematics, Analytical Methods and Applications. Lithos 2001, 55, 195–212. [Google Scholar] [CrossRef]
- Zhang, D.; Audétat, A. A Plea for More Skepticism Toward Fluid Inclusions: Part I. Postentrapment Changes in Fluid Density and Fluid Salinity Are Very Common. Econ. Geol. 2023, 118, 15–41. [Google Scholar] [CrossRef]
- Sharma, R.; Srivastava, P.K. Hydrothermal Fluids of Magmatic Origin. In Modelling of Magmatic and Allied Processes; Kumar, S., Singh, R.N., Eds.; Springer International Publishing: Cham, Switzerland, 2014; pp. 181–208. ISBN 978-3-319-06471-0. [Google Scholar]
- Loma, R.; Tritlla, J.; Esteban, M.; Sanders, C.; Carrasco, A.; Herra, A.; Gerona, M.; Mañas, M.; Boix, C. Hydrothermal Flushing and Calcite Precipitation as Main Modifiers of a Pre-Salt Reservoir in Kwanza Basin (Angola). In Proceedings of the AAPG ACE 2018 Abstracts, Salt Lake City, UT, USA, 23–25 July 2018. [Google Scholar]
- Lawson, M.; Sitgreaves, J.; Rasbury, T.; Wooton, K.; Esch, W.; Marcon, V.; Henares, S.; Konstantinou, A.; Kneller, E.; Gombosi, D.; et al. New Age and Lake Chemistry Constraints on the Aptian Pre-Salt Carbonates of the Central South Atlantic. Bull. Geol. Soc. Am. 2023, 135, 595–607. [Google Scholar] [CrossRef]
- Diamond, L.W. Review of the Systematics of CO2-H2O Fluid Inclusions. Lithos 2001, 55, 69–99. [Google Scholar] [CrossRef]
- Weatherley, D.K.; Henley, R.W. Flash Vaporization during Earthquakes Evidenced by Gold Deposits. Nat. Geosci. 2013, 6, 294–298. [Google Scholar] [CrossRef]
- Bodnar, R.; Reynolds, T.J.; Kuehn, C.A. Fluid Inclusion Systematics in Epithermal Systems, in Berger, B.R., and Bethke, P.M., Eds., Geology and Geochemistry of Epithermal Systems. Rev. Econ. Geol. 1985, 2, 73–97. [Google Scholar]
- Moncada, D.; Mutchler, S.; Nieto, A.; Reynolds, T.J.; Rimstidt, J.D.; Bodnar, R.J. Mineral Textures and Fluid Inclusion Petrography of the Epithermal Ag-Au Deposits at Guanajuato, Mexico: Application to Exploration. J. Geochem. Explor. 2012, 114, 20–35. [Google Scholar] [CrossRef]
- Lohr, C.D.; Hackley, P.C. Relating Tmax and Hydrogen Index to Vitrinite and Solid Bitumen Reflectance in Hydrous Pyrolysis Residues: Comparisons to Natural Thermal Indices. Int. J. Coal. Geol. 2021, 242, 103768. [Google Scholar] [CrossRef]
- Schmidt, J.S.; Menezes, T.R.; Souza, I.V.A.F.; Spigolon, A.L.D.; Pestilho, A.L.S.; Coutinho, L.F.C. Comments on Empirical Conversion of Solid Bitumen Reflectance for Thermal Maturity Evaluation. Int. J. Coal. Geol. 2019, 201, 44–50. [Google Scholar] [CrossRef]
- Jarvie, D.M.; Claxton, B.L.; Henk, F.; Breyer, J.T. Oil and Shale Gas from the Barnett Shale, Fort Worth Basin, Texas. Available online: http://www.searchanddiscovery.com/abstracts/html/2001/annual/abstracts/0386.htm (accessed on 13 April 2022).
- Barker, C.E.; Pawlewicz, M.J. Calculation of Vitrinite Reflectance from Thermal Histories and Peak Temperatures: A Comparison of Methods; ACS Publications: New York, NY, USA, 1994; ISBN 1947-5918. [Google Scholar]
- Zuo, G.; Wang, H.; Lan, L.; Zhang, Y.; Zuo, Y.; Yang, L.; Wang, C.; Pang, X.; Song, X.; Yang, M. Present Geothermal Field of the Santos Basin, Brazil. Sci. Rep. 2023, 13, 12369. [Google Scholar] [CrossRef]
- Ventura, G.T.; Simoneit, B.R.T.; Nelson, R.K.; Reddy, C.M. The Composition, Origin and Fate of Complex Mixtures in the Maltene Fractions of Hydrothermal Petroleum Assessed by Comprehensive Two-Dimensional Gas Chromatography. Org. Geochem. 2012, 45, 48–65. [Google Scholar] [CrossRef]
- Parnell, J.; Chen, H. Application of Fluid Inclusion Studies to Understanding Oil Charge, Pre-Salt Succession, Offshore Angola. Geol. Soc. Spec. Publ. 2003, 207, 275–283. [Google Scholar] [CrossRef]
- Carlotto, M.A.; da Silva, R.C.B.; Yamato, A.A.; Trindade, W.L.; Moreira, J.L.P.; Fernandes, R.A.R.; Ribeiro, O.J.S.; Gouveia, W.P., Jr.; Carminati, J.P.; Qicai, D.; et al. Chapter 10: Libra: A Newborn Giant in the Brazilian Presalt Province; AAPG Memoir 113: Giant Fields of the Decade 2000–2010 ISBN Electronic: 9781629812762; AAPG American Association of Petroleum Geologists: Tulsa, OK, USA, 2017; Volume 113, pp. 165–176. [Google Scholar] [CrossRef]
- De Freitas, V.A.; dos Vital, J.C.S.; Rodrigues, B.R.; Rodrigues, R. Source Rock Potential, Main Depocenters, and CO2 Occurrence in the Pre-Salt Section of Santos Basin, Southeast Brazil. J. S. Am. Earth Sci. 2022, 115, 103760. [Google Scholar] [CrossRef]
- Carvalho, A.M.A.; Hamon, Y.; De Souza, O.G., Jr.; Carramal, N.G.; Collard, N. Facies and Diagenesis Distribution in an Aptian Pre-Salt Carbonate Reservoir of the Santos Basin, Offshore Brazil: A Comprehensive Quantitative Approach. Mar. Pet. Geol. 2022, 141, 105708. [Google Scholar] [CrossRef]


| Well | MS-06 | MS-09 | Total |
|---|---|---|---|
| Core samples | 2 | - | 2 |
| Sidewall samples | - | 120 | 120 |
| Samples interval length (m) | 48.08 | 341.22 | 389.3 |
| Thin sections | 267 | 120 | 387 |
| Rock-Eval pyrolysis samples | 85 | 22 | 107 |
| Doubly polished thick sections | 5 | 8 | 13 |
| Microthermometry measurements | 149 | 279 | 428 |
| Lithological Classes | n | S2 (mg HC/g Rock) | Tmax (°C) | HI (mg HC/g TOC) | OI (mg CO2/g TOC) | TOC (wt%) |
|---|---|---|---|---|---|---|
| Mudstone | 5 | 2.57–54.3 | 441–447 | 454–849 | 19–82 | 0.57–6.39 |
| Muddy spherulstone | 33 | 0.26–7.82 | 431–458 | 123–743 | 9–316 | 0.15–1.12 |
| Muddy shrubstone | 17 | 0.26–2.9 | 437–462 | 161–427 | 41–249 | 0.12–0.74 |
| Shrub-spherulstone | 7 | 0.23–3.03 | 431–452 | 60–401 | 33–226 | 0.17–0.82 |
| Shrubstone | 6 | 0.13–0.88 | 441–458 | 142–337 | 48–126 | 0.07–0.26 |
| Calcarenite | 26 | 0.11–3.46 | 432–448 | 93–567 | 23–397 | 0.11–0.61 |
| Rudaceous calcarenite | 7 | 0.37–1.78 | 438–443 | 199–357 | 53–180 | 0.17–0.5 |
| Chert | 6 | 0.33–3.88 | 441–446 | 221–494 | 26–201 | 0.15–0.99 |
Disclaimer/Publisher’s Note: The statements, opinions and data contained in all publications are solely those of the individual author(s) and contributor(s) and not of MDPI and/or the editor(s). MDPI and/or the editor(s) disclaim responsibility for any injury to people or property resulting from any ideas, methods, instructions or products referred to in the content. |
© 2025 by the authors. Licensee MDPI, Basel, Switzerland. This article is an open access article distributed under the terms and conditions of the Creative Commons Attribution (CC BY) license (https://creativecommons.org/licenses/by/4.0/).
Share and Cite
Schmidt, J.; Cembrani, E.; Dos Santos, T.; Trombetta, M.; Lenz, R.; Schrank, A.; Altenhofen, S.; Rodrigues, A.; De Ros, L.; Dalla Vecchia, F.; et al. Petrography and Fluid Inclusions for Petroleum System Analysis of Pre-Salt Reservoirs in the Santos Basin, Eastern Brazilian Margin. Geosciences 2025, 15, 158. https://doi.org/10.3390/geosciences15050158
Schmidt J, Cembrani E, Dos Santos T, Trombetta M, Lenz R, Schrank A, Altenhofen S, Rodrigues A, De Ros L, Dalla Vecchia F, et al. Petrography and Fluid Inclusions for Petroleum System Analysis of Pre-Salt Reservoirs in the Santos Basin, Eastern Brazilian Margin. Geosciences. 2025; 15(5):158. https://doi.org/10.3390/geosciences15050158
Chicago/Turabian StyleSchmidt, Jaques, Elias Cembrani, Thisiane Dos Santos, Mariane Trombetta, Rafaela Lenz, Argos Schrank, Sabrina Altenhofen, Amanda Rodrigues, Luiz De Ros, Felipe Dalla Vecchia, and et al. 2025. "Petrography and Fluid Inclusions for Petroleum System Analysis of Pre-Salt Reservoirs in the Santos Basin, Eastern Brazilian Margin" Geosciences 15, no. 5: 158. https://doi.org/10.3390/geosciences15050158
APA StyleSchmidt, J., Cembrani, E., Dos Santos, T., Trombetta, M., Lenz, R., Schrank, A., Altenhofen, S., Rodrigues, A., De Ros, L., Dalla Vecchia, F., & Barili, R. (2025). Petrography and Fluid Inclusions for Petroleum System Analysis of Pre-Salt Reservoirs in the Santos Basin, Eastern Brazilian Margin. Geosciences, 15(5), 158. https://doi.org/10.3390/geosciences15050158