Abstract
Deep-water sand wave fields in the San Juan Archipelago of the Salish Sea and Pacific Northwest Washington, USA, have been found to harbor Pacific sand lance (PSL, Ammodytes personatus), a critical forage fish of the region. Little is known of the dynamics of these sand waves and the stability of the PSL sub-tidal habitats. Therefore, we have undertaken an initial investigation to determine the dynamic conditions of a well-known PSL habitat in the San Juan Channel within the Archipelago using bottom sediment sampling, an acoustical doppler current profiling (ADCP) system, and multi-beam echo sounder (MBES) bathymetry. Our study indicates that the San Juan Channel sand wave field maintained its shape and bedforms geometry throughout the years it has been studied. Based on bed phase diagrams for channelized bedforms, the sand waves appear to be in a dynamic equilibrium condition. Sea level rise may change the current regime within the Archipelago and may alter some of the deep-water or sub-tidal PSL habitats mapped there. Our findings have global significance in that these dynamic bedforms that harbor PSL and sand-eels elsewhere along the west coast of North America and in the North Sea may also be in a marginally dynamic equilibrium condition and may be prone to alteration by sea level rise, indicating an urgency in locating and investigating these habitats in order to sustain the forage fish.
1. Introduction
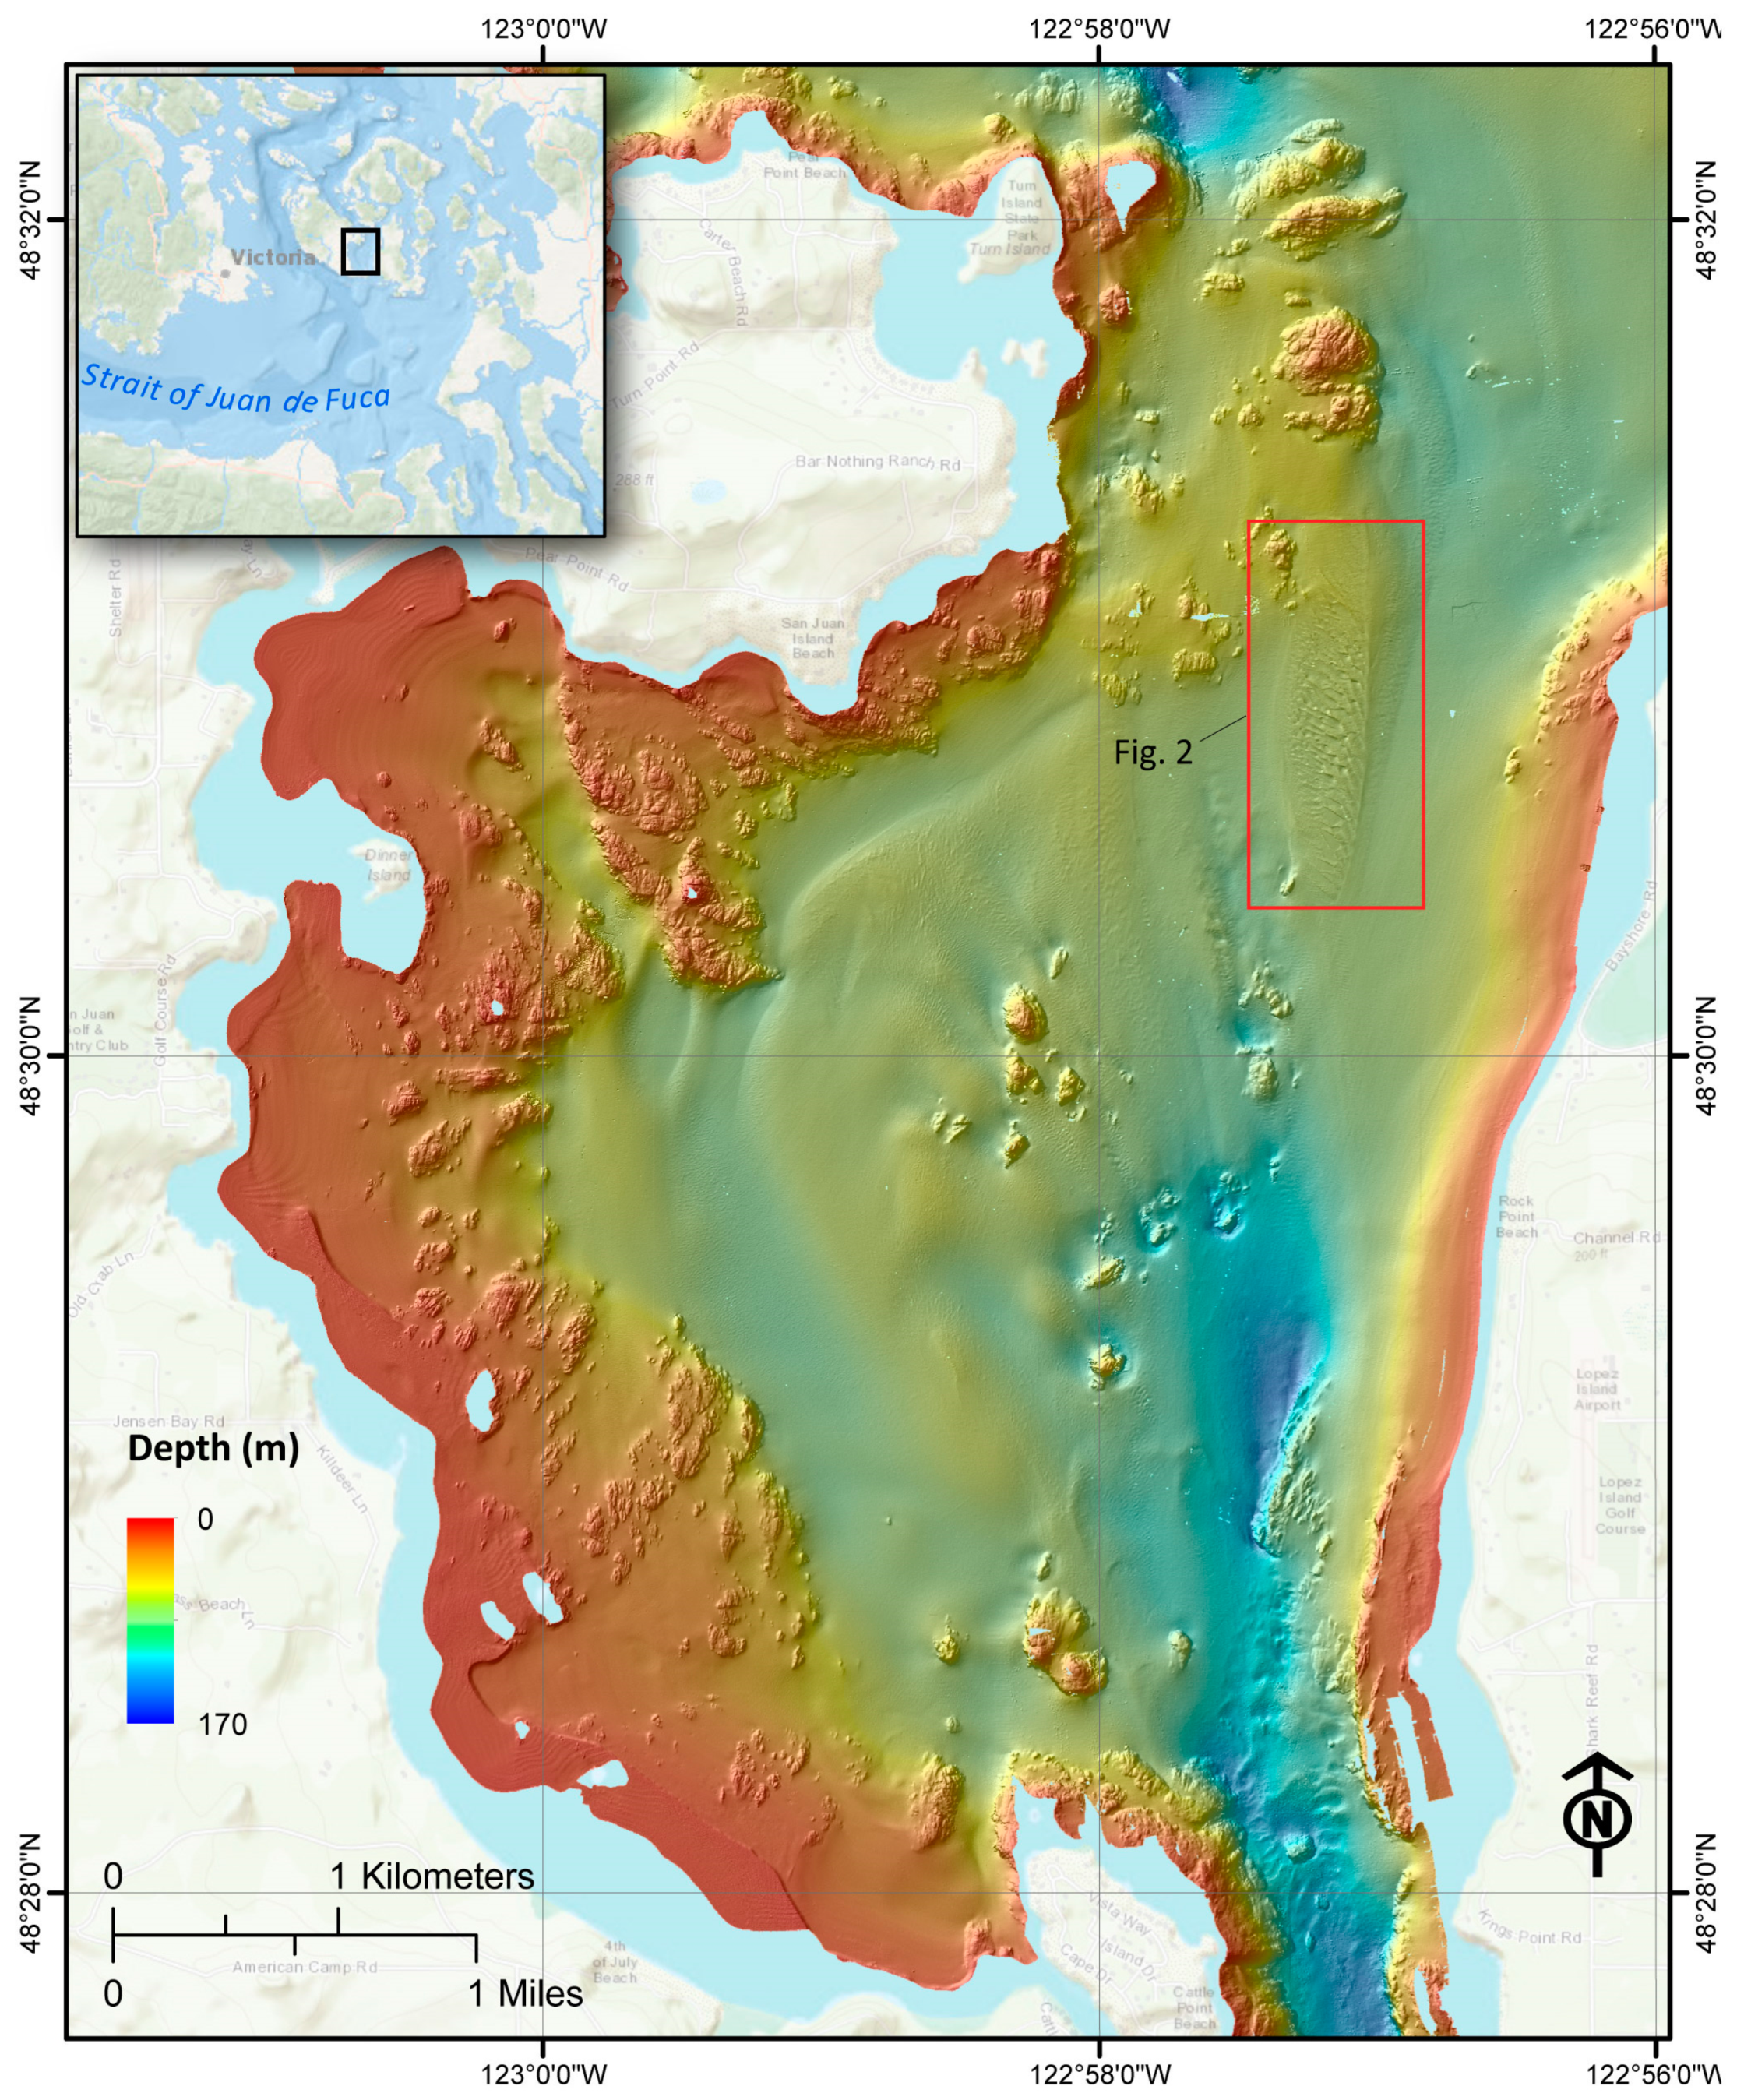
This study investigates the characteristics and mobility of large sand waves located in the central part of the San Juan Channel of the San Juan Archipelago, Washington, USA (Figure 1), here called “The San Juan Channel sand wave field”. These sand waves have heights of 1 to 4 m and wavelengths from 10 to 100 m. This work is part of a larger multi-disciplinary investigation of deep-water sandy habitats for Pacific sand lance (Ammodytes personatus, formerly identified as A. hexapterus), an important forage fish for larger fish including salmon, mammals, and birds in the Pacific Northwest. Sand wave fields of all sizes are potential sub-tidal habitats for this species within the Salish Sea as well as on the continental shelves of northwestern North America.
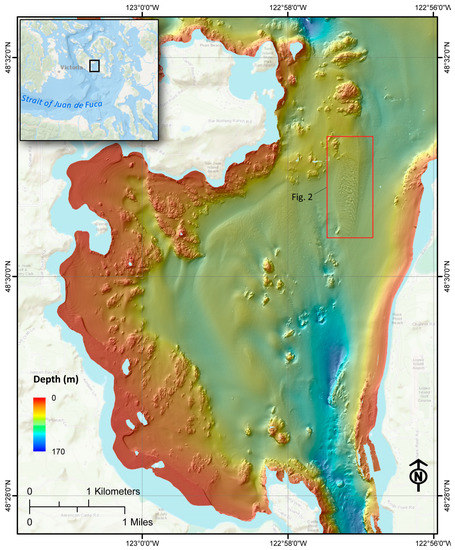
Figure 1.
Multibeam echosounder bathymetric map showing the location of the San Juan Channel sediment wave field within the San Juan Archipelago of the Pacific NW, Washington State, USA. The bedform investigated for this study is prominently displayed near the top of the bathymetric image.
The Pacific sand lance (PSL) is found along the coastal North Pacific Ocean from northwestern California to northern Japan, and is one of six species in the genus Ammodytes [1,2]. Although PSL are a key component in the marine food web, little is known of this species’ sub-tidal habitats. Their burrowing behavior, recruitment rates and conditions, relative abundance and distribution, population structure, local spawning habits, and spawning and burial substrates have been studied [1,3,4]. Previous work on PSL biology and habitat associations has focused on the near-shore and shallow sub-tidal areas [5,6,7]. It has recently been shown that predominant and important habitats exist in deeper sub-tidal and deep-water environments [8].
1.1. Previous Work
Studies of the lesser sand-eel (A. marinus) in the North Sea show that like PSL sand-eels are closely associated with sandy substrate [9,10] where they were reportedly found to inhabit turbulent sandy areas along the edges of sand banks. In their study of the sand-eel fisheries in the North Sea, Wright and others [11] confirmed from their modeling that sand-eels are found at water depths between 30 m and 70 m, consistent with the recorded depth distribution based on the sand-eel fisheries and that the fish preferred sandy substrate. From their studies Wright and others [11] concluded that inferences about the distribution and quality of A. marinus habitats in the North Sea could be obtained from knowledge of the sediment fraction and depth, factors they believed to limit their distribution. These authors recommended that further studies of sediment permeability and the relation between ripple geometry and water percolation might help better characterize sand-eel habitat preferences.
Freeman and others [12] used QTC VIEW™ with a single beam sonar system to determine acoustic changes in the seabed where sand-eel were reported to concentrate in the North Sea. These authors, following up on the work of Wright [13], who noted that differences in bottom current velocities contributed to sand-eel concentrations with high densities occurring at sites affected by high tidal velocities, found that current formed features were attractive to sand-eels. They suggested that current direction may be an environmental mechanism influencing the dynamics of sand-eel patches and suggested buried sand-eel form patches in the sediment that lie in the same direction as prevailing tidal currents [12].
Holland and others [14] used the RoxAnn© classification using a single beam sonar to develop a stratified random grab sampling survey in the North Sea based on a sediment map constructed from RoxAnn. Their study was undertaken because they had determined that grab sample stations must be specifically targeted so that adequate numbers of fish are collected, and that based on the work of Greenstreet and others [15] field data did not define sand-eel habitat in sufficient detail to provide an adequate basis for a useful grab survey design with habitat mapping. Therefore, Holland and others [14] concluded that when combined with seabed habitat mapping grab sampling can be directed to those areas where sand-eel habitat is located.
1.2. Objectives
Although much work has been done in relation to deep-water habitat characterization of sand-eel and shallow water habitat characterization of PSL, a better understanding of habitat parameters and controlling processes are needed to better constrain potential habitats. Our focus, therefore, is on deep-water (sub-tidal) habitats of dynamic sediment wave fields with bedforms that harbor dense concentrations of PSL. Since these bedforms appear to be essential habitats for the PSL, their presence and stability is critical to understanding PSL distribution and abundance patterns. The goal of this study is to investigate the physical seafloor processes that form and maintain sand wave fields as a precursor to future habitat association studies on PSL. We address the concerns and recommendations of previous investigators in the study of tidal velocities, direction and relationship to grain sizes.
Deposits of clean sand at water depths where PSL reside in sub-tidal environments (typically <100 m) are common where relatively strong currents sweep the sea floor. To maintain such clean deposits a plentiful sand supply and strong near-bottom currents appear necessary as observed by Wright and others [11] in their study of sand ripples in the North Sea, which are associated with maximum current flows of 1 m s−1 [16]. Finer sediment might transit through the area, while coarser sediment might be present as a lag. Bedform fields consisting of ripples, waves, and dunes are common in deep channel areas of the Salish Sea, and several fields have been mapped within the San Juan Archipelago [8,17]. The Sand Juan Channel sand wave field (Figure 2) was studied extensively by Greene and others [8] and was found to be a productive PSL habitat [18]. The sand–wave field is delimited by distinct boundaries where the sand waves are in sharp contact with a relatively featureless surrounding sea floor. Such abrupt seabed transitions have been reported in other nearby sand wave fields [17].
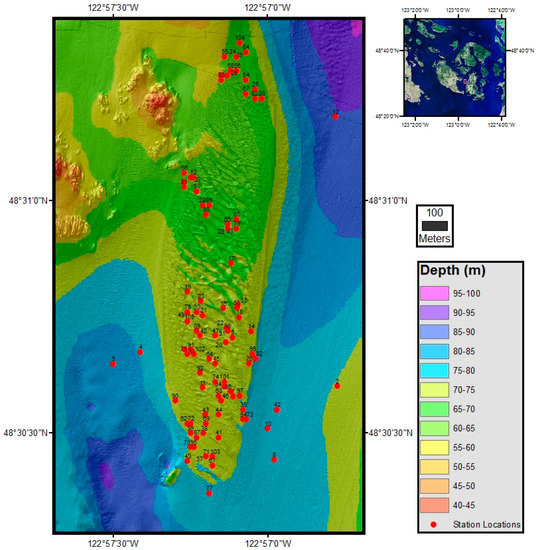
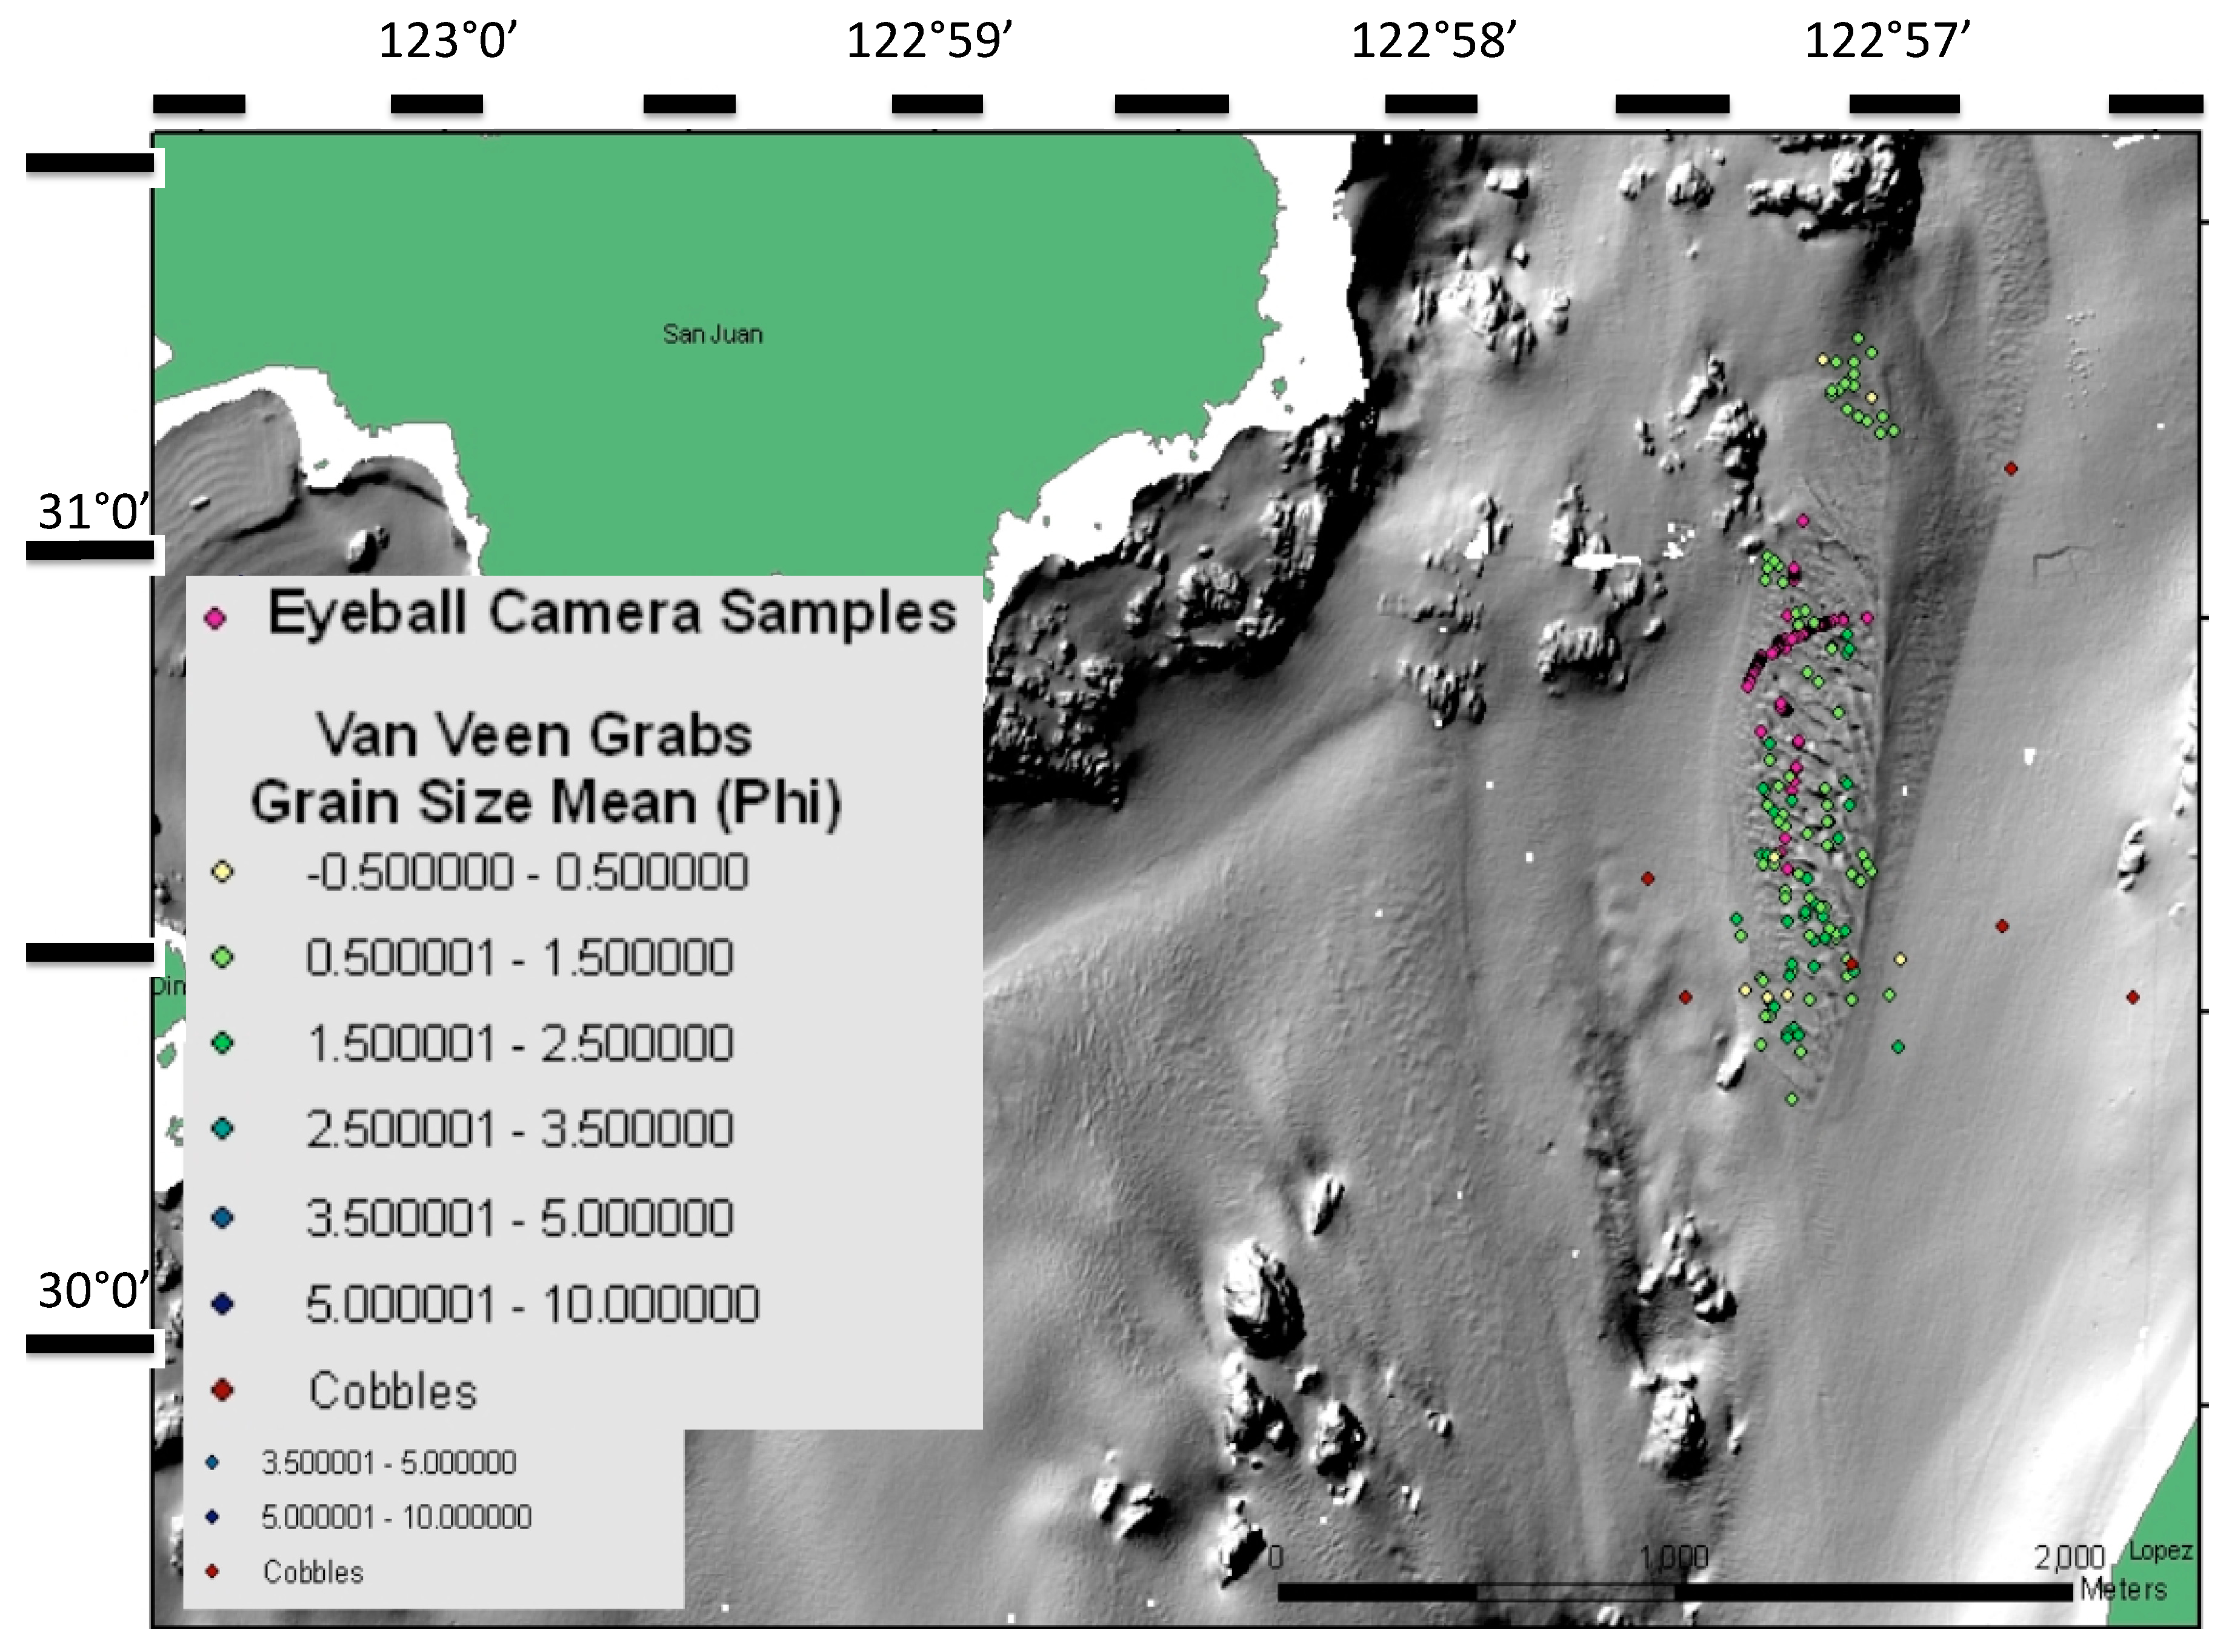
Figure 2.
Expanded view of multi-beam echo sounder (MBES) bathymetric image of the San Juan Channel sediment wave field exhibited in Figure 1 with depth illustrated in color. Small dots within circles represent sediment sample locations (diameter of dot equals ~23 m), station numbers are located next to open circles.
The San Juan Channel sand wave field covers an area of approximately 600,000 m2 at water depths of 20 to 80 m (Figure 2). During 2004 a Washington Department of Fish and Wildlife (WDFG) remotely operated vehicle (ROV) video survey at this location found that PSL were burrowing and emerging from the sediment [8]. In October 2006 and 2008, PSL were again discovered in the sand waves, and the fish and bottom sediment were sampled with a small Peterson grab sampler. The significance of the sediment wave field as a PSL habitat was shown by the work of Blain [18], who collected over 42 Van Veen sediment grab samples, which contained an average of 10.0 individuals/grab. Blain [18] estimated that the local PSL population consisted of over 63 million fish. Every year since 2008 students of Friday Harbor Laboratories, University of Washington, have sampled PSL in this sand wave field (e.g., [19,20,21]).
Assuming that the San Juan Channel sediment wave field, a tidally shaped field of dynamic bedforms, is a typical PSL habitat, we set out to investigate the processes that shape it to better identify potential habitats. Therefore, our objectives are to determine the seafloor processes that form the sand wave field, its study ripple orientations in relation to sediment permeability, to document that PSL, like sand stability, and source of sand. Our intent is to address the recommendations of Wright and others [11] to -eel, concentrate in high tidal flow areas as proposed by Freeman and others [12], and to improve the grab sampling success of potential habitats as discussed by Holland and others [14], therefore, to determine the physical characteristics of PSL deep-water habitats.
2. Background
During the past decade, studies of marine sand waves in coastal and estuarine environments have been aided by detailed MBES bathymetric and backscatter data. Barnard and others [22] mapped bedforms in San Francisco Bay, California using repeated MBES surveys, and estimated sand wave migration rates and bed-load transport patterns. Barnard and others [22] summarized previous mapping and analytical studies of sand wave dynamics in other coastal regions, and provided a comprehensive analysis of sand wave patterns and movement in San Francisco Bay based on over 3000 sand waves. They applied a technique to estimate sand wave migration rates using bedform asymmetry that was formulated for sand waves off the Dutch coast by Knappen [23]. This same technique is used in this study to estimate movement of the larger sand waves in the San Juan Channel sand wave field.
It is widely accepted that bed form size and type (ripples, megaripples, dunes, sand waves; e.g., [24] are controlled largely by sediment grain size, current velocity, and water depth [25,26]. The practical issues of mixed bed grain size distributions, spatially variable physical bottom roughness, and time-dependent current velocities (e.g., tidal flows) complicate these linkages. The sand waves considered here are described using bed phase diagrams developed for tidally controlled bedforms in San Francisco Bay where water depths are similar [27].
Geologic Setting
The San Juan Archipelago-Georgia Basin region of the central Salish Sea is an active tectonic province whose physiography and geomorphology reflect both Mesozoic to Cenozoic convergence (subduction/accretion) plate tectonic processes and Pleistocene glaciation (glacial scouring/deposition). These processes have juxtaposed and deformed Jurassic–Cretaceous metamorphic rocks with Tertiary–Quaternary sedimentary rocks producing a complex of fjords, grooved and polished bedrock outcrops, erratic boulder concentrations, and moraines [28]. Banks of till and glacial advance outwash deposits also have formed and contribute to the variety of relief and substrate within the region [29]. Present day tidal action has fashioned much of the relic glacial–marine sediments into dynamic bedforms within interisland channels, consisting of sand and gravel waves and dune fields. Locally modern day sedimentary deposits overprint the relic deposits as sand and mud banks and represent materials being supplied to the region by the Fraser River of British Columbia, Canada.
The stability and persistence of the larger sandy bedforms are important factors for the preservation of the PSL deep-water habitats. The surfaces of these sand deposits contain multiple scales of bedforms from ripples to large sand waves and are thought to have originally been formed and shaped during the Holocene, subsequent to the last glacial retreat from the region [29]. The complex action of surface waves and strong tidal currents, particularly during lower sea level, transported mobile sand from coastal and shallow island margins into adjacent deeper channel floors, forming the discrete sand bodies. Presently, the isolated sand deposits are situated in water depths from about 20 to 100 m in many of the inter-island channels where current patterns are complex. The sand deposits rest unconformably on a rugged surface composed of coarse glacial till, often in the current shadow of seafloor rock outcrops, and the boundaries between the till and sand bodies have sharply defined, abrupt contacts [29].
3. Methods
In this study, geomorphic and textural characteristics of the San Juan Channel sand wave field were investigated using detailed multi-beam echo sounder (MBES) bathymetric data, bottom samples, bottom camera and underwater video surveys, and a shipboard acoustic doppler current profiling (ADCP) system.
A sequence of four one-day research cruises was undertaken specifically for this study during 2010 to 2013. Regional MBES surveys that included San Juan Channel were conducted earlier [8,30]. Bottom sediment samples, video-transect images, and underwater sediment camera photographs were obtained during the various cruises within the San Juan Channel on two research vessels (R/V Centennial and Tombolo). Current profiling transects within the sand wave field were carried out with an ADCP mounted on University of Washington Friday Harbor Labs’ R/V Centennial. The ADCP current profiles were collected only during flood tidal flow, but measurements during ebb currents within the San Juan Channel sand wave field had been collected previously by Ewing [21], whose data were used in our analyses.
3.1. Marine Geophysical Data
Marine geophysical survey data, primarily wide swath MBES bathymetry and backscatter acquired in cooperation with the Geological Survey of Canada, Canadian Hydrographic Service, Center for Habitat Studies, Moss Landing Marine Labs, and Tombolo/Sea Doc Society, and collected in the Northwest Straits region of the Salish Sea (southern Gulf Islands and the San Juan Archipelago) were used to produce seafloor images of the sediment wave field for this investigation. These data, along with side-scan sonar mosaics and 3.5 kHz sub-bottom seismic-reflection profiles were used to produce habitat types after Greene [31], which were published in a marine benthic habitat map series [30]. Interpretation of these data was used to characterize our study area, and to identify and map dynamic bedforms and other sand wave fields in the region for future sampling.
The MBES surveys were conducted in the San Juan Channel sand wave field originally imaged in 2004 with repeat surveys in 2006 and 2007 with the Canadian Coast Guard launch Otter Bay using a Simrad EM 3000–3002™ (300 kHz) system The objective of these multiple surveys were to estimate changes in the sand wave field bedforms morphologies and to determine if sediment transport across the field is active.
3.2. Seafloor Photographs
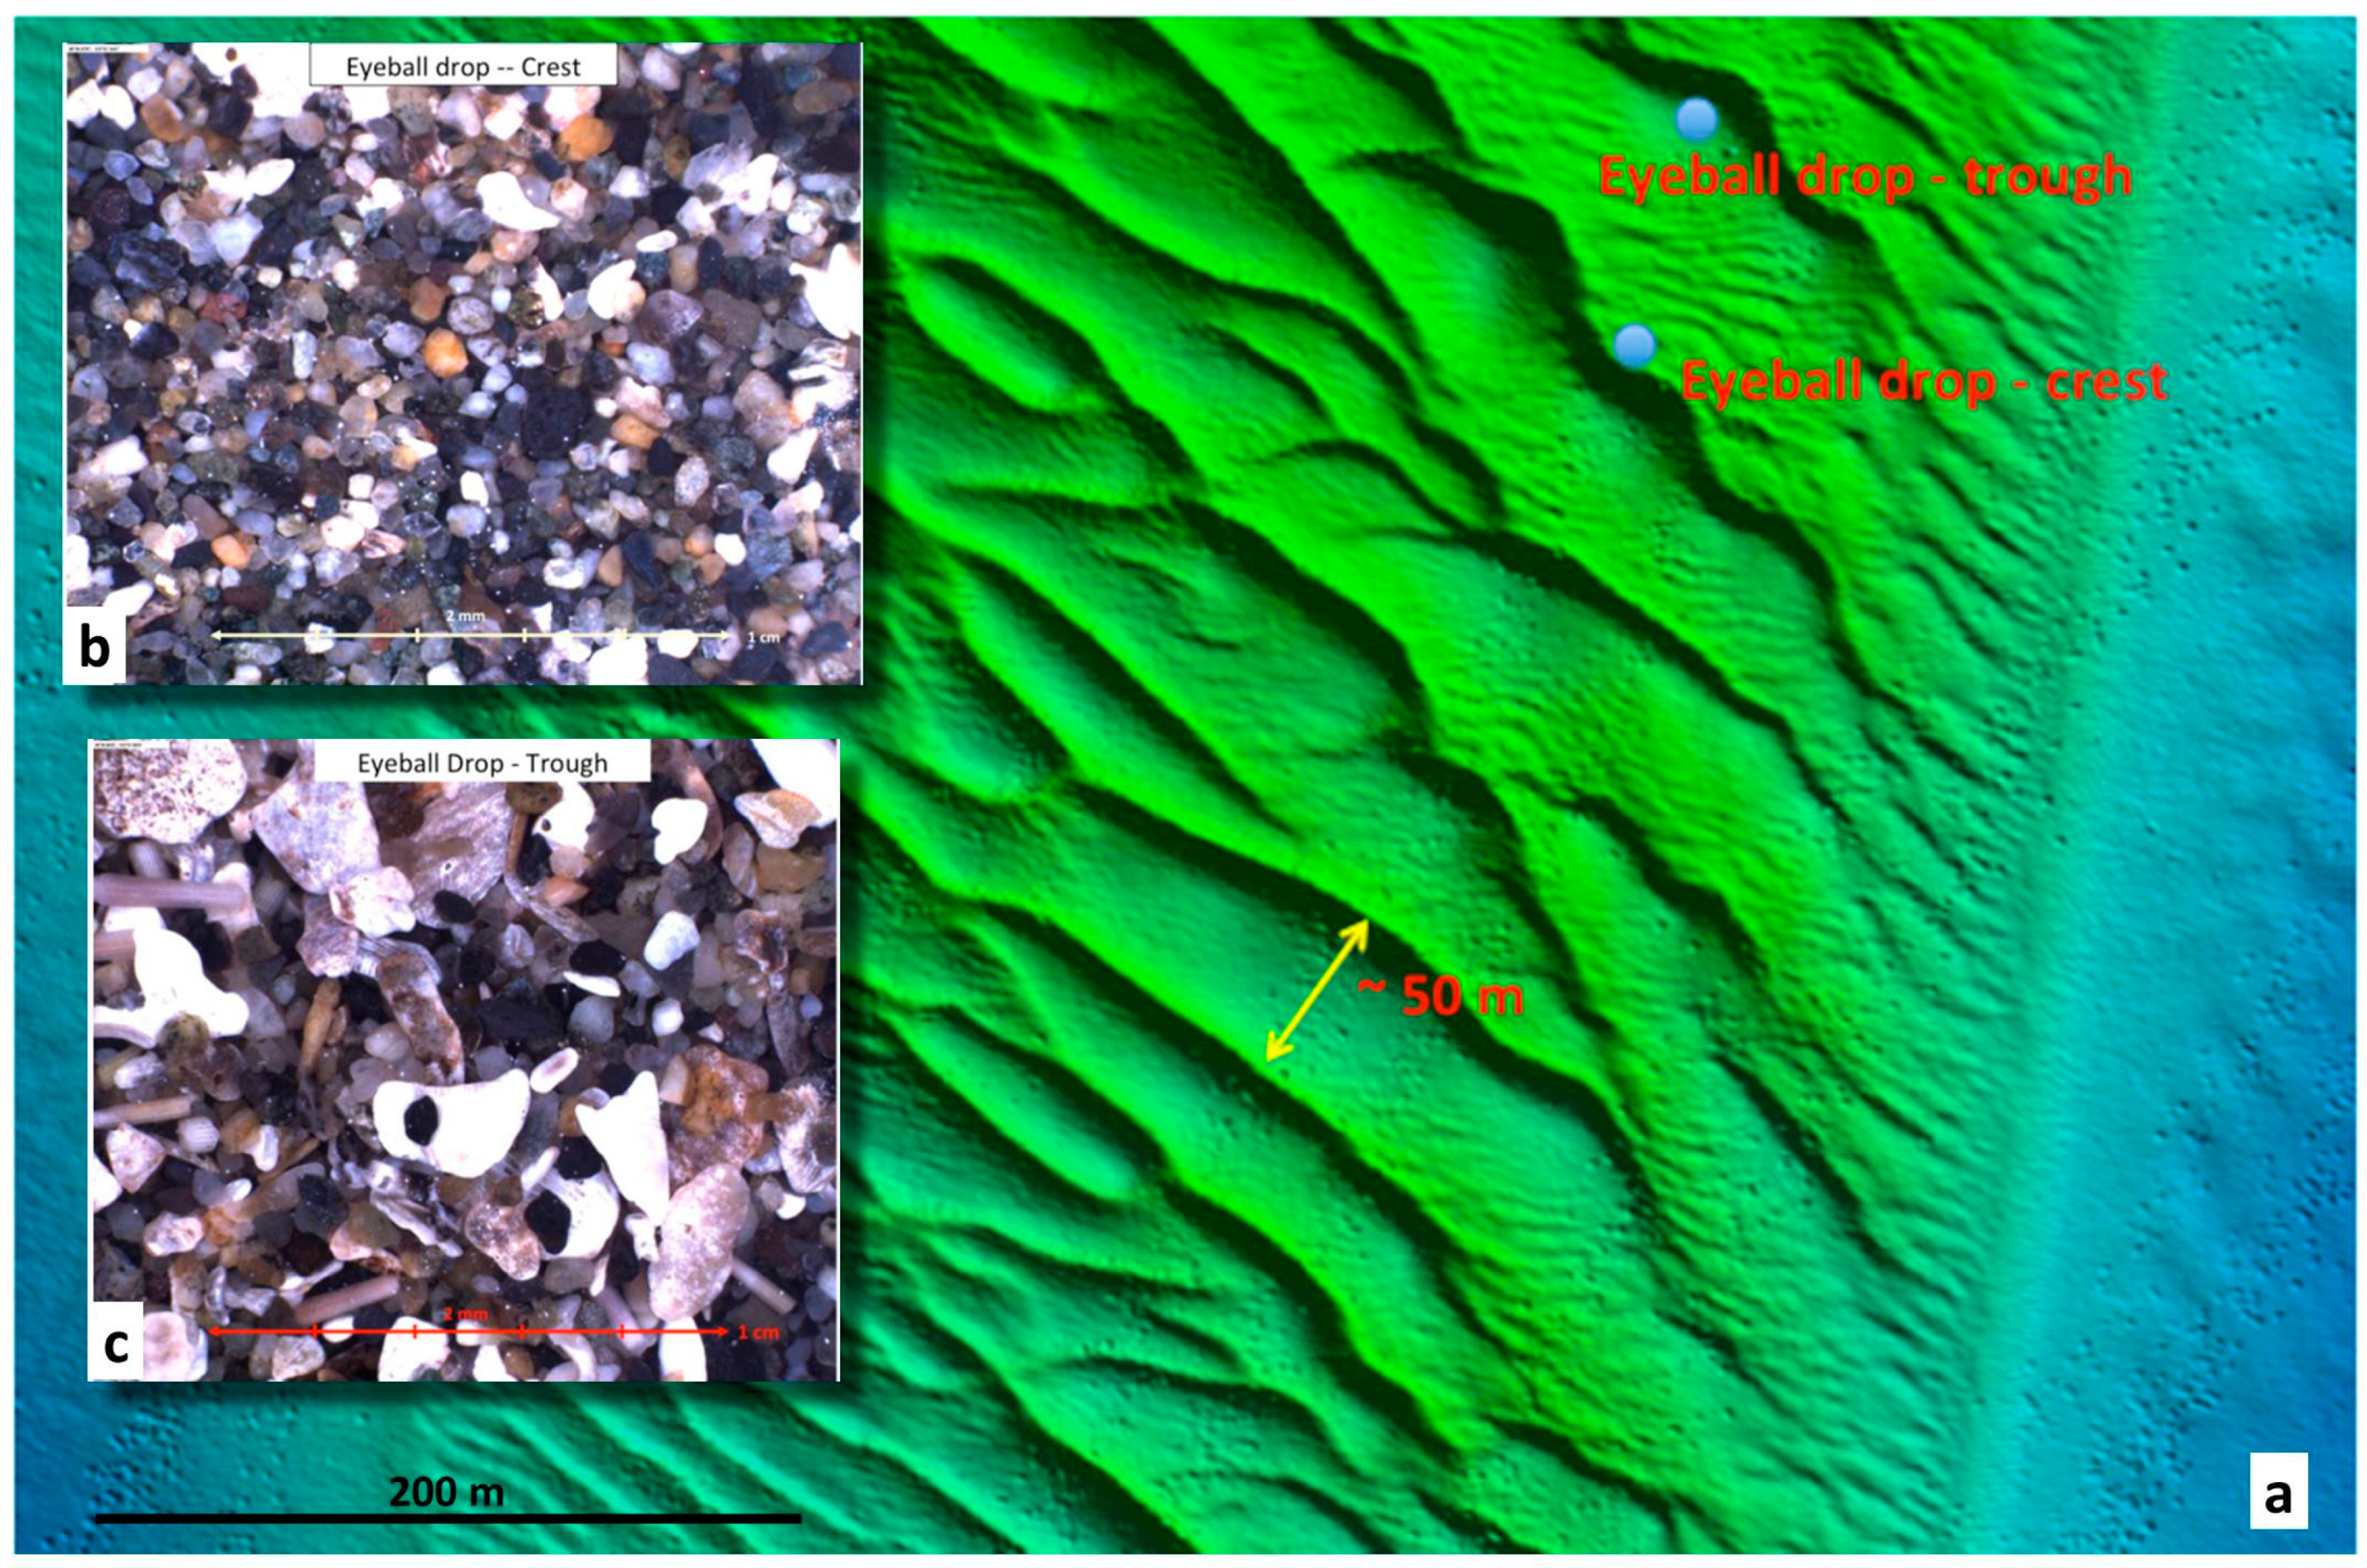
We used the USGS sediment grain or “eyeball” camera aboard the RV Tombolo to take close-up high-resolution photographs of the bottom sediment. These images were used to calculate median grain size based on the work of Rubin [32]. One advantage of the eyeball camera is that extensive coverage can be obtained across the seafloor (approximately 6 images/minute). These camera transects were useful for observing the bottom sediment characteristics, and for making numerous estimates of sediment grain size and its areal variation. The locations of the eyeball camera photo shots obtained along the camera transect and sediment sample stations are shown in Figure 3. No layback calculations were made as transects were undertaken during slack water and the camera tether was near vertical for most of the photographic runs. Therefore, positioning of the vessel was used to plot the locations within a range of ±23 m (~2.5 times boat length). Precise locations of the photographs were made by identifying the sand wave morphology (crest or trough) in the photos with the position of the boat. Two eyeball photographs and their locations, one in a sand-wave trough and the other close to the adjacent crest, are shown in Figure 4a–c. Additional data on sediment type and morphology were obtained using a USGS bottom video camera system. The mean sediment size obtained by analysis of the image in Figure 4b near a sand wave crest was 0.5 mm. Much of the surficial bottom sediment in the sand wave troughs consists of large, poorly sorted fragments of coarse shell hash (Figure 4c).
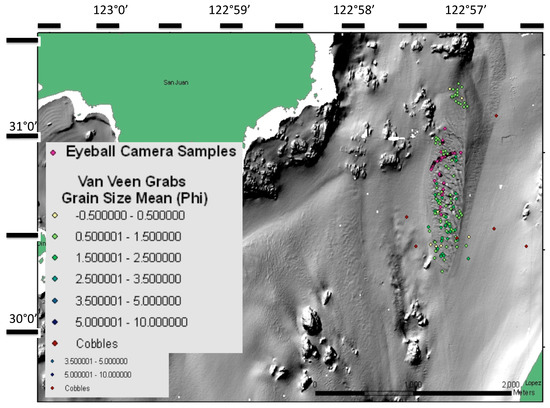
Figure 3.
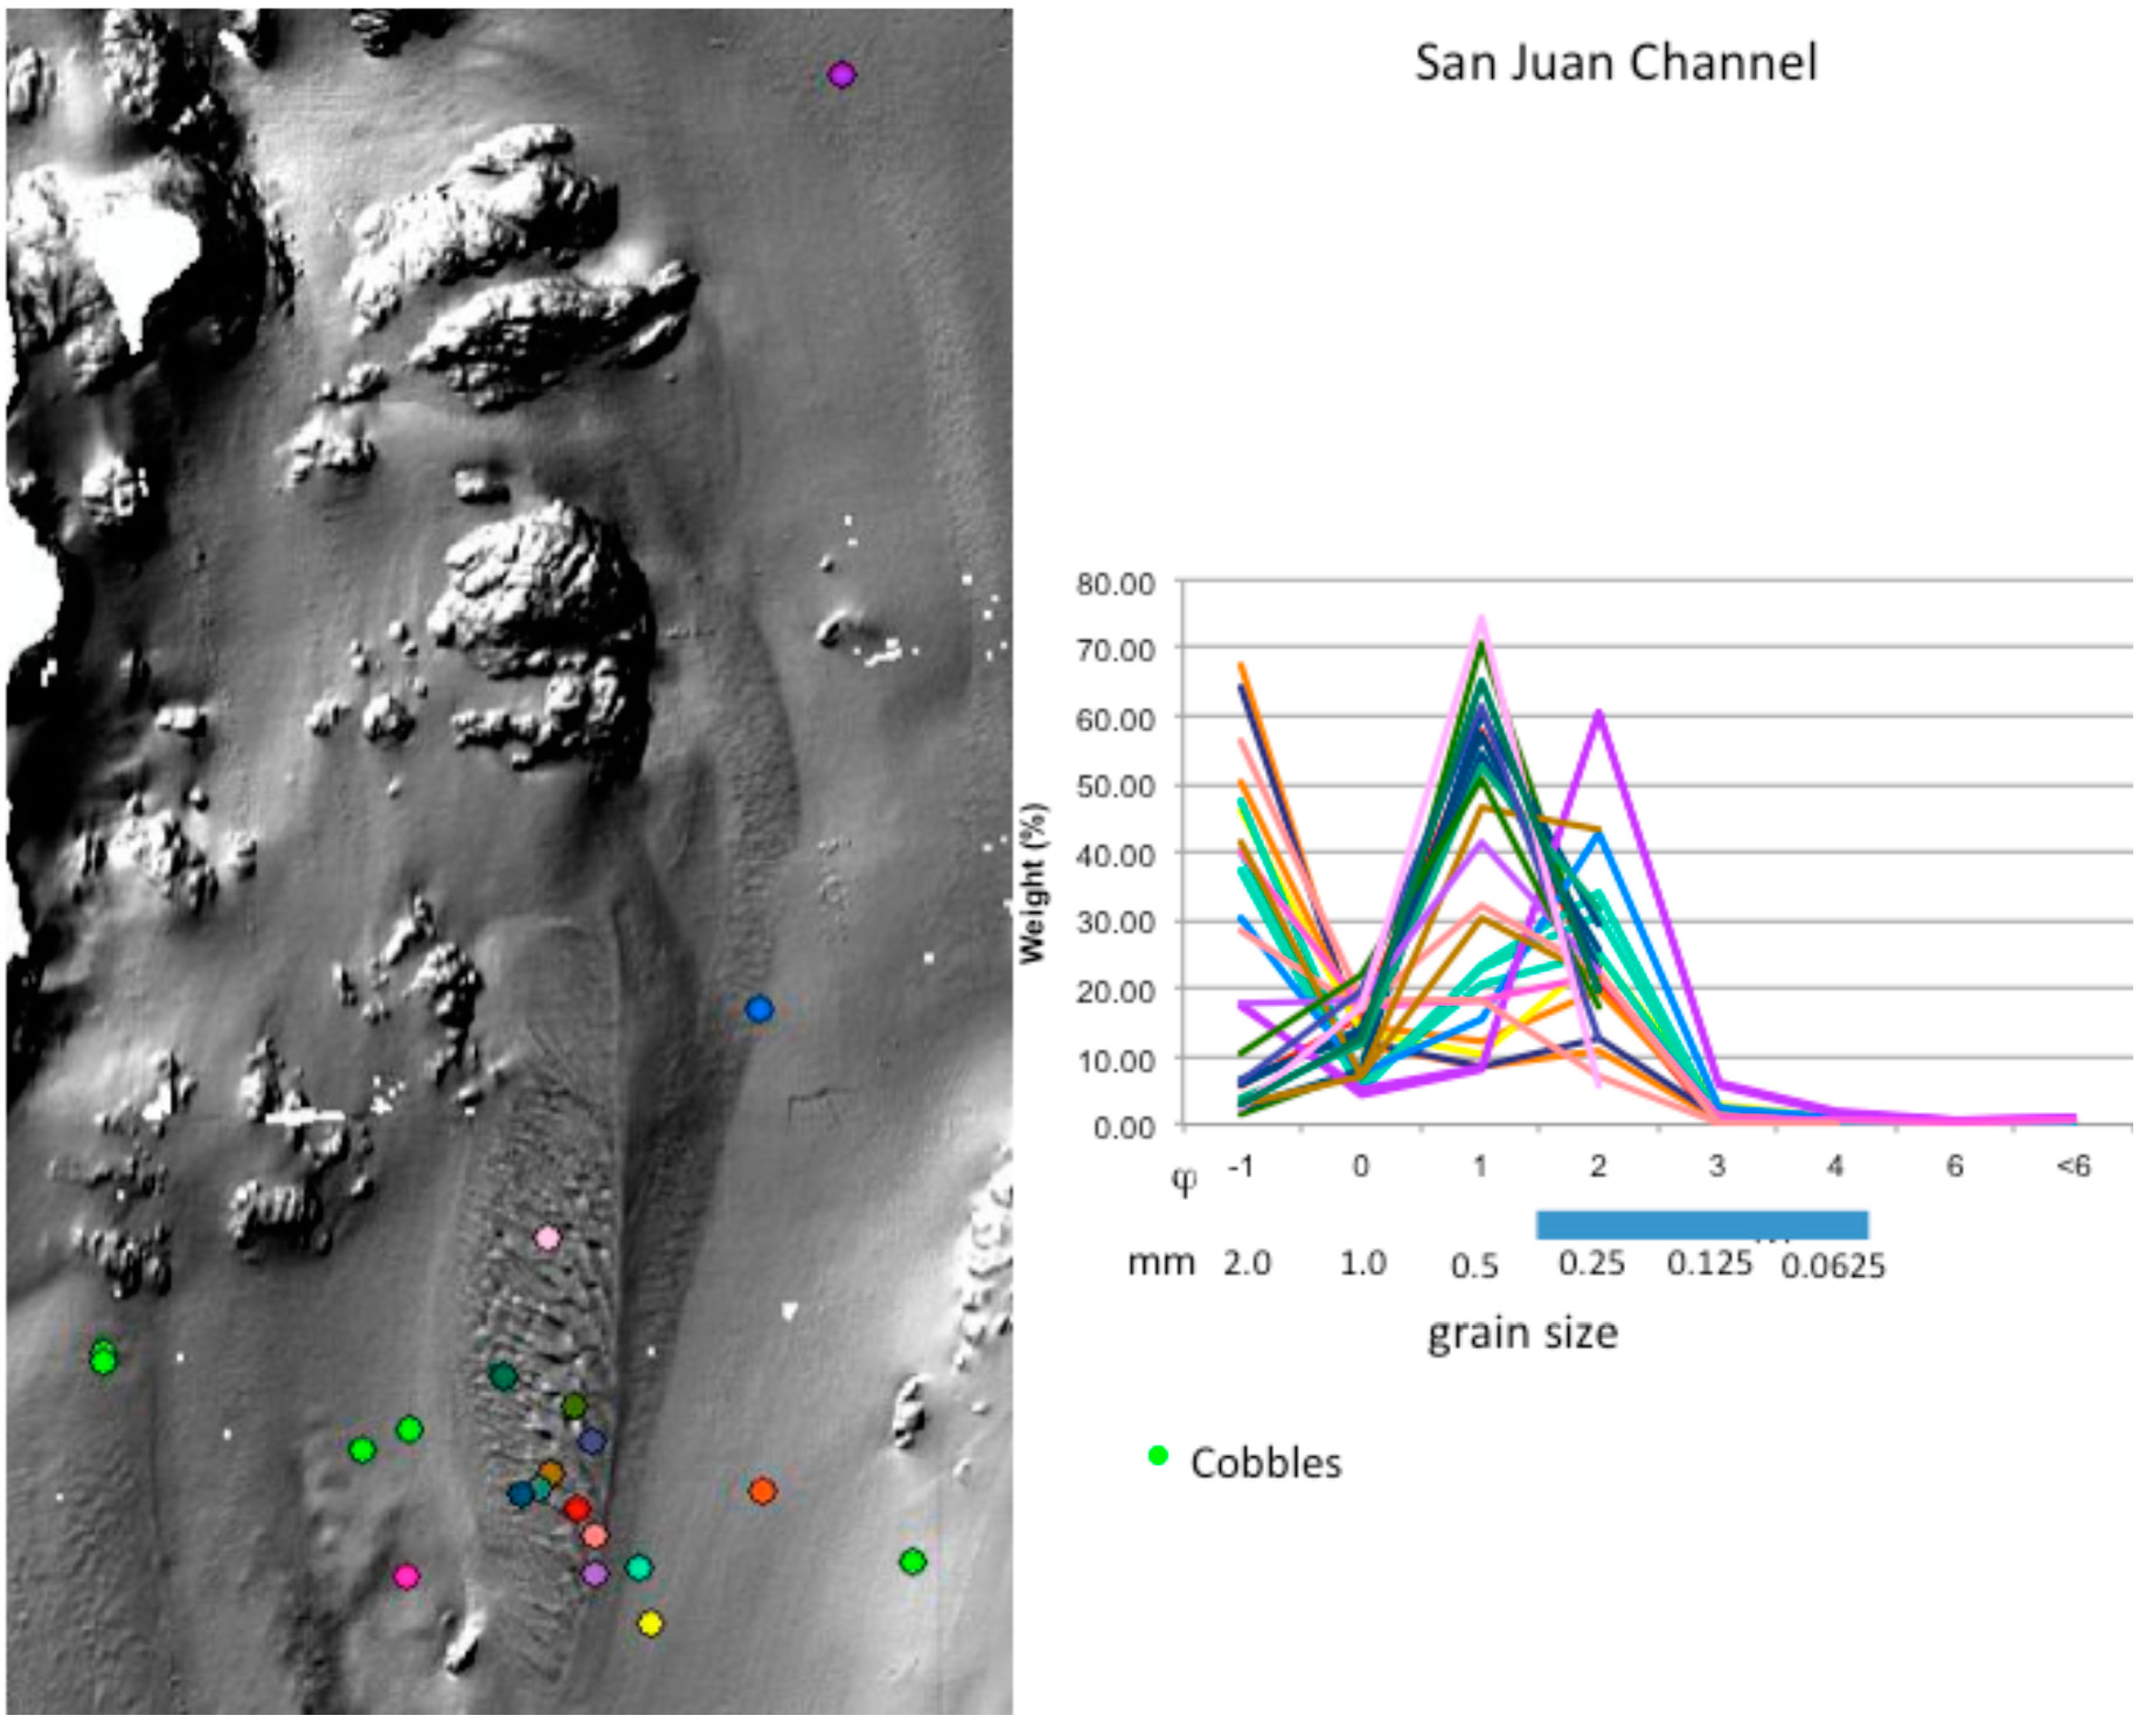
Locations of eyeball photo shots (purple dots) taken along transects of the San Juan Channel sand wave field using the USGS eyeball camera and sediment sample stations showing mean grain sizes (phi scale) in various colors. The objective of this figure is to show the density of sampling points within the sand wave field compared to samples taken outside of the field.
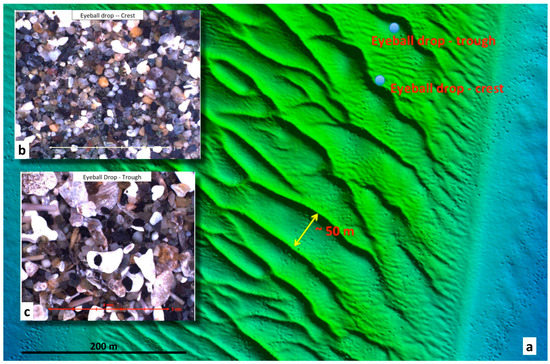
Figure 4.
Examples of images collected using the USGS eyeball camera: (a) MBES bathymetric image with locations of samples collected in the sand wave field; (b) photo of sediment taken in trough; (c) photo of sediment taken near crest of a sand wave.
3.3. Sediment Sampling and Laboratory Analysis
Grain-size distribution was determined for 79 sediment samples from the San Juan Channel sand wave field, a bedforms feature we consider typical of PSL deep-water habitat, in water depths of 20 to 80 m (Figure 2 and Figure 3). The samples were collected with a Van Veen grab during seven cruises in 2010 and 2011. All but 9 samples were collected during daylight hours. After drying samples in an oven, grain size was measured with a series of sieves 2, 1, 0.5, 0.25, 0.125, 0.063 mm in sizes; phi [ϕ] scale sizes from −1 to 4; Wentworth [33] using a Ro-Tap™ machine operated for a period of 15 minutes per sample. Material finer than 0.063 mm (4ϕ) was retained and included collectively as the “fine fraction”, and material resting on the 2.0 mm (−1ϕ) screen, which could include grains up to a few centimeters diameter, as the “coarse fraction.”
The location, water depth, number of fish captured, mean grain size, and statistical parameters at each sampling station are shown in Table 1 and the sample locations are shown in map view (Figure 3). For brevity we report grain size in mm in the remainder of this paper.

Table 1.
Sediment Sample Information.
Our sediment analyses are compared with that of Blaine [18] to determine if any significant change, both in grain sizes and fish population, has occurred in the sediment wave field since the earlier study of Blaine [18]. Samples from both studies were collected throughout the sediment wave field, as well as outside of the field in identical manner using the same bottom sampler with grain size analyses made using a Rho–Tap measuring machine including identical screens and calculations for the measurements.
3.4. Current Profiles
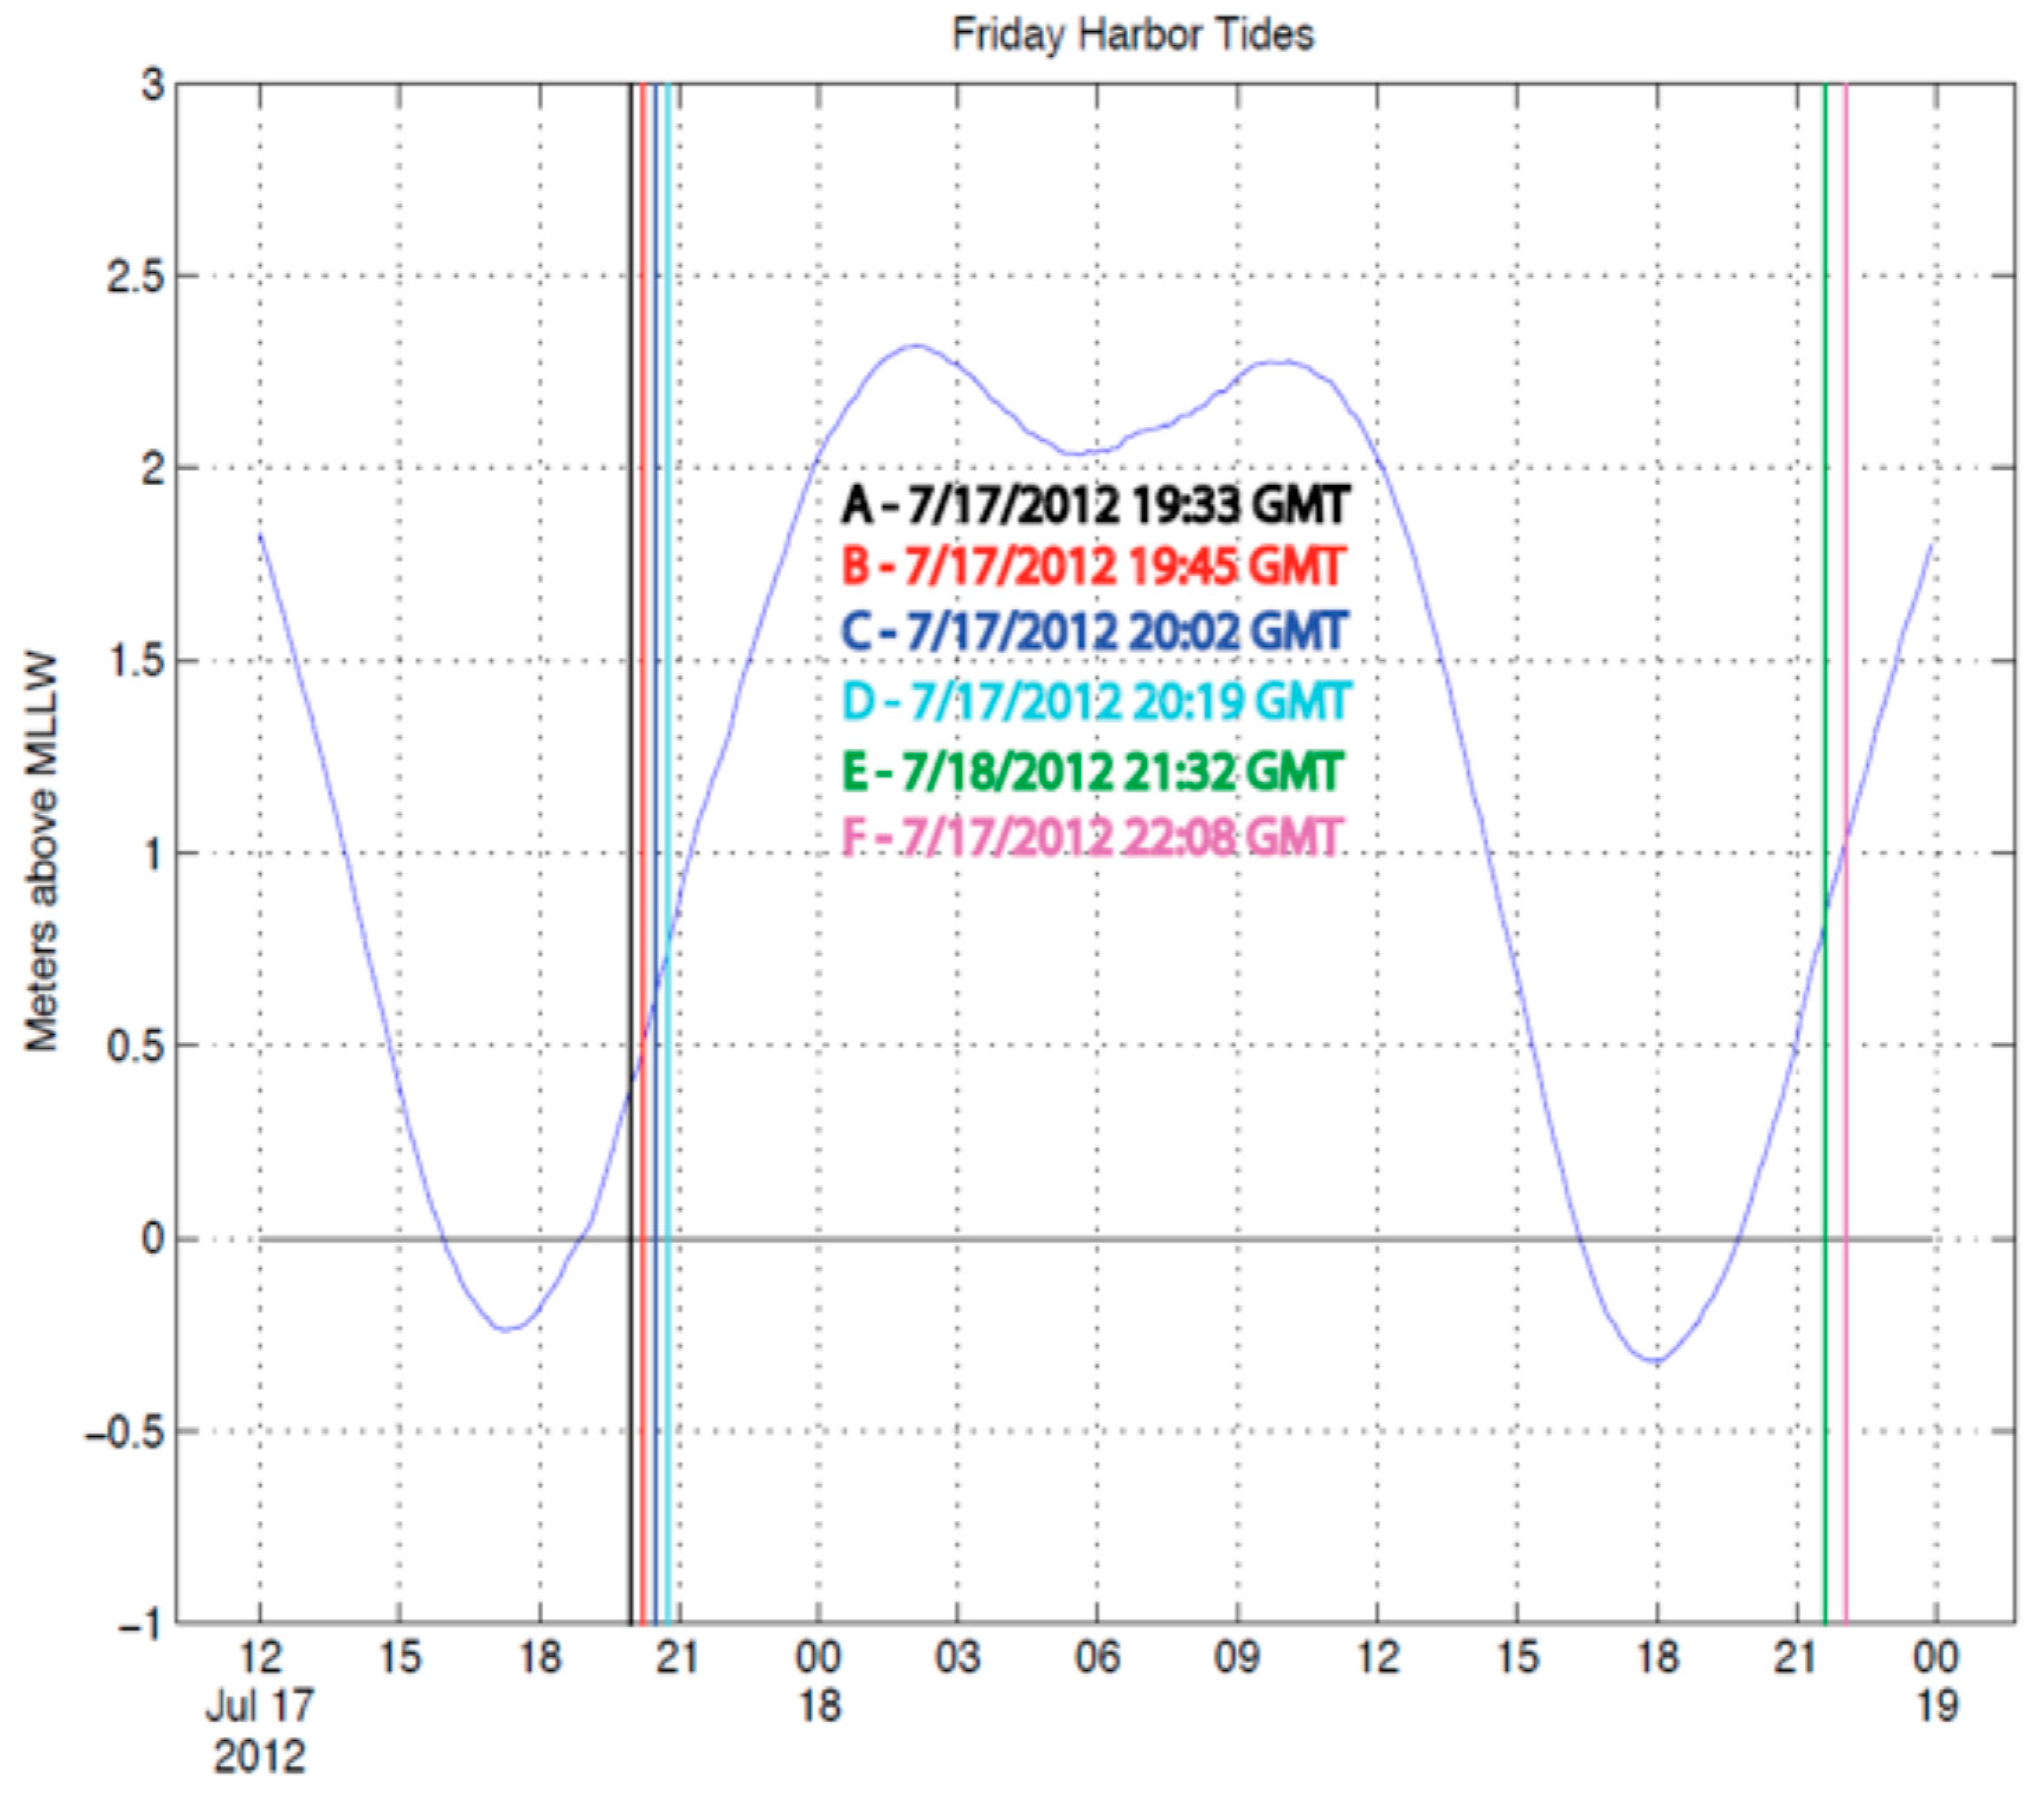
Seven ADCP current transects including four N–S and three E–W runs within the sand wave field were made in July 2012 on R/V Centennial (Table 2). The profiles were all obtained during flood current as shown on the tidal height curve in Figure 5.
Table 2.
Summary of ACDP Current Profiler Information.
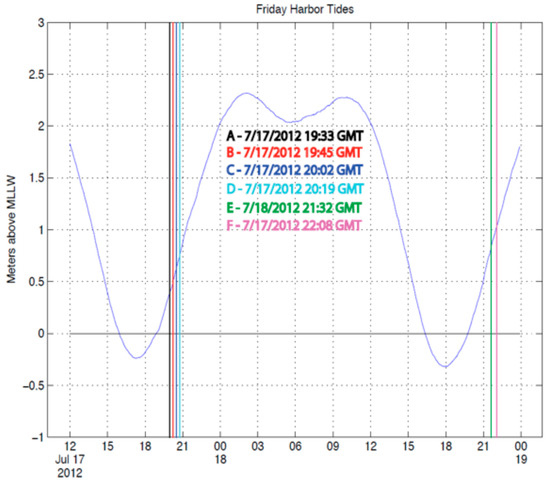
Figure 5.
Tidal curves showing tidal heights in meters above Mean Low Low Water (MLLW) within the San Juan Channel for the time of the ADCP survey on 17 July 2012. Data from NOAA tide gauge at Friday Harbor, WA (NOAA, 6–7 October 2010).
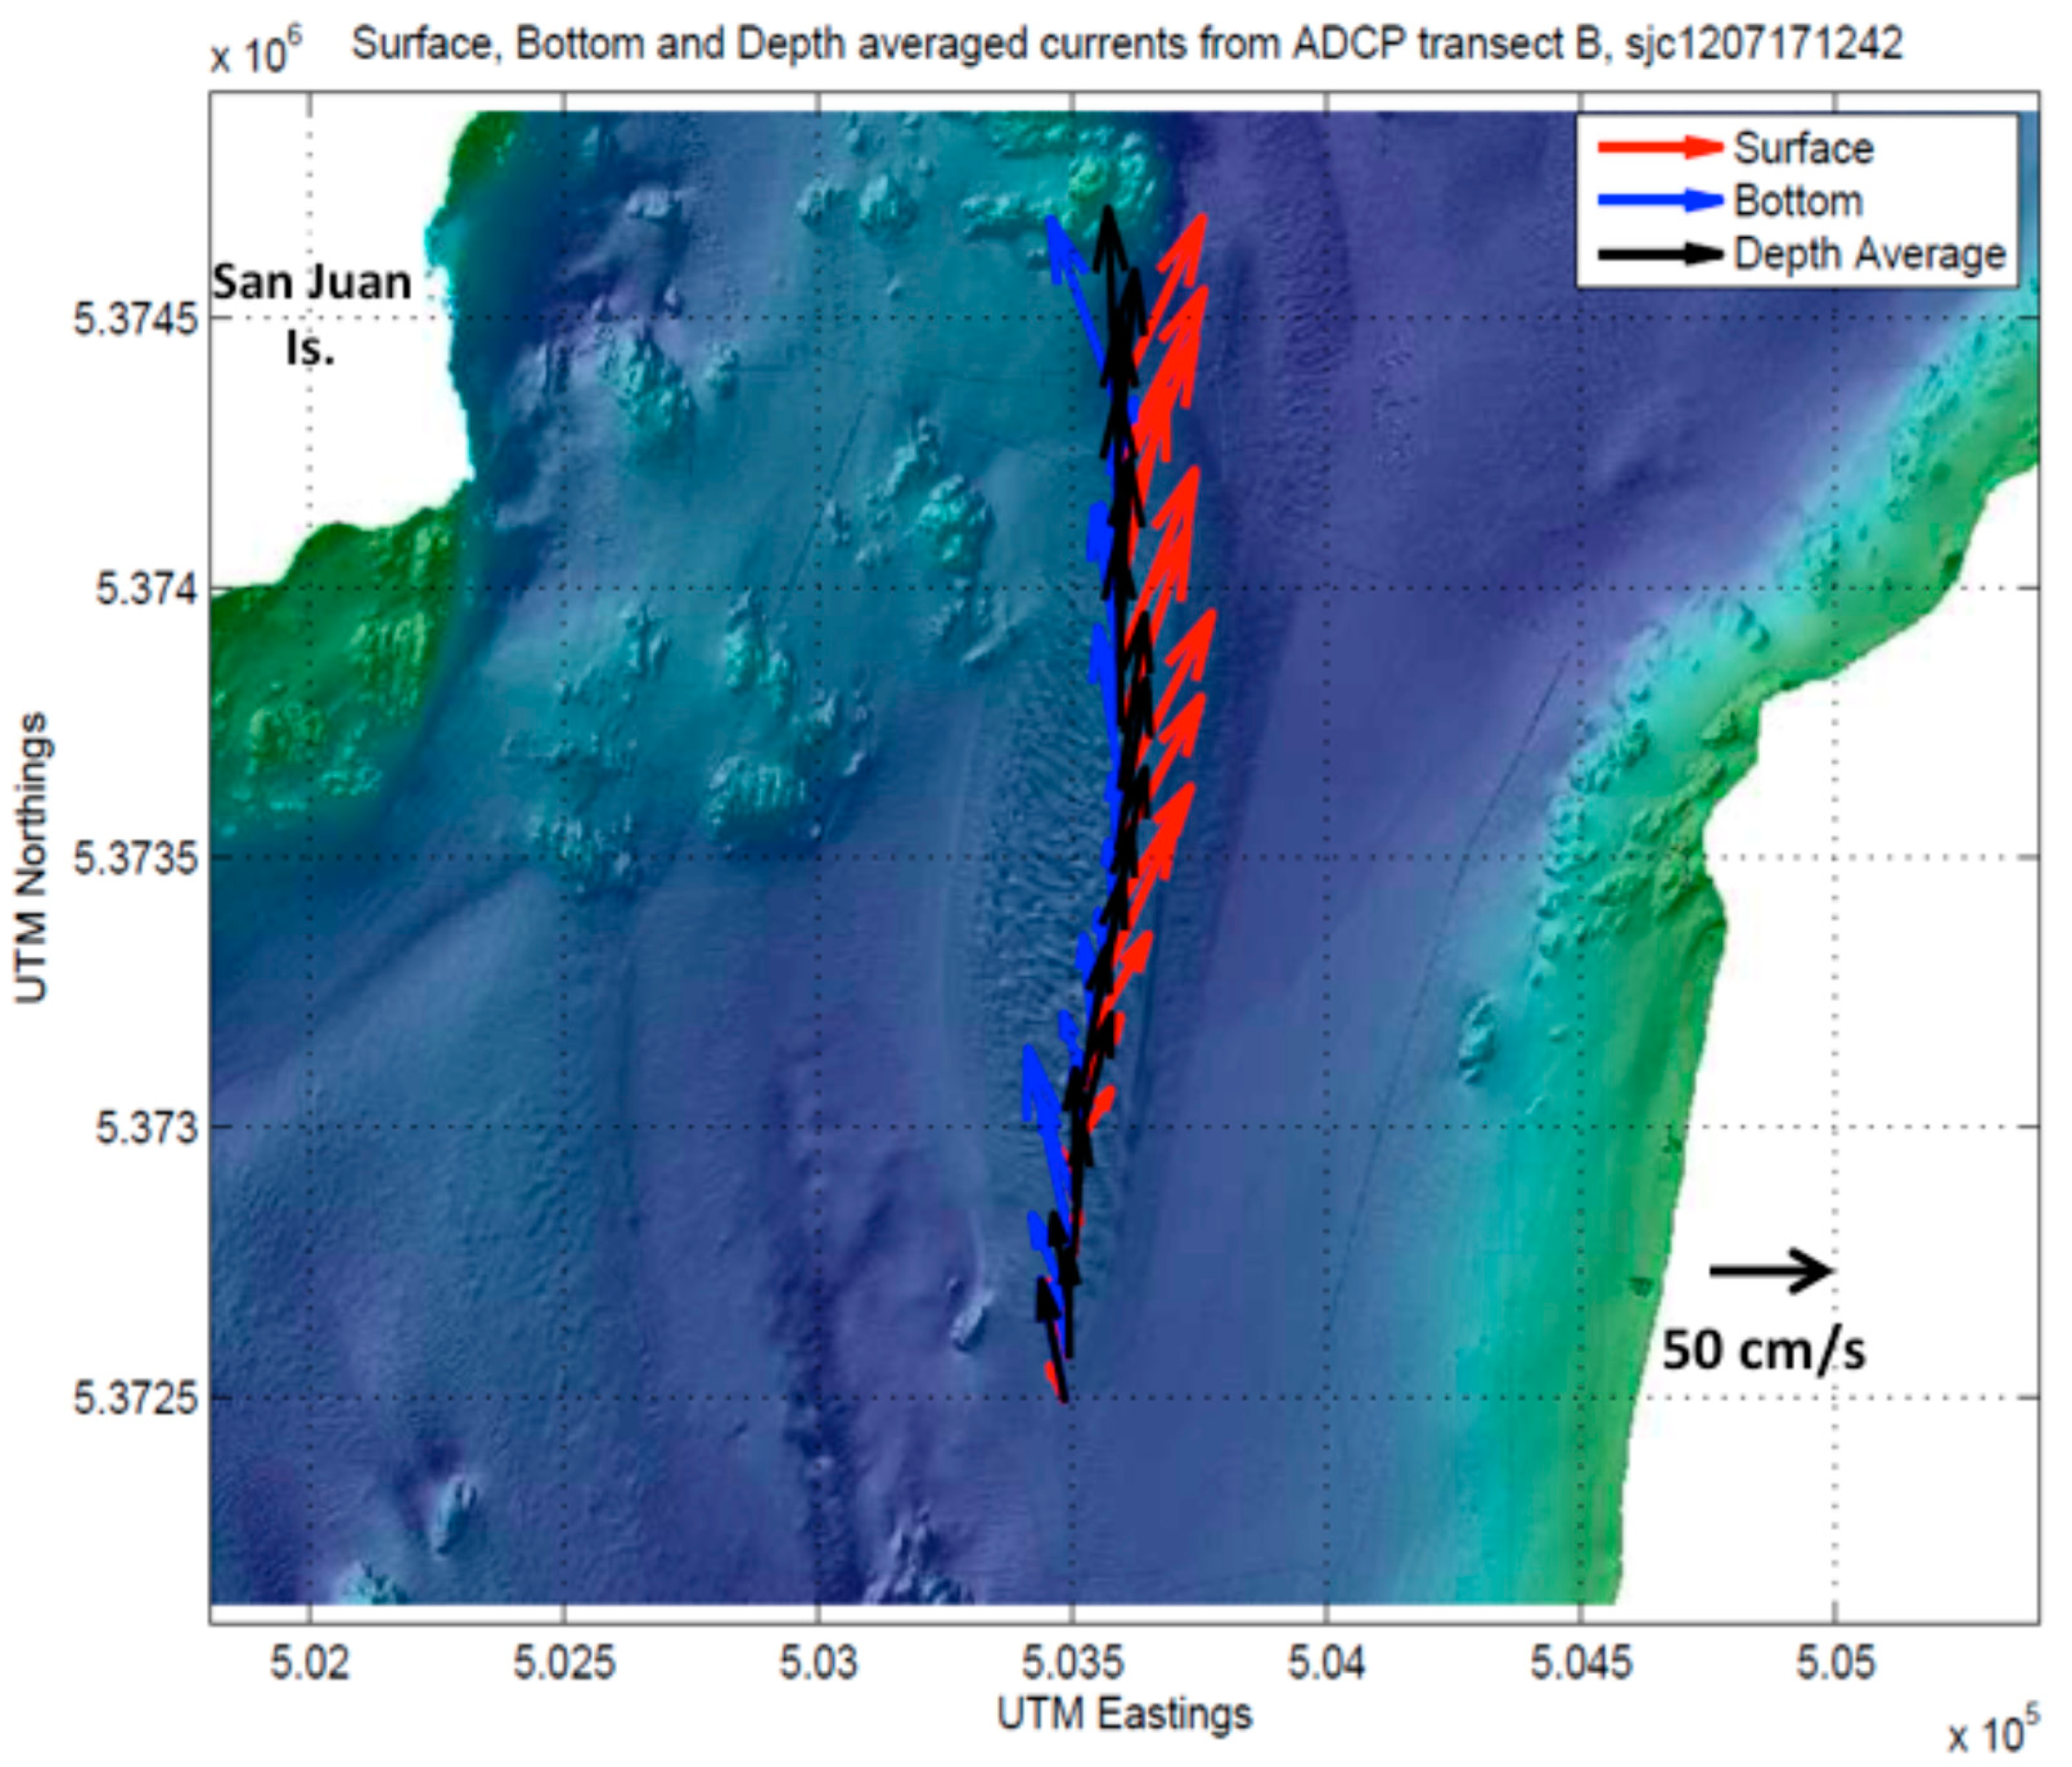
A summary of the depth-averaged current speeds and directions for each transect along with the speeds at the deepest reliable measurement in the profiles are shown in Table 2. Bottom current speeds exceeded depth averaged speeds in four of the seven profiles, indicating that the surface current speeds for these profiles were relatively lower than at the bottom. One N–S oriented current transect is plotted in Figure 6. Both surface and bottom currents were directed northward along the entire run. Maximum bottom current speed for this transect was 75 cm/s.

Figure 6.
Surface, bottom, and depth-averaged currents observed during ADCP transect B aboard RV Centennial at flood tide, 17 July 2012.
The three E–W oriented ADCP current transects had interesting spatial variability in bottom current directions. Bottom currents were directed toward the sand body on either side. This convergence toward the sand body might suggest a means to keep the boundaries of the sand sharply defined (i.e., sand transport has a convergent component toward the feature). Of course, given the limited data set, this idea needs further study. From the current profile data bed load transport was calculated using bed load equations of Van Rijin [34]. Estimates of transport were made for sediment sizes of 0.5 mm and 2 mm, characteristic sizes for bed sediment along the crests and troughs, respectively, of the large sand waves.
To estimate potential migration of the sand waves, we calculated their asymmetry and used the technique of Knaapen [23]. The migration rate C of sand waves was found by Knaapen [23] to be related to bedform asymmetry A, wavelength L, and sand-wave height H. This empirical relationship was developed and validated using 12 different sites in the North Sea where repeated MBES surveys were completed [23]. The technique has been applied in other geographic areas with tidal sand waves [22,23].
4. Results
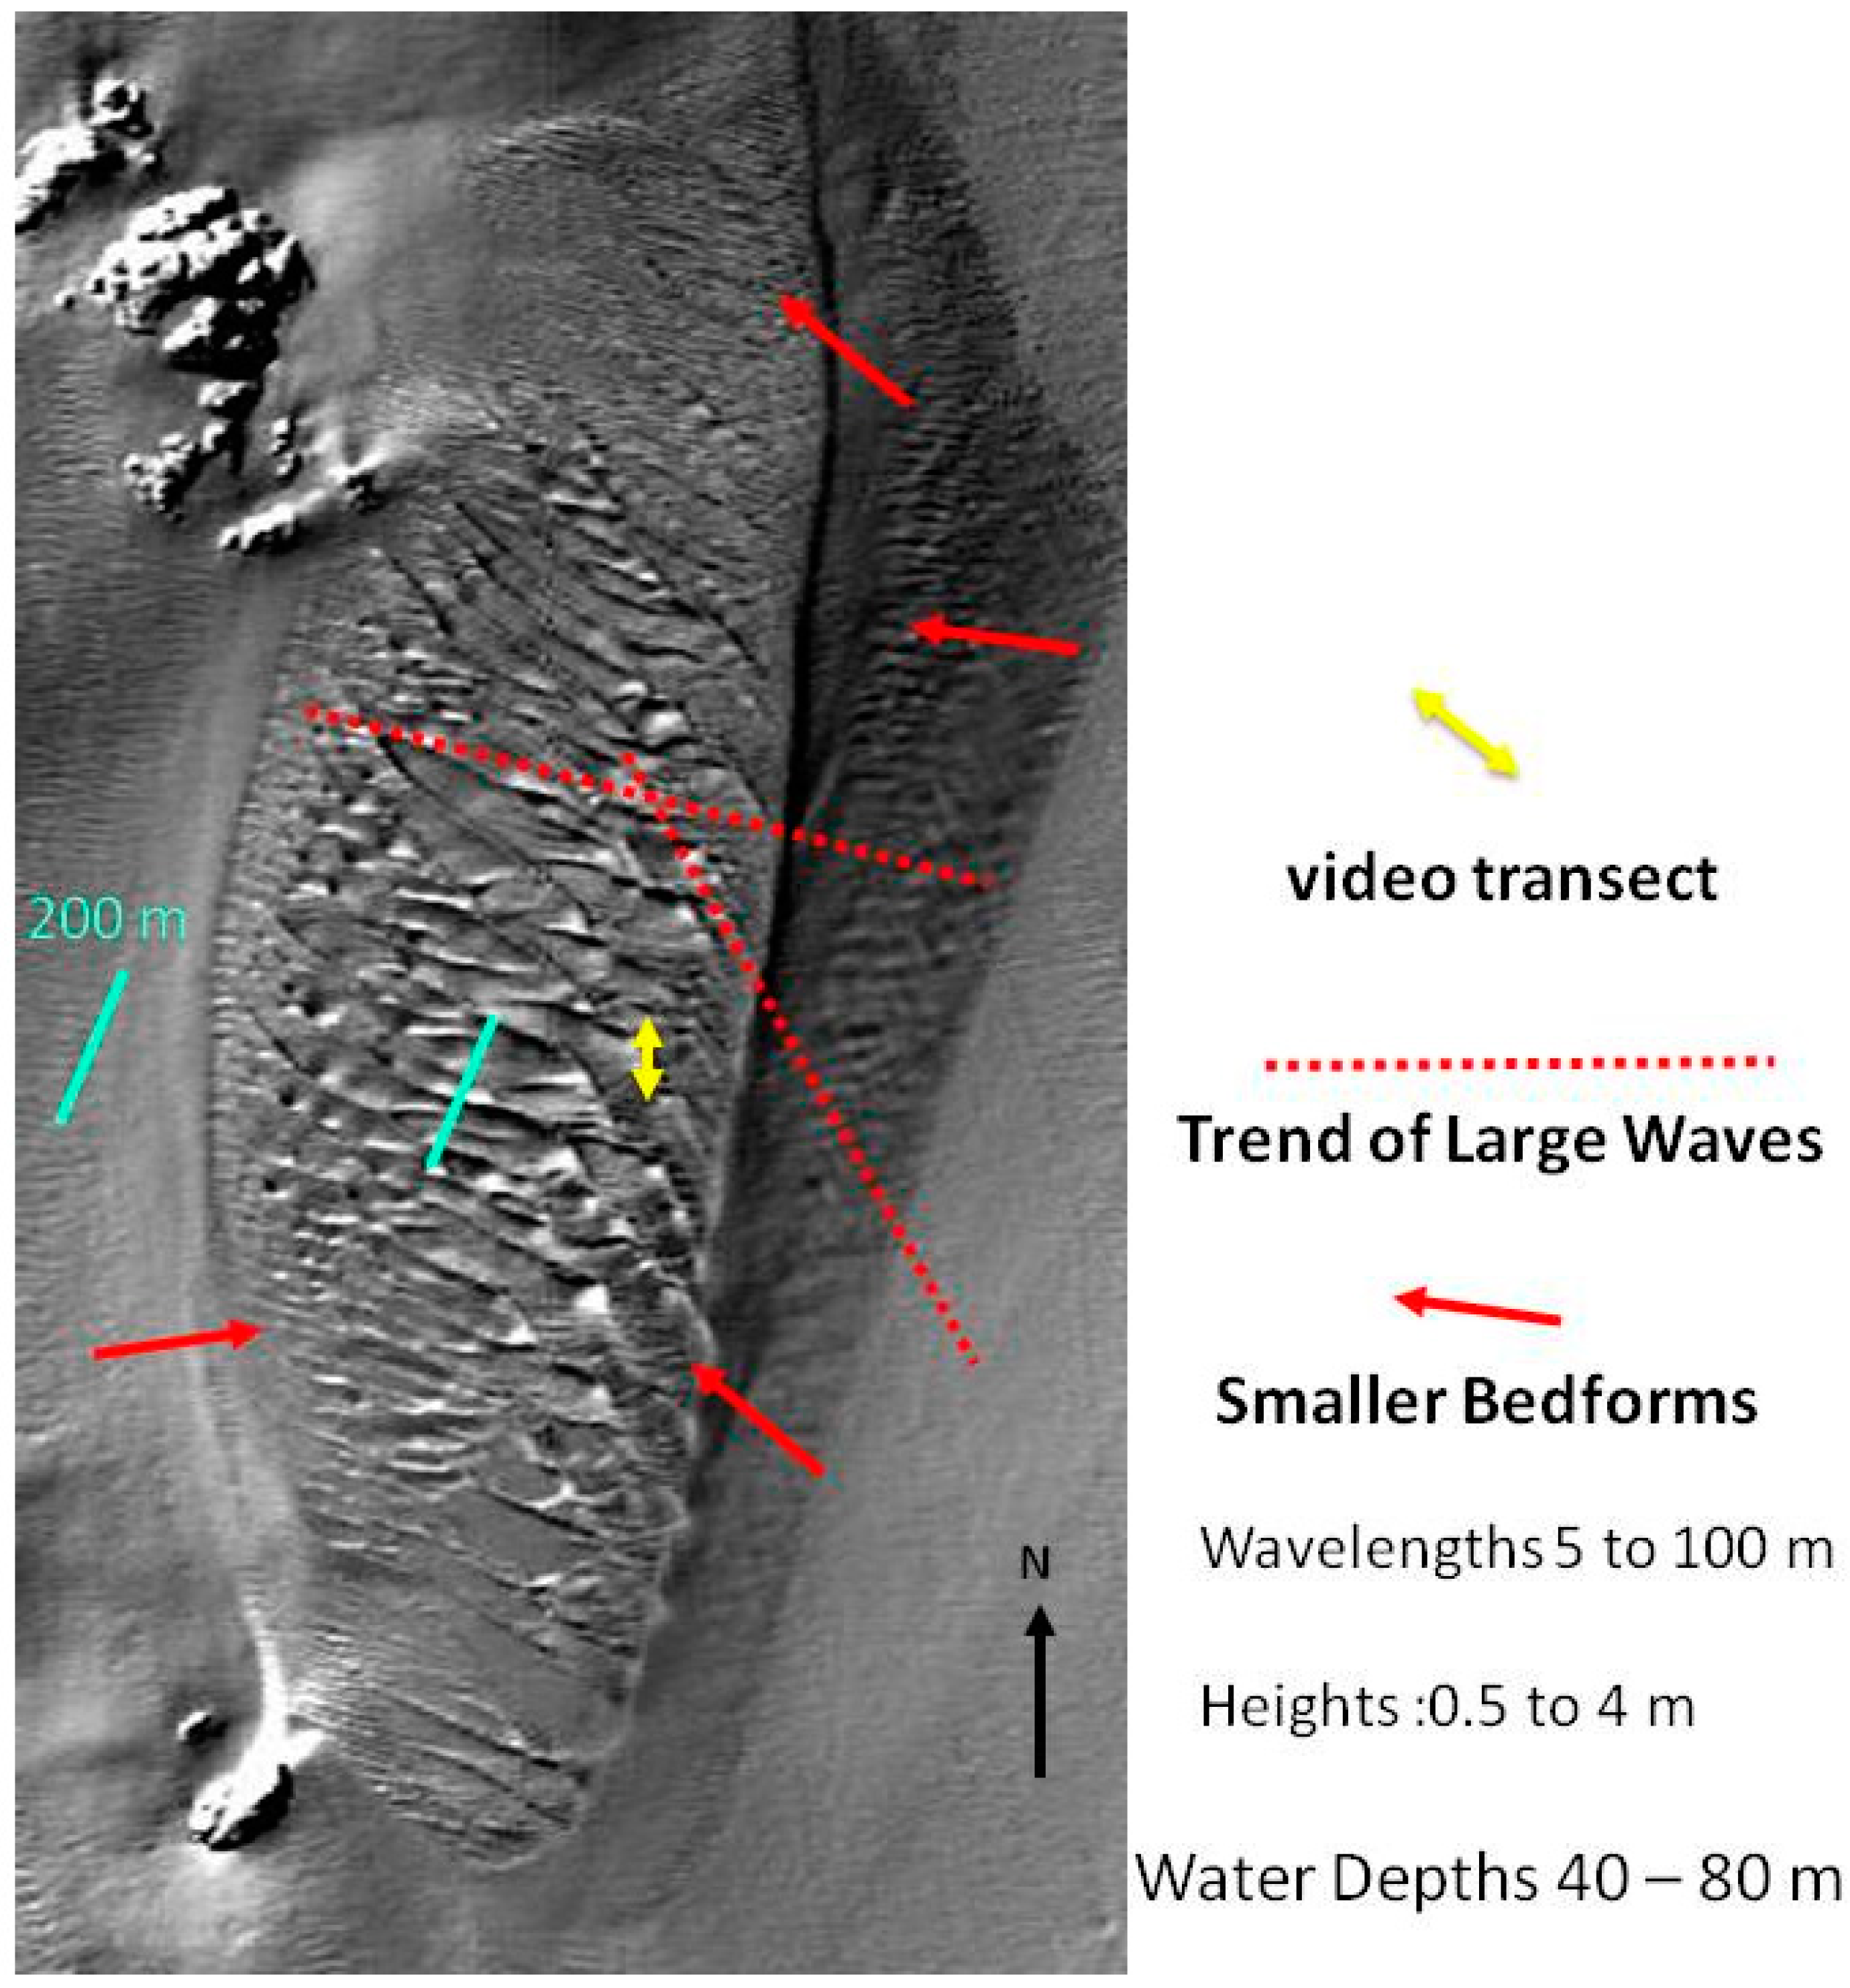
The seafloor map of the San Juan Channel sand wave field derived from MBES bathymetric data reveals multiple scales of bedforms (Figure 7). Large sand waves with heights H = 1 to 4 m and wavelengths L = 20 to 100 m have two distinct crest orientations, possibly related to steering by ebb and flood tidal currents influenced by the irregular rocky inland sea morphology. One set of sand waves oriented about 30 degrees counterclockwise from North appears to have longer crests and longer wavelengths than the more E-W set (Figure 7). Smaller megaripples and sand waves occur along the edges of the sand body. An enlargement of the sand wave field also shows small- to medium-scale sand waves (1 to 2 m wavelengths) between some of the larger waves, with crest orientations approximately E-W (Figure 7). In general, the large sand waves are nearly straight-crested and two-dimensional. Some bifurcations of the crest lines can be observed. Notice that some of the sand waves are contiguous with one another, with the lee side of one wave encroaching on the stoss side of the adjacent one, whereas others are separated by rippled flat areas that appear to be the glacial rubble surface upon which the waves were constructed (Figure 7).
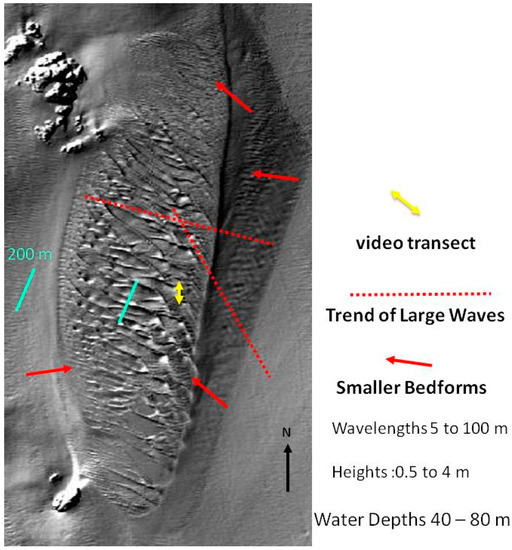
Figure 7.
MBES image of the San Juan Channel sand wave field that shows two different sizes of sediment waves from long high amplitude to short low-amplitude waves. Red solid arrows show where ripples and small amplitude sediment waves exist along the edges of the field, dashed red lines show orientation of large sand waves, yellow line with arrows shows video camera transect made to validate sediment type and morphology, and green lines are scale marks used to show wave lengths.
4.1. Sediment Analyses
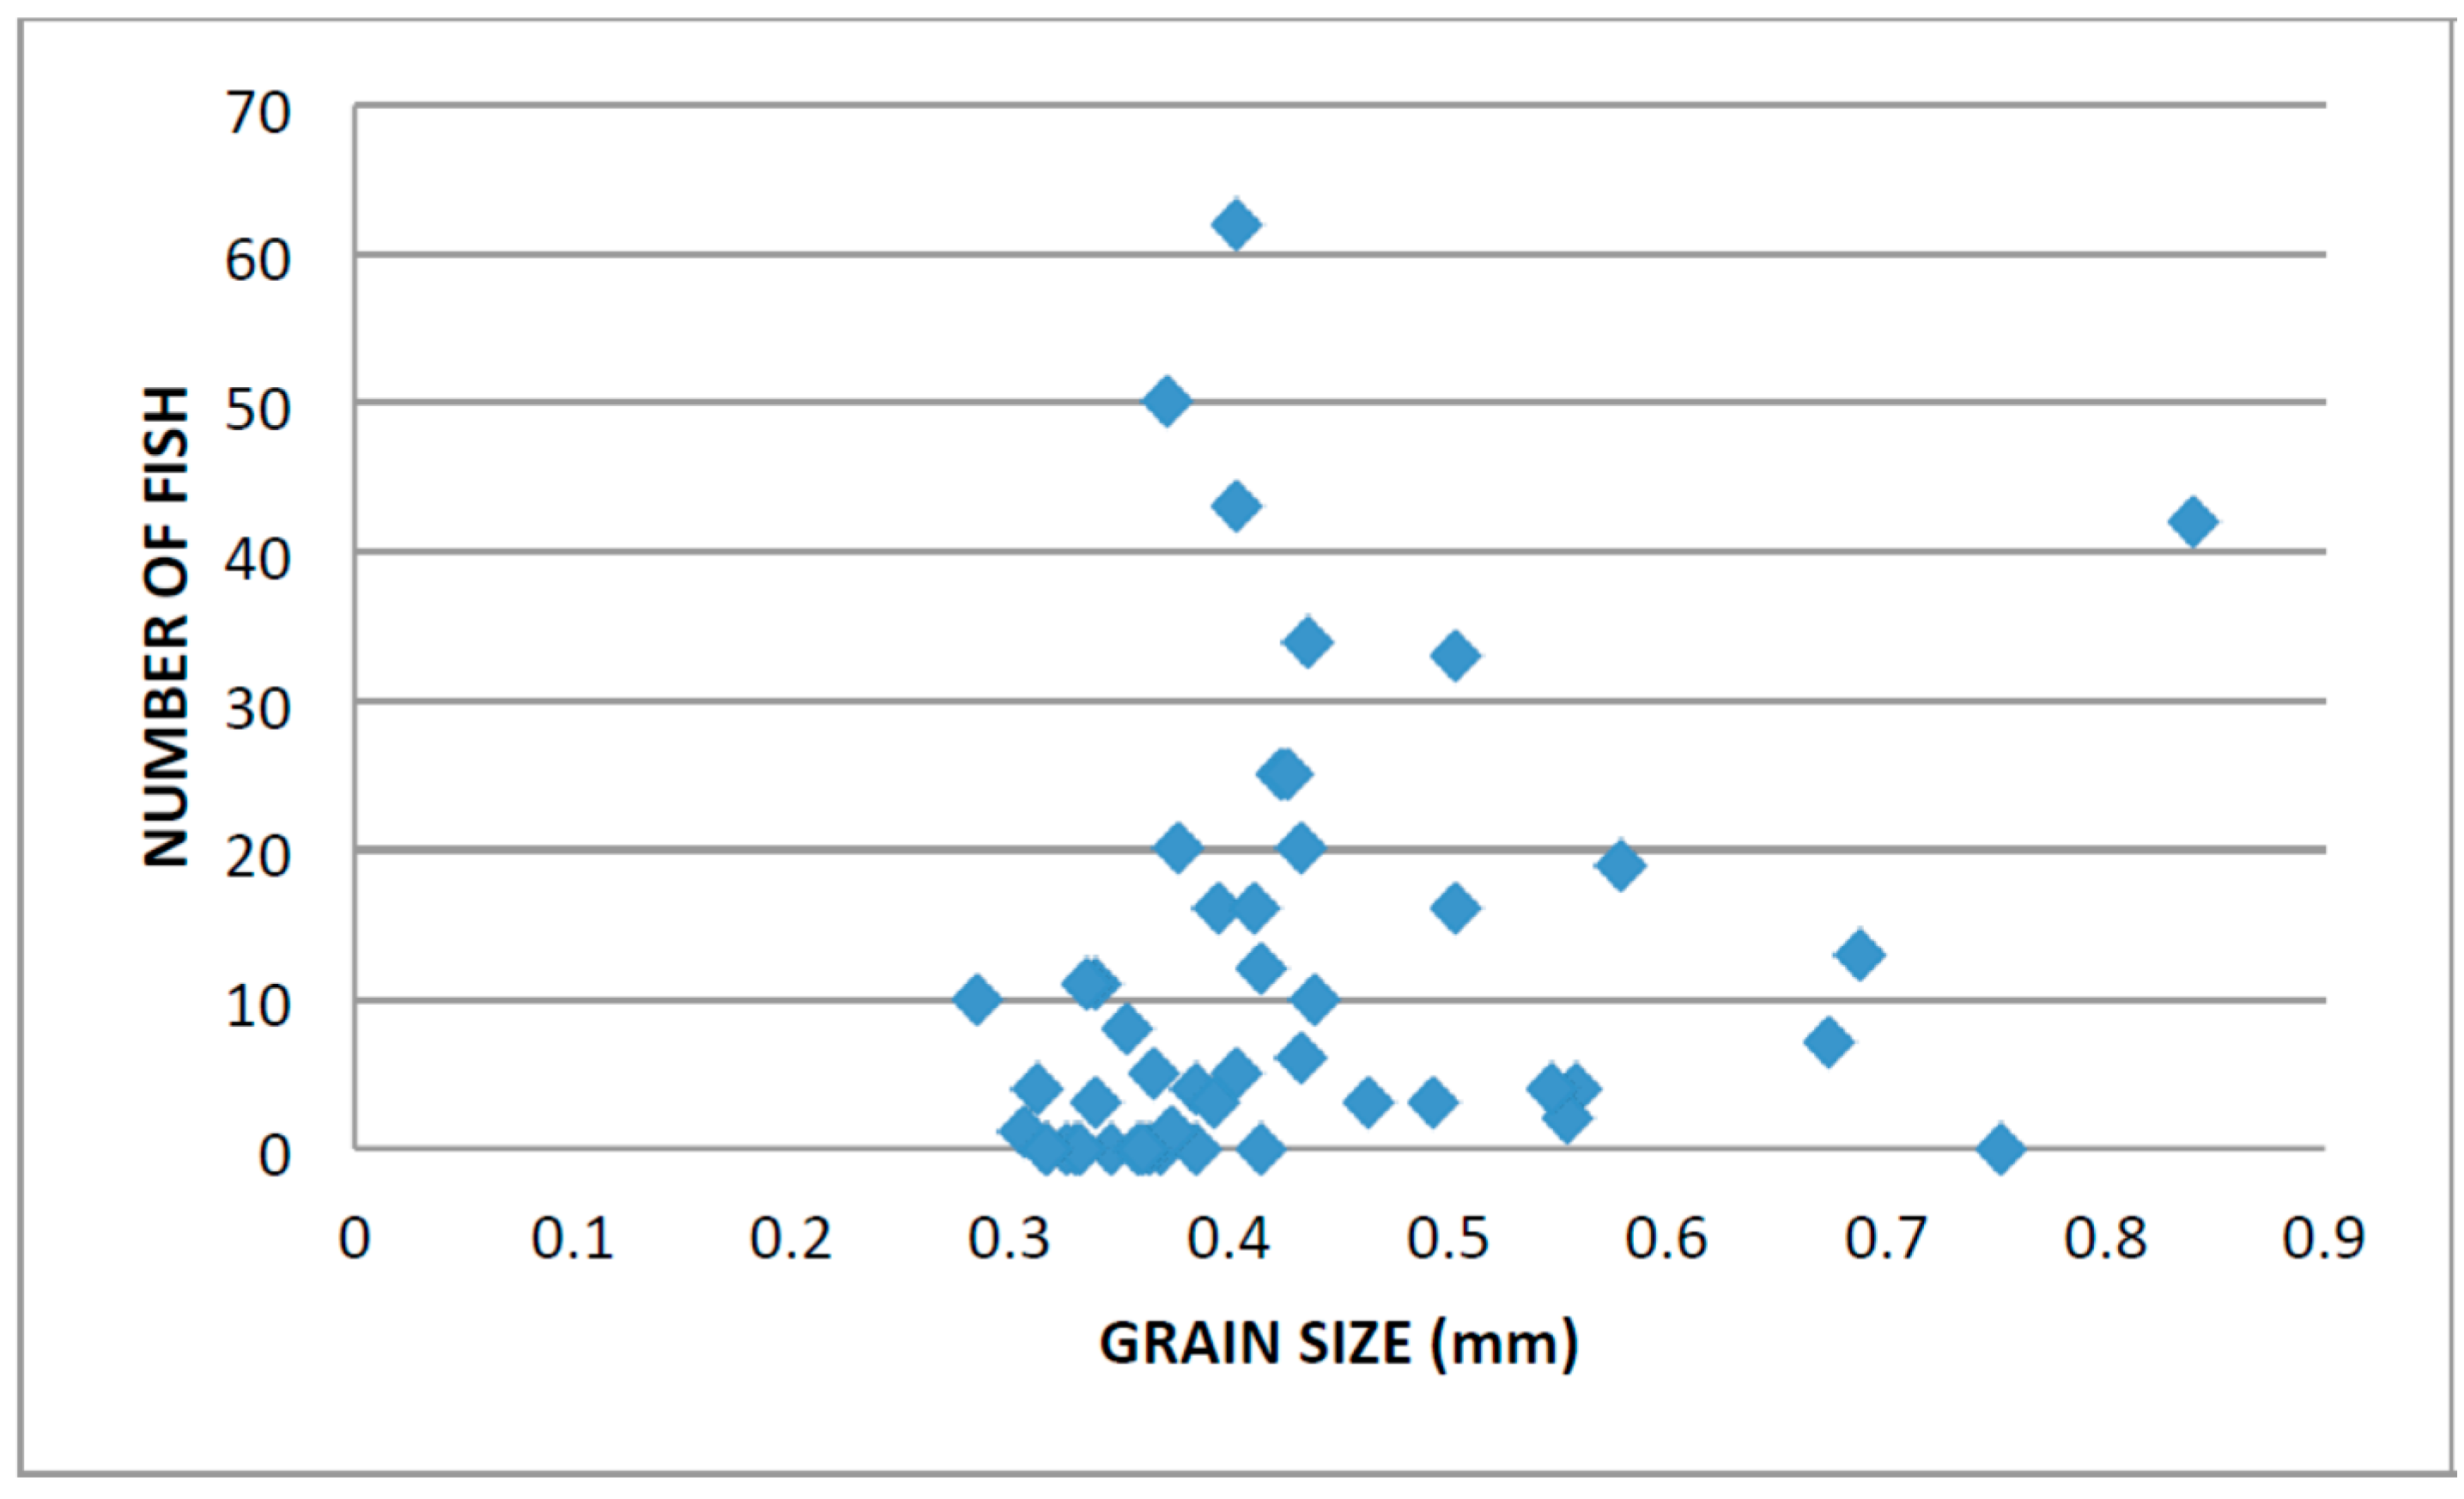
Grain size analyses previously made by Blaine [18] were repeated from samples collected during this study (Figure 8), confirming that the mean grain size within the San Juan Channel sand wave field is 0.5 mm with a fairly constrained range of 2 mm to 0.125 mm. The sea-floor photographs show that grains on the crests of sand waves have a median size of 0.5 mm (Figure 4b), which is significantly finer than in the troughs, where the median is 2.0 mm (Figure 4c). Also, irregularly shaped shell-like debris is common in the troughs. However, in areas where mean grain size is near 0.5 mm in the larger amplitude sand waves, a greater number of fish were captured (Figure 9, Table 1). The fish appear to generally concentrate in grain sizes that range between 0.25 to 0.71 mm with the highest number of fish (from 30 to 62 per sample) collected in sediment samples with mean grain sizes of approximately 0.35 to 0.5 mm. These results are consistent with that found by Blain [18].
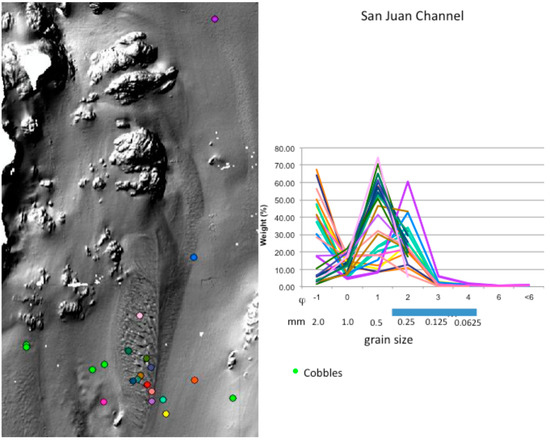
Figure 8.
Sediment samples [22] collected and analyzed for this study; (on left, MBES image) location of samples; color dots represent sample sites, and (right) graph of grain sizes from sieve analyses showing grain size distribution.
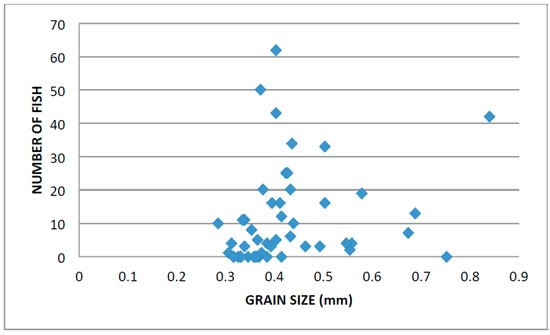
Figure 9.
Numbers of fish captured in sediment samples from the San Juan Channel sand wave field. The highest numbers of fish (from 30 to 62 per sample) were collected in sediment samples with mean grain sizes of approximately 0.35 to 0.5 mm.
The photos show loosely consolidated, well sorted, poorly packed sub-rounded to sub-angular grains separated by porous i))nterstices. The apparent good porosity of the sediment facilitates aeration that attracts large concentrations of PSL.
4.2. Sand Transport and Bedform Migration
Bedload transport estimates qb are plotted in Figure 10 against bottom shear velocities, u*b for the two dominant bottom sediment sizes. The coarser sediment (1–2 mm) has rather low transport rates (<1 kg/m/s) for u*b < 0.1 m/s. However, the finer sand (0.5 mm) that was sampled along the flanks and crests of the large sand waves is more mobile at intermediate bottom stresses. For example, at u*b = 0.08 m/s, qb = 2 kg/m/s.
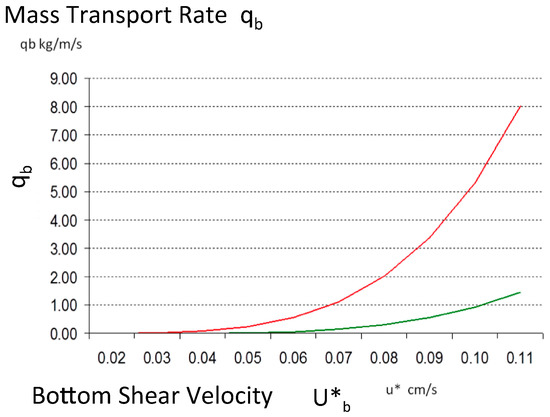
Figure 10.
Graph showing mass transport rate of bottom sediment for the San Juan Channel sand wave field based on methods of Van Rijin [34] for grain sizes of 0.5 mm (red line) and 2.0 mm (green line).
Assuming a conservative value of u*b = 0.05 m/s for tidal currents, based on converting depth-averaged current speeds in Table 2 to bottom shear in tidal flow over a rough bed [35], an estimate of sand wave migration can be made [36].
V is bedform migration speed, ρb sediment bulk density, and H is bed-form height.
Using Equation (1) for quartz sand (our visual inspection indicates that the sand is arkosic, quartz-rich), a sand wave with H = 3 m would migrate about 0.15 m/h. Since San Juan Channel tides are mixed, tidal current reversals occur nearly every six hours. Also, the limited current profile data from this study, and from that of Ewing’s [21] suggest that ebb and flood currents are of similar magnitudes (with flood slightly higher in the limited measurements). These results indicate that the large sand waves would have a small net northward migration (<0.15 m/h.) suggesting that no large supply of sediment is necessary to maintain the field and the field is primarily composed of relic glacial deposits. Because of the limited data and lacking time-series measurements of currents closer to the seabed, this result is only suggestive of small to nil sand wave migration.
4.3. Sand Wave Asymmetry
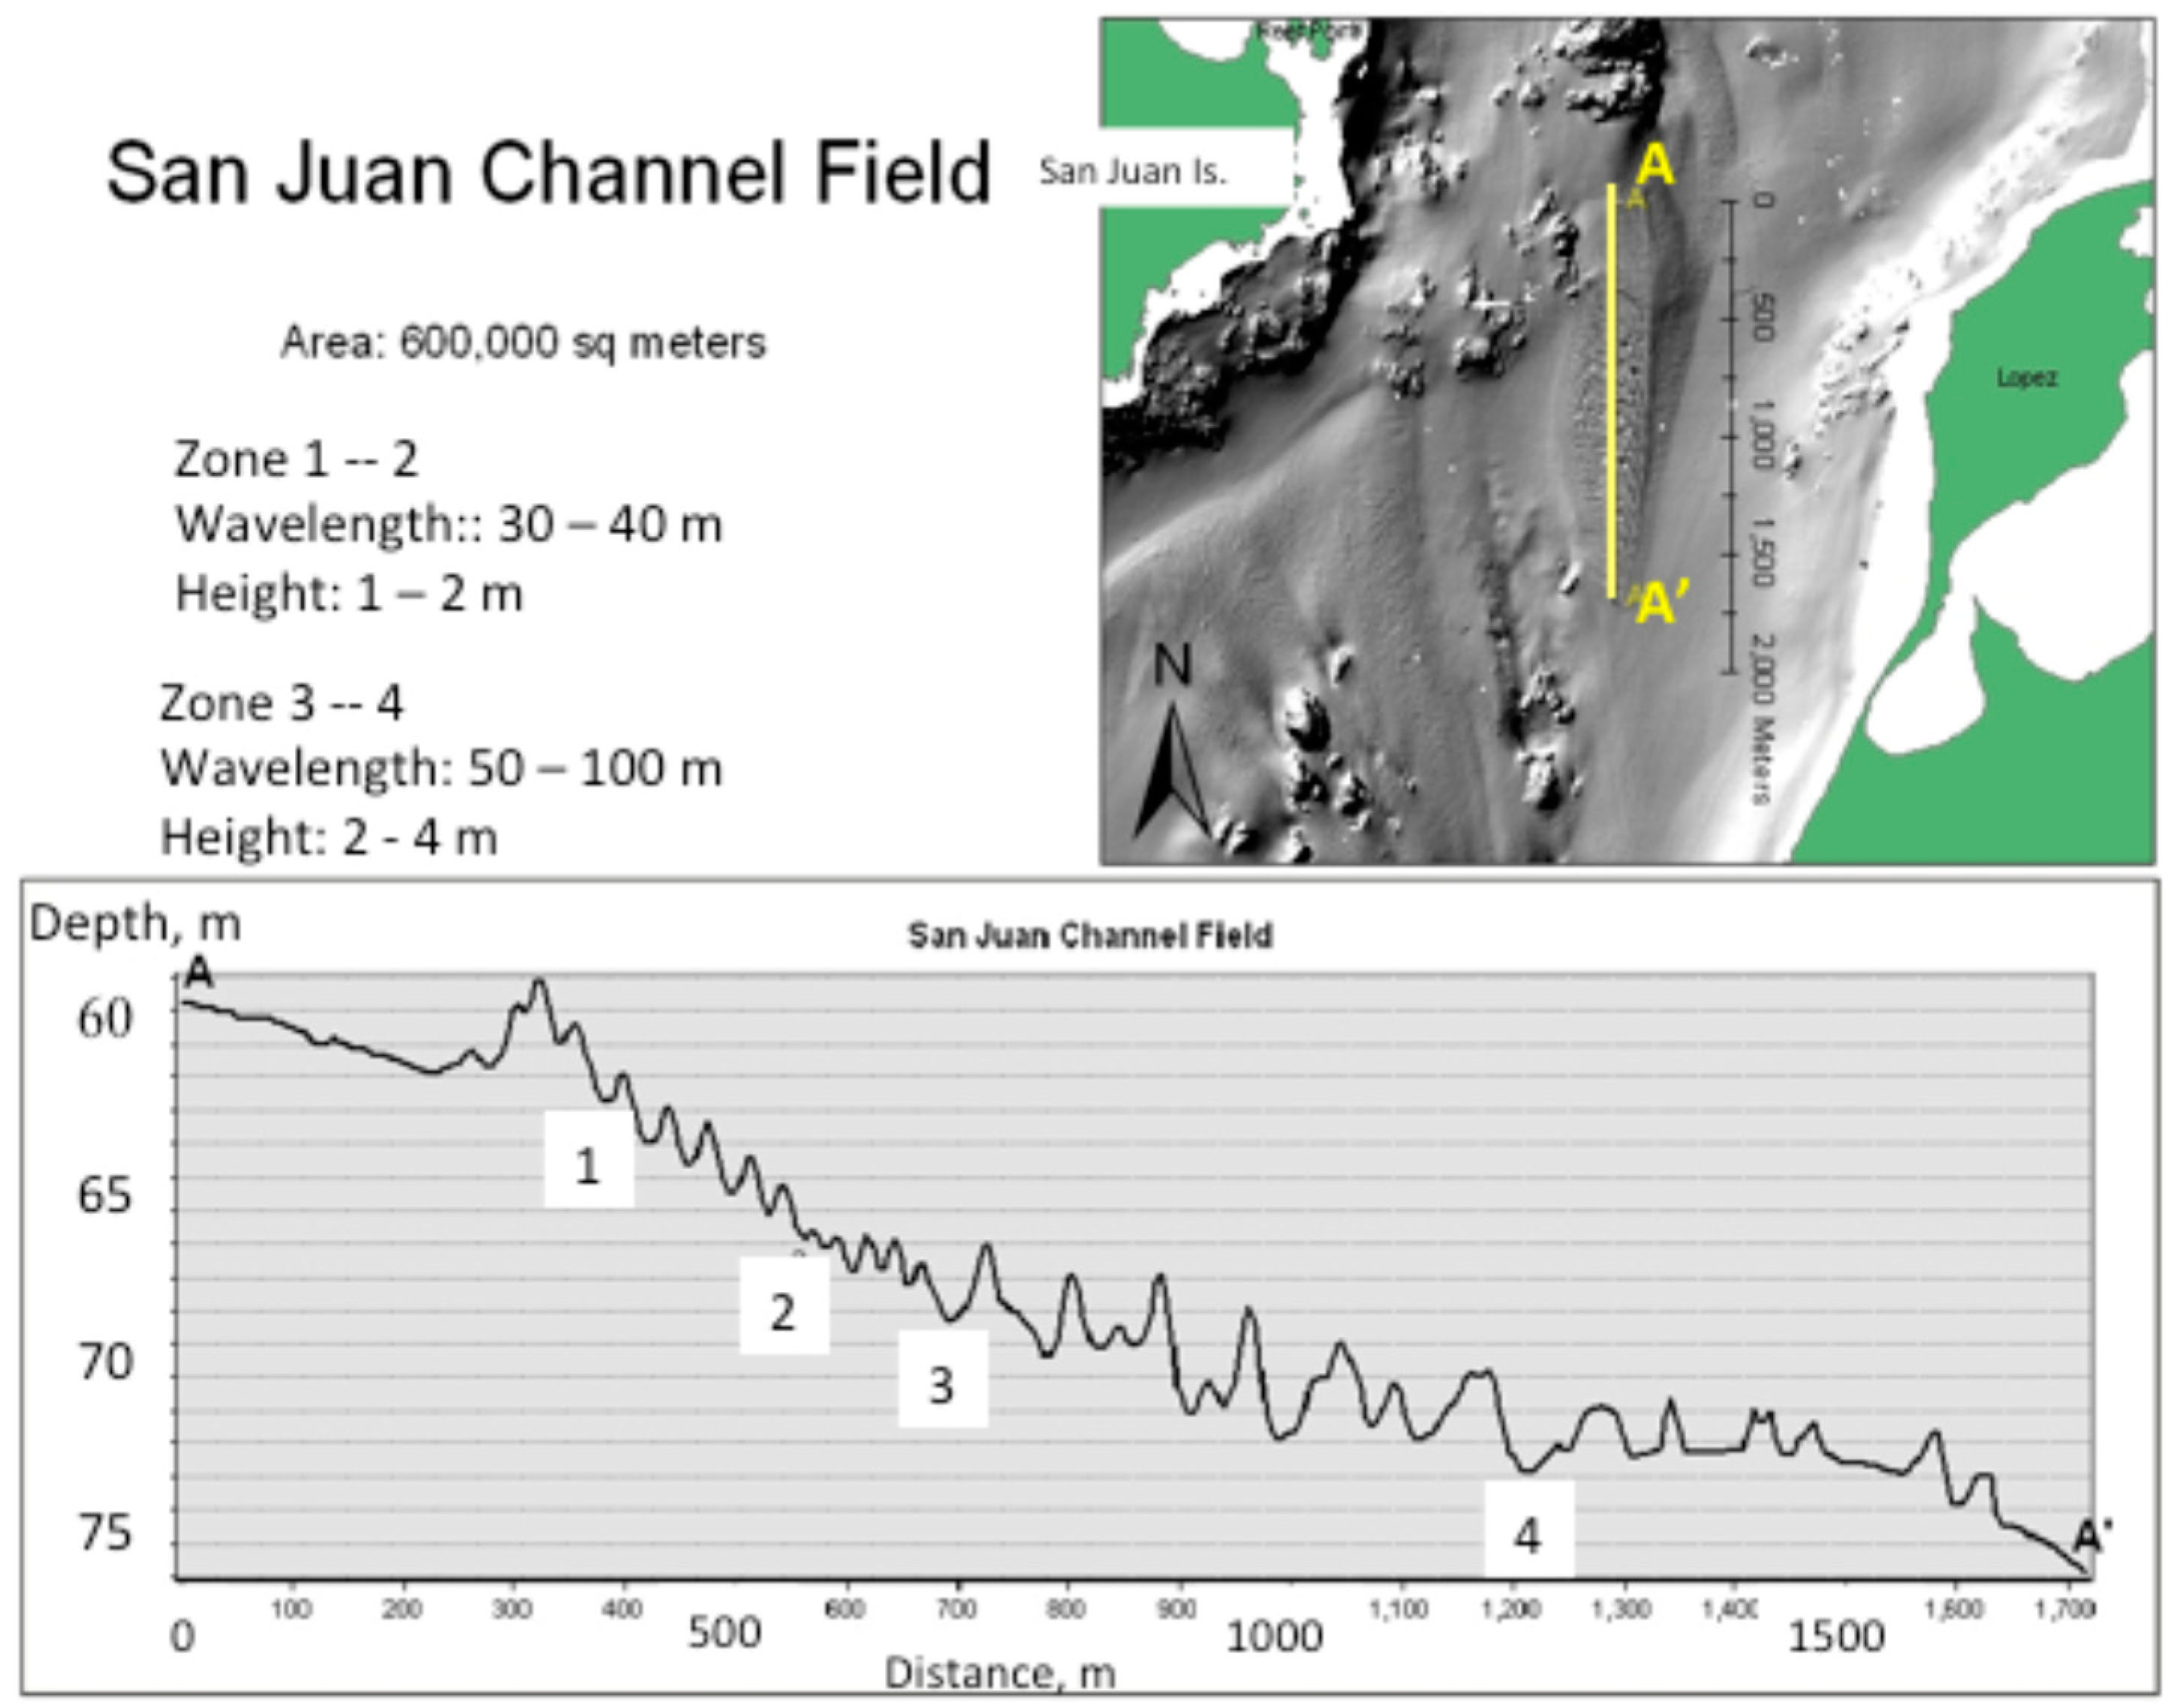
The sand waves in the San Juan Channel sand wave field can be grouped into two classes (zones) based on size and shape. Nearly symmetric smaller sand waves were found toward the shallower parts of the sand body (Figure 11 and Figure 12). These sand waves in zone 1 to 2 appear sharp and well defined with slightly steeper flanks facing north (Figure 12). The sand wave heights are 1 to 2 m, and wavelengths 30 to 40 m. The sand waves in the deeper section of the sand body in zone 3 to 4 are larger and appear more irregular. The overall impression based on shape and water depth is that these deeper bedforms are inactive and possibly relict from a time of lower sea level. This appears to be consistent with multiple years of MBES surveys over the sediment wave field that suggests little or no change in sediment wave morphology or overall configuration of the sand body (Figure 11).
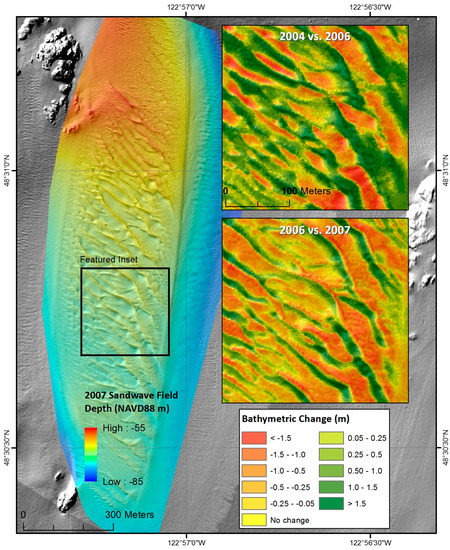
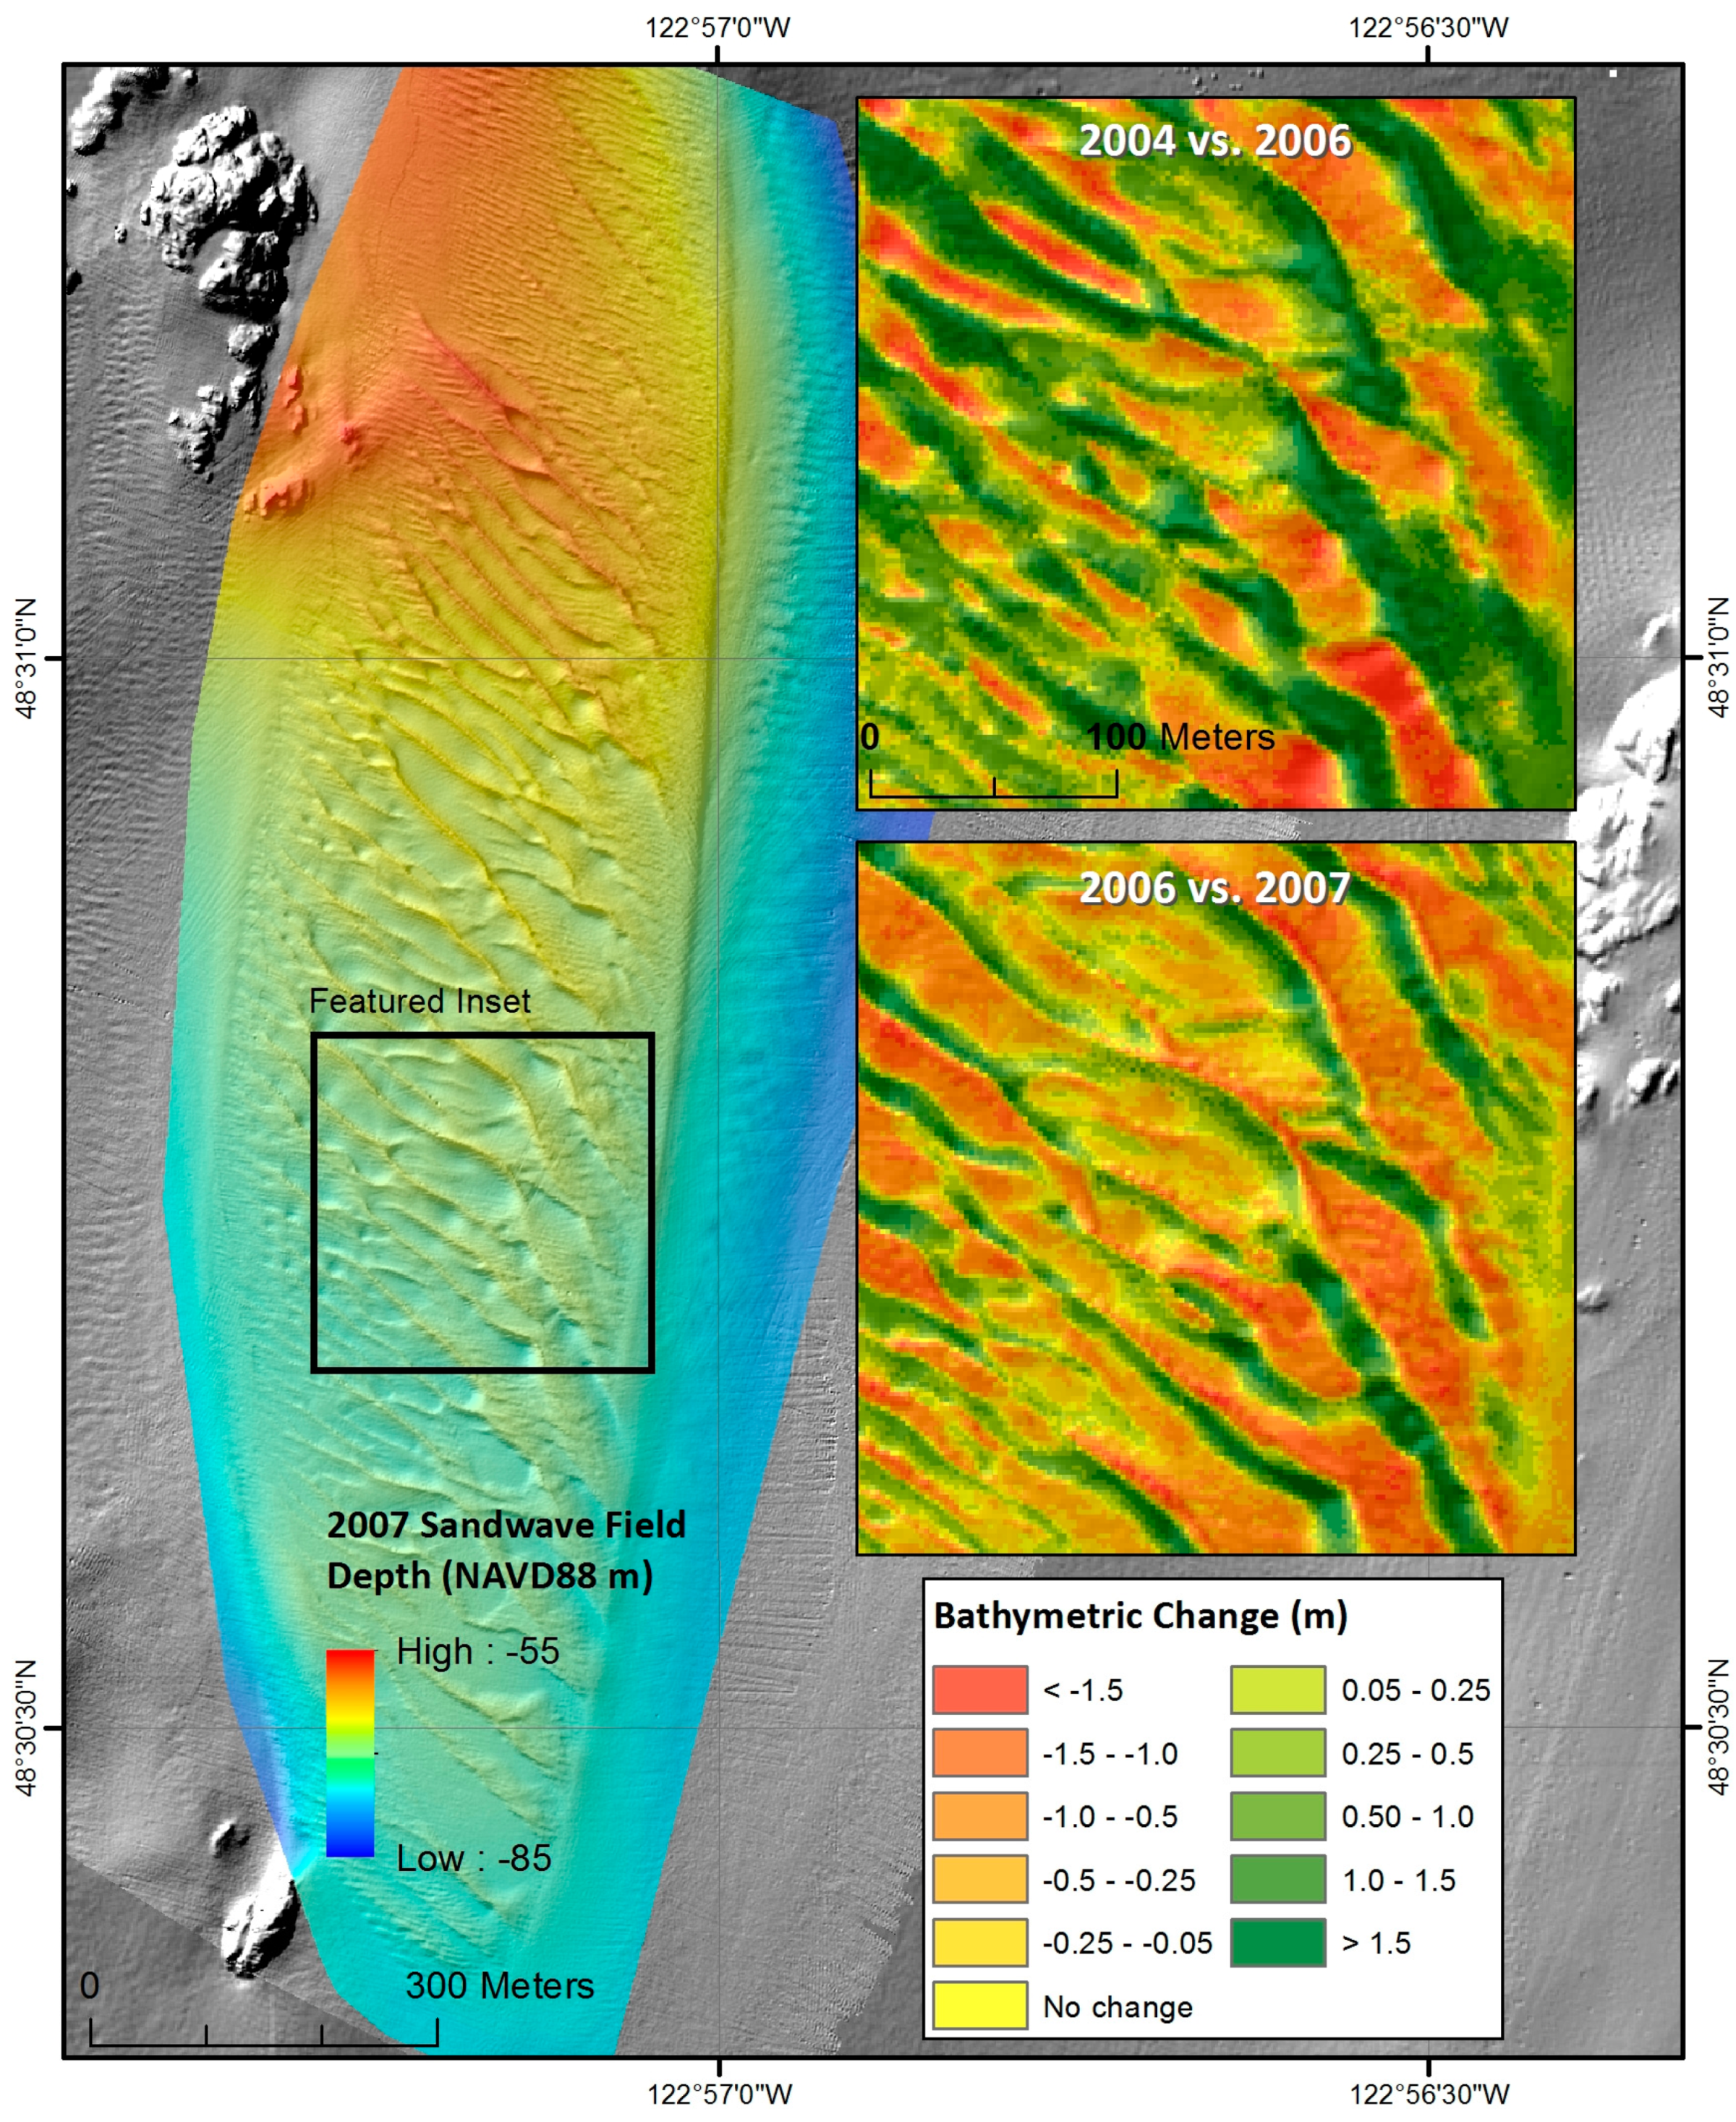
Figure 11.
MBES bathymetric image of San Juan Channel sand wave field collected in 2007 with comparisons of changes between years 2004 and 2006 and between 2006 and 2007. Note how the general wave morphology is consistent from one year to the next but that slight sediment erosion (warm colors) and accumulation (green colors), probably the result of shifting back and forth of the sand waves, have occurred.
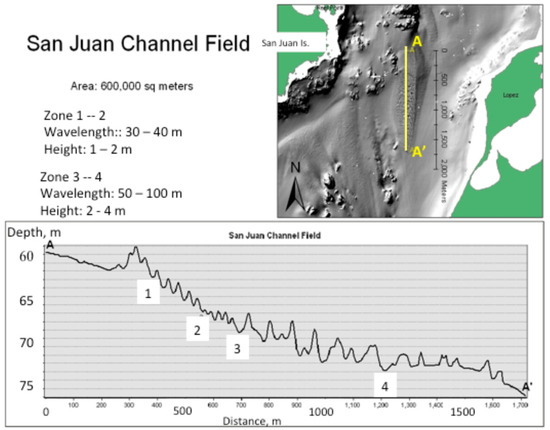
Figure 12.
MBES bathymetric imagery and cross-section (A-A’) of the San Juan Channel sand wave field showing two different sections (1–2 and 3–4) of sediment waves of differing sizes.
Figure 12 summarizes the results for sand wave migration in the central San Juan Channel using the most recent MBES survey data. Sand waves are predicted to migrate at low rates for all classes (<6 cm/year). This low rate agrees qualitatively with the estimates based on sediment transport calculations (Table 3).
Table 3.
Estimate of Migration Rates from Bedform Shape.
Knappen [23] found migration rates of 5 to 800 cm/year based on 12 sites in Southern North Sea and English Channel. Figure 12 estimated sediment migration rates based on bedform shapes in the San Juan Channel sand wave field.
4.4. Bed Phase Diagrams
Current, grain size, and water depth data collected during this study were plotted on bed phase diagrams that had been developed for San Francisco Bay [27]. The results shown in Figure 13 include samples from water depths of 20 to 80 m within the sand wave field in the central San Juan Channel. Depth averaged current speeds ranged from 40 to 80 cm/s (Table 2). The sediment sizes that were used to develop the two bed phase diagrams for San Francisco Bay include the two major bottom sediment size classes for the central San Juan Channel sand wave field (0.5 and 2.0 mm).
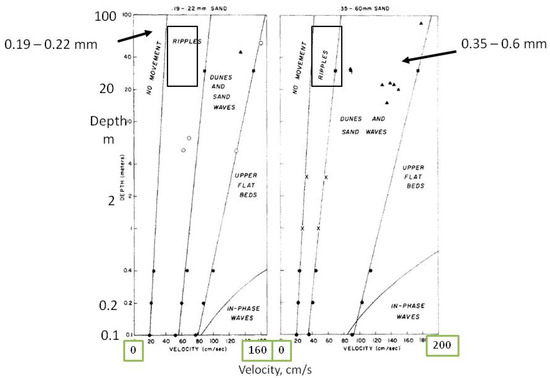
Figure 13.
Bed-phase diagram for San Francisco Bay developed by Rubin and McCulloch [27] whose observations were combined with those of Southard [25], Boothroyd and Hubbard [37], and Dalrymple and others [26]. Black boxes are for data collected by this study in the San Juan Channel.
The plots show that the size-depth-speed data from the San Juan Channel sand wave field fall into the ripples-sand wave portion of the diagrams. If depth-averaged currents increase substantially beyond the maximum measured depth-averaged speeds the stability of the sand waves might decrease, leading to significant change to the sandy habitat.
5. Discussion
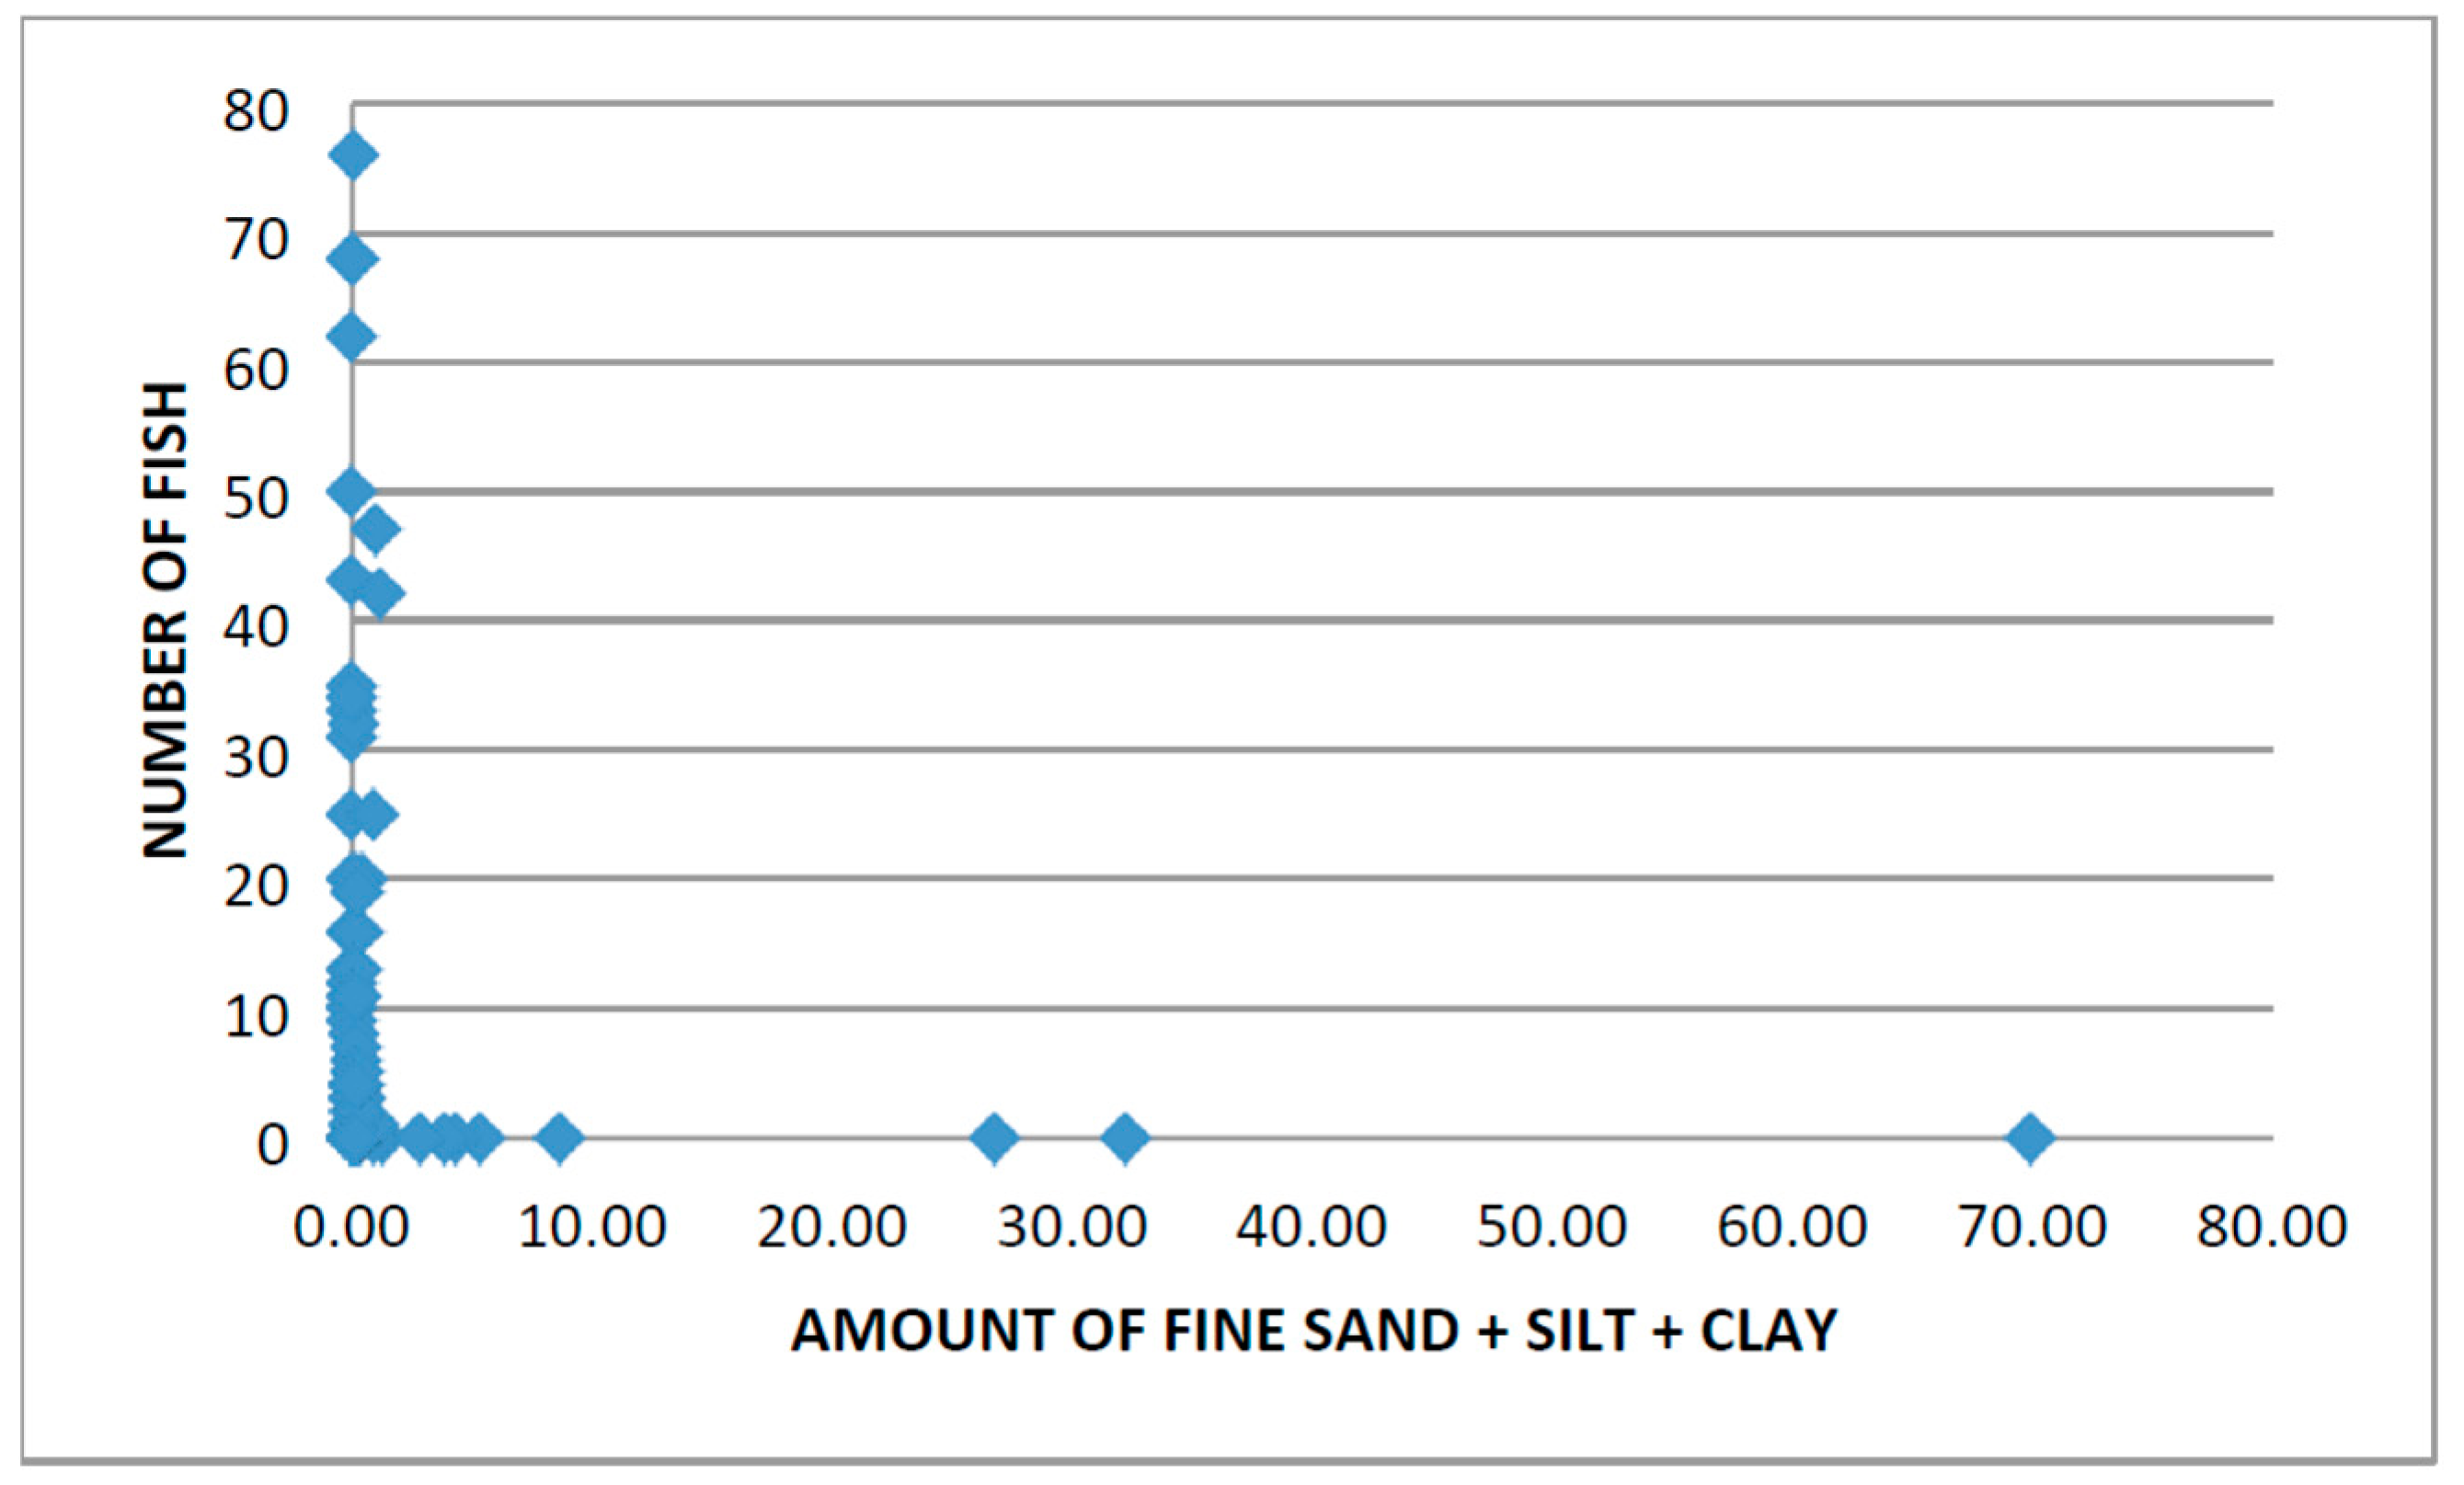
Several studies of PSL and sand-eel habitats show that these fish prefer sand habitats consisting of medium- to coarse-grained sand of 0.25 to 1 mm in size [8,11,14,18,38], and our results show that PSL select bottom sediment between 0.25 to 0.71 mm in the San Juan Channel sand wave field. Experimental studies (e.g., [38,39]) also show that PSL prefer this range of sediment grain sizes. Furthermore, our results and others (as cited above) show an absence of PSL if the sediment contains more than a few percent (~5%) of fines (fine sand + silt + clay-size material; Figure 14). The preferred sediment is clean, unconsolidated sand that can be easily penetrated, and has an adequate and readily replenished supply of oxygen [5,11,14,39]. If fines such as muds are present, even in small amounts, the gills of the fish can be clogged [39] and the pores of the sediment filled, reducing permeability.

Figure 14.
Number of fish in grab sample versus amount of fine sediment (grain size finer than 0.25 mm).
Our results are consistent with that found by Blaine [18] indicating that the San Juan Channel sand wave field is not significantly altered through time. In addition, the field appears to be consistently attractive to the concentration of PSL, as generally no large changes in density of fish have occurred in the past 10 years of study.
Currents were previously measured during ebb tide in the same area, and were found to have velocities similar to those shown here for flood currents [21]. The ebb current profiles were taken with the same ADCP system during November 2011, and cross-sections of currents showed bottom current speeds as high as 70 cm/s [21].
The large sand waves in the central San Juan Channel sand wave field likely have low to nil net migration at present time, based on two independent estimates (i.e., sediment transport calculations and bedform asymmetry). This is further supported based on observations of the resultant bed phase diagrams that relate bottom sediment size, water depth, and depth-averaged current speed to bed phase, indicating that the sand wave field in the central San Juan Channel is stable. However, at substantially higher current speeds the sand waves could be eroded, and the sand body geometry changed to planar bed.
As sea level rises, the volume of tidal flows through the straits at the northern and southern ends of the San Juan Channel might produce higher currents within the channel and on the seafloor. These higher currents could lead to erosion and loss of sand (to upper planar bed) in the channel, and endanger the sub-tidal habitats for PSL.
The strong ebb and flood flow currents appear to generate and maintain sand wave fields with sharp, well-defined boundaries as illustrated in the San Juan Channel sand wave field and other fields such as found off Ice Berg Point of southern Lopez Island and offshore of northern Sucia Island [8] from which we have collected PSL. In contrast to the study of Wright [11] on North Sea sand-eels, we found no evidence that an abundant supply of sand was necessary for maintaining well-aerated sediment for the occupation of PSL. However, similar to the studies of Mercer [9], Meyer [40], and Pinto [39] that found that ripples within the sand field were tangential to the tidal stream and tended to be symmetrical indicating bedforms produced by oscillatory flow, we too found that tidal oscillatory motion produced small scale symmetrical bedforms in the San Juan Channel sand wave field.
No evidence for net sediment transport was found, and we propose that the sand wave field is composed of glacially-derived sediment winnowed through strong current flow, which leaves a well-sorted sand lag deposit that continues to be well-aerated through tidal oscillatory flow. Wright [11] found that sediment permeability in addition to ripple geometry and water percolation better characterized sandeel habitat preferences. Based on eyeball camera data we found that the most desirable sediment characteristics preferred by PSL are concentrated near the crests of the sand waves, which are regularly refreshed by the strong tidal flows.
6. Conclusions
The central San Juan Channel sediment wave field represents an extensive sub-tidal (deep water) habitat feature for PSL, an important forage fish in the Salish Sea. This field contains bedforms with wavelengths up to 100 m and heights of approximately 1 to 4 m within its central area. Smaller sand waves and megaripples are superimposed upon the large sand waves and fringe the sharp edges of the field. Furthermore, two major crest orientations were detected, one with nearly E–W (~280° or W10° N) trend and another with a NW–SE (~315° or W45° N) trend (Figure 7). We used a unique shipboard digital underwater camera (referred to as the “eyeball” camera) to take close-up high-resolution photographs of the seafloor that enabled calculation of median grain sizes [27] and facilitated the observations of consolidation, packing, lithology, and interstitial spaces of the sand waves. Two of these photographs, one located in a sand-wave crest and the other on the adjacent trough (Figure 4b,c) show that the grain size at the crest of a wave is significantly finer (median sand ~0.5 mm diameter) than that in the trough (~2.0 mm median diameter). In addition, the eyeball camera data show finer, better-sorted sediment on the flanks and crests of the larger sand waves. Furthermore, biogenic shell material dominates in the troughs whereas siliciclastic grains dominate on the flanks and crests, thus we can determine the position on a waveform (crest or trough) from which a sample was taken. We used these grain sizes to evaluate the stability of the sand wave field and validate PSL occupancy. Our results suggest that the field is stable, suggesting that other dynamic bedforms exhibiting similar characteristics need to be identified to conserve and sustain these critical forage fish habitats.
It is important to note that sediment grain size is not the only control on the presence/absence of fish in grab samples. For instance, PSL abundance within the sand field varies with time of day, season, and year, irrespective of the suitability of the sediment texture (temporal control). Chemical contamination (e.g., petroleum) and presence of certain seafloor flora (e.g., eelgrass) are other documented potential controls [5,39]. For example, in their North Sea studies on sand-eels Holland and others [14] discuss how grab samples without fish can be portioned into two groups: (1) unsuitable habitat, and (2) suitable habitat but unoccupied by fish. These authors go on to state that only “(2)” should be considered in measuring mean density of fish, and the estimate obtained is the estimate of fish density in suitable habitat. When combined with seabed habitat mapping grab sampling can be directed to those areas where fish habitats are located [14]. Therefore, our study of bedform morphology and processes forming these bedforms is useful in identifying areas where fish might be located and sampled.
Although we focus on sediment size and transport mechanisms to determine the stability of the sand wave field, we realize that other factors such as nutrient supply, temperature and tidal flow also play a role in PSL survival.
Additionally, using median grain size alone to identify sand lance presence or absence can be misleading. For example, examination of Table 1 shows that several samples that did not capture fish have a mean grain size that falls within the range of medium to coarse-grained sand, a range that includes all samples that contained fish. Thus, realizing that absence is never very strong evidence in itself, a clear distinction of sediment preference is not made. A justifiable conclusion would be that PSL were not present in some samples due to other reasons, such as the time of day when the samples were collected or simply out of population size/density dependence. Freeman and others [12] pointed out that in the North Sea other factors such as seawater temperature, physical conditions, and available food in the water column influence the emergence of fish from the sediment and thus may not be present at the time of sampling. However, Figure 14 better defines the sand-lance habitat by the absence or near-absence of fine-grained sediment. All samples that contained fish have less than 1.15% of grains finer than 0.25 mm.
Based on MBES surveys and sediment transport analyses using sediment size samples and ADCP surveys of the central San Juan Channel sand wave field we conclude that surficial sediment within the field are relic glacial materials that have been winnowed and molded into a dynamic bedforms from post-glacial tidal currents. It appears that the field is near stable and could be maintained for some time without significant sediment input. The two survey data sets (MBES and ACDP) compliment each other and indicate that little net sediment transport is taking place and that the larger bedforms are stable. The stability regime could be altered with sea level rise and increased tidal flows, but the reality and rate of such changes are not known. Other dynamic bedforms within the Salish Sea, as well as elsewhere where Ammodytes spp. are found, could be stable or marginally stable as well, and the potential effects of sea level rise may diminish this forage fish habitat in sand wave fields.
Acknowledgments
We wish to thank Hank Chezar of the USGS for his assistance in collecting and processing the sediment “eyeball” camera images, and to David Rubin for his help in consultations and analysis of the sediment images. We thank Kurt Rosenberger of USGS and Liz Ewing for their help with decoding, plotting, and analyzing the ADCP current meter data. We appreciate the support given to us by the Pacific Science Center, USGS, to undertake this project. We thank Don Gunderson, Joseph Bizzarro and anonymous reviewers for their critical review of the manuscript and constructive comments. John Aschoff and Charlie Endris assisted in the preparation of the figures and we sincerely appreciate their help. We thank the Dickinson Foundation, Northwest Straits Commission, Geological Survey of Canada and the SeaDoc Society for support in the collection of the MBES and sediment data.
Author Contributions
All authors contributed equally to this study and manuscript.
Conflicts of Interest
The authors declare no conflict of interest.
References
- Robards, M.D.; Piatt, J.F.; Rose, G.A. Maturation, fecundity, and intertidal spawning of Pacific sand lance in the northern Gulf of Alaska. J. Fish Biol. 1999, 54, 1050–1068. [Google Scholar] [CrossRef]
- Robards, M.D.; Willson, M.F.; Armstrong, R.H.; Piatt, J.F. Sand Lance: A Review of Biology and Predator Relations and Annotated Bibliography; Exxon Valdez Oil Spill Restoration Project 99346 Final Report; U.S. Department of Agriculture, Forest Service, Pacific Northwest Research Station: Portland, OR, USA, 1999; p. 327.
- Robards, M.D.; Rose, G.A.; Piatt, J.F. Growth and abundance of Pacific sand lance, Ammodytes hexapterus, under differing oceanographic regimes. Environ. Biol. Fishes 2002, 64, 429–441. [Google Scholar] [CrossRef]
- Tribble, S.C. Sensory and Feeding Ecology of Larval and Juvenile Pacific Sand Lance, Ammodytes hexapterus. Master’s Thesis, University of Washington, Washington, DC, USA, 2000; p. 98. [Google Scholar]
- Haynes, T.B.; Ronconi, R.A.; Burger, A.E. Habitat use and behavior of the Pacific sand lance (Ammodytes hexapterus) in the shallow subtidal region of southwestern Vancouver Island. Northwest. Nat. 2007, 88, 155–167. [Google Scholar] [CrossRef]
- Haynes, T.B.; Robinson, C.I.K.; Dearden, P. Modeling habitat use of young-of-the-year Pacific Sand Land (Ammodytes hexapterus) in the nearshore region of Barkley Sound, British Columbia, Canada. Environ. Biol. Fishes 2008, 83473–83484. [Google Scholar]
- Johnson, S.W.; Tehdinga, J.F.; Munk, K.M. Distribution and use of shallow-water habitats by Pacific sand lances in Southeastern Alaska. Trans. Am. Fish. Soc. 2008, 137, 1455–1463. [Google Scholar] [CrossRef]
- Greene, H.G.; Wyllie-Echeverria, T.; Gunderson, D.; Bizzarro, J.; Barrie, V.; Fresh, K.; Robinson, C.; Cacchione, D.; Penttila, D.; Hampton, M.; et al. Deep-Water Pacific Sand Lance (Ammodytes hexapterus) Habitat Evaluation and Prediction for the Northwest Straits Region; Final Report to Northwest Straits Commission; SeaDoc/Tombolo Mapping Lab and Friday Harbor Labs: Orcas Island, WA, USA, 2011; p. 21. [Google Scholar]
- Mercer, C.T. Sand Eels (Ammodytidae) in the South-Western North Sea: Their Biology and Fishery; Great Britain Minist. Agic. Fish. Food, Fish. Invest. Ser. II Mar. Fish. 24; Her Majesty’s Stationary Office: London, UK, 1966. [Google Scholar]
- Reay, P.J. Synopsis of biological data on north Atlantic sandeels of the genus Ammodytes. FAO Fish. Synop. 1970, 82. Available online: http://www.fao.org/3/a-a8703e.pdf (accessed on 22 October 2017).
- Wright, P.J.; Jensen, H.; Tuck, I. The influence of sediment type on the distribution of the lesser sendeel, Ammodytes marinus. J. Sea Res. 2000, 44, 243–256. [Google Scholar] [CrossRef]
- Freeman, S.; Mackinson, S.; Flatt, R. Diel patterns in the habitat utilization of sandeels revealed using integrated acoustic surveys. J. Exp. Mar. Biol. Ecol. 2004, 305, 141–154. [Google Scholar] [CrossRef]
- Wright, P.J.; Pedersen, S.A.; Donald, L.; Anderson, C.; Lewy, P.; Proctor, R. The Influence of Physical Factors on the Distribution of Lesser Sandeels and Its Relevance to Fishing Pressure in the North Sea; C.M.-International Council for the Exploration of the Sea: Copenhagen, Denmark, 1998. [Google Scholar]
- Holland, G.J.; Greenstreet, S.P.R.; Gibb, I.M.; Fraser, H.M.; Robertson, M.R. Identifying sandeel Ammodytes marinus sediment habitat preferences in the marine environment. Mar. Ecol. Prog. Ser. 2005, 303, 269–282. [Google Scholar] [CrossRef]
- Greenstreet, S.P.R.; Tuck, I.D.; Grewar, G.N.; Armstrong, E.; Reid, D.G.; Wright, P.J. An assessment of the acoustic survey technique, RoxAnn, as a means of mapping seabed habitat. ICES J. Mar. Sci. 1997, 54, 939–959. [Google Scholar] [CrossRef]
- Stride, A.H. (Ed.) Offshore Tidal Sands, Processes and Deposits; Chapman and Hall: London, UK, 1982; p. 222. [Google Scholar]
- Barrie, J.V.; Conway, K.W.; Picard, K.; Greene, H.G. Large scale sedimentary bedforms and sediment dynamics on a glaciated tectonic continental shelf: Examples from the Pacific margin of Canada. Cont. Shelf Res. 2009, 29, 796–806. [Google Scholar] [CrossRef]
- Blaine, J. Pacific Sand Lance (Ammodytes hexapterus) Present in the Sandwave Field of Central San Juan Channel, WA: Abundance, Density, Maturity, and Sediment Association; Unpublished: Class Paper, Fish 492 Research Apprentice; Friday Harbor Labs: Friday Harbor, WA, USA, 2006; p. 24. [Google Scholar]
- Rood, M. Length Distribution, Condition Factor, and Feeding Ecology of Pacific Sand Lance in the San Juan Archipelago, Fall 2010; Student Paper, Pelagic Ecosystem Function Apprenticeship; Friday Harbor Laboratories: Friday Harbor, WA, USA, 2010; 16p. [Google Scholar]
- Boyd, S.; Wyllie-Echeverria, T. Individual Burrowing Behavior of Pacific Sand Lance (Ammodytes hexaperus): A Laboratory Experiment; Student Paper, BLINKS Research Fellowship; Friday Harbor Laboratories: Friday Harbor, WA, USA, 2010; 14p. [Google Scholar]
- Ewing, L. Physical Influences on Spatial and Temporal Distribution of Pacific Sand Lance (Ammodytes hexapterus) in the Sand Wave Fields of San Juan Channel; Class Paper; Friday Harbor Marine Labs, Univ. Washington: Friday Harbor, WA, USA, 2000; 28p. [Google Scholar]
- Barnard, P.L.; Erikson, L.H.; Rubin, D.M. Analyzing bedforms mapped using multibeam sonar to determine regions bedload sediment transport patterns in the San Francisco costal system. Int. Assoc. Sedimentol. Spec. Publ. 2012, 44, 273–294. [Google Scholar]
- Knaapen, M.A.F.; van Bergen Henegouw, C.N.; Hu, Y.Y. Quantifying bedform migration using multi-beam sonar. Geo-Mar. Lett. 2005, 25, 306–314. [Google Scholar] [CrossRef]
- Ashley, G.M. Classification of large-scale sub-aqueous bedforms: A new look at an old problem. J. Sediment. Petrol. 1990, 60, 160–172. [Google Scholar]
- Southard, J.B. Representation of bed configurations in depth-velocity-size diagrams. J. Sediment. Petrol. 1971, 41, 903–915. [Google Scholar]
- Dalrymple, R.W.; Knight, R.J.; Lambiase, J.J. Bedforms and their hydraulic stability relationships in a tidal environment, Bay of Fundy, Canada. Nature 1978, 275, 100–104. [Google Scholar] [CrossRef]
- Rubin, D.; McCulloch, D. Single and Superimposed Bedforms: A Synthesis of San Francisco Bay and Flume Observations. Sediment. Geol. 1980, 26, 207–231. [Google Scholar] [CrossRef]
- Orr, E.L.; Orr, W.N. Geology of the Pacific Northwest; The McGraw-Hill Companies, Inc.: San Francisco, CA, USA, 1996. [Google Scholar]
- Barrie, J.V.; Conway, K.W. Late Quaternary glaciation and postglacial stratigraphy of the northern Pacific margin of Canada. Quat. Res. 1999, 51, 113–123. [Google Scholar] [CrossRef]
- Greene, H.G.; Barrie, V. Potential Marine Benthic Habitats of the San Juan Archipelago. Geological Survey of Canada Marine Map Series, 4 Quadrants, 12 Sheets, Scale 1:50,000; Geological Survey of Canada: Sidney, BC, Canada, 2011. [Google Scholar]
- Greene, H.G.; Bizzarro, J.J.; O’Connell, V.M.; Brylinsky, C.K. Construction of digital potential marine benthic habitat maps using a coded classification scheme and its application. Mapp. Seafloor Habitat Charact. Can. Geol. Assoc. Spec. Pap. 2007, 47, 141–155. [Google Scholar]
- Rubin, D.M. A simple autocorrelation algorithm for determining grain size from digital images of sediment. J. Sediment. Res. 2004, 74, 160–165. [Google Scholar] [CrossRef]
- Wentworth, C.K. A scale of grade and class terms for clastic sediments. J. Geol. 1922, 30, 377–392. [Google Scholar] [CrossRef]
- Van Rijn, L.C. Principles of Sediment Transport in Rivers, Estuaries, and Coastal Seas; Aqua Publications: Blokzijl, The Netherlands, 1993; p. 631. [Google Scholar]
- Soulsby, R. Dynamics of Marine Sands; Thomas Telforb Pubications: London, UK, 2000; p. 249. [Google Scholar]
- Rubin, D.M.; Hunter, R.E. Bedform alignment in directionally varying flows. Science 1987, 237, 276–278. [Google Scholar]
- Bothroyd, J.C.; Hubbard, D.K. Genesis of bedforms in mesotidal estuaries. Esturine Res. 1975, 2, 217–234. [Google Scholar]
- Bazzarro, J.J.; Peterson, A.N.; Blaine, J.N.; Balaban, J.P.; Greene, H.G.; Summers, A.P. Burrowing behavior, habitat, and functional morphology of the Pacific sand lance (Ammodytes personatus). Fish. Bull. 2016, 114, 445–460. [Google Scholar] [CrossRef]
- Pinto, J.M. Laboratory spawning of Ammodytes hexapterus from the Pacific Coast of North America with a description of its eggs and early larvae. Copeia 1984, 1984, 242–244. [Google Scholar] [CrossRef]
- Meyer, T.L.; Cooper, R.A.; Langstone, R.W. Relative abundance, behavior and food habits of the American sand lance, Ammodytes americanus, from the Gulf of Maine. Fish. Bull. 1979, 77, 243–254. [Google Scholar]


© 2017 by the authors. Licensee MDPI, Basel, Switzerland. This article is an open access article distributed under the terms and conditions of the Creative Commons Attribution (CC BY) license (http://creativecommons.org/licenses/by/4.0/).