
User Experience Design for Online Sports Shoe Retail Platforms: An Empirical Analysis Based on Consumer Needs


Abstract
:1. Introduction
2. Literature Review
2.1. Research on the Experience Design of Online Retail Platforms
2.2. LDA Topic Analysis
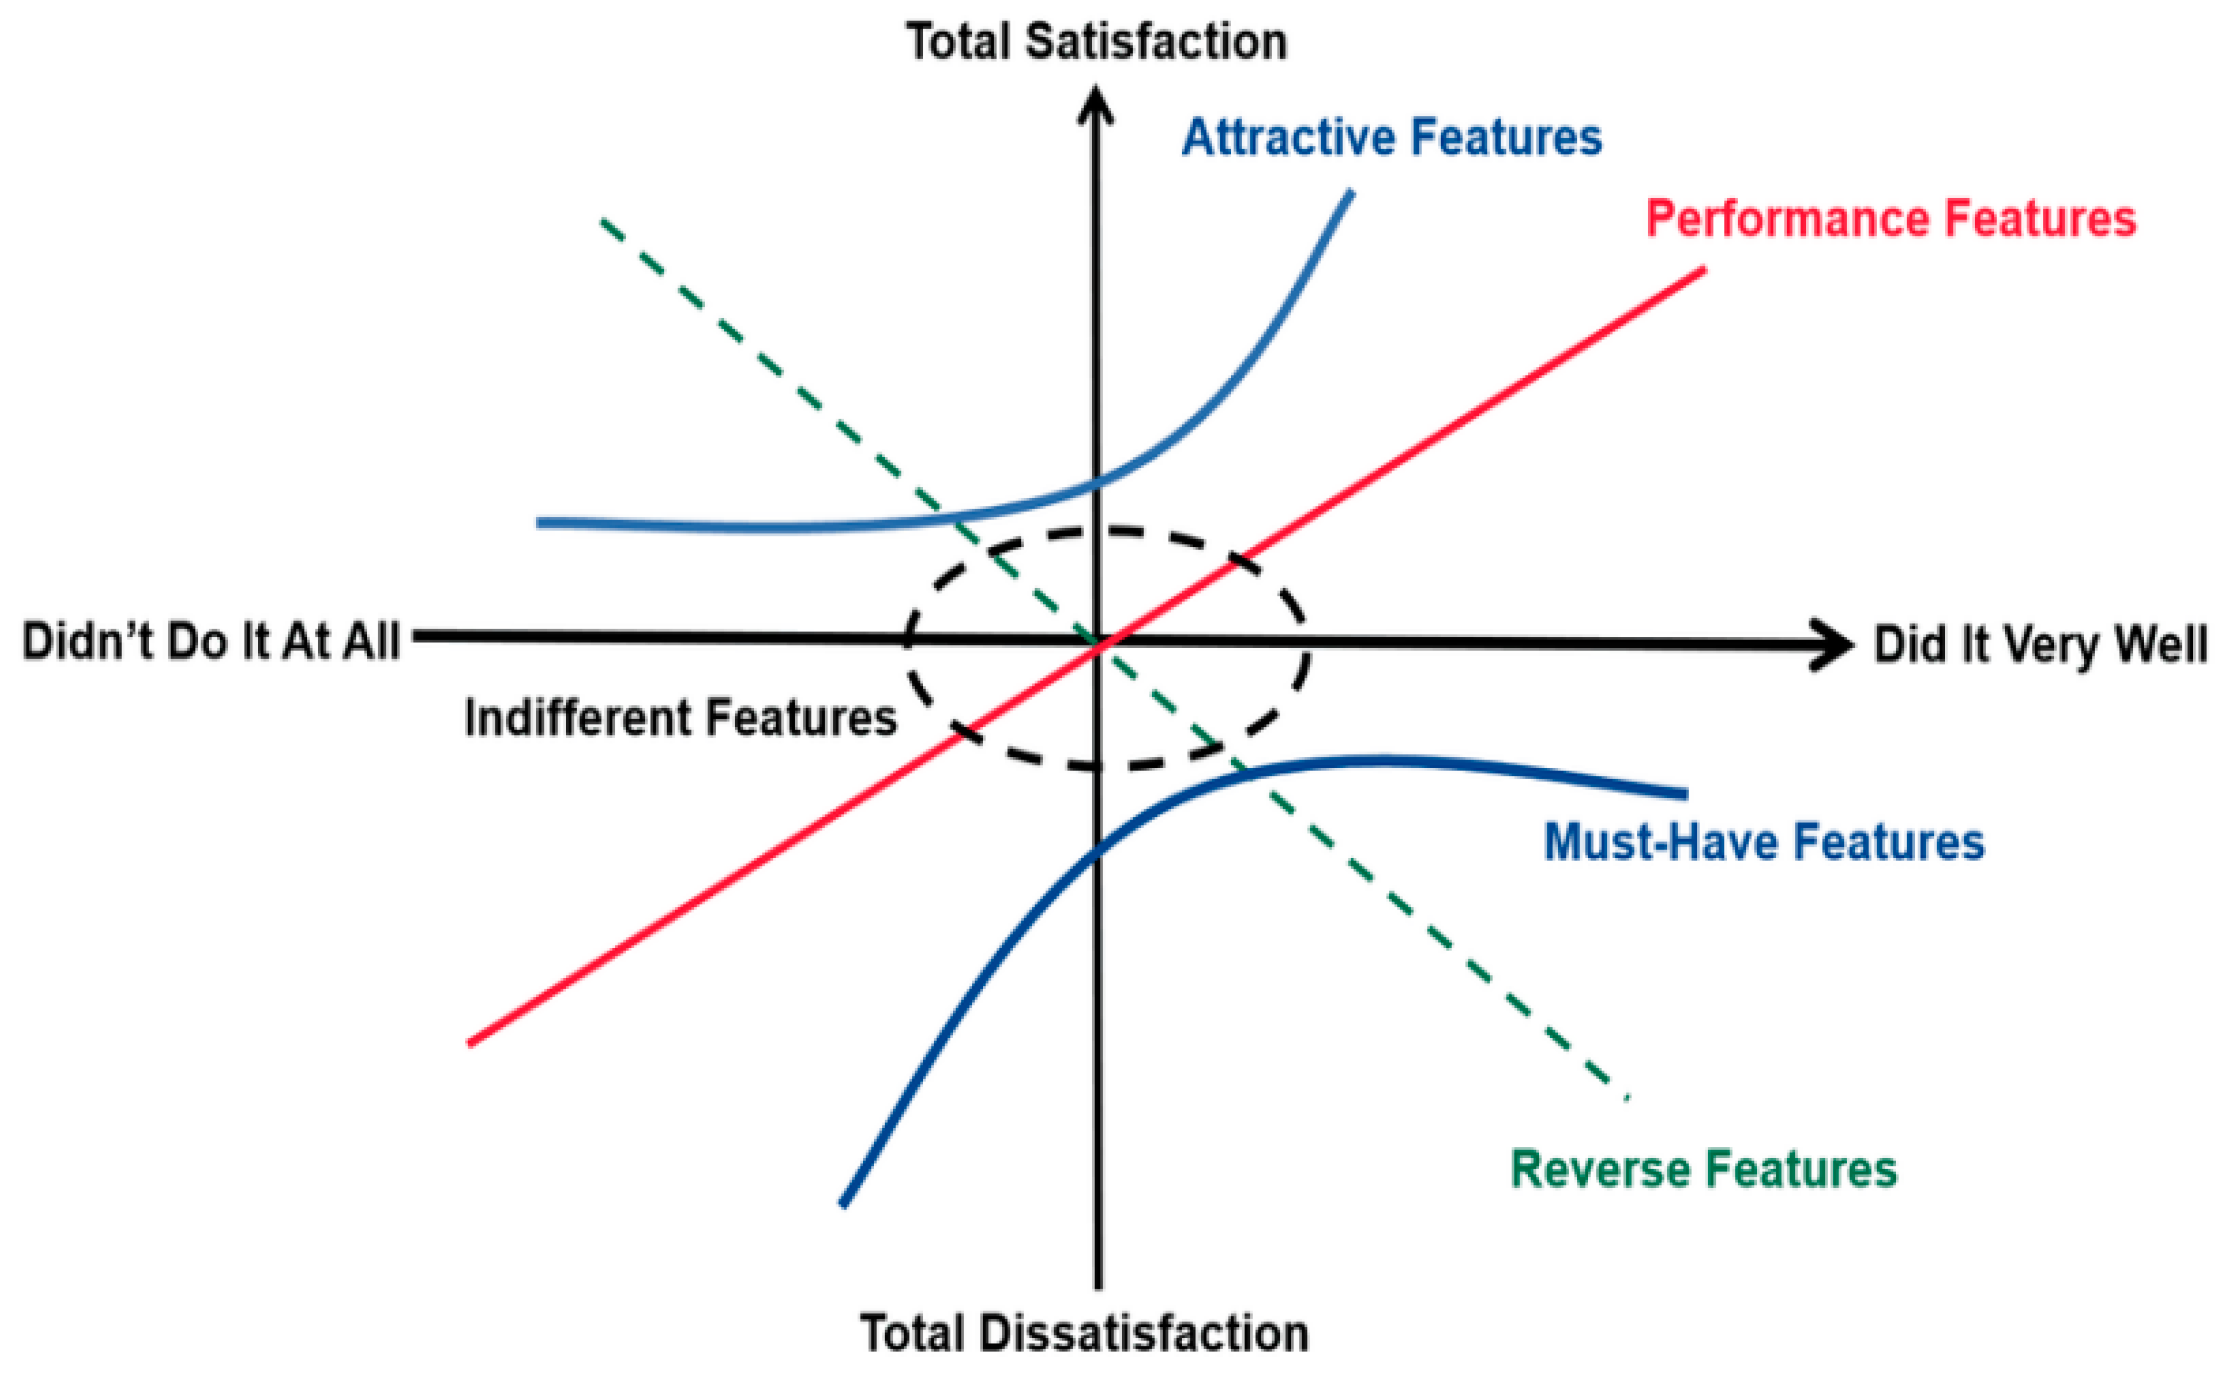
2.3. Kano Model
3. Research Process and Results
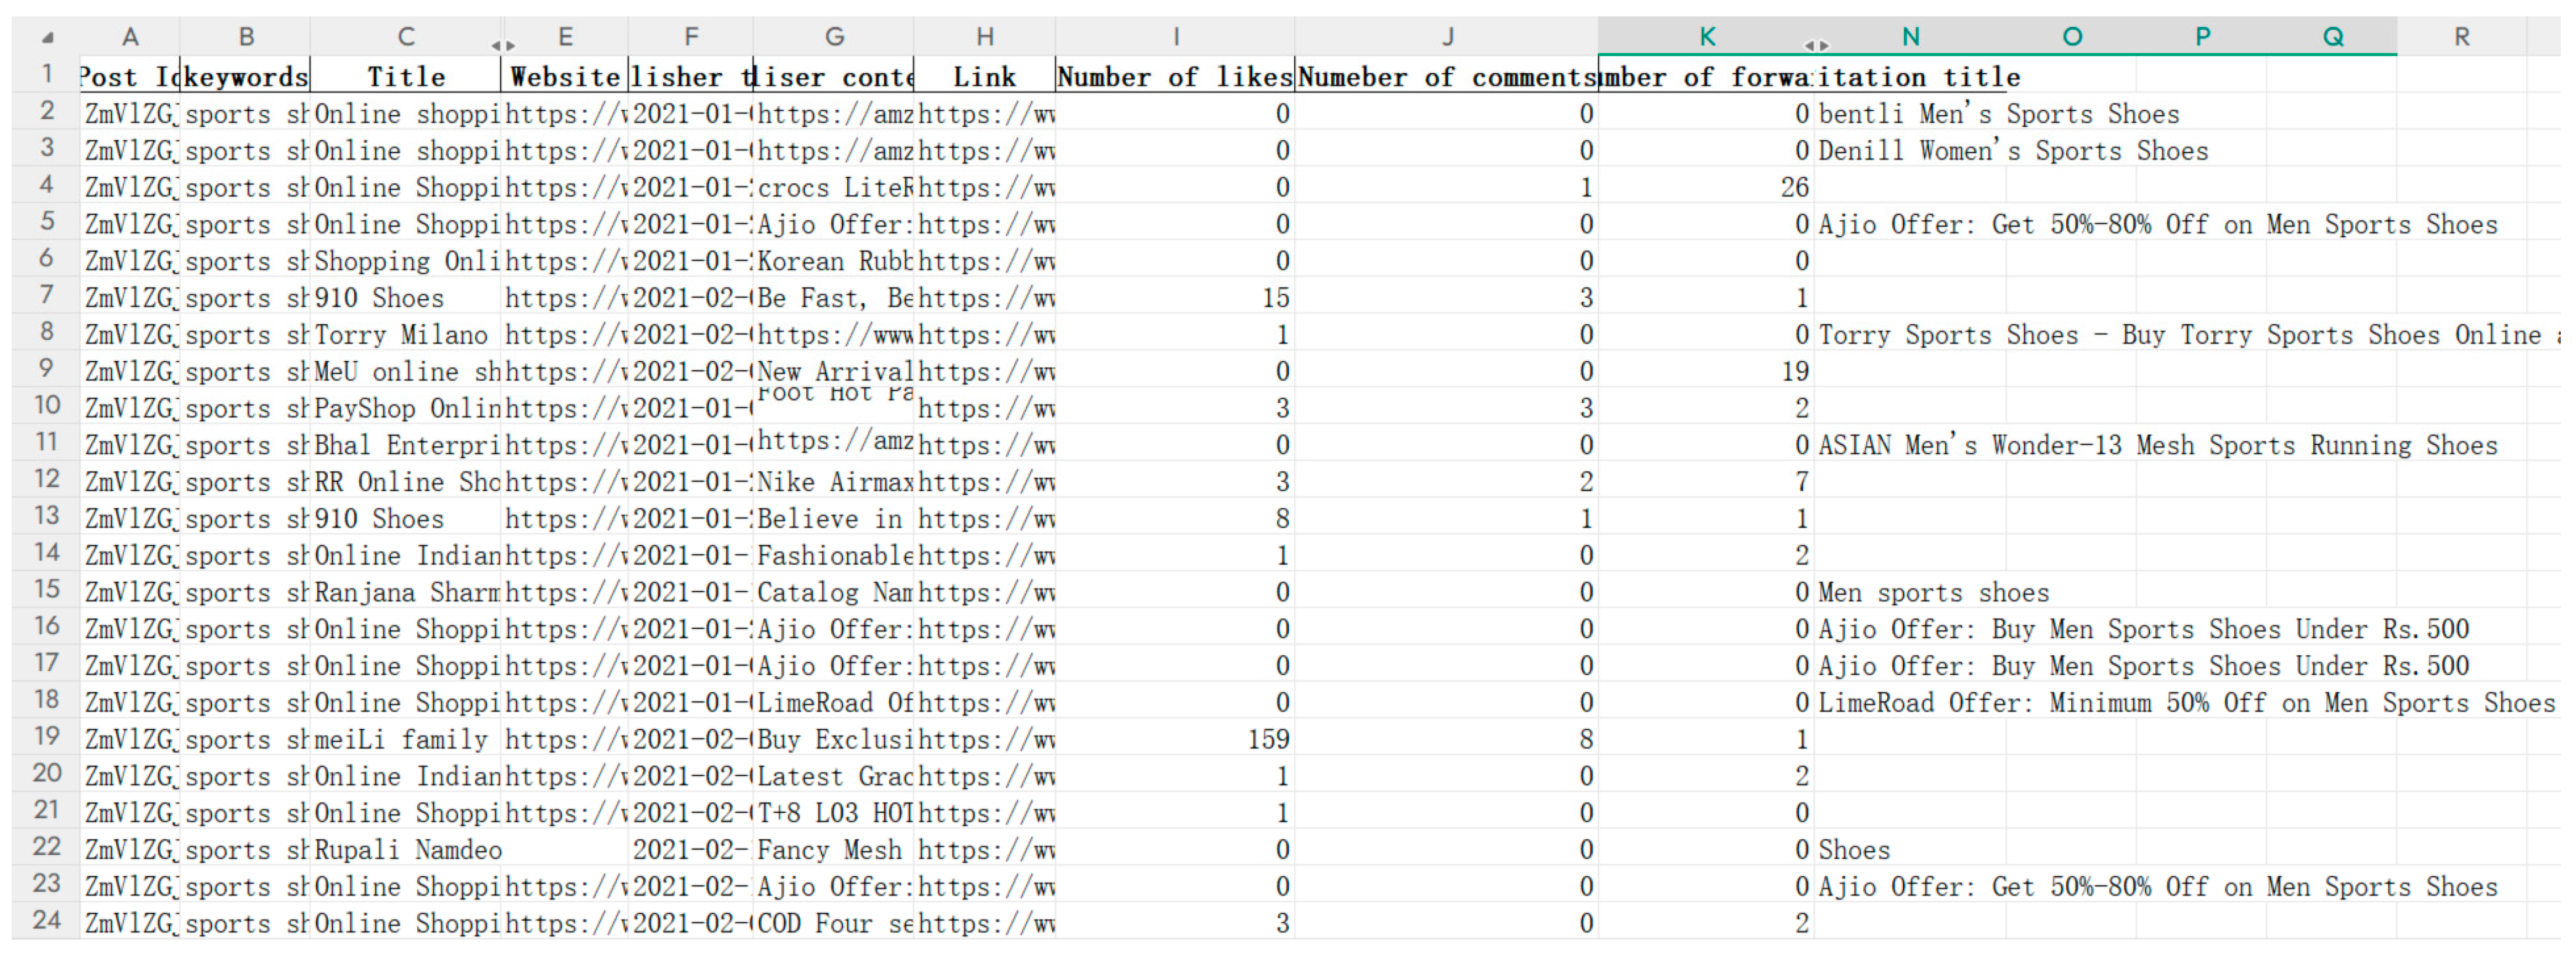
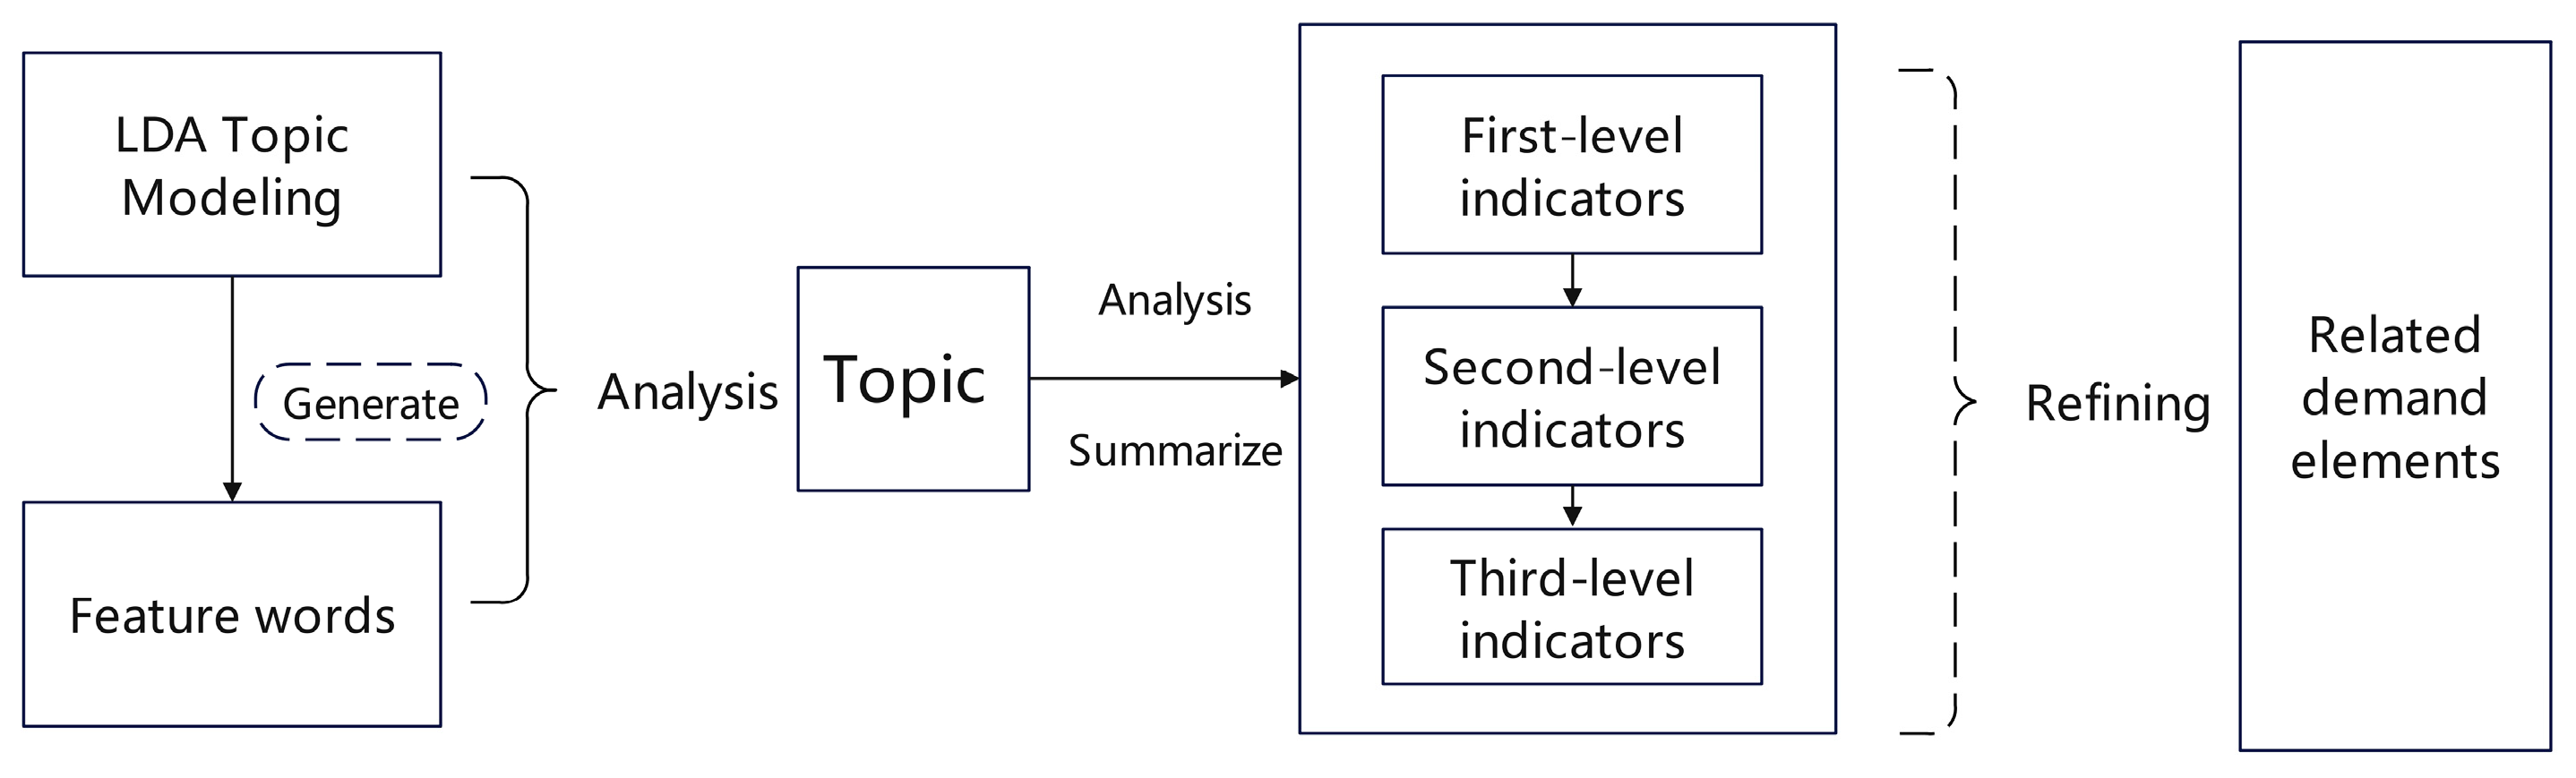
3.1. LDA Analysis
3.2. User Demands Classification Based on the Kano Model
- (1)
- Questionnaire question setting
- (2)
- Questionnaire survey process
- (3)
- Recruitment of Participants
- (4)
- Reliability and validity test
- (5)
- Statistical results of this questionnaire survey
4. Result Statistics and Findings
4.1. Fundamental Demands
4.2. The Enhancement of Service Assurance and Security Needs
4.3. The Enhancement of Technological, Interactive and Immersive Needs
4.4. Emotional Needs Enhancement: Personalization, Socialization, Sense of Belonging
5. Discussion
6. Conclusions
- (1)
- Theoretical Implications
- (2)
- Managerial contributions
- (3)
- Limitations and further research perspectives
Author Contributions
Funding
Institutional Review Board Statement
Informed Consent Statement
Data Availability Statement
Conflicts of Interest
References
- Abu-AlSondos, I., Alkhwaldi, A., Salhab, H., Shehadeh, M., & Ali, B. (2023). Customer attitudes towards online shopping: A systematic review of the influencing factors. International Journal of Data and Network Science, 7(1), 513–524. [Google Scholar] [CrossRef]
- Andriani, M., Irawan, H., & Asyura, N. R. (2021). Improving quality using the Kano model in overcoming competition in the service industry. International Journal of Engineering, Science and Information Technology, 1(4), 13–18. [Google Scholar] [CrossRef]
- Anta. (2024). “ANTANUI”. Available online: https://www.anta.cn (accessed on 23 April 2024).
- Baier, D., & Rese, A. (2020). How to increase multichannel shopping satisfaction? An adapted Kano based stage-gate approach to select new technologies. Journal of Retailing and Consumer Services, 56, 102172. [Google Scholar] [CrossRef]
- Baytar, F., Chung, T., & Shin, E. (2020). Evaluating garments in augmented reality when shopping online. Journal of Fashion Marketing and Management: An International Journal, 24(4), 667–683. [Google Scholar] [CrossRef]
- Beig, F. A., & Nika, F. A. (2022). Impact of brand experience on brand equity of online shopping portals: A study of select e-commerce sites in the state of Jammu and Kashmir. Global Business Review, 23(1), 156–175. [Google Scholar] [CrossRef]
- Berni, A., & Borgianni, Y. (2021). From the definition of user experience to a framework to classify its applications in design. Proceedings of the Design Society, 1, 1627–1636. [Google Scholar] [CrossRef]
- Blei, D. M. (2012). Probabilistic topic models. Communications of the ACM, 55(4), 77–84. [Google Scholar] [CrossRef]
- Bratu, S., & Sabău, R. I. (2022). Digital commerce in the immersive metaverse environment: Cognitive analytics management, real-time purchasing data, and seamless connected shopping experiences. Linguistic and Philosophical Investigations, 21, 170–186. [Google Scholar]
- Breugelmans, E., Altenburg, L., Lehmkuhle, F., Krafft, M., Lamey, L., & Roggeveen, A. L. (2023). The future of physical stores: Creating reasons for customers to visit. Journal of Retailing, 99(4), 532–546. [Google Scholar] [CrossRef]
- Casciani, D., Chkanikova, O., & Pal, R. (2022). Exploring the nature of digital transformation in the fashion industry: Opportunities for supply chains, business models, and sustainability-oriented innovations. Sustainability: Science, Practice and Policy, 18(1), 773–795. [Google Scholar] [CrossRef]
- Chapman, C., & Callegaro, M. (2022, May 4–6). Kano analysis: A critical survey science review. 2022 Sawtooth Software Conference, Orlando, FL, USA. Available online: https://quantuxbook.com/papers/REPRINT-Chapman-Callegaro-SawtoothConference2022.pdf (accessed on 14 March 2024).
- Chen, Y., & Mu, B. (2024). Exploration of multimedia perception and virtual reality technology application in computer aided packaging design. Available online: https://cad-journal.net/files/vol_21/CAD_21(S25)_2024_141-155.pdf (accessed on 17 February 2024).
- Choi, Y. H., & Lee, K. H. (2020). The meanings of new-tro fashion: Conceptualization and typologifcation. Journal of the Korean Society of Clothing and Textiles, 44(4), 691–707. [Google Scholar] [CrossRef]
- Chuang, J., Manning, C. D., & Heer, J. (2012, May 21–25). Termite: Visualization techniques for assessing textual topic models. International Working Conference on Advanced Visual Interfaces (pp. 74–77), Capri Island, Italy. [Google Scholar]
- Feldman, R., & Sanger, J. (2007). The text mining handbook: Advanced approaches in analyzing unstructured data. Cambridge University Press. [Google Scholar]
- Ferrandez, C. (2022). From virtual try-on shoes to immersive ads: 4 AR and 3D experiences for footwear brands. Available online: https://poplar.studio/blog/from-virtual-try-on-shoes-to-immersive-ads-4-ar-and-3d-experiences-for-footwear-brands/ (accessed on 21 April 2024).
- Fu, J. R., Lu, I. W., Chen, J. H., & Farn, C. K. (2020). Investigating consumers’ online social shopping intention: An information processing perspective. International Journal of Information Management, 54, 102189. [Google Scholar] [CrossRef]
- Grand view Research. (2019). Women wear market size, share & trends analysis report by type (top wear, bottom wear, sports & active wear, intimates & sleepwear, footwear, accessories), by distribution channel, and segment forecasts, 2019–2025. Available online: https://www.grandviewresearch.com/industry-analysis/women-wear-market (accessed on 5 June 2024).
- Hajjar, K., Lasserre, J., Zhao, A., & Shirvany, R. (2021). Attention gets you the right size and fit in fashion. In Recommender systems in fashion and retail (Vol. 734). Springer International Publishing. [Google Scholar] [CrossRef]
- Huang, Y., Yao, K., Li, J., Li, D., Jia, H., Liu, Y., Yiu, Chun, K., Park, W., & Yu, X. (2022). Recent advances in multi-mode haptic feedback technologies towards wearable interfaces. Materials Today Physics, 22, 100602. [Google Scholar] [CrossRef]
- Intelligence, B. (2021). Metaverse may be $800 billion market, next tech platform. Available online: https://www.bloomberg.com/company/ (accessed on 20 June 2024).
- Jin, J., Jia, D., & Chen, K. (2022). Mining online reviews with a Kansei-integrated Kano model for innovative product design. International Journal of Production Research, 60(22), 6708–6727. [Google Scholar] [CrossRef]
- Kang, T. C., Hung, S. Y., & Huang, A. H. (2020). The adoption of online product information: Cognitive and affective evaluations. Journal of Internet Commerce, 19(4), 373–403. [Google Scholar] [CrossRef]
- Kano, T., & Mulavwa, M. (1984). Feeding ecology of the pygmy chimpanzees (Pan paniscus) of Wamba. In The pygmy chimpanzee: Evolutionary biology and behavior (pp. 233–274). Springer US. [Google Scholar]
- Keef, C. V., Kayser, L. V., Tronboll, S., Carpenter, C. W., Root, N. B., Finn, M., III, O’Connor, T. F., Abuhamdieh, S. N., Davies, D. M., Runser, R., Meng, Y. S., Ramachandran, V. S., & Lipomi, D. J. (2020). Virtual texture generated using elastomeric conductive block copolymer in a wireless multimodal haptic glove. Advanced Intelligent Systems, 2(4), 2000018. [Google Scholar] [CrossRef] [PubMed]
- Kermanshachi, S., Nipa, T. J., & Nadiri, H. (2022). Service quality assessment and enhancement using Kano model. PLoS ONE, 17(2), e0264423. [Google Scholar] [CrossRef]
- Kim, H., Cho, I., & Park, M. (2022). Analyzing genderless fashion trends of consumers’ perceptions on social media: Using unstructured big data analysis through Latent Dirichlet Allocation-based topic modeling. Fashion and Textiles, 9(1), 1–21. [Google Scholar] [CrossRef]
- Kohli, A., & Singh, R. (2021). An assessment of customers’ satisfaction for emerging technologies in passenger cars using Kano model. Vilakshan-XIMB Journal of Management, 18(1), 76–88. [Google Scholar] [CrossRef]
- Konstan, J. A., & Riedl, J. (2012). Recommender systems: From algorithms to user experience. User Modeling and User-Adapted Interaction, 22, 101–123. [Google Scholar] [CrossRef]
- Kumar, H. (2022). Augmented reality in online retailing: A systematic review and research agenda. International Journal of Retail & Distribution Management, 50(4), 537–559. [Google Scholar]
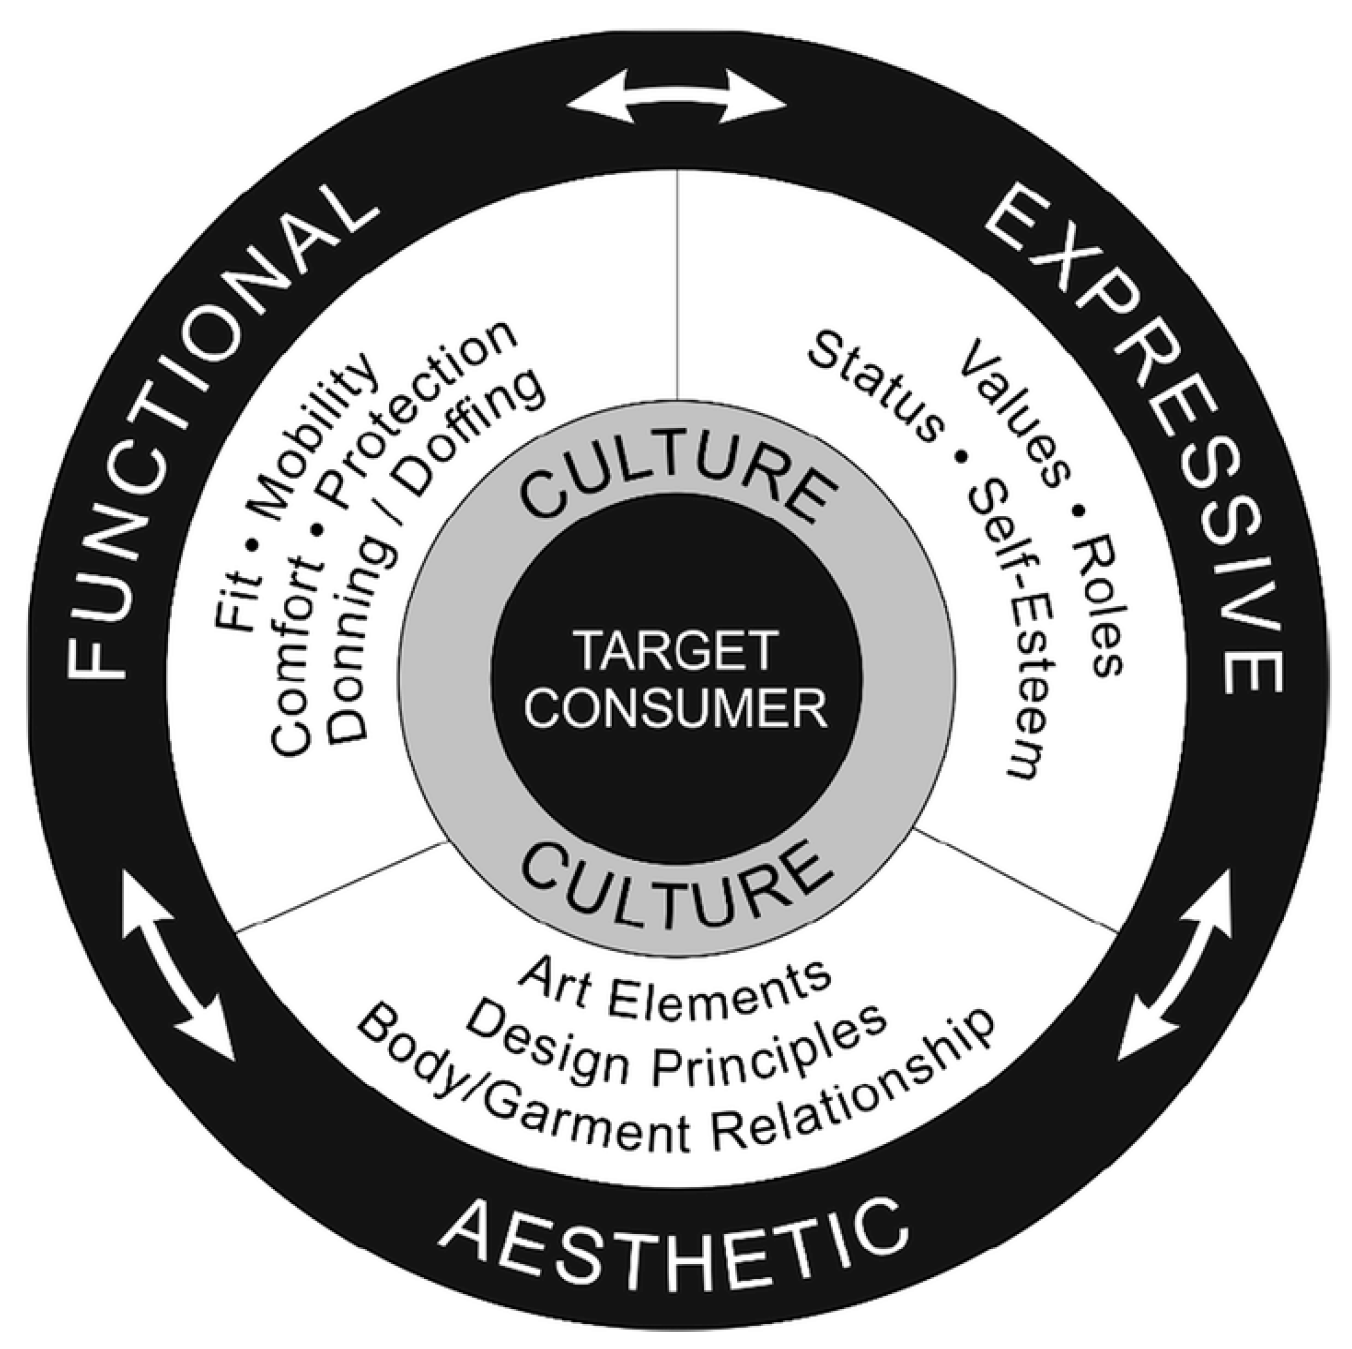
- Lamb, J. M., & Kallal, M. J. (1992). A conceptual framework for apparel design. Clothing and Textiles Research Journal, 10(2), 42–47. [Google Scholar] [CrossRef]
- Lăzăroiu, G., Neguriţă, O., Grecu, I., Grecu, G., & Mitran, P. C. (2020). Consumers’ decision-making process on social commerce platforms: Online trust, perceived risk, and purchase intentions. Frontiers in Psychology, 11, 890. [Google Scholar] [CrossRef]
- Lixăndroiu, R., Cazan, A. M., & Maican, C. I. (2021). An analysis of the impact of personality traits towards augmented reality in online shopping. Symmetry, 13(3), 416. [Google Scholar] [CrossRef]
- Mbete, G. S., & Tanamal, R. (2020). Effect of easiness, service quality, price, trust of quality of information, and brand image of consumer purchase decision on shopee online purchase. Jurnal Informatika Universitas Pamulang, 5(2), 100–110. [Google Scholar] [CrossRef]
- McCarthy, J., & Wright, P. (2005). Putting ‘felt-life’at the centre of human–computer interaction (HCI). Cognition, Technology & Work, 7, 262–271. [Google Scholar]
- Mikulić, J., & Prebežac, D. (2011). A critical review of techniques for classifying quality attributes in the Kano model. Managing Service Quality: An International Journal, 21(1), 46–66. [Google Scholar] [CrossRef]
- Mohiuddin Babu, M., Akter, S., Rahman, M., Billah, M. M., & Hack-Polay, D. (2022). The role of artificial intelligence in shaping the future of Agile fashion industry. Production Planning & Control, 35, 2084–2098. [Google Scholar] [CrossRef]
- Norman, D. A., & Ortony, A. (2003). Designers and users: Two perspectives on emotion and design. In Symposium on foundations of interaction design (pp. 1–13). Interaction Design Institute. [Google Scholar]
- Ornati, M., & Cantoni, L. (2020). FashionTouch in E-commerce: An exploratory study of surface haptic interaction experiences. In International conference on human-computer interaction (pp. 493–503). Springer International Publishing. [Google Scholar]
- Raissa, A., Adhilla, S., Siregar, R., & Rahayu, F. (2024). Analysis of Sports Brand Positioning Based on Consumer Perceptions. BUDGETING: Journal of Business, Management and Accounting, 5(2), 972–983. [Google Scholar] [CrossRef]
- Rane, N. L., Achari, A., & Choudhary, S. P. (2023). Enhancing customer loyalty through quality of service: Effective strategies to improve customer satisfaction, experience, relationship, and engagement. International Research Journal of Modernization in Engineering Technology and Science, 5(5), 427–452. [Google Scholar]
- Ratchford, B., Soysal, G., Zentner, A., & Gauri, D. K. (2022). Online and offline retailing: What we know and directions for future research. Journal of Retailing, 98(1), 152–177. [Google Scholar] [CrossRef]
- Riva, G. (2023). Virtual reality. In The palgrave encyclopedia of the possible (pp. 1740–1750). Springer International Publishing. [Google Scholar]
- Rosário, A., & Raimundo, R. (2021). Consumer marketing strategy and E-commerce in the last decade: A literature review. Journal of Theoretical and Applied Electronic Commerce Research, 16(7), 3003–3024. [Google Scholar] [CrossRef]
- Salopek Čubrić, I. (2021). Approach towards design of functional sportswear for improved human performance. In Proceedings of the 8th international ergonomics conference: ERGONOMICS 2020 8 (pp. 3–11). Springer International Publishing. [Google Scholar] [CrossRef]
- Sani, I., & Febrian, W. D. (2023). Marketing analysis and customer satisfaction on customer loyalty global competition era. Jurnal Perspektif Manajerial Dan Kewirausahaan (JPMK), 3(2), 111–120. [Google Scholar] [CrossRef]
- Sathyabama, A. R., Katiravan, D. J., Kumar, K. M., & Bharani, R. (2024). METACOMMERCE360 pioneering the future of E-commerce in the boundless metaverse landscape. Bharani. [Google Scholar] [CrossRef]
- Saura, J. R. (Ed.). (2021). Advanced digital marketing strategies in a data-driven era. IGI Global. [Google Scholar]
- Saura, J. R., Ribeiro-Soriano, D., & Palacios-Marqués, D. (2021). From user-generated data to data-driven innovation: A research agenda to understand user privacy in digital markets. International Journal of Information Management, 60, 102331. [Google Scholar] [CrossRef]
- Saura, J. R., Škare, V., & Dosen, D. O. (2024). Is AI-based digital marketing ethical? Assessing a new data privacy paradox. Journal of Innovation & Knowledge, 9(4), 100597. [Google Scholar]
- Shang, Q., Jin, J., Pei, G., Wang, C., Wang, X., & Qiu, J. (2020). Low-order webpage layout in online shopping facilitates purchase decisions: Evidence from event-related potentials. Psychology Research and Behavior Management, 13, 29–39. [Google Scholar] [CrossRef]
- Shi, K., Shao, R., De Vos, J., & Witlox, F. (2023). Do e-shopping attitudes mediate the effect of the built environment on online shopping frequency of e-shoppers? International Journal of Sustainable Transportation, 17(1), 41–51. [Google Scholar] [CrossRef]
- Shokouhyar, S., Shokoohyar, S., & Safari, S. (2020). Research on the influence of after-sales service quality factors on customer satisfaction. Journal of Retailing and Consumer Services, 56, 102139. [Google Scholar] [CrossRef]
- Sidaoui, K., Jaakkola, M., & Burton, J. (2020). AI feel you: Customer experience assessment via chatbot interviews. Journal of Service Management, 31(4), 745–766. [Google Scholar] [CrossRef]
- Sievert, C., & Shirley, K. (2014, June 27). LDAvis: A method for visualizing and interpreting topics. Workshop on Interactive Language Learning, Visualization, and Interfaces (pp. 36–70), Baltimore, MD, USA. [Google Scholar]
- Slaton, K., & Pookulangara, S. (2022). Collaborative consumption: An investigation into the secondary sneaker market. International Journal of Consumer Studies, 46(3), 763–780. [Google Scholar] [CrossRef]
- Sohu. (2022). Style3D X Anta X Baidu creates virtual fashion show. Available online: https://www.sohu.com/a/585602205_120433774 (accessed on 2 June 2024).
- Statista. (2024). E-commerce revenue of the sports and outdoor industry worldwide from 2017 to 2027, by segment. Available online: https://www.statista.com/forecasts/1362447/sports-and-outdoor-e-commerce-revenue-worldwide (accessed on 15 May 2024).
- Swider, B. W., Yang, J., & Wang, M. (2024). The use of trajectories in management research: A review and insights for future research. Journal of Management, 50(6), 2012–2045. [Google Scholar] [CrossRef]
- Tanveer, T., ur Rahman, M., & ul Ain Kazmi, S. Q. (2024). Determinations of impulsive buying behavior: An empirical analysis of consumers’ purchase intentions for offline beauty products. International Journal of Computer Science & Network Security, 24(7), 45–54. [Google Scholar]
- Tzeng, S. Y., Ertz, M., Jo, M. S., & Sarigöllü, E. (2021). Factors affecting customer satisfaction on online shopping holiday. Marketing Intelligence & Planning, 39(4), 516–532. [Google Scholar] [CrossRef]
- Venkatesh, V., Speier-Pero, C., & Schuetz, S. (2022). Why do people shop online? A comprehensive framework of consumers’ online shopping intentions and behaviors. Information Technology & People, 35(5), 1590–1620. [Google Scholar] [CrossRef]
- Vukanti, V., & Jose, A. (2021, April 8–10). Business analytics: A case-study approach using LDA topic modelling. 2021 5th International Conference on Computing Methodologies and Communication (ICCMC) (pp. 1818–1823), Erode, India. [Google Scholar]
- Yu, S., Li, A., Lin, Z., Chen, Y., & Tang, X. (2023). A review of research on the improvement of topic model based topic evolution analysis methods for scientific literature. BiomedRxiv.202305.00016. Available online: https://www.biomedrxiv.org.cn/article/doi/bmr.202305.00016 (accessed on 20 September 2024).
- Zavolokina, L., Schlegel, M., & Schwabe, G. (2021). How can we reduce information asymmetries and enhance trust in ‘The Market for Lemons’? Information Systems and e-Business Management, 19(3), 883–908. [Google Scholar] [CrossRef]
- Zhao, C. (2008). Aging in China and its impact on vehicle design [Doctoral dissertation, Queensland University of Technology]. [Google Scholar]
- Zhu, L., Li, H., Wang, F. K., He, W., & Tian, Z. (2020). How online reviews affect purchase intention: A new model based on the stimulus-organism-response (S-O-R) framework. Aslib Journal of Information Management, 72(4), 463–488. [Google Scholar] [CrossRef]
- Zou, Y., Luh, D. B., & Lu, S. (2022a). Public perceptions of digital fashion: An analysis of sentiment and Latent Dirichlet Allocation topic modeling. Frontiers in Psychology, 13, 986838. [Google Scholar] [CrossRef]
- Zou, Y., Pintong, S., Shen, T., & Luh, D. B. (2022b). Evaluation and trend of fashion design research: Visualization analysis based on CiteSpace. Fashion and Textiles, 9(1), 45. [Google Scholar] [CrossRef]


| Cluster | Topic | Number of Texts | Feature Words | Thematic Intensity |
|---|---|---|---|---|
| Topic 1 | Platform or webpage | 3886 | term, item, guide, channel, platform, store, online, website, mall, computer, Taobao, shop, Jingdong, offline, WhatsApp, Lazada, phone, Tmall, Xiaomi | 0.19413 |
| Topic 2 | Brand | 2886 | brand, commerce, company, industry, level, business, story, version, Nike, lining, Jordan, Tape, Converse, Anta, upper, board, classic, professional, premium, version | 0.14418 |
| Topic 3 | Product Information | 1577 | type, data, technology, style, size, copyright, logo, carbon, sol, rubber, plastic, leather, silk, lace, steel, foam, fluorescent, black, white, gold, gray, peach, green, silver, blue, orange, brown, beige, pink, purple, colorful | 0.078783 |
| Topic 4 | Service | 2637 | technology, interface, voice, feel, online, offline, screen, feel, feeling, sound, picture, visual, photo, text, video, animation, voice, feel, sense, dynamic | 0.13174 |
| Topic 5 | Place | 1700 | Hangzhou, shop, Chinese, company, China, American, product, mall, local, domestic, Chicago, Singapore, London, Paris, Shanghai, Yangzhou, Putian, branch, location, vipshop | 0.084928 |
| Topic 6 | Additional Service | 1564 | photo, grass, land, blossom, peach, growing, quality, Lining, black, size, white, standard, force, bos, price, industrial, power, offline, background, skin | 0.078134 |
| Topic 7 | Marketing mode | 3282 | game, mail, topic, Karna, competition, link, article, story, post, love, heart, trend, trust, popular, original, professional, effective, genuine, positive, future, online, offline, official, college, street, land | 0.16396 |
| Topic 8 | Stakeholders | 2485 | men, Chinese, woman, student, consumer, teacher, American, local, baby, girl, female, runner, adult, boy, British, designer, consumer, costumer, owner, manager, seller, buyer, player, supplier, charity, commission, agent, blogger | 0.12414 |
| Topic 9 | Feedback of product or brand | 10498 | cheap, comfortable, real, specialty, crazy, congratulation, rich, lucky, cheaper, gorgeous, special, soft, dynamic, durable, authentic, normal, ideal, happy, negative, awesome, great, amazing, excellent, exclusive, cool | 0.43573 |
| Topic 10 | Community | 8931 | post, share, community, club, blog, parent, team, men, woman, sister, girl, female, baby, chief, family, grandma, runner, city, run, platform, store, commerce, company, system | 0.37069 |
| Topic 11 | Lifestyle | 4664 | shopping, classic, product, team, experience, woman, fashion, shop, technology, food, income, massage, Official, football, running, sport, game, college, street, dress code, training, decathlon, walk, bike, badminton, fish, runway, esthetic, road, land, peak, dance, pavilion, field | 0.19358 |
| First-Level Indicators (Topic Information from LDA Modeling Analysis) | Second-Level Indicators | Third-Level Indicator (Feature Words from LDA Modeling Analysis) |
|---|---|---|
| Platform and Webpage | Webpage information and layout | term, item, guide, channel |
| Retailing platform | platform, store, online, website, mall, computer, Taobao, shop, Jingdong, offline, WhatsApp, Lazada, phone, Tmall, Xiaomi | |
| Brand | Business | brand, commerce, company, industry, level, business |
| Brand name | Nike, lining, Jordan, Tape, Converse, Anta | |
| Brand positioning | upper, board, classic, professional, premium, version | |
| Market places | Chicago, Singapore, London, Paris, Shanghai, Yangzhou, Putian | |
| Stores and branch information | branch, location, vipshop | |
| Product Information | Products categories | shoe, shoes, sneaker, shell, standard |
| Basic information | type, data, technology, style, size, copyright, logo | |
| Material/fabric | carbon, sol, rubber, plastic, leather, silk, lace, steel, foam, fluorescent | |
| Price | discount, cost, sale, expensive, wholesale, free, sell, voucher, charge | |
| Color | black, white, gold, gray, peach, green, silver, blue, orange, brown, beige, pink, purple, colorful | |
| Details | sole, size, model, physical, insole, cushion, heel, cell, hole, midsole, sharp | |
| Product positioning/design positioning | upper, board, classic, fashion, dynamic, original, professional, level, effective, genuine, trend, specialty, usual, collection, concept, fashion | |
| Product features/advantages | function, weight, power, hard, matching, physical, balance, comfortable, soft, breathable, lightweight, quality, feel, technology, | |
| Design process | process, concept | |
| Making process | process, method | |
| Product data | data, rate, quality | |
| Services | Service items | business, system, service, item, private |
| Shopping process | gift, package, list, bill, payment, answer | |
| Appointment | book | |
| Delivery | ship, delivery | |
| After-sale | return, exchange, suggestion, policy, law, track | |
| Attitude | passion, professional, attitude, positive | |
| Additional Services | Interactive or display methods | technology, interface, voice, feel, online, offline, screen, feel, feeling, sound, picture, visual, photo, text, video, animation, voice, feel, sense, dynamic |
| Sports categories | sport, football, running, training, decathlon, ball, walk, bike, badminton, fish, dance, basketball | |
| Events | ticket, competition, program, club | |
| Dressing scenario | official, football, running, sport, game, college, street, dress code, training, decathlon, walk, bike, badminton, fish, runway, esthetic, road, land, peak, dance, pavilion, field | |
| Dressing scenario (Group) | parent, team, men, woman, sister, girl, female, baby, chief, family, grandma, runner, city, run | |
| Dressing time | time, morning, summer, day, hour, month, timely | |
| Relevant clothes and matching | slipper, pant, bag, watch, sandal, cloth, shirt, jean, clothes, sock | |
| Marketing | Marketing mode | game, mail, topic, Karna, competition, link, article, story, post |
| Branding content and brand identity | love, heart, trend, trust, popular, original, professional, effective, genuine, positive | |
| Marketing scenario | future, online, offline, official, college, street, land, competition | |
| Stakeholders | Target consumer segment | men, Chinese, woman, student, consumer, teacher, American, local, baby, girl, female, runner, adult, boy, British |
| Primary stakeholders | designer, consumer, costumer, owner, manager, seller, buyer, player, supplier | |
| Secondary stakeholders | charity, commission, agent, blogger | |
| People | men, woman, sister, girl, female, baby, chief, family, grandma, runner, city, run | |
| Spokesperson | Owen, star, team, Bos, avatar | |
| Lifestyle | Lifestyle | food, income, massage, official, football, running, sport, game, college, street, dress code, training, decathlon, walk, bike, badminton, fish, runway, esthetic, road, land, peak, dance, pavilion, field |
| Community | Community | post, share, community, club, blog |
| Feedback of Product or Brand | Description of product or brand (positive) | cheap, comfortable, real, specialty, crazy, congratulation, rich, lucky, cheaper, gorgeous, special, soft, dynamic, durable, authentic, normal, ideal, happy, negative, awesome, great, amazing, excellent, exclusive, cool |
| Feedback of product or brand (negative) | fake, shame, force, pain, stinky, false, upset |
| First-Level Indicators (Topic Information from LDA Modeling Analysis) | Second-Level Indicators | Third-Level Indicator (Feature Words from LDA Modeling Analysis) |
|---|---|---|
| Platform and Webpage | Webpage information and layout | term, item, guide, channel |
| Retailing platform | platform, store, online, website, mall, computer, Taobao, shop, Jingdong, offline, WhatsApp, Lazada, phone, Tmall, Xiaomi | |
| Brand | Business | brand, commerce, company, industry, level, business |
| Brands name | Nike, Lining, Jordan, Tape, Converse, Anta | |
| Brand positioning | upper, board, classic, professional, premium, version | |
| Market places | Chicago, Singapore, London, Paris, Shanghai, Yangzhou, Putian | |
| Stores and branch information | branch, location, vipshop | |
| Product Information | Products categories | shoe, shoes, sneaker, shell, standard |
| Basic information | type, data, technology, style, size, copyright, logo | |
| Material /fabric | carbon, sol, rubber, plastic, leather, silk, lace, steel, foam, fluorescent | |
| Price | discount, cost, sale, expensive, wholesale, free, sell, voucher, charge | |
| Color | black, white, gold, gray, peach, green, silver, blue, orange, brown, beige, pink, purple, colorful | |
| Details | sole, size, model, physical, insole, cushion, heel, cell, hole, midsole, sharp | |
| Product positioning/design positioning | upper, board, classic, fashion, dynamic, original, professional, level, effective, genuine, trend, specialty, usual, collection, concept, fashion | |
| Product features/advantages | function, weight, power, hard, matching, physical, balance, comfortable, soft, breathable, lightweight, quality, feel, technology, | |
| Design process | process, concept | |
| Making process | process, method | |
| Product data | data, rate, quality | |
| Services | Service items | business, system, service, item, private |
| Shopping process | gift, package, list, bill, payment, answer | |
| Appointment | book | |
| Delivery | ship, delivery | |
| After-sale | return, exchange, suggestion, policy, law, track | |
| Attitude | passion, professional, attitude, positive | |
| Additional Services | Interactive or display methods | technology, interface, voice, feel, online, offline, screen, feel, feeling, sound, picture, visual, photo, text, video, animation, voice, feel, sense, dynamic |
| Sports categories | sport, football, running, training, decathlon, ball, walk, bike, badminton, fish, dance, basketball | |
| Events | ticket, competition, program, club | |
| Dressing scenario | official, football, running, sport, game, college, street, dress code, training, decathlon, walk, bike, badminton, fish, runway, esthetic, road, land, peak, dance, pavilion, field | |
| Dressing scenario (Group) | parent, team, men, woman, sister, girl, female, baby, chief, family, grandma, runner, city, run | |
| Dressing time | time, morning, summer, day, hour, month, timely | |
| Relevant clothes and matching | slipper, pant, bag, watch, sandal, cloth, shirt, jean, clothes, sock | |
| Marketing | Marketing mode | game, mail, topic, Karna, competition, link, article, story, post |
| Branding content and brand identity | love, heart, trend, trust, popular, original, professional, effective, genuine, positive | |
| Marketing scenario | future, online, offline, official, college, street, land, competition | |
| Stakeholders | Target consumer segment | men, Chinese, woman, student, consumer, teacher, American, local, baby, girl, female, runner, adult, boy, British |
| Primary stakeholders | designer, consumer, costumer, owner, manager, seller, buyer, player, supplier | |
| Secondary stakeholders | charity, commission, agent, blogger | |
| People | men, woman, sister, girl, female, baby, chief, family, grandma, runner, city, run | |
| Spokesperson | Owen, star, team, Bos, avatar | |
| Lifestyle | Lifestyle | food, income, massage, official, football, running, sport, game, college, street, dress code, training, decathlon, walk, bike, badminton, fish, runway, esthetic, road, land, peak, dance, pavilion, field |
| Community | Community | post, share, community, club, blog |
| Feedback of Product or Brand | Description of product or brand (positive) | cheap, comfortable, real, specialty, crazy, congratulation, rich, lucky, cheaper, gorgeous, special, soft, dynamic, durable, authentic, normal, ideal, happy, negative, awesome, great, amazing, excellent, exclusive, cool |
| Feedback of product or brand (negative) | fake, shame, force, pain, stinky, false, upset |
| No. | Themes | Topics | Detailed Descriptions |
|---|---|---|---|
| 1 | Platform and Webpage Design | Beautiful interface | Reasonable design of fonts, colors, graphics, etc. |
| 2 | Smooth operation | Improve the efficiency of one-handed interaction | |
| 3 | Clear layout | Reasonable layout of product categories, functional areas and other items, easily accessible information | |
| 4 | Product Information | Immediate information | Timely update of information |
| 5 | Product basic information | Graphical presentation of sports shoes basic information (including color, price, style, etc.) | |
| 6 | Product special features information | Graphic introduction to the design, style, fabric, etc., special features for the sports shoes | |
| 7 | Interactive Display | Interactive display of fabrics | Visualization of fabrics used in sports shoes |
| 8 | Interactive display of material | Visualization of special materials used in sports shoes | |
| 9 | Interactive display of high-performance features | Visualization of waterproof, breathable, high elasticity and ultra-light performance of sports shoes | |
| 10 | Interactive display of comprehensive product features | A comprehensive display of sports shoe design, esthetics, shape, fabrics, materials, features and functions | |
| 11 | Interactive display of making techniques | Visualization of making techniques, cutting techniques, sewing techniques, etc., of sports shoes | |
| 12 | Interactive display of package | Visualization of package | |
| 13 | Interactive Display Methods | VR and AR | The use of VR and AR technologies in interactive display |
| 14 | Animation | Use animation to present information in online shopping platforms | |
| 15 | Video | The use of new media as a way of presenting sports shoe product information on online shopping platforms | |
| 16 | Sound | Provide the background music in online shopping platforms | |
| 17 | Touch | Providing tactile perception of the fabric or material of sports shoes | |
| 18 | Additional Services | After-sales service policy | Provide relevant after-sales service policy information |
| 19 | Platform user evaluation | Should online shopping platforms provide user reviews and rating systems for shopping experiences? | |
| 20 | Size testing | If online size testing function is provided | |
| 21 | Personalized customization | Providing personalized and customized options for sports shoes products on online shopping platforms | |
| 22 | Virtual try-on | Providing immersive virtual try-on based on individual image in online shopping platforms | |
| 23 | Dressing way recommendations | Providing coordination schemes for related apparel such as clothing, accessories, etc., for sports shoes | |
| 24 | Dress scenario recommendations | Providing and visualization presentation of this sportswear scenario (sports scene or sports occasion) recommendations | |
| 25 | Product usage data | Providing data on the usage duration, wear status of sports shoes, and related visual presentations | |
| 26 | Community | Product community information | Provide community platform information for product communication and sharing |
| 27 | Sports community information | Provide community platform information for sports events or sports activities | |
| 28 | Feedback | Product comment | Provide information about product reviews from customers who have purchased this product |
| 29 | Spokesperson | Avatar | If the product spokesperson image in an online shopping platform is a digital avatar |
| 30 | Real people | If the product spokesperson image in the online shopping platform is a real person? (e.g., sports stars, entertainment icons, community figures, designers, etc.) |
| Function/Service | Negative Questions | |||||
|---|---|---|---|---|---|---|
| Highly Dislike (1 Score) | Acceptable (2 Scores) | Indifferent (3 Scores) | As Expected (4 Scores) | Highly Like (5 Scores) | ||
| Positive questions | Highy Dislike (1 score) | Q | R | R | R | R |
| Acceptable (2 scores) | M | I | I | I | R | |
| Indifferent (3 scores) | O | I | I | I | R | |
| As Expected (4 scores) | M | I | I | I | R | |
| Highly like (5 scores) | Q | A | A | A | Q | |
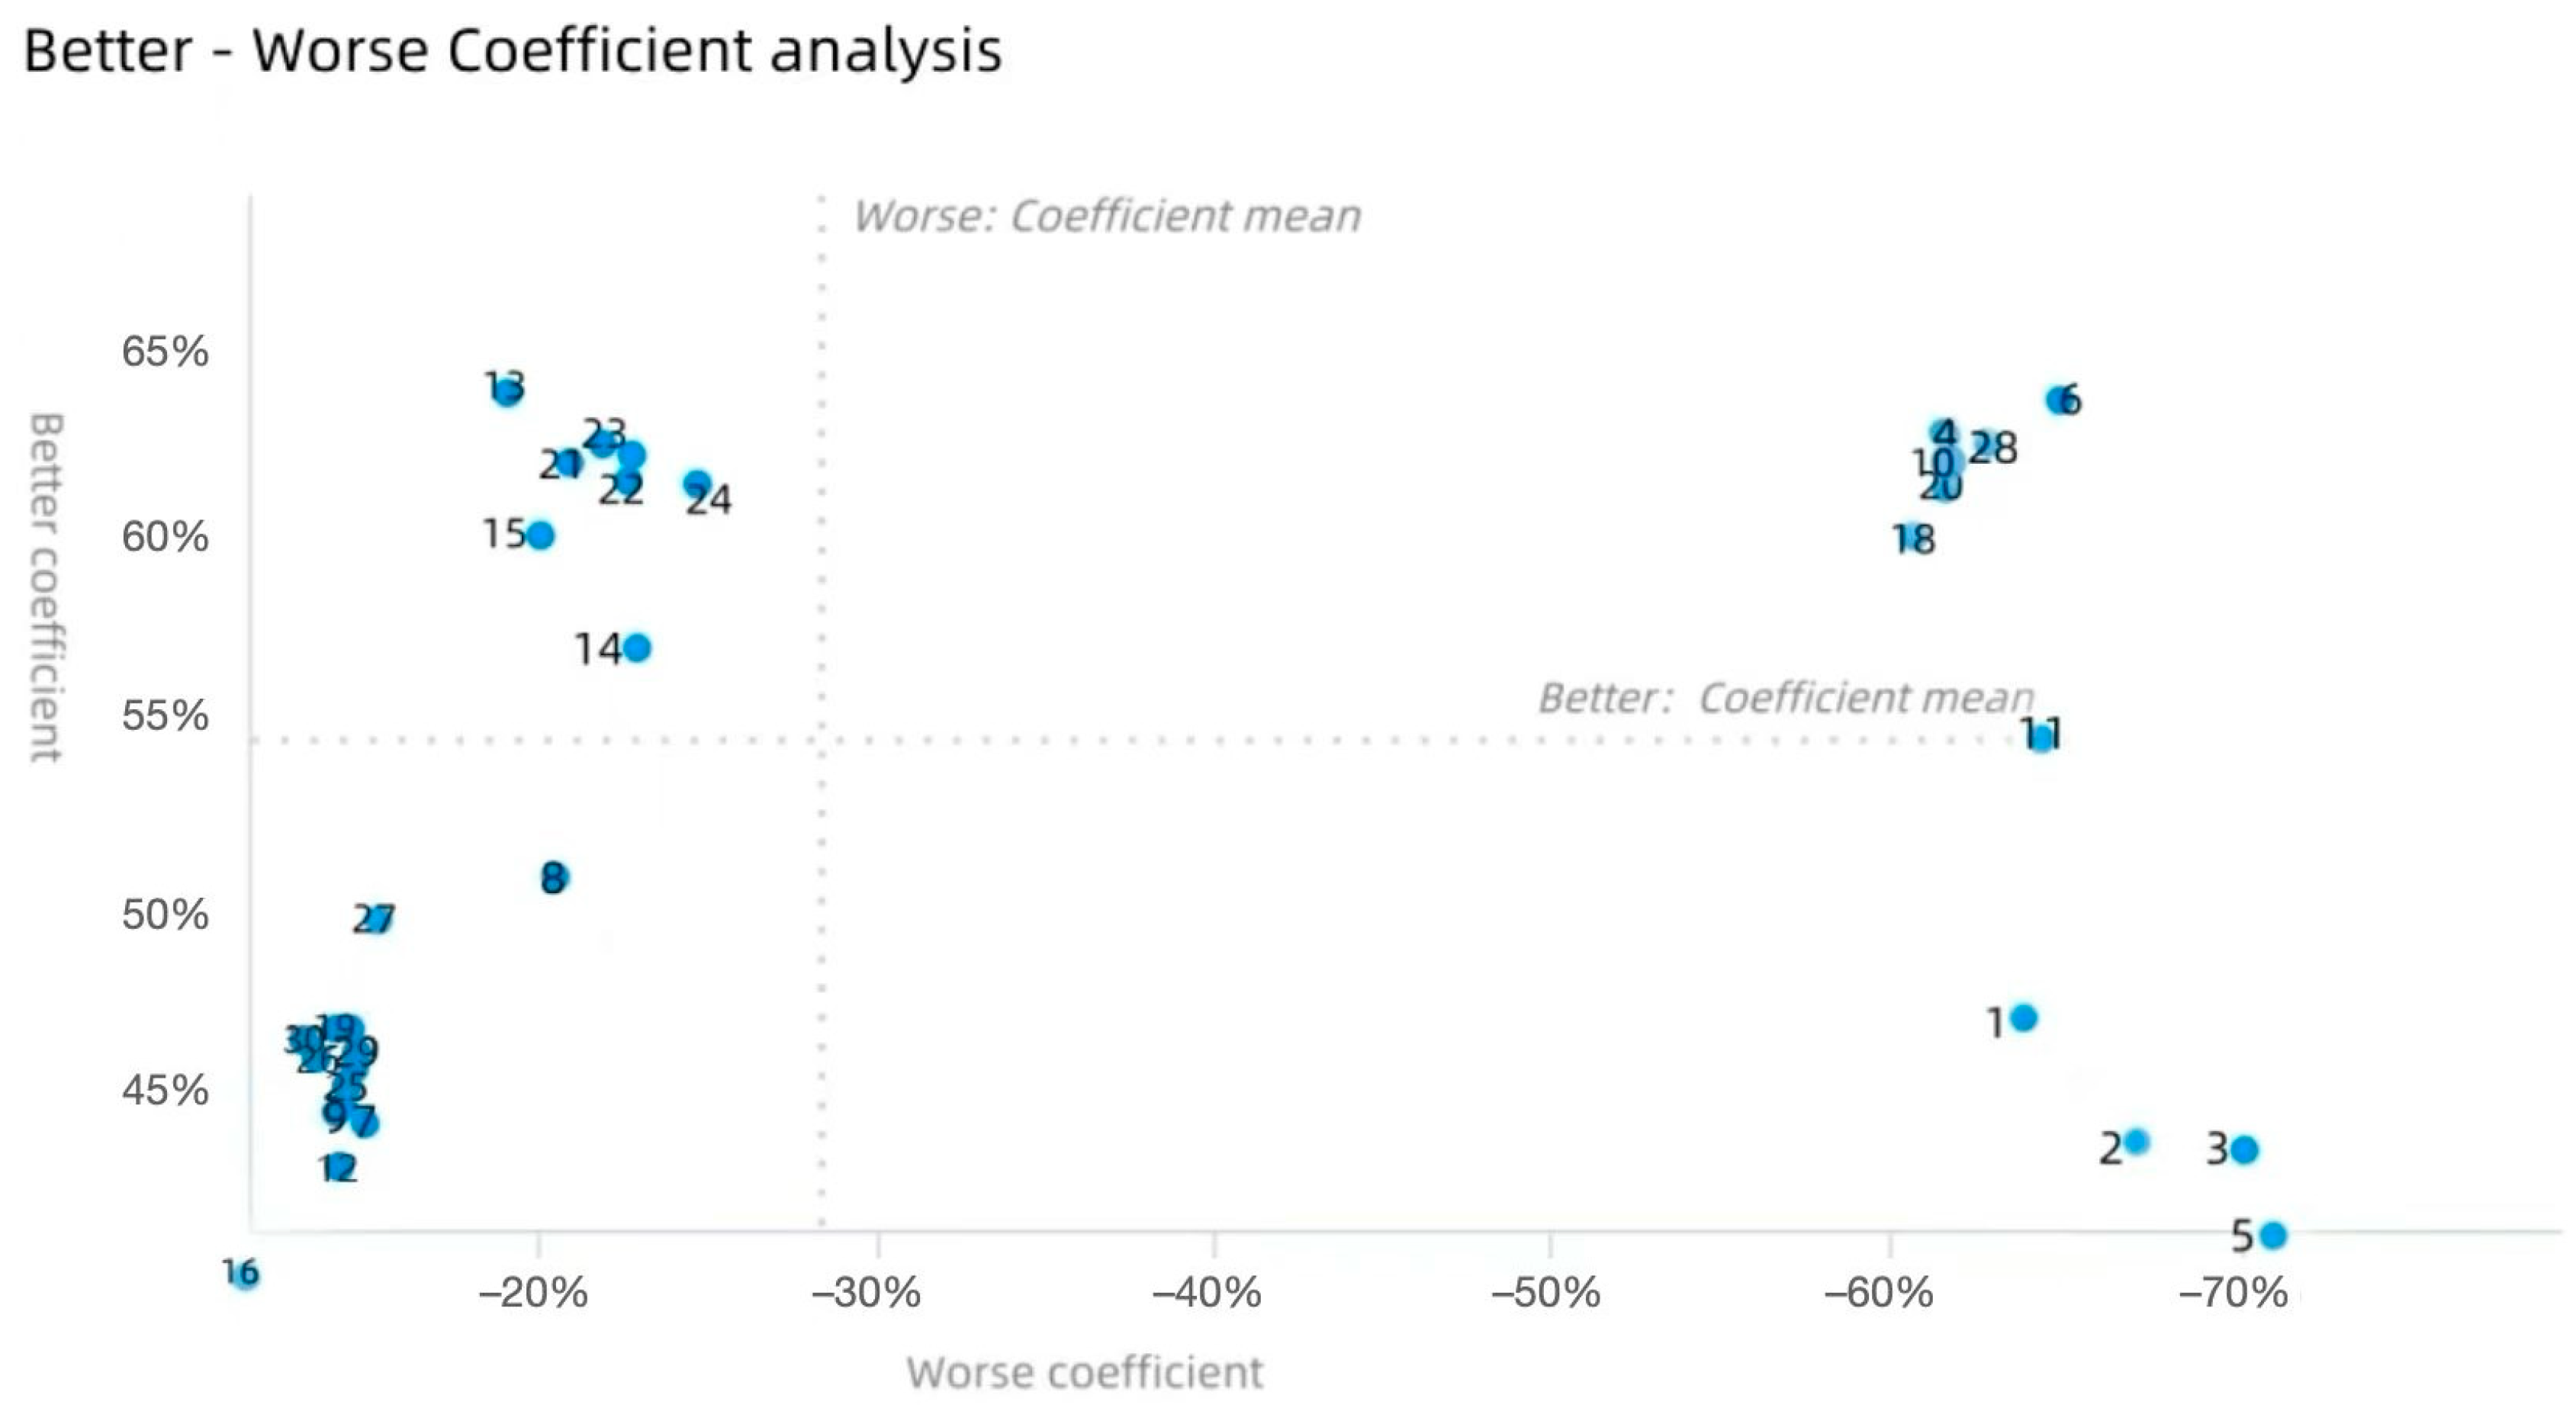
| No. | Topic | M | O | A | I | R | Q | C | Better | Worse |
|---|---|---|---|---|---|---|---|---|---|---|
| 1 | Beautiful interface | 40.00 | 25.70 | 22.60 | 11.70 | 0.00 | 0.00 | M | 48.30 | −65.70 |
| 2 | Smooth operation | 50.18 | 18.12 | 24.47 | 7.23 | 0.00 | 0.00 | M | 42.59 | −68.30 |
| 3 | Clear layout | 43.43 | 16.17 | 26.73 | 13.67 | 0.00 | 0.00 | M | 42.90 | −70.23 |
| 4 | Immediate information | 12.91 | 44.17 | 15.53 | 20.19 | 5.63 | 1.55 | O | 64.33 | −61.51 |
| 5 | Product basic information | 36.07 | 30.33 | 7.38 | 18.85 | 0.00 | 7.38 | M | 40.71 | −71.68 |
| 6 | Product special features information | 11.36 | 49.81 | 10.19 | 22.72 | 5.44 | 0.49 | O | 63.78 | −65.02 |
| 7 | Interactive display of fabrics | 5.44 | 9.42 | 28.83 | 47.09 | 8.74 | 0.49 | I | 42.14 | −16.36 |
| 8 | Interactive display of material | 2.46 | 18.85 | 33.61 | 36.89 | 0.00 | 8.20 | I | 52.46 | −21.31 |
| 9 | Interactive display of high-performance features | 5.92 | 5.83 | 34.08 | 45.15 | 8.93 | 0.10 | I | 43.86 | −12.91 |
| 10 | Interactive display of comprehensive product features | 22.72 | 35.44 | 23.88 | 12.33 | 3.79 | 1.84 | O | 62.86 | −61.63 |
| 11 | Interactive display of making techniques | 18.35 | 40.39 | 10.49 | 22.52 | 7.09 | 1.17 | O | 55.45 | −64.02 |
| 12 | Interactive display of package | 6.50 | 7.18 | 33.30 | 45.15 | 7.67 | 0.19 | I | 43.94 | −14.86 |
| 13 | VR and AR | 6.21 | 11.55 | 48.16 | 27.38 | 6.12 | 0.58 | A | 64.00 | −19.04 |
| 14 | Animation | 2.46 | 18.85 | 31.15 | 36.07 | 0.00 | 11.48 | I | 56.48 | −24.07 |
| 15 | Video | 4.37 | 14.56 | 42.23 | 33.4 | 2.72 | 2.72 | A | 60.06 | −20.02 |
| 16 | Sound | 0.82 | 4.10 | 18.03 | 64.75 | 4.10 | 8.20 | I | 25.23 | −5.61 |
| 17 | Touch | 5.83 | 16.02 | 43.88 | 30.49 | 3.30 | 0.49 | A | 62.26 | −22.7 |
| 18 | After-sales service policy | 26.12 | 31.94 | 25.44 | 12.04 | 1.26 | 3.20 | O | 60.06 | −60.77 |
| 19 | Platform user evaluation | 3.40 | 9.51 | 33.5 | 46.02 | 6.12 | 1.46 | I | 46.53 | −13.97 |
| 20 | Size testing | 18.93 | 40.29 | 20.00 | 16.80 | 2.33 | 1.65 | O | 62.79 | −61.68 |
| 21 | Personalized customization | 6.99 | 12.82 | 45.92 | 28.83 | 3.69 | 1.75 | A | 62.11 | −20.94 |
| 22 | Virtual try-on | 3.50 | 18.45 | 41.17 | 33.79 | 2.62 | 0.49 | A | 61.52 | −22.65 |
| 23 | Dressing way recommendations | 8.93 | 12.23 | 48.16 | 27.18 | 2.33 | 1.17 | A | 62.58 | −21.93 |
| 24 | Dress scenario recommendations | 5.24 | 18.83 | 41.17 | 32.33 | 2.23 | 0.19 | A | 61.49 | −24.68 |
| 25 | Product usage data | 3.79 | 9.32 | 31.65 | 47.57 | 6.31 | 1.36 | I | 44.37 | −14.20 |
| 26 | Product community information | 6.99 | 6.02 | 35.24 | 45.05 | 6.21 | 0.49 | I | 44.22 | −13.94 |
| 27 | Sports community information | 3.20 | 10.49 | 36.12 | 41.94 | 6.21 | 2.04 | I | 50.79 | −14.92 |
| 28 | Product comment | 19.80 | 41.16 | 21.00 | 15.90 | 2.0 | 0.14 | O | 63.52 | −62.29 |
| 29 | Avatar | 4.27 | 9.13 | 34.17 | 45.53 | 5.63 | 1.26 | I | 46.51 | −14.39 |
| 30 | Real people | 7.77 | 5.53 | 35.92 | 42.04 | 8.64 | 0.10 | I | 45.43 | −14.57 |
| Attribute | Themes | Topics | Features |
|---|---|---|---|
| Must-be attribute (M) | Webpage design | No. 1 Beautiful interface | Usability, esthetics, accessibility |
| No. 2 Smooth operation | |||
| No. 3 Clear layout | |||
| Product information | No. 5 Product basic information | Basic product information | |
| Performance attribute (O) | Product information | No. 4 Immediate information | Immediacy |
| No. 6 Product special features information | Products value-added, personalization | ||
| Interactive display | No. 10 Interactive display of comprehensive product features | Interactivity | |
| No. 11 Interactive display of making techniques | Interactivity, safety, technologization | ||
| Additional services | No. 18 After-sales service policy | Interactivity, safety, technologization | |
| No. 20 Size testing | Safety, immersion, experiential, interactivity | ||
| Feedback | No. 28 Product comment | Safety | |
| Attractive attribute (A) | Interactive display methods | No. 13 VR and AR | Socialization, interactivity, technologization |
| No. 15 Video | |||
| No. 17 Touch | |||
| Additional services | No. 21 Personalized customization | Personalization | |
| No. 22 Virtual try-on | Immersion, experiential | ||
| No. 23 Dressing way recommendations | Personalization, socialization | ||
| No. 24 Dress scenario recommendations | Personalization, socialization, belonging |
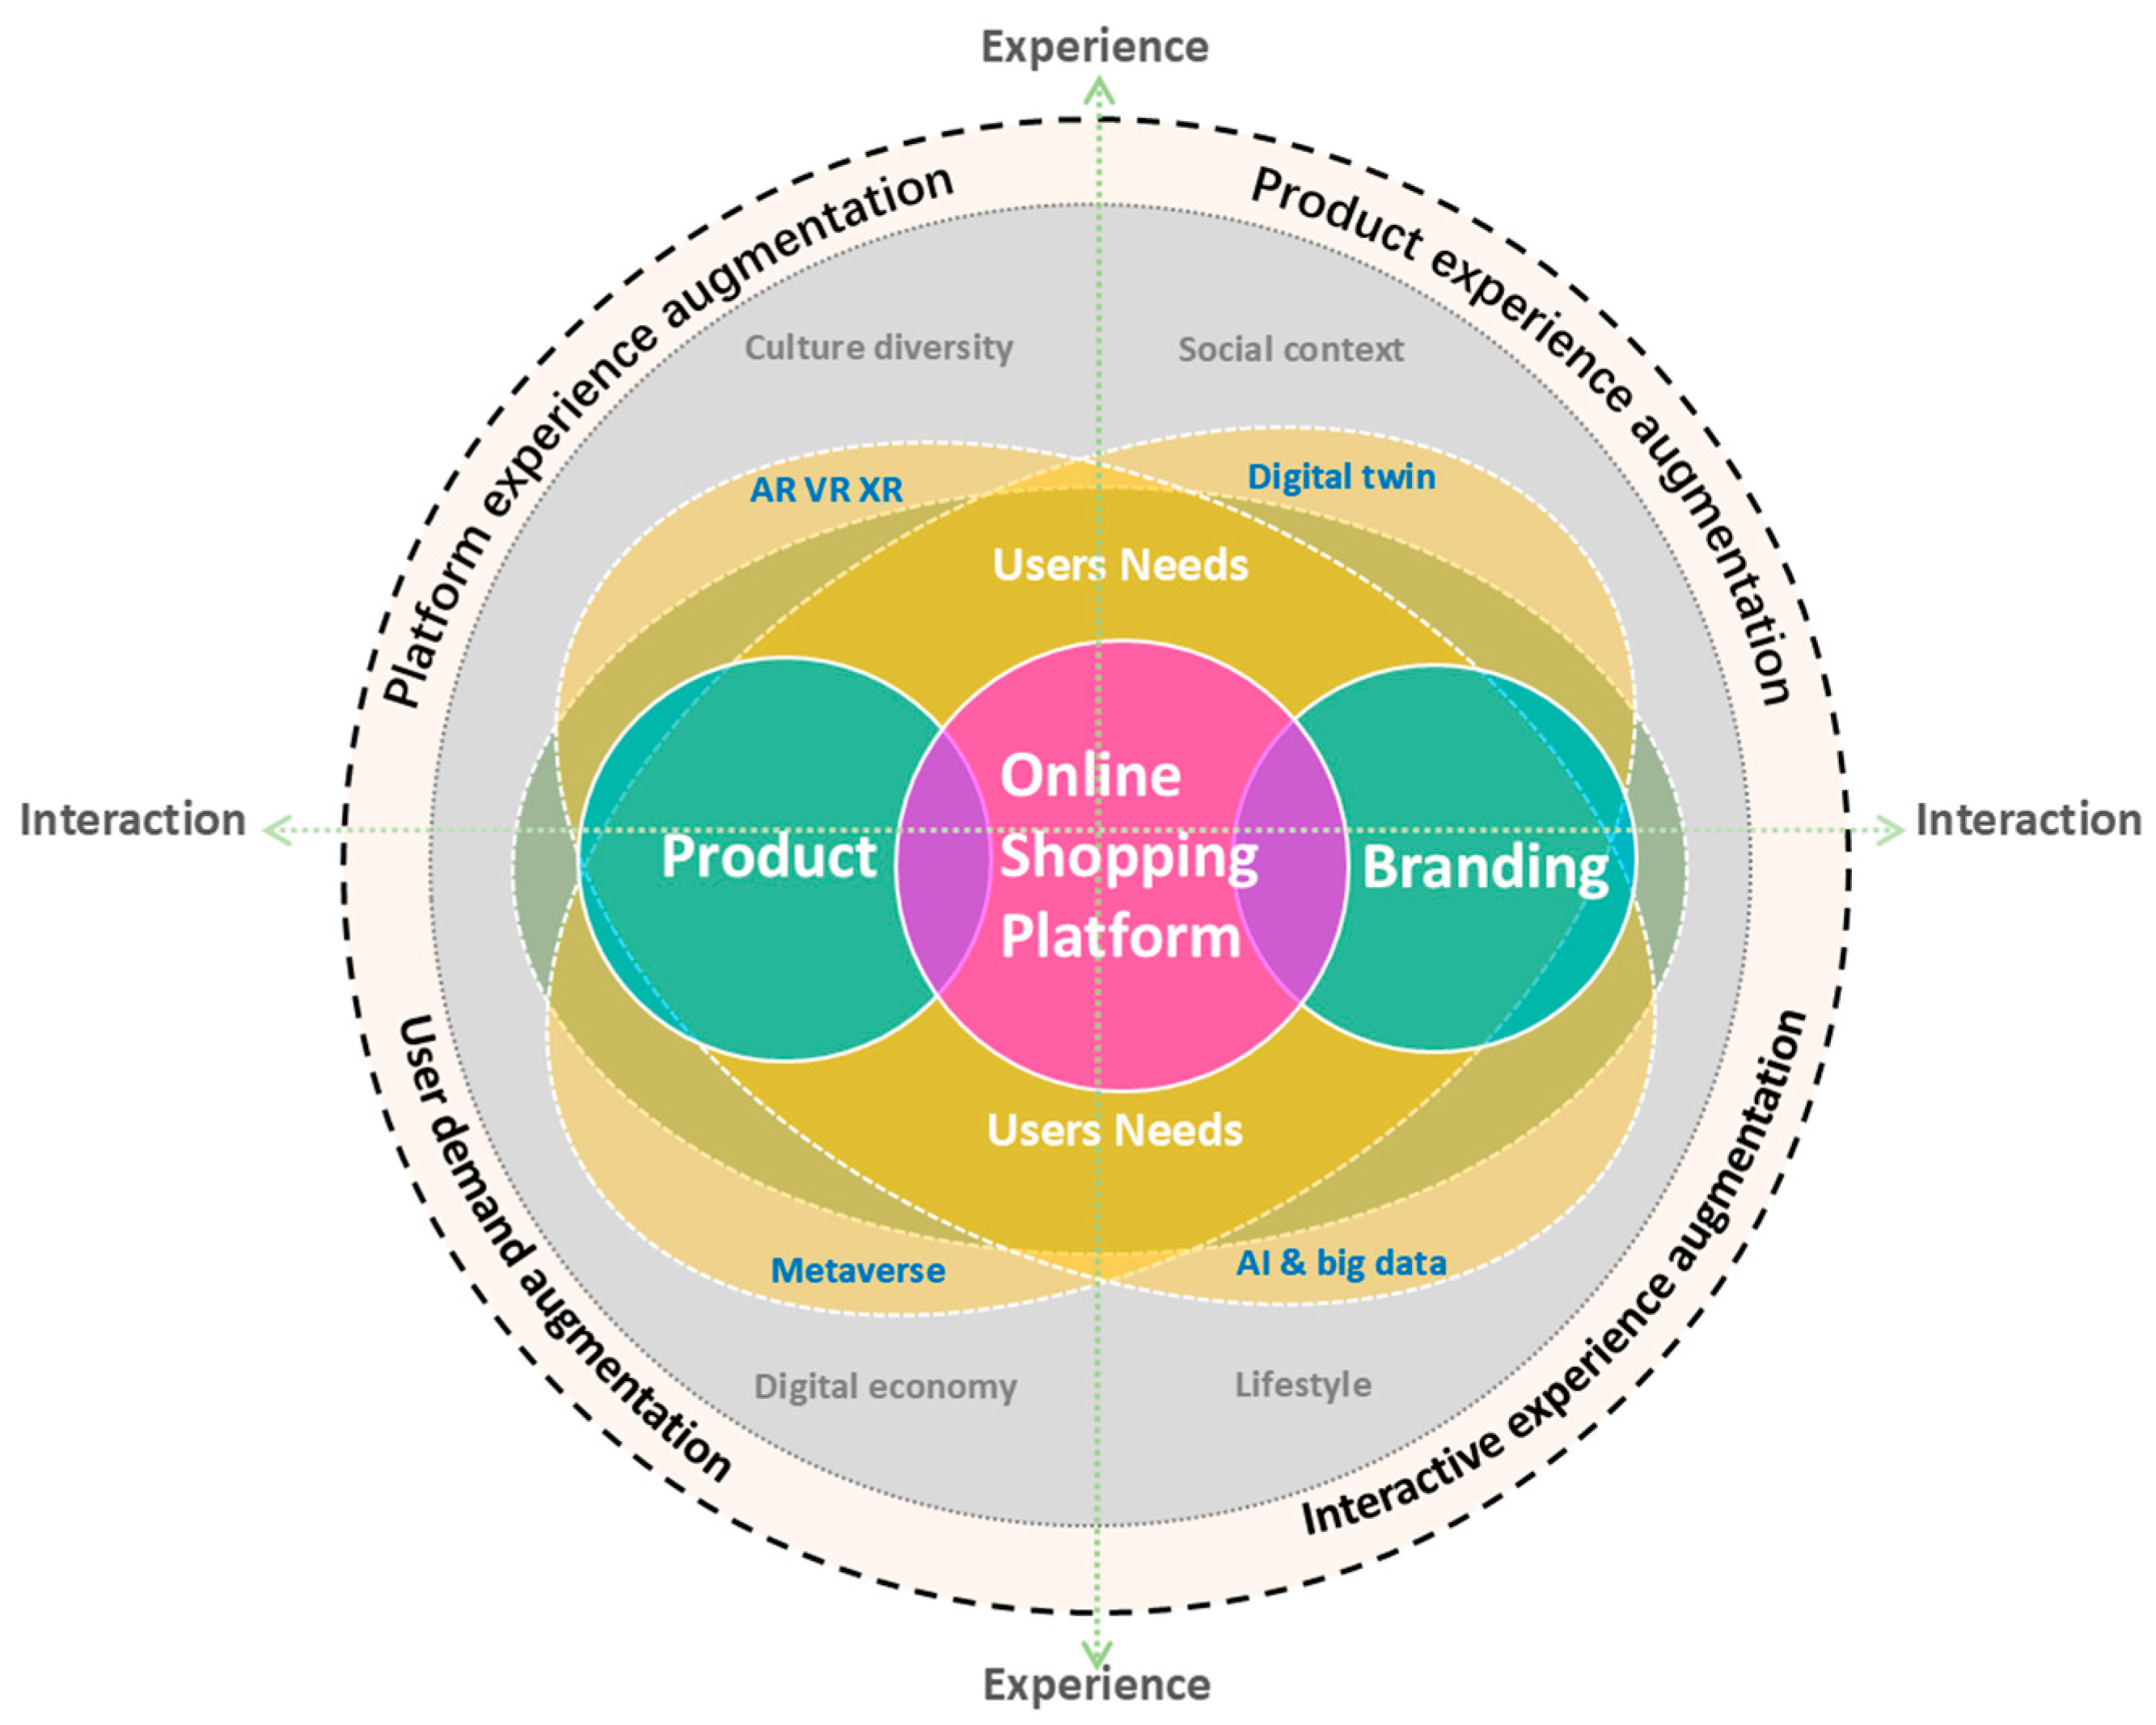
| Augmentation Dimensions | Experience Needs | |
|---|---|---|
| Platform experience augmentation | Usability, esthetics, accessibility, immediacy | Overall experience: humanization, usability, emotionality, technologization |
| Product experience augmentation | Tangible products and intangible products (service); Economy, structure, function, technology, esthetics. Products and services value-added enabled by technology. | |
| User demand augmentation | Safety, utility, comfort; identity, emotional support, belonging, personalization | |
| Interactive experience augmentation | Interactivity, personalization, socialization, technologization, immersion | |
Disclaimer/Publisher’s Note: The statements, opinions and data contained in all publications are solely those of the individual author(s) and contributor(s) and not of MDPI and/or the editor(s). MDPI and/or the editor(s) disclaim responsibility for any injury to people or property resulting from any ideas, methods, instructions or products referred to in the content. |
© 2025 by the authors. Licensee MDPI, Basel, Switzerland. This article is an open access article distributed under the terms and conditions of the Creative Commons Attribution (CC BY) license (https://creativecommons.org/licenses/by/4.0/).
Share and Cite
Zou, Y.; Zhao, C.; Childs, P.; Luh, D.; Tang, X. User Experience Design for Online Sports Shoe Retail Platforms: An Empirical Analysis Based on Consumer Needs. Behav. Sci. 2025, 15, 311. https://doi.org/10.3390/bs15030311
Zou Y, Zhao C, Childs P, Luh D, Tang X. User Experience Design for Online Sports Shoe Retail Platforms: An Empirical Analysis Based on Consumer Needs. Behavioral Sciences. 2025; 15(3):311. https://doi.org/10.3390/bs15030311
Chicago/Turabian StyleZou, Yixin, Chao Zhao, Peter Childs, Dingbang Luh, and Xiaoying Tang. 2025. "User Experience Design for Online Sports Shoe Retail Platforms: An Empirical Analysis Based on Consumer Needs" Behavioral Sciences 15, no. 3: 311. https://doi.org/10.3390/bs15030311
APA StyleZou, Y., Zhao, C., Childs, P., Luh, D., & Tang, X. (2025). User Experience Design for Online Sports Shoe Retail Platforms: An Empirical Analysis Based on Consumer Needs. Behavioral Sciences, 15(3), 311. https://doi.org/10.3390/bs15030311