
From Individual Expression to Group Polarization: A Study on Twitter’s Emotional Diffusion Patterns in the German Election

Abstract
:1. Introduction
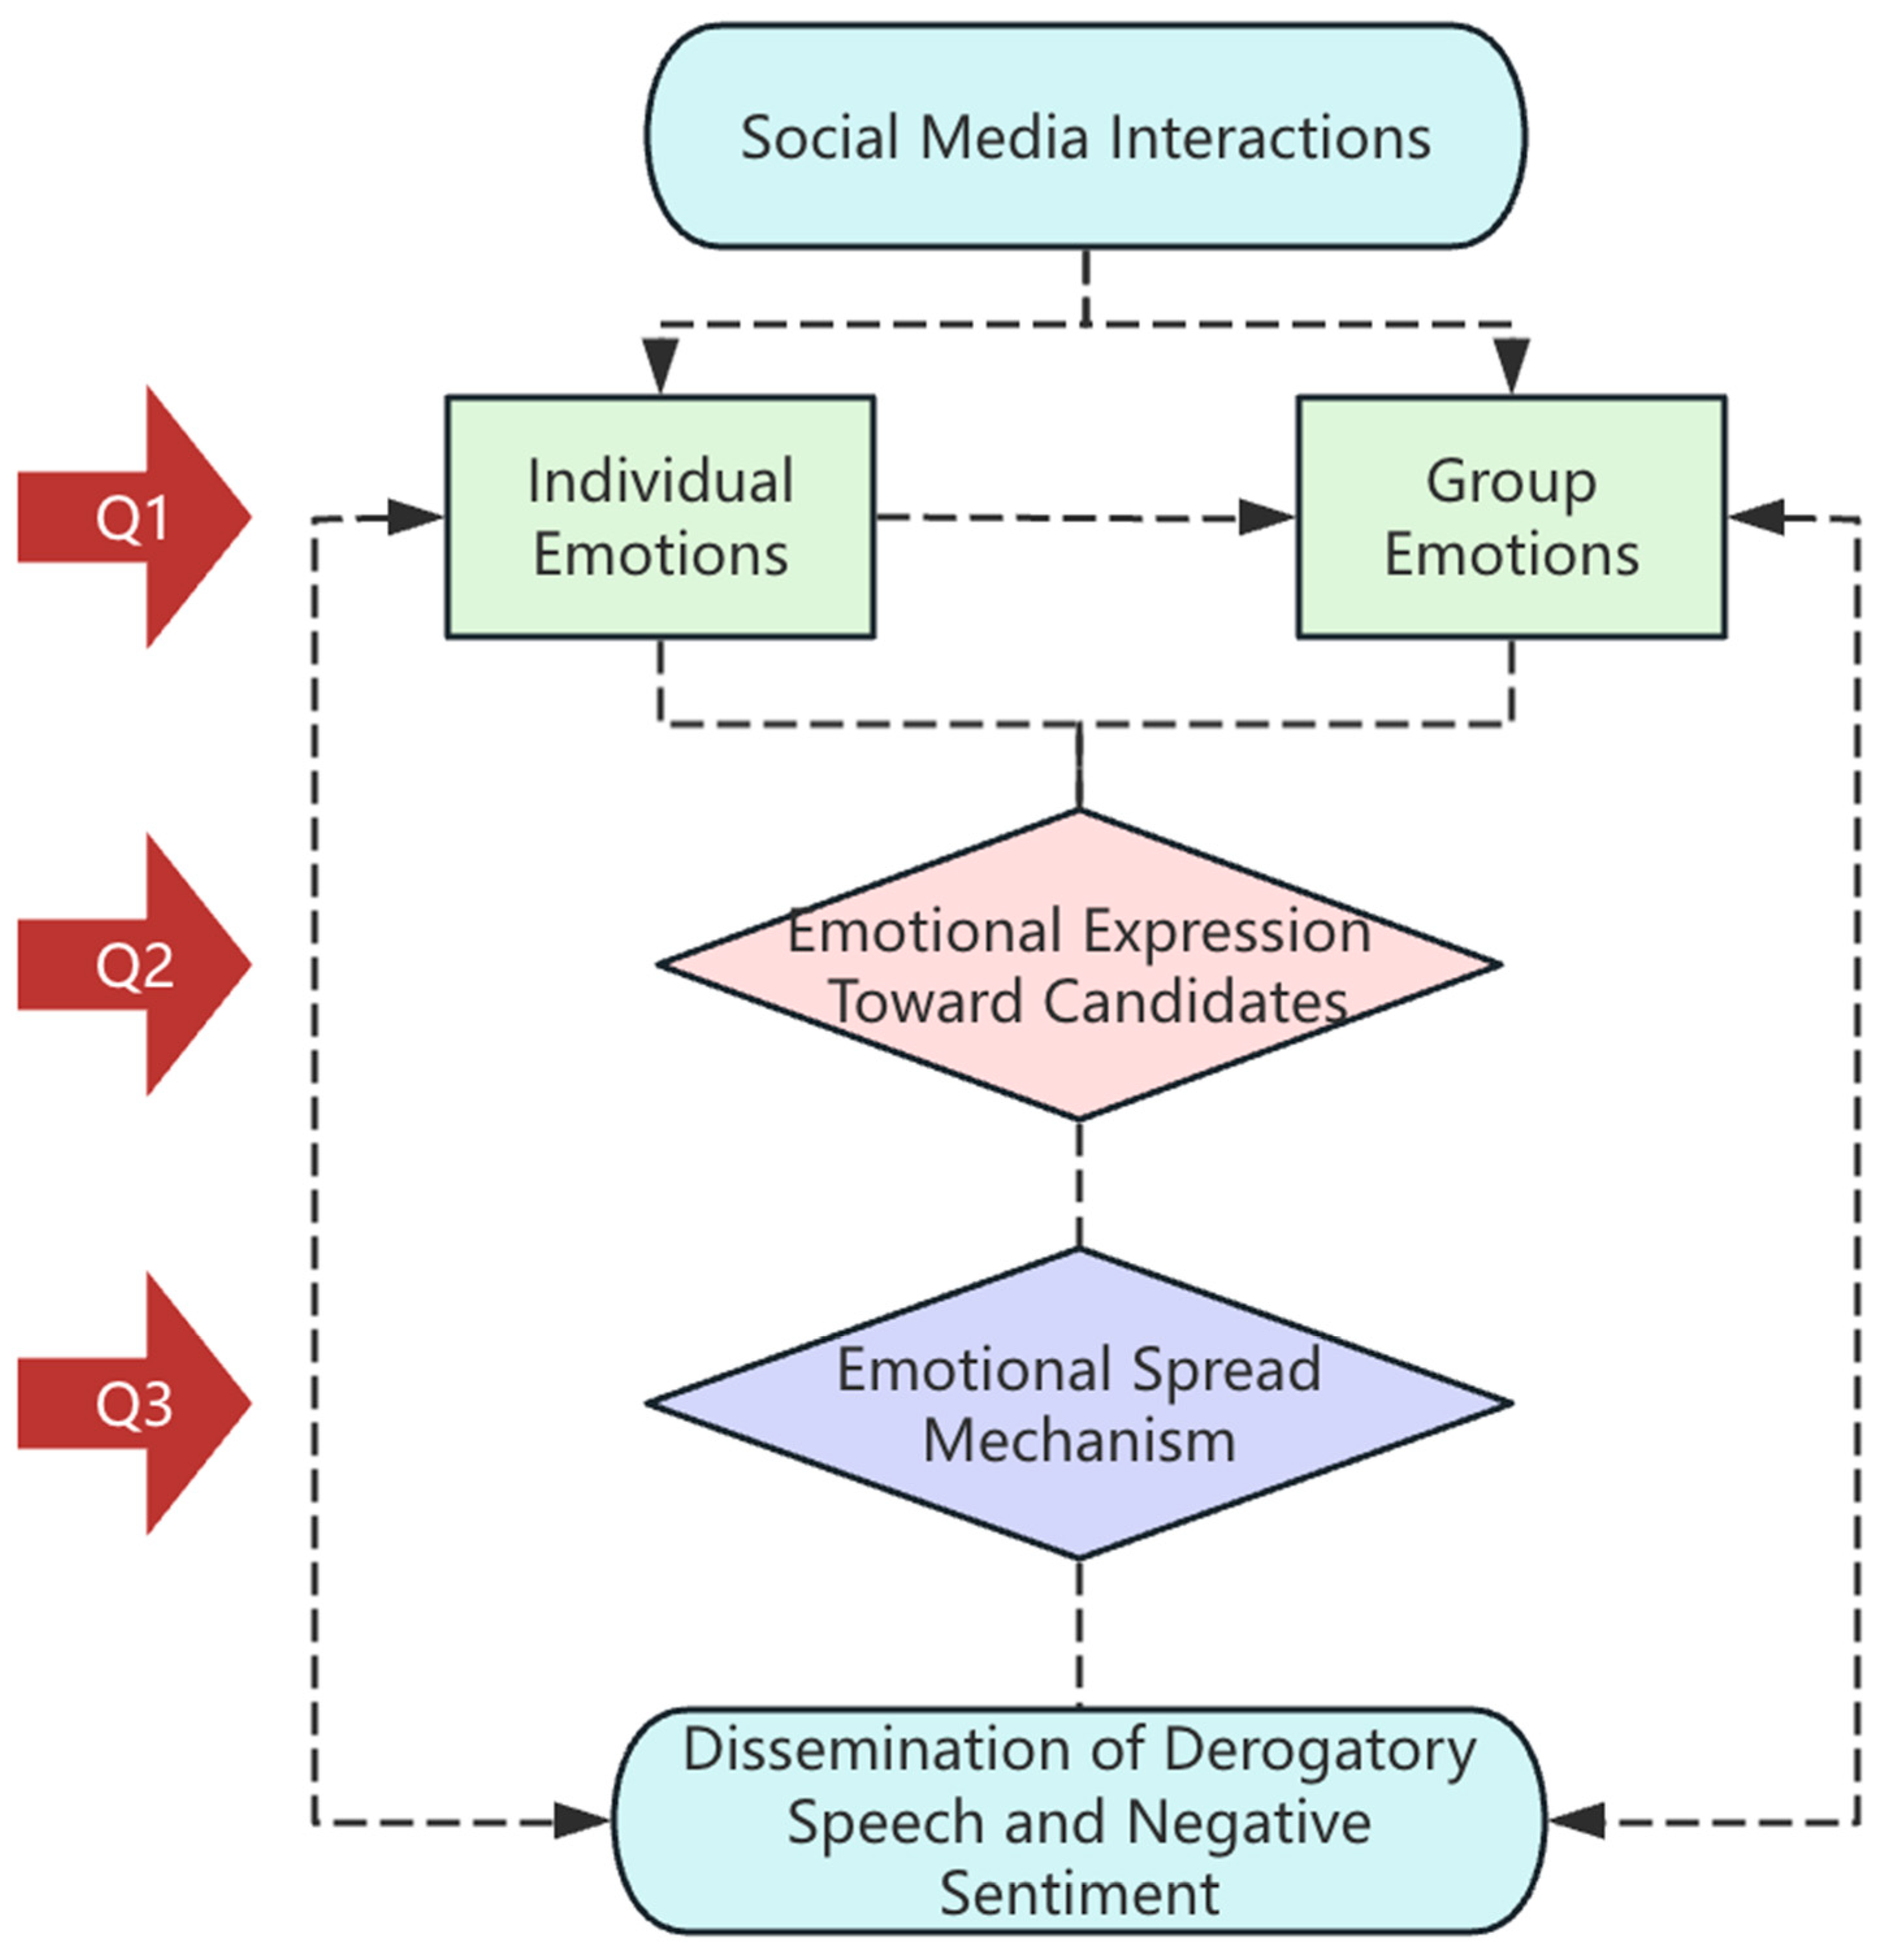
- Q1:
- How do individual emotions evolve into group emotions in social media discussions during the election?
- Q2:
- How do voters express emotional perceptions of candidates on social media? What patterns and characteristics emerge in derogatory speech within election discussions?
- Q3:
- Does sentiment intensity correlate with the spread of tweets? Are negative tweets more widely disseminated than positive or neutral ones?
2. Literature Review
2.1. Research on the Application of Twitter in Elections
2.1.1. Research on Political Parties’ and Candidates’ Use of Twitter
2.1.2. Research on Public Use of Twitter in Elections
2.2. Application of Sentiment Analysis in Social Media Research
2.3. Ideological Homophily, Emotional Diffusion, and Echo Chambers in Social Media
3. Research Methods
3.1. Mixed Methods
3.2. Data Collection
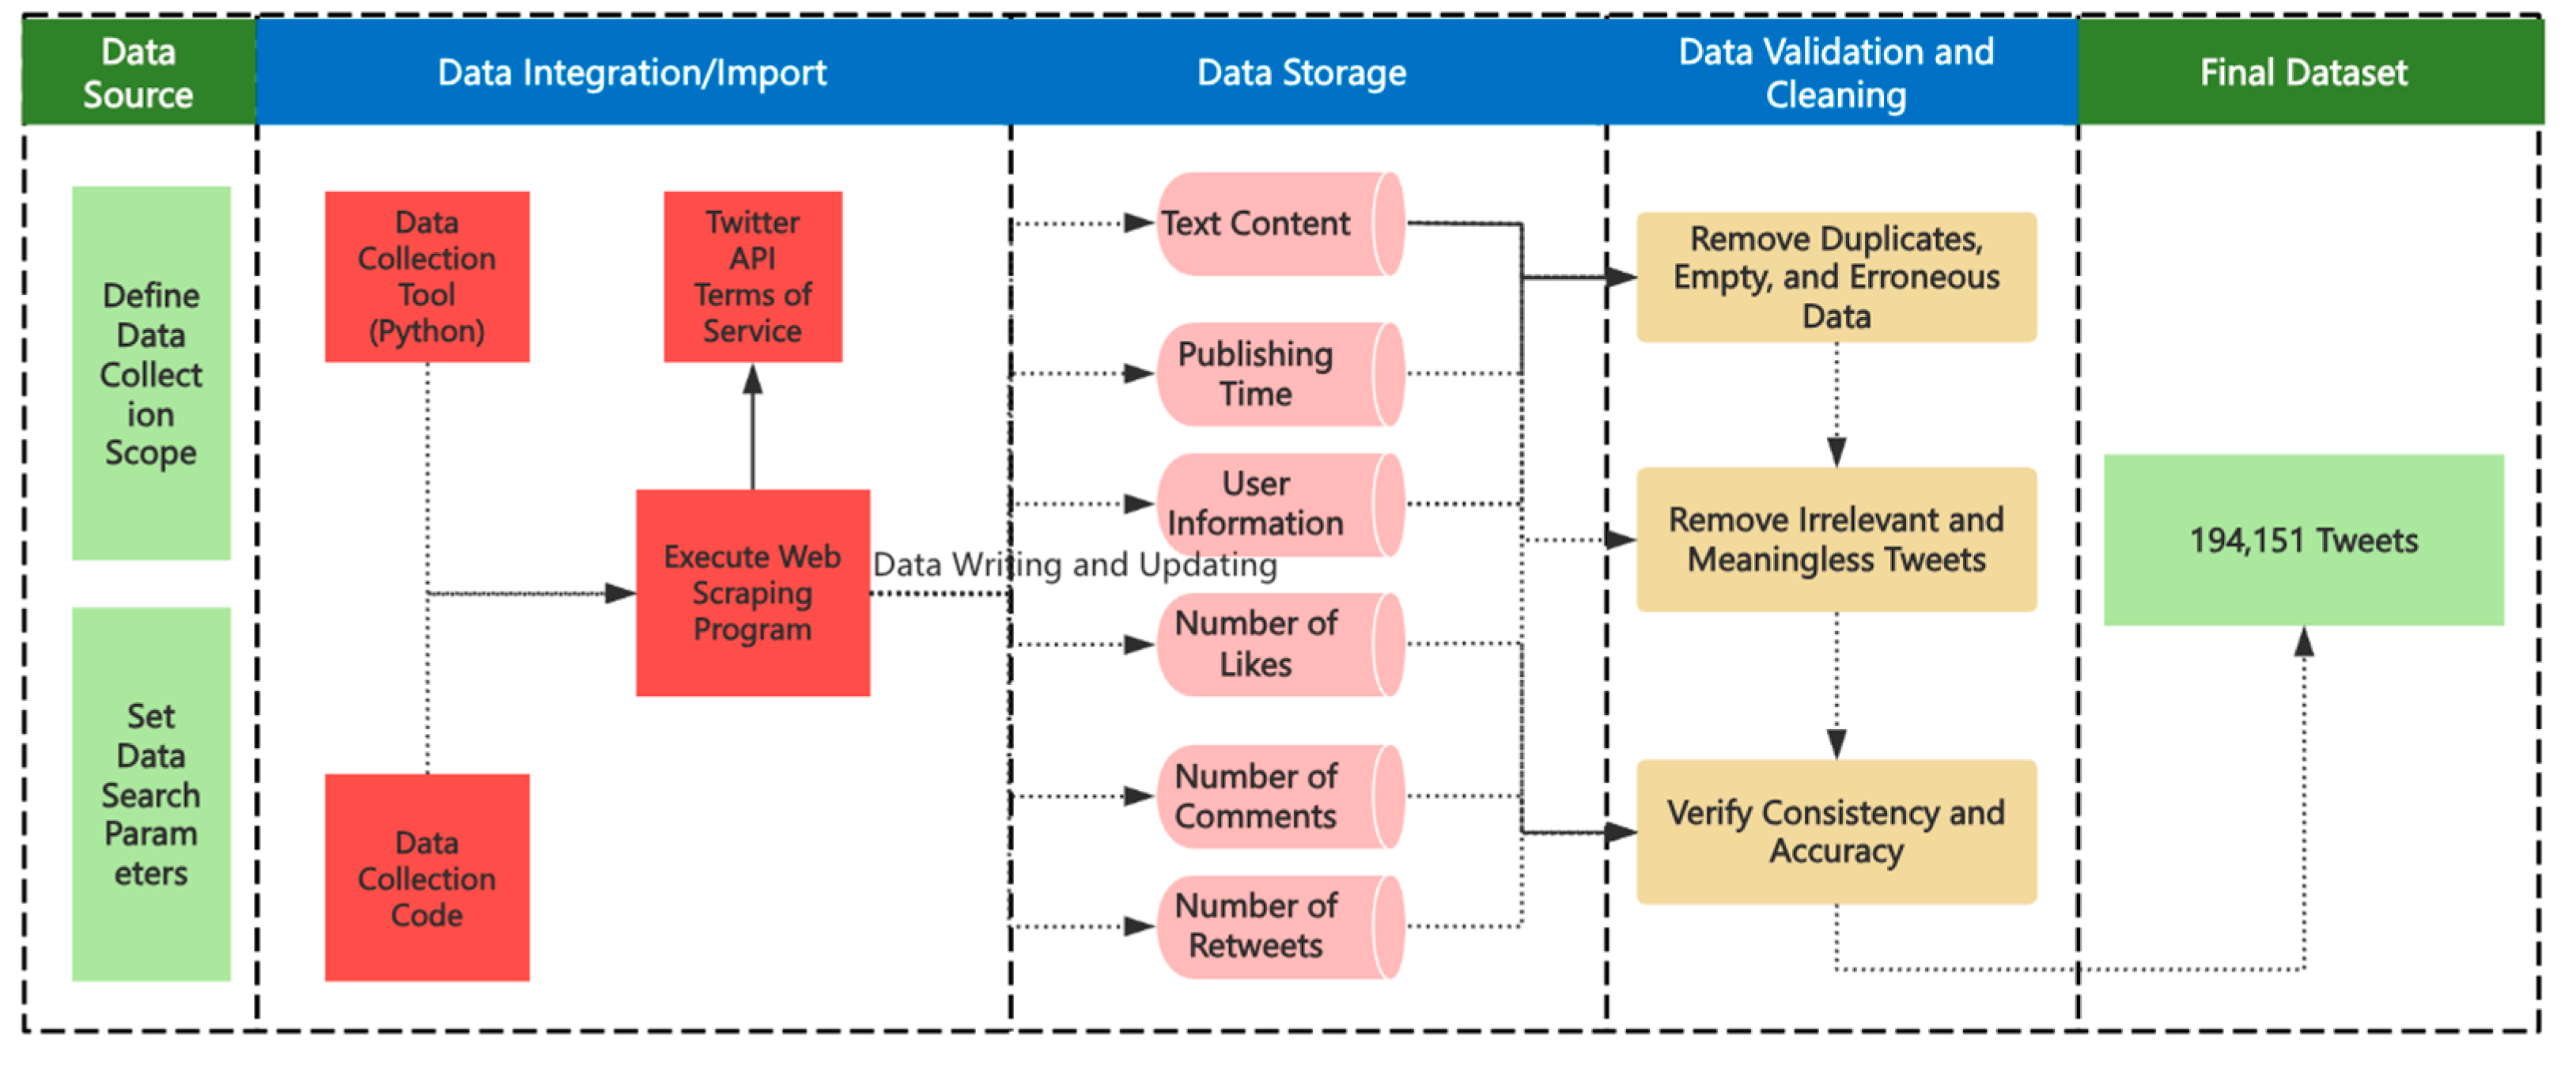
- Defining the Data Collection Scope and Search Parameters: The data collection time range is from 30 August to 30 September 2021. The dataset includes German-language tweets related to the election, capturing tweet content, usernames, timestamps, number of comments, retweets, likes, and mentions (@) and hashtags (#) used in the tweets. Before data collection, keywords and search parameters were set to ensure topic relevance. The selected keywords include “*Bundestagswahl 2021”, “*btw21”, and their common variants to cover election-related discussions.
- Accessing Twitter Data: Since the Twitter API has certain limitations in terms of time range, this study uses a third-party web scraping tool (Python 3.10.10) to collect data.
- Executing the Web Scraping Program: Based on the predefined search parameters, a web scraping program was used to collect tweets. The dataset includes tweets from 55,429 users, with a total of 272,548 tweets collected.
- Data Verification and Cleaning: After data collection, a comprehensive cleaning process was conducted. First, duplicate tweets, null data, and obviously erroneous data were removed; second, tweets with meaningless or irrelevant content—such as those containing only images or emojis—were filtered out; finally, the consistency and accuracy of the data were verified. After cleaning, the final dataset consisted of 194,151 valid tweets from 47,090 users.
3.3. Sentiment Analysis
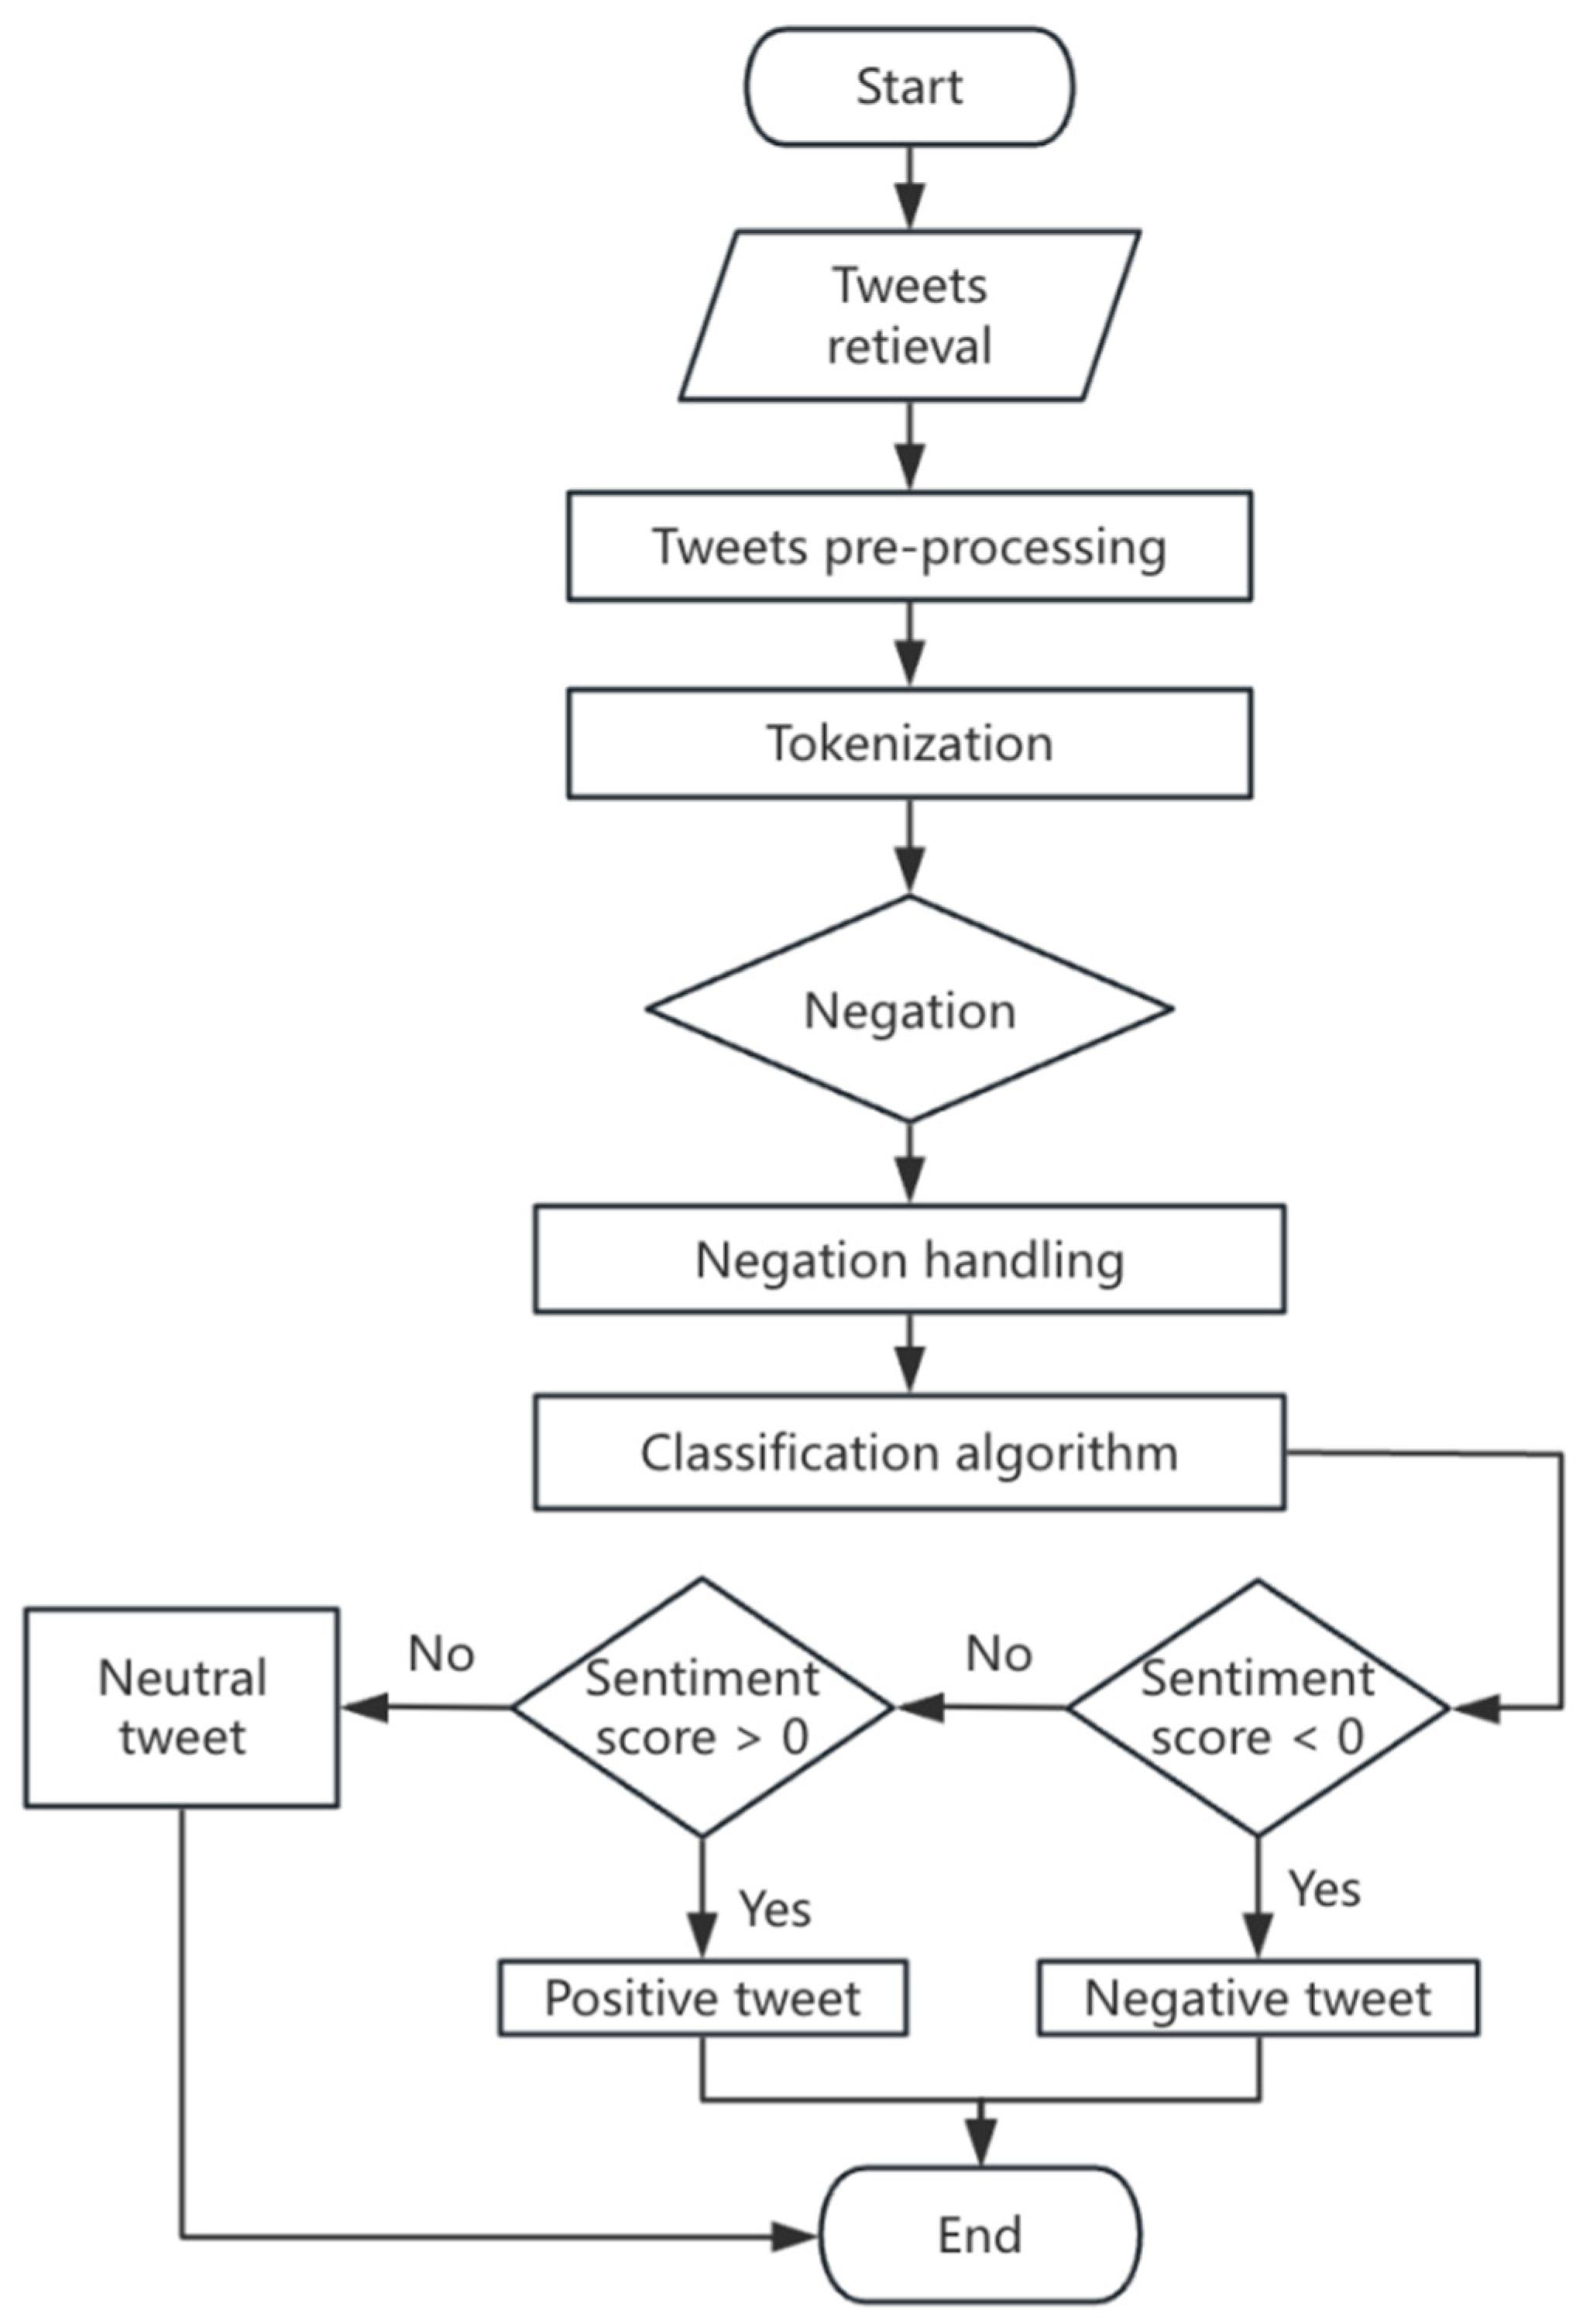
- Data Pre-processing: Tweets are cleaned using regular expressions to remove hyperlinks, emojis, special characters, and irrelevant punctuation. The tweets are then split into words using a word segmentation tool to ensure the correct processing of German grammar.
- Word Matching and Sentiment Score Calculation: Each word in a tweet is matched against entries in the SentiWS sentiment lexicon. If a sentiment word is matched, extract its corresponding sentiment weight and accumulate the sentiment weights of all matching words in the tweet. If the tweet contains negative words (such as “nicht” and “kein”), reverse the sentiment weight within its influence range (Taboada et al., 2011).
- Sentiment Score Normalization: In order to ensure the comparability of sentiment values, the sentiment values of tweets are normalized to the interval [−1, 1], where −1 represents extreme negative sentiment, 1 represents extreme positive sentiment, and 0 represents neutral sentiment. This method avoids the imbalance problem of sentiment values between short and long texts by considering the length of the tweets.
- Sentiment scoring criteria: The sentiment value range of tweets is set to [−1, 1], which is specifically defined as follows (Table 3).
3.4. Sentiment and Spread Analysis
3.4.1. Data Sampling
3.4.2. The Indicators for Measuring the Spread of the Tweet
3.4.3. Statistical Method
4. Results
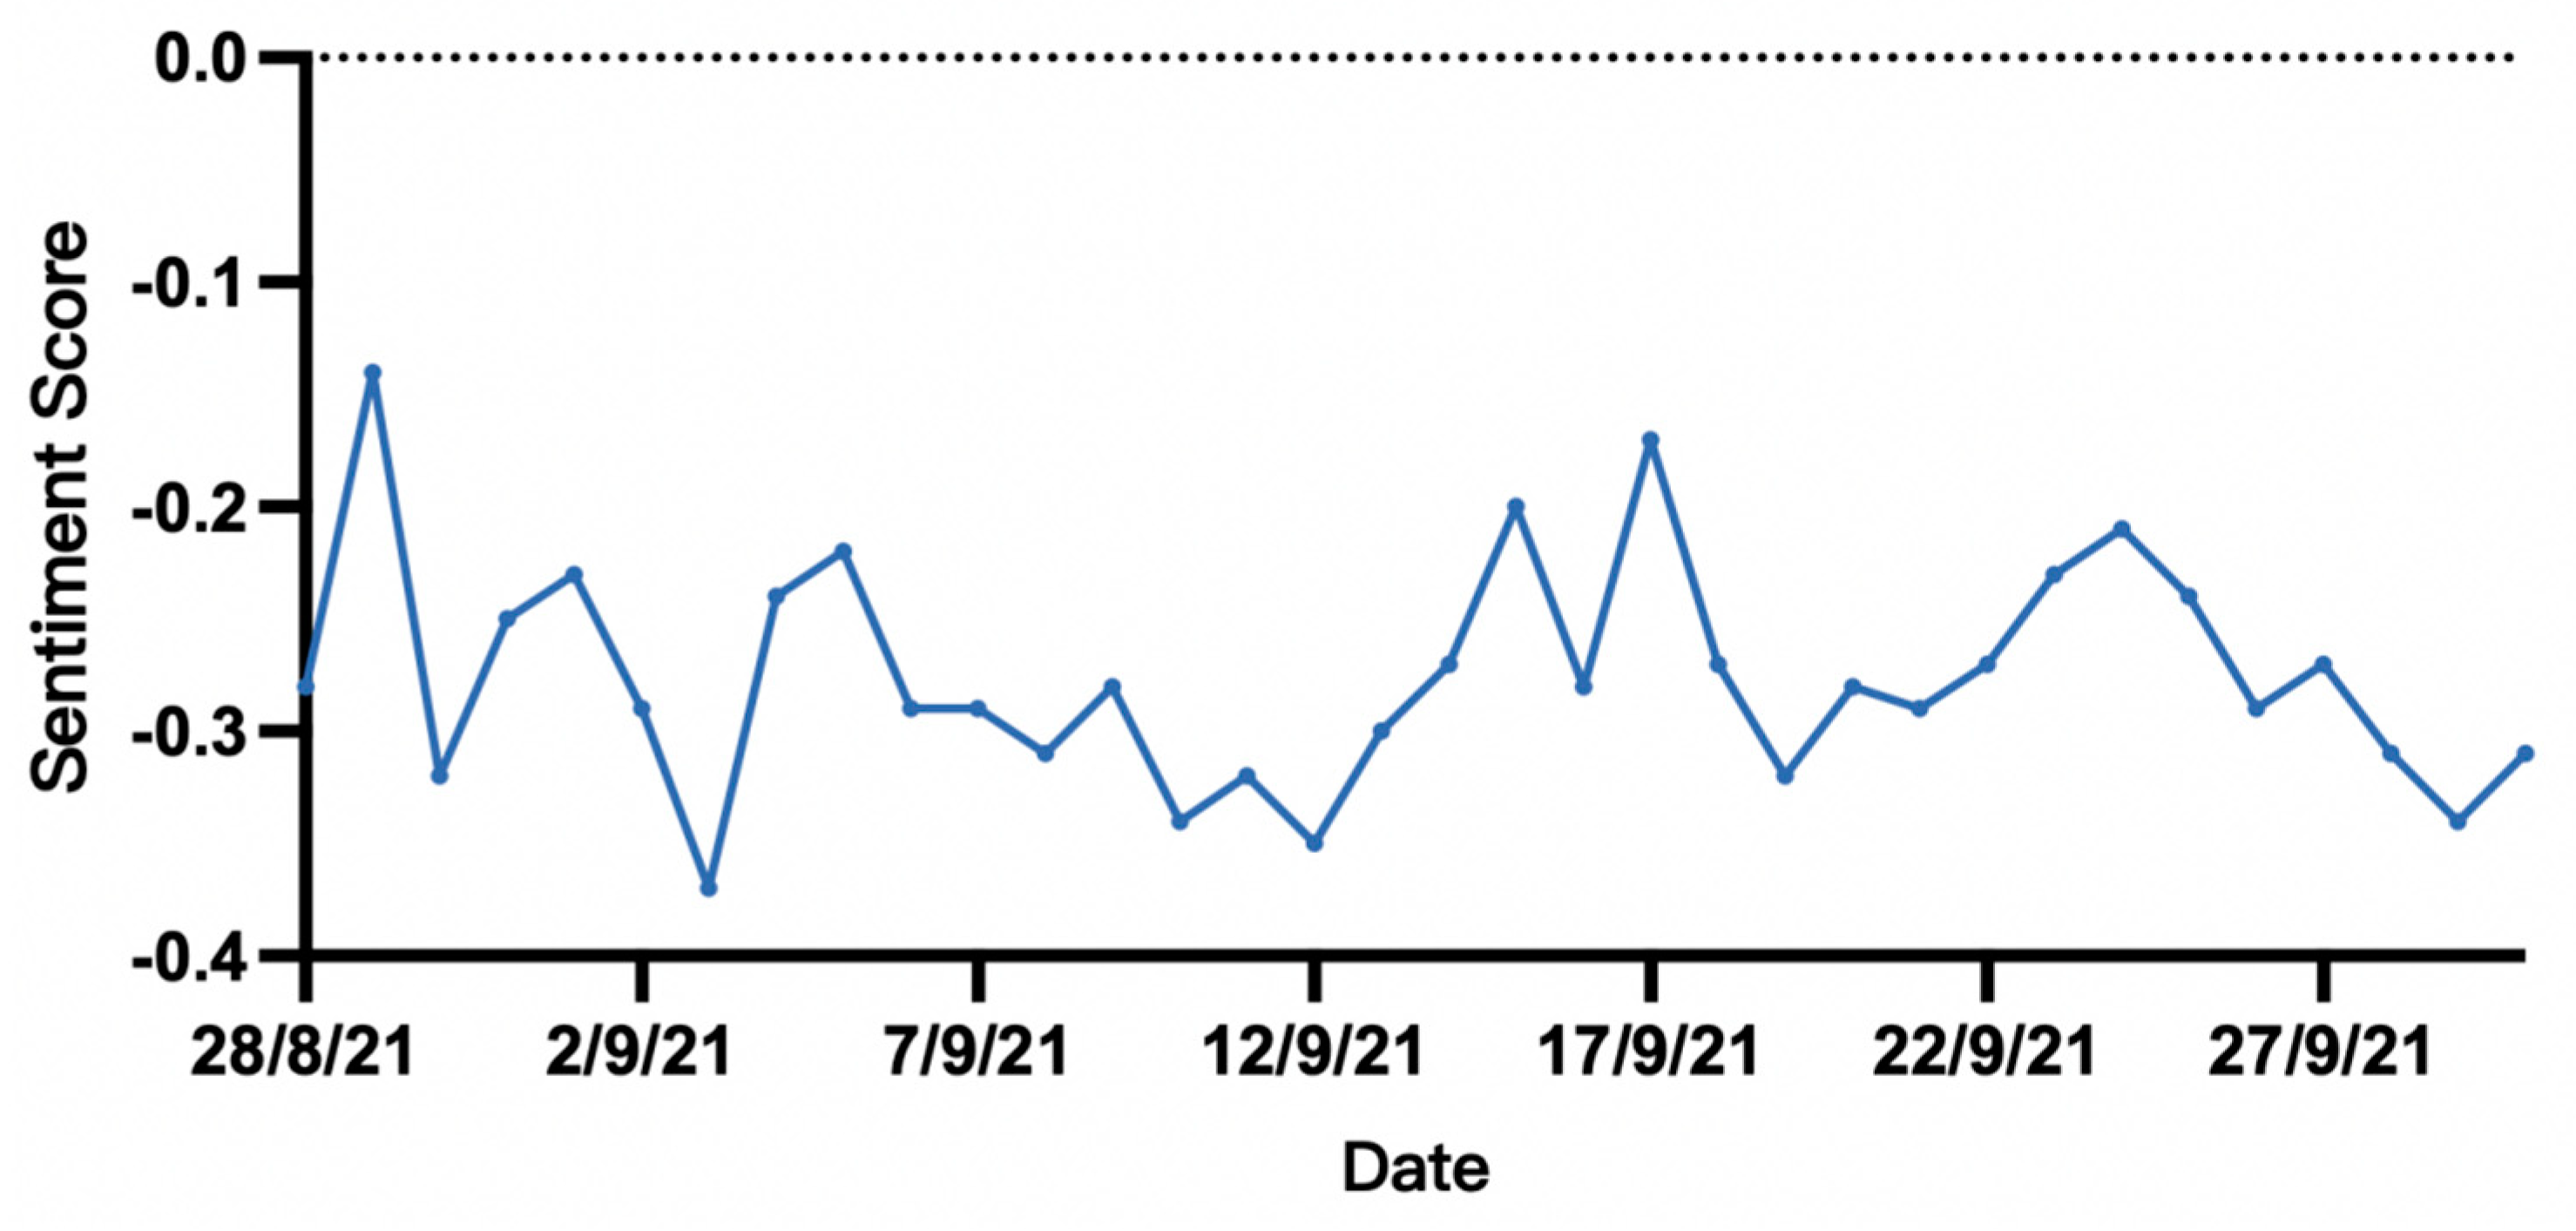
4.1. Overall Distribution of Public Sentiment
4.2. Emotional Expressions Toward Candidates and Derogatory Speech
4.2.1. Negative Sentiment Toward Candidates
4.2.2. Derogatory Speech in Political Discourse
4.3. Spread of Tweets and Sentiment Tendency
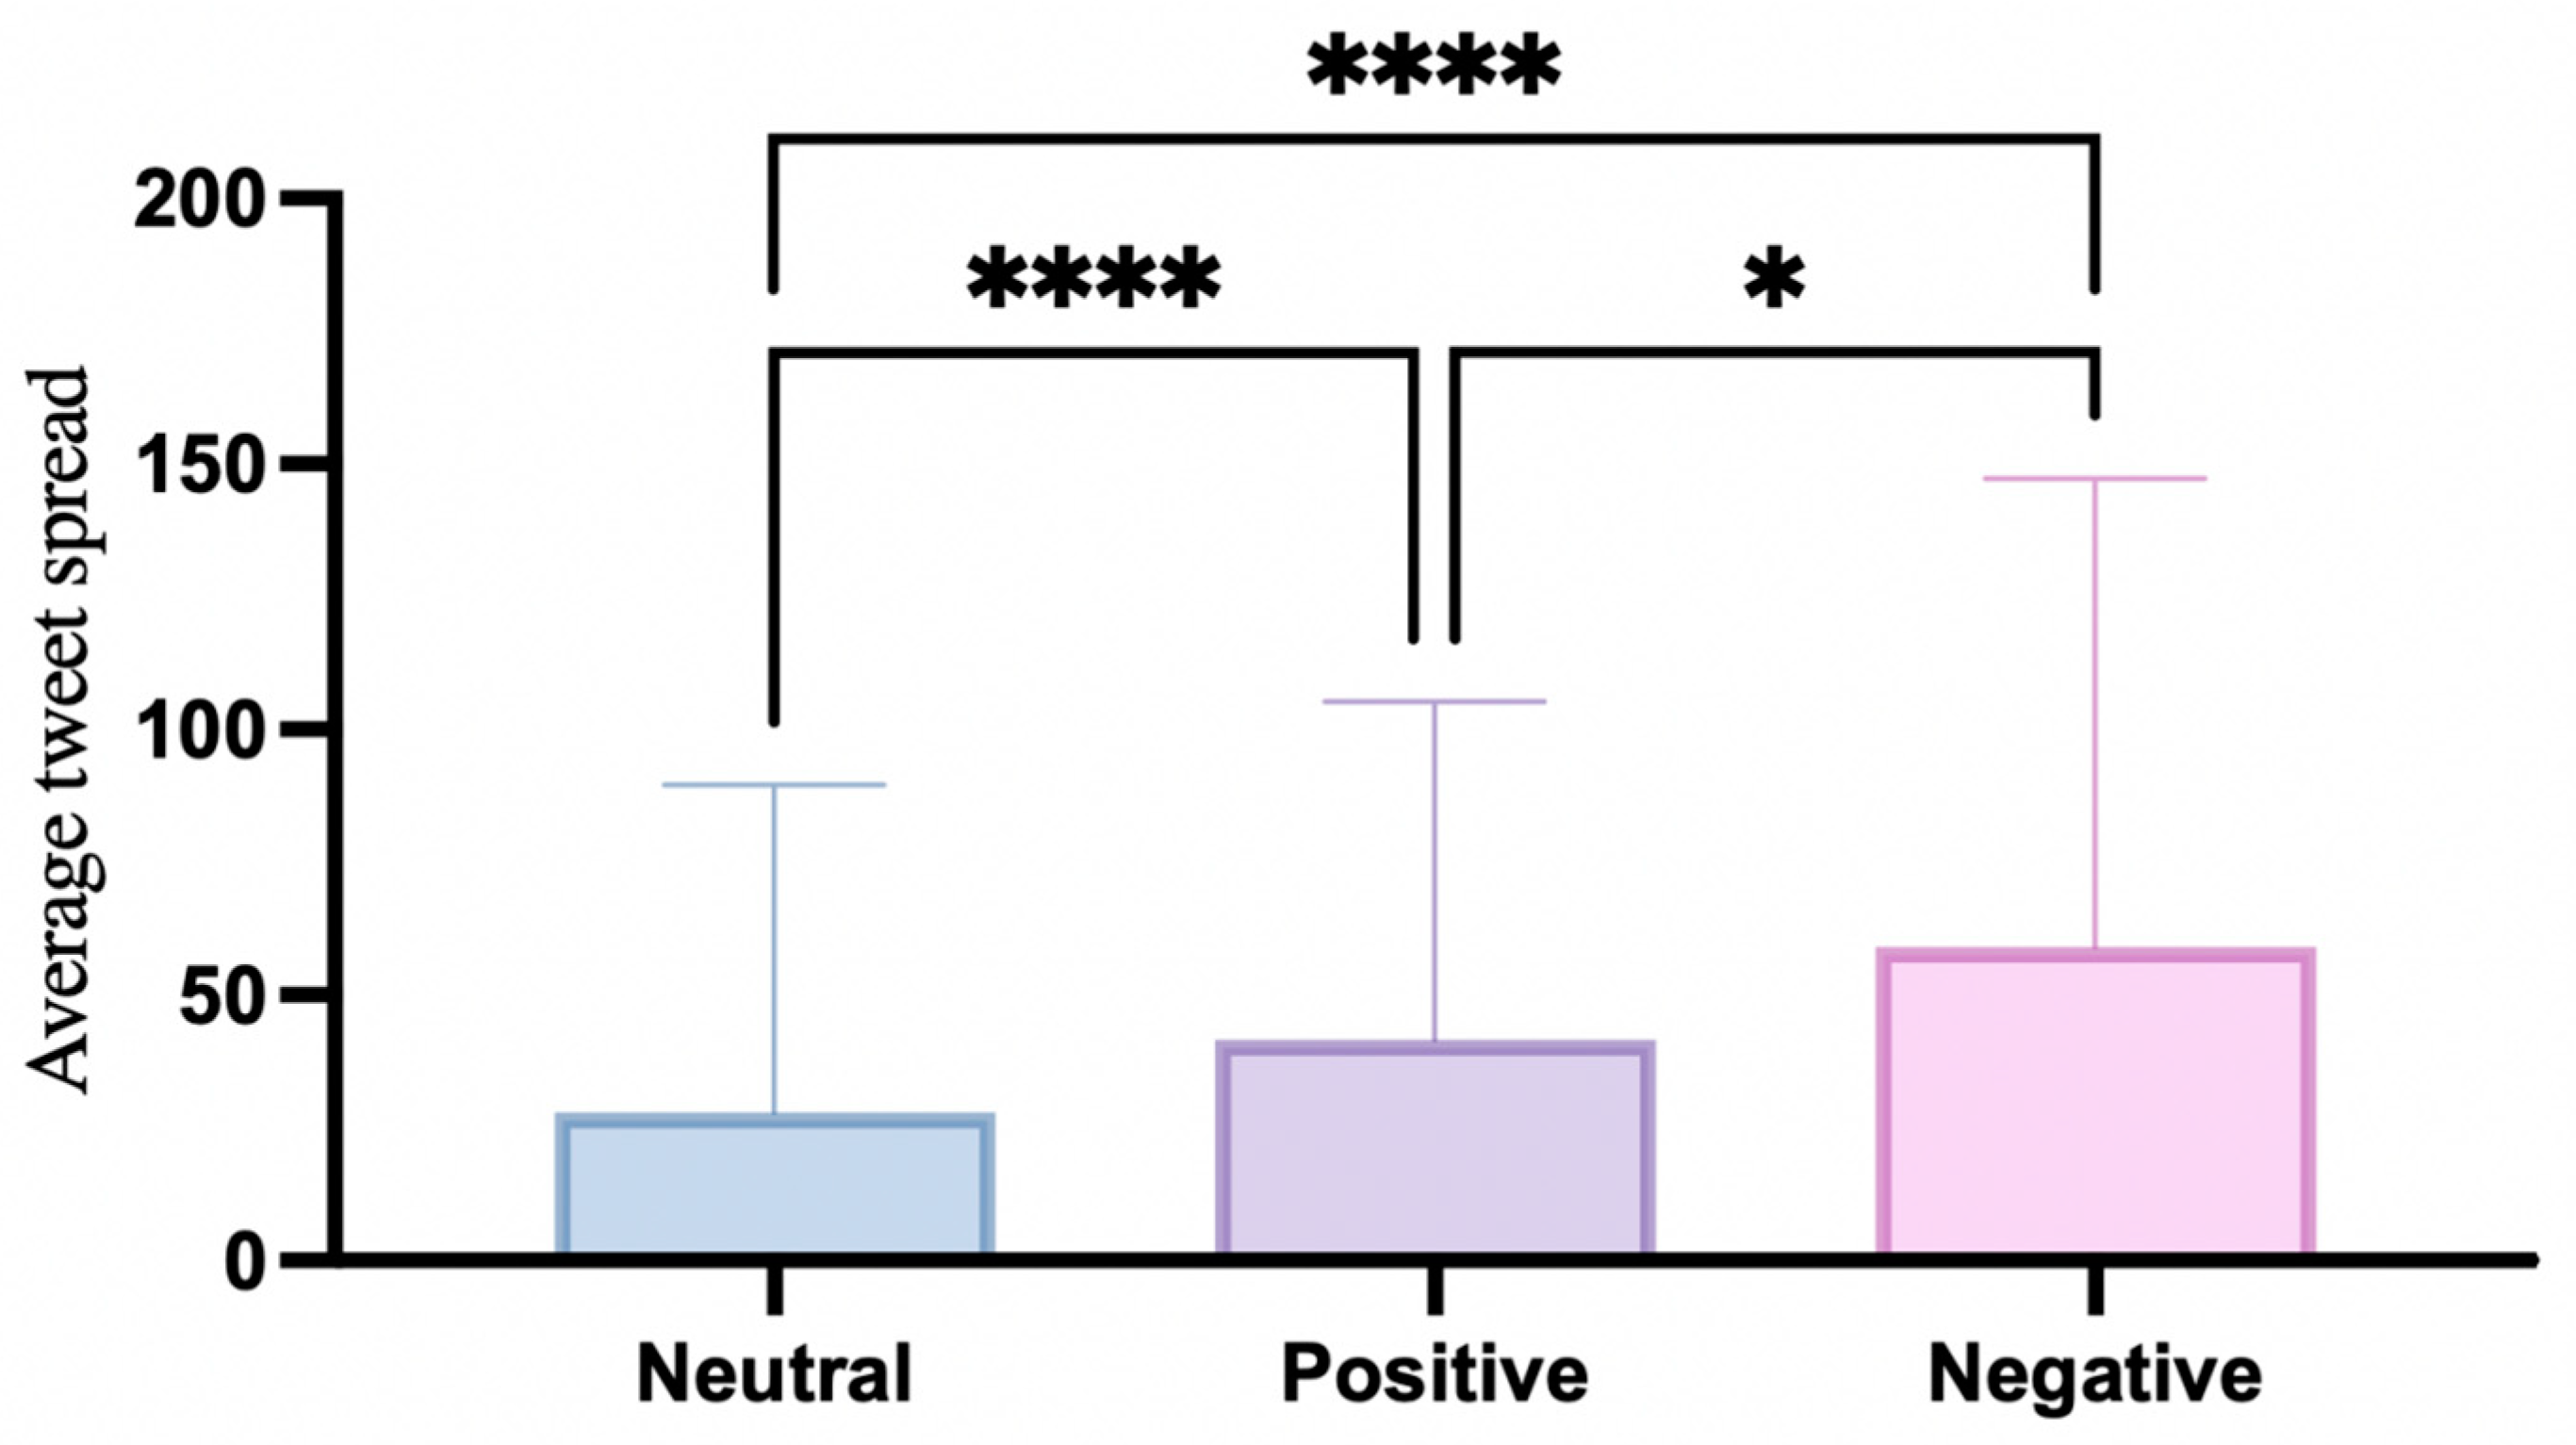
4.3.1. Significance Testing
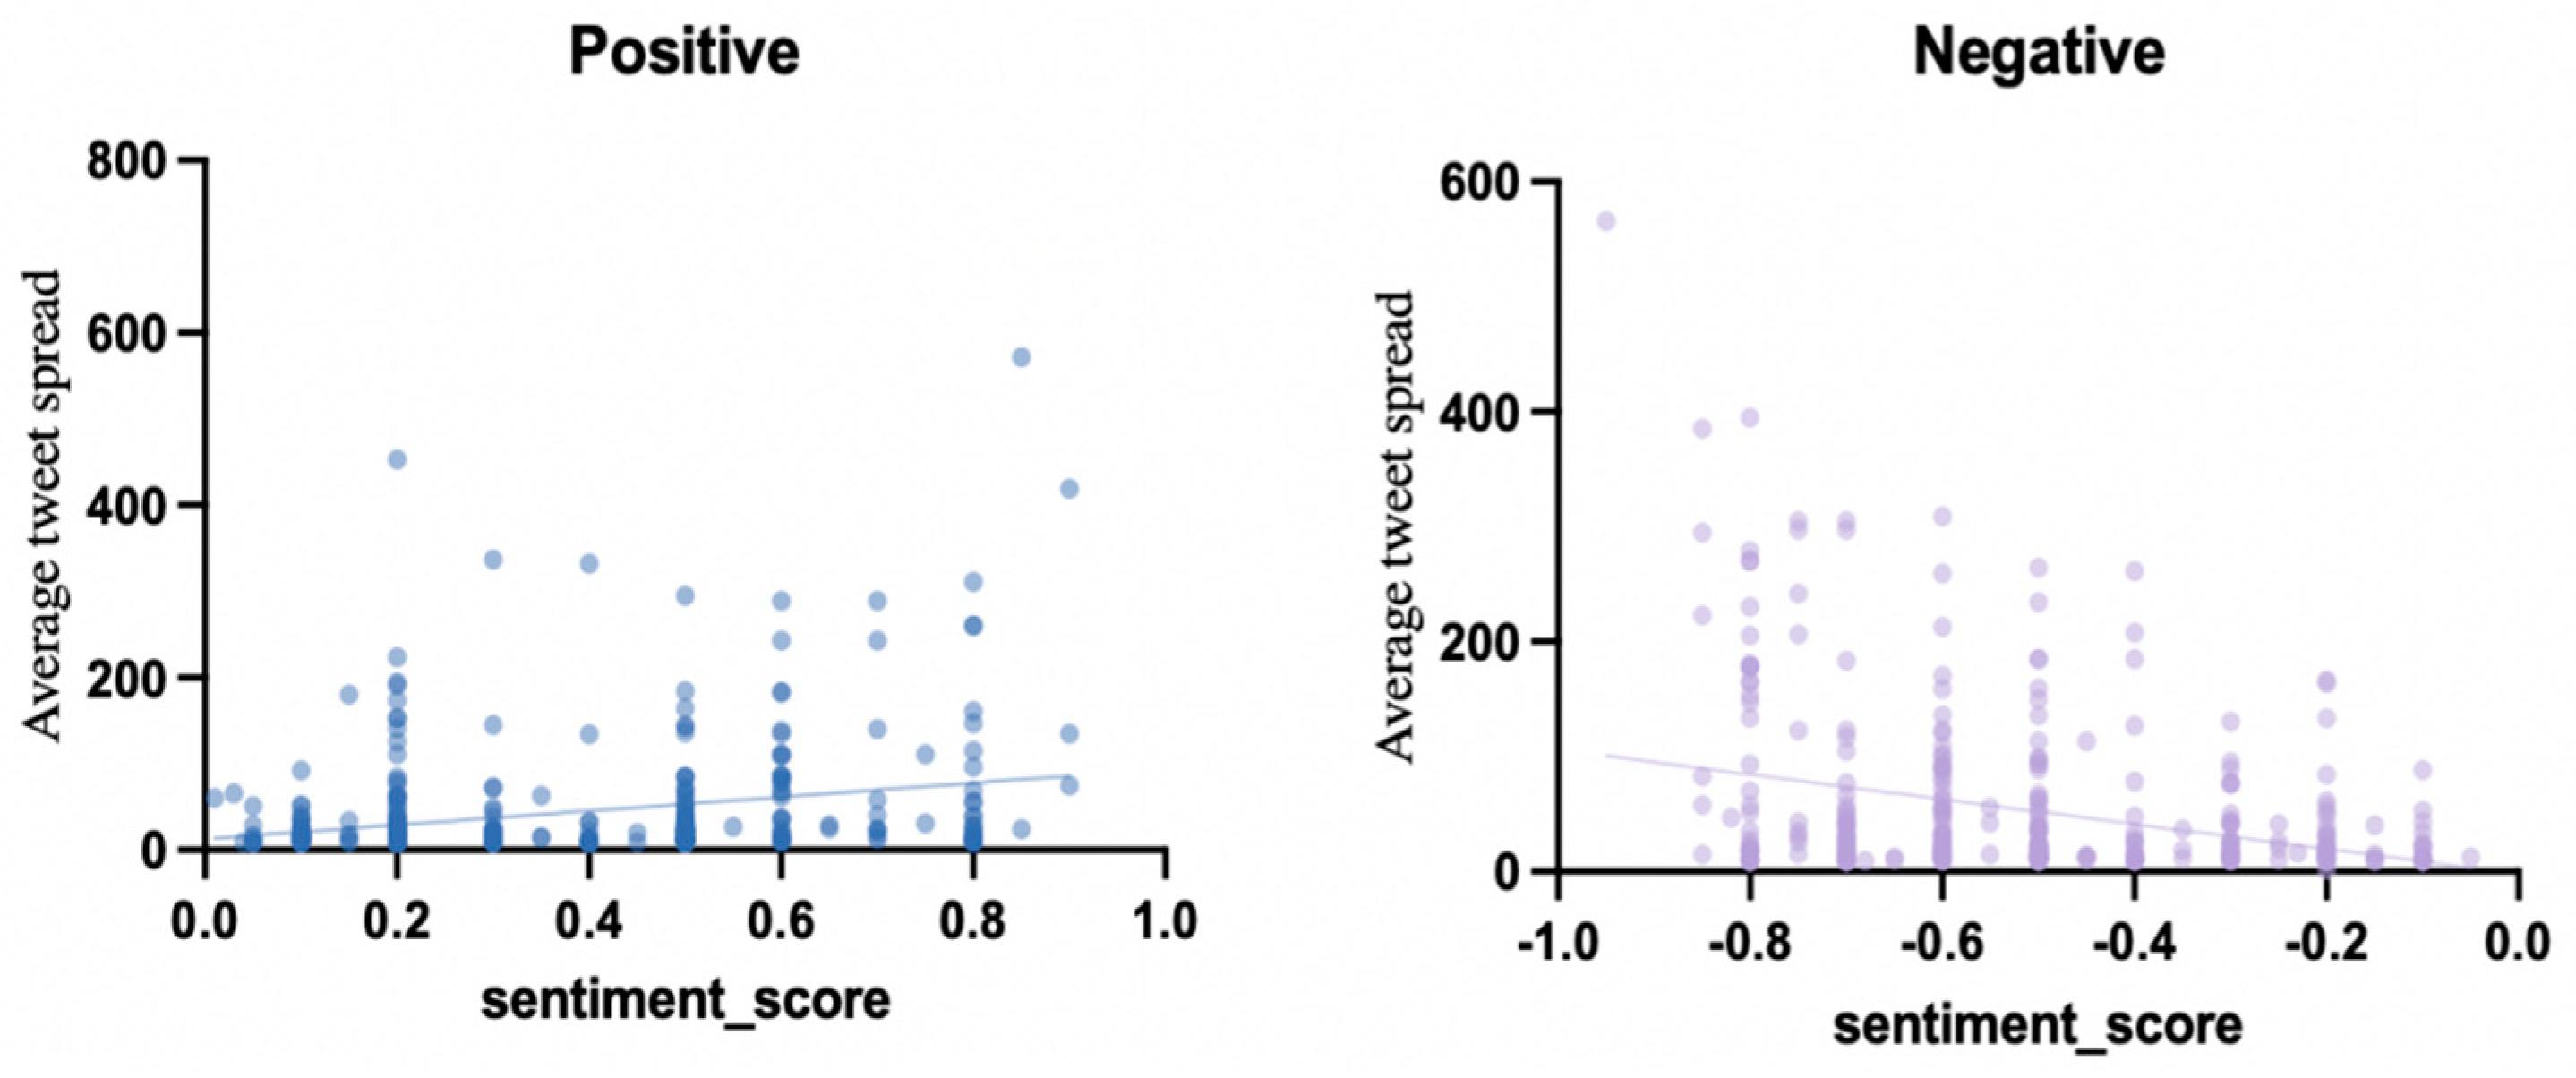
4.3.2. Correlation Analysis
4.3.3. Linear Regression Analysis
5. Conclusions
6. Discussion
Author Contributions
Funding
Institutional Review Board Statement
Informed Consent Statement
Data Availability Statement
Conflicts of Interest
References
- Adams, A., & McCorkindale, T. (2013). Dialogue and transparency: A content analysis of how the 2012 presidential candidates used Twitter. Public Relations Review, 39(4), 357–359. [Google Scholar] [CrossRef]
- Allcott, H., Gentzkow, M., & Yu, C. (2019). Trends in the diffusion of misinformation on social media. Research & Politics, 6(2), 1–8. [Google Scholar] [CrossRef]
- Banda, J. M., Tekumalla, R., Wang, G., Yu, J., Liu, T., Ding, Y., Artemova, E., Tutubalina, E., & Chowell, G. (2021). A large-scale COVID-19 Twitter chatter dataset for open scientific research—An international collaboration. Epidemiologia, 2(3), 315–324. [Google Scholar] [CrossRef] [PubMed]
- Barberá, P. (2020). Social media, echo chambers, and political polarization. In N. Persily, & J. A. Tucker (Eds.), Social media and democracy: The state of the field, prospects for reform (pp. 34–55). Cambridge University Press. [Google Scholar] [CrossRef]
- Baxter, G., & Marcella, R. (2012). Does Scotland ‘like’ this? Social media use by political parties and candidates in Scotland during the 2010 UK general election campaign. Libri, 62(2), 109–124. [Google Scholar] [CrossRef]
- Bilewicz, M., & Soral, W. (2020). Hate speech epidemic: The dynamic effects of derogatory language on intergroup relations and political radicalization. Political Psychology, 41(S1), 3–33. [Google Scholar] [CrossRef]
- Bodó, B., Helberger, N., & de Vreese, C. H. (2017). Political micro-targeting: A Manchurian candidate or just a dark horse? Internet Policy Review, 6(4), 1–13. [Google Scholar] [CrossRef]
- Bossetta, M. (2018). The digital architectures of social media: Comparing political campaigning on Facebook, Twitter, Instagram, and Snapchat in the 2016 US election. Journalism & Mass Communication Quarterly, 95(2), 471–496. [Google Scholar] [CrossRef]
- Boutyline, A., & Willer, R. (2017). The social structure of political echo chambers: Variation in ideological homophily in online networks. Political Psychology, 38(3), 551–569. [Google Scholar] [CrossRef]
- Bright, J. (2018). Explaining the emergence of political fragmentation on social media: The role of ideology and extremism. Journal of Computer-Mediated Communication, 23(1), 17–33. [Google Scholar] [CrossRef]
- Bryman, A. (2006). Integrating quantitative and qualitative research: How is it done? Qualitative Research, 6(1), 97–113. [Google Scholar] [CrossRef]
- Cervone, C., Augoustinos, M., & Maass, A. (2021). The language of derogation and hate: Functions, consequences, and reappropriation. Journal of Language and Social Psychology, 40(1), 80–101. [Google Scholar] [CrossRef]
- Chi, F., & Yang, N. (2011). Twitter adoption in Congress. Review of Network Economics, 10(1), 1–44. [Google Scholar] [CrossRef]
- Conover, M. D., Gonçalves, B., Flammini, A., & Menczer, F. (2012). Partisan asymmetries in online political activity. EPJ Data Science, 1, 6. [Google Scholar] [CrossRef]
- Creswell, J. W., & Clark, V. L. P. (2017). Designing and conducting mixed methods research (3rd ed.). Sage Publications. [Google Scholar]
- Del Vicario, M., Scala, A., Caldarelli, G., Stanley, H. E., & Quattrociocchi, W. (2017). Modeling confirmation bias and polarization. Scientific Reports, 7, 40391. [Google Scholar] [CrossRef] [PubMed]
- Del Vicario, M., Vivaldo, G., Bessi, A., Zollo, F., Scala, A., Caldarelli, G., & Quattrociocchi, W. (2016). Echo chambers: Emotional contagion and group polarization on Facebook. Scientific Reports, 6(1), 37825. [Google Scholar] [CrossRef]
- Duncombe, C. (2019). The politics of Twitter: Emotions and the power of social media. International Political Sociology, 13(4), 409–429. [Google Scholar] [CrossRef]
- Evans, H. K., Cordova, V., & Sipole, S. (2014). Twitter style: An analysis of how house candidates used Twitter in their 2012 campaigns. PS: Political Science & Politics, 47(2), 454–462. [Google Scholar] [CrossRef]
- Ferrara, E., & Yang, Z. (2015). Measuring emotional contagion in social media. PLoS ONE, 10(11), e0142390. [Google Scholar] [CrossRef]
- Flaxman, S., Goel, S., & Rao, J. M. (2016). Filter bubbles, echo chambers, and online news consumption. Public Opinion Quarterly, 80(S1), 298–320. [Google Scholar] [CrossRef]
- Ghiassi, M., Skinner, J., & Zimbra, D. (2013). Twitter brand sentiment analysis: A hybrid system using n-gram analysis and dynamic artificial neural network. Expert Systems with Applications, 40(16), 6266–6282. [Google Scholar] [CrossRef]
- Golbeck, J., Grimes, J. M., & Rogers, A. (2010). Twitter use by the US Congress. Journal of the American Society for Information Science and Technology, 61(8), 1612–1621. [Google Scholar] [CrossRef]
- Gorwa, R. (2019). What is platform governance? Information, Communication & Society, 22(6), 854–871. [Google Scholar] [CrossRef]
- Graham, T., Broersma, M., Hazelhoff, K., & Van’t Haar, G. (2013). Between broadcasting political messages and interacting with voters: The use of Twitter during the 2010 UK general election campaign. Information, Communication & Society, 16(5), 692–716. [Google Scholar] [CrossRef]
- Graham, T., Jackson, D., & Broersma, M. (2016). New platform, old habits? Candidates’ use of Twitter during the 2010 British and Dutch general election campaigns. New Media & Society, 18(5), 765–783. [Google Scholar] [CrossRef]
- Grant, W. J., Moon, B., & Busby Grant, J. (2010). Digital dialogue? Australian politicians’ use of the social network tool Twitter. Australian Journal of Political Science, 45(4), 579–604. [Google Scholar] [CrossRef]
- Hemphill, L., Otterbacher, J., & Shapiro, M. (2013, February 23–27). What’s Congress doing on Twitter? 2013 conference on Computer Supported Cooperative Work (pp. 877–886), San Antonio, TX, USA. [Google Scholar] [CrossRef]
- Jackson, N., & Lilleker, D. (2020). Microblogging, constituency service and impression management: UK MPs and the use of Twitter. In The impact of legislatures (pp. 414–433). Routledge. [Google Scholar] [CrossRef]
- Jahanbakhsh, K., & Moon, Y. (2014). The predictive power of social media: On the predictability of US presidential elections using Twitter. arXiv, arXiv:1407.0622. [Google Scholar]
- Jürgens, P., & Jungherr, A. (2015). The use of Twitter during the 2009 German national election. German Politics, 24(4), 469–490. [Google Scholar] [CrossRef]
- Karami, A., Bennett, L. S., & He, X. (2018). Mining public opinion about economic issues: Twitter and the US presidential election. International Journal of Strategic Decision Sciences (IJSDS), 9(1), 18–28. [Google Scholar] [CrossRef]
- Klinger, U., & Svensson, J. (2015). The emergence of network media logic in political communication: A theoretical approach. New Media & Society, 17(8), 1241–1257. [Google Scholar] [CrossRef]
- Kontopoulos, E., Berberidis, C., Dergiades, T., & Bassiliades, N. (2013). Ontology-based sentiment analysis of Twitter posts. Expert Systems with Applications, 40(10), 4065–4074. [Google Scholar] [CrossRef]
- Kreiss, D. (2016). Seizing the moment: The presidential campaigns’ use of Twitter during the 2012 electoral cycle. New Media & Society, 18(8), 1473–1490. [Google Scholar] [CrossRef]
- Lamy, F. R., Daniulaityte, R., Sheth, A., Nahhas, R. W., Martins, S. S., Boyer, E. W., & Carlson, R. G. (2016). “Those edibles hit hard”: Exploration of Twitter data on cannabis edibles in the US. Drug and Alcohol Dependence, 164, 64–70. [Google Scholar] [CrossRef] [PubMed]
- Larsson, A. O., & Kalsnes, B. (2014). ‘Of course we are on Facebook’: Use and non-use of social media among Swedish and Norwegian politicians. European Journal of Communication, 29(6), 653–667. [Google Scholar] [CrossRef] [PubMed]
- Larsson, A. O., & Skogerbø, E. (2018). Out with the old, in with the new? Perceptions of social (and other) media by local and regional Norwegian politicians. New Media & Society, 20(1), 219–236. [Google Scholar] [CrossRef]
- Lassen, D. S., & Brown, A. R. (2011). Twitter: The electoral connection? Social Science Computer Review, 29(4), 419–436. [Google Scholar] [CrossRef]
- Livne, A., Simmons, M. P., Adar, E., & Adamic, L. A. (2011, July 17–21). The party is over here: Structure and content in the 2010 election. The International AAAI Conference on Web and Social Media (Vol. 5 No. 1. , pp. 201–208), Barcelona, Spain. [Google Scholar]
- Macnamara, J. (2011). Pre and post-election 2010 online: What happened to the conversation? Communication, Politics & Culture, 44(2), 18–36. [Google Scholar]
- Morstatter, F., Pfeffer, J., & Liu, H. (2014, April 7–11). When is it biased? Assessing the representativeness of Twitter’s streaming API. 23rd International Conference on World Wide Web (pp. 555–556), Seoul, Republic of Korea. [Google Scholar] [CrossRef]
- Oliveira, D. J. S., Bermejo, P. H. D. S., & dos Santos, P. A. (2017). Can social media reveal the preferences of voters? A comparison between sentiment analysis and traditional opinion polls. Journal of Information Technology & Politics, 14(1), 34–45. [Google Scholar] [CrossRef]
- Ozaydin, S. Y. (2021). Hashtag wars, online political polarization and mayoral elections. SSRJ|Social Sciences Research Journal, 10(03), 548–557. [Google Scholar]
- Pang, B., & Lee, L. (2008). Opinion mining and sentiment analysis. Foundations and Trends® in Information Retrieval, 2(1–2), 1–135. [Google Scholar] [CrossRef]
- Peterson, R. D. (2012). To tweet or not to tweet: Exploring the determinants of early adoption of Twitter by House members in the 111th Congress. The Social Science Journal, 49(4), 430–438. [Google Scholar] [CrossRef]
- Plotkowiak, T., & Stanoevska-Slabeva, K. (2013). German politicians and their Twitter networks in the Bundestag election 2009. First Monday, 18(5). [Google Scholar] [CrossRef]
- Prior, M. (2013). Media and political polarization. Annual Review of Political Science, 16(1), 101–127. [Google Scholar] [CrossRef]
- Remus, R., Quasthoff, U., & Heyer, G. (2010, May 19–21). SentiWS—A publicly available German-language resource for sentiment analysis. The Seventh International Conference on Language Resources and Evaluation (LREC’10), Valletta, Malta. [Google Scholar]
- Rimé, B., Mesquita, B., Boca, S., & Philippot, P. (1991). Beyond the emotional event: Six studies on the social sharing of emotion. Cognition & Emotion, 5(5–6), 435–465. [Google Scholar] [CrossRef]
- Rossini, P., Stromer-Galley, J., Baptista, E. A., & de Oliveira, V. V. (2021). Dysfunctional information sharing on WhatsApp and Facebook: The role of political talk, cross-cutting exposure, and social corrections. New Media & Society, 23(8), 2430–2451. [Google Scholar] [CrossRef]
- Sältzer, M., & Stier, S. (2022). Die Bundestagswahl 2021 auf Twitter. easy_social_sciences, 67, 30–38. [Google Scholar] [CrossRef]
- Shapiro, M. A., & Hemphill, L. (2017). Politicians and the policy agenda: Does use of Twitter by the US Congress direct New York Times content? Policy & Internet, 9(1), 109–132. [Google Scholar] [CrossRef]
- Shogan, C. J. (2010). Blackberries, tweets, and YouTube: Technology and the future of communicating with Congress. PS: Political Science & Politics, 43(2), 231–233. [Google Scholar] [CrossRef]
- Singh, M., Iyengar, S. R. S., Saxena, A., & Kaur, R. (2022). A bi-level assessment of Twitter in predicting the results of an election: Delhi Assembly Elections 2020. arXiv, arXiv:2204.08746. [Google Scholar]
- Small, T. A. (2010). Canadian politics in 140 characters: Party politics in the Twitterverse. Canadian Parliamentary Review, 33(3), 39–45. [Google Scholar]
- Song, J. 宋佳易. (2014). The impact of social media on political communication 社交媒体对政治传播的影响 [Doctoral dissertation, Shanghai Normal University上海师范大学]. [Google Scholar]
- Stier, S., Bleier, A., Lietz, H., & Strohmaier, M. (2018). Election campaigning on social media: Politicians, audiences, and the mediation of political communication on Facebook and Twitter. Political Communication, 35(1), 50–74. [Google Scholar] [CrossRef]
- Stier, S., Kirkizh, N., Froio, C., & Schroeder, R. (2020). Populist attitudes and selective exposure to online news: A cross-country analysis combining web tracking and surveys. The International Journal of Press/Politics, 25(3), 426–446. [Google Scholar] [CrossRef]
- Straus, J. R., Glassman, M. E., Shogan, C. J., & Smelcer, S. N. (2013). Communicating in 140 characters or less: Congressional adoption of Twitter in the 111th Congress. PS: Political Science & Politics, 46(1), 60–66. [Google Scholar] [CrossRef]
- Sunstein, C. R. (2002). The law of group polarization. Journal of Political Philosophy, 10(2), 175–195. [Google Scholar] [CrossRef]
- Taboada, M., Brooke, J., Tofiloski, M., Voll, K., & Stede, M. (2011). Lexicon-based methods for sentiment analysis. Computational Linguistics, 37(2), 267–307. [Google Scholar] [CrossRef]
- Tashakkori, A., & Teddlie, C. (1998). Mixed methodology: Combining qualitative and quantitative approaches (Vol. 46). Sage Publications. [Google Scholar]
- Thomas, M., Pang, B., & Lee, L. (2006, July 22–23). Get out the vote: Determining support or opposition from congressional floor-debate transcripts. The 2006 Conference on Empirical Methods in Natural Language Processing (pp. 327–335), Sydney, Australia. [Google Scholar]
- Tucker, J. A., Guess, A., Barberá, P., Vaccari, C., Siegel, A., Sanovich, S., & Nyhan, B. (2018). Social media, political polarization, and political disinformation: A review of the scientific literature. SSRN Electronic Journal. [Google Scholar] [CrossRef]
- Vaccari, C., Valeriani, A., Barberá, P., Bonneau, R., Jost, J. T., Nagler, J., & Tucker, J. A. (2013). Social media and political communication: A survey of Twitter users during the 2013 Italian general election. Rivista Italiana di Scienza Politica, 43(3), 381–410. [Google Scholar] [CrossRef]
- Vergeer, M., & Hermans, L. (2013). Campaigning on Twitter: Microblogging and online social networking as campaign tools in the 2010 general elections in the Netherlands. Journal of Computer-Mediated Communication, 18(4), 399–419. [Google Scholar] [CrossRef]
- Vosoughi, S., Roy, D., & Aral, S. (2018). The spread of true and false news online. Science, 359(6380), 1146–1151. [Google Scholar] [CrossRef]
- Wong, K. F., Xia, Y., Xu, R., Wu, M., & Li, W. (2008). Pattern-based opinion mining for stock market trend prediction. International Journal of Computer Processing of Languages, 21(04), 347–361. [Google Scholar] [CrossRef]
- Yu, Y., Duan, W., & Cao, Q. (2013). The impact of social and conventional media on firm equity value: A sentiment analysis approach. Decision Support Systems, 55(4), 919–926. [Google Scholar] [CrossRef]
- Zhang, L., Wang, S., & Liu, B. (2018). Deep learning for sentiment analysis: A survey. Wiley Interdisciplinary Reviews: Data Mining and Knowledge Discovery, 8(4), e1253. [Google Scholar] [CrossRef]


| Category | Key Research Findings |
| Political Parties/ Candidates | Opposition parties and candidates are more likely to use Twitter than members of the ruling party. |
| Younger politicians are more willing to use Twitter compared to older generations. | |
| The extent of Twitter usage often correlates with the intensity of electoral competition. | |
| If a member of a political party has previously used Twitter successfully, other members of the party are more likely to adopt it. | |
| Political parties and candidates mainly use Twitter to share campaign information and links to their official websites. | |
| Calls for action, such as mobilizing voters, are relatively rare. | |
| Candidates from the ruling party tend to use Twitter in a broadcasting manner with limited interaction, while opposition candidates engage more actively with voters. | |
| Interactions between politicians mainly occur within the same party. | |
| Compared to television or newspaper, posting on Twitter increases candidates’ sense of connection and social presence. | |
| Candidates use Twitter to influence traditional media coverage of political issues. | |
| Candidates can use Twitter to raise small-scale political donations and increase campaign funding. | |
| Public | Among users, only a small portion of the total population actively participates in election-related discussions on Twitter. |
| Politically active users are mostly young, male, and students. | |
| Opposition party supporters are more likely than ruling party supporters to express opinions on Twitter and post more frequently. | |
| Twitter interactions show a political homophily pattern, where users engage mainly with those who share similar political beliefs, leading to intra-party communication. | |
| Supporters of different political parties tend to use distinct hashtags, creating politically segregated spaces for discussion. | |
| In terms of sentiment, most comments about candidates and political parties tend to be negative. | |
| The number of tweets generally increases over time, peaking near the election’s conclusion. Major political events related to candidates or campaigns also lead to sudden spikes in tweet volume. | |
| Tweet content mainly focuses on political leaders and their electoral actions rather than on key political issues or policy platforms. |
| Word Category | Type | Positive Words | Negative Words |
|---|---|---|---|
| Adjective | Base Form | 792 | 712 |
| Inflected Form | 10,936 | 10,471 | |
| Adverb | Base Form | 7 | 4 |
| Inflected Form | 5 | 0 | |
| Noun | Base Form | 548 | 688 |
| Inflected Form | 736 | 1158 | |
| Verb | Base Form | 297 | 423 |
| Inflected Form | 3246 | 4580 | |
| Total | Base Form | 1644 | 1827 |
| Inflected Form | 14,923 | 16,209 | |
| Overall Total | — | 16,567 | 18,036 |
| Sentiment Score | Meaning and Examples |
|---|---|
| [−1, −0.5] | Indicates strong negative sentiment, such as criticism of candidates or policies, or offensive language. |
| [−0.5, 0] | Indicates mild negative sentiment, such as expressions of dissatisfaction or concern. |
| [0] | Represents neutral sentiment, typically used for factual descriptions, neutral opinions, or simple information. |
| [0, 0.5] | Indicates mild positive sentiment, such as expressions of support or a positive attitude. |
| [0.5, 1] | Indicates strong positive sentiment, such as enthusiastic support, excitement, or praise for candidates. |
| Group | N | Sentiment Score Ranges |
|---|---|---|
| Positive Group | 400 | (0, 1] |
| Neutral Group | 400 | [0] |
| Negative Group | 400 | [−1, 0) |
| Indicator | Total Count | Mean | Standard Deviation | Minimum | 25% | 50% (Median) | 75% | Maximum |
|---|---|---|---|---|---|---|---|---|
| Value | 194,151 | −0.3 | 0.41 | −1 | −0.6 | −0.4 | 0 | 1 |
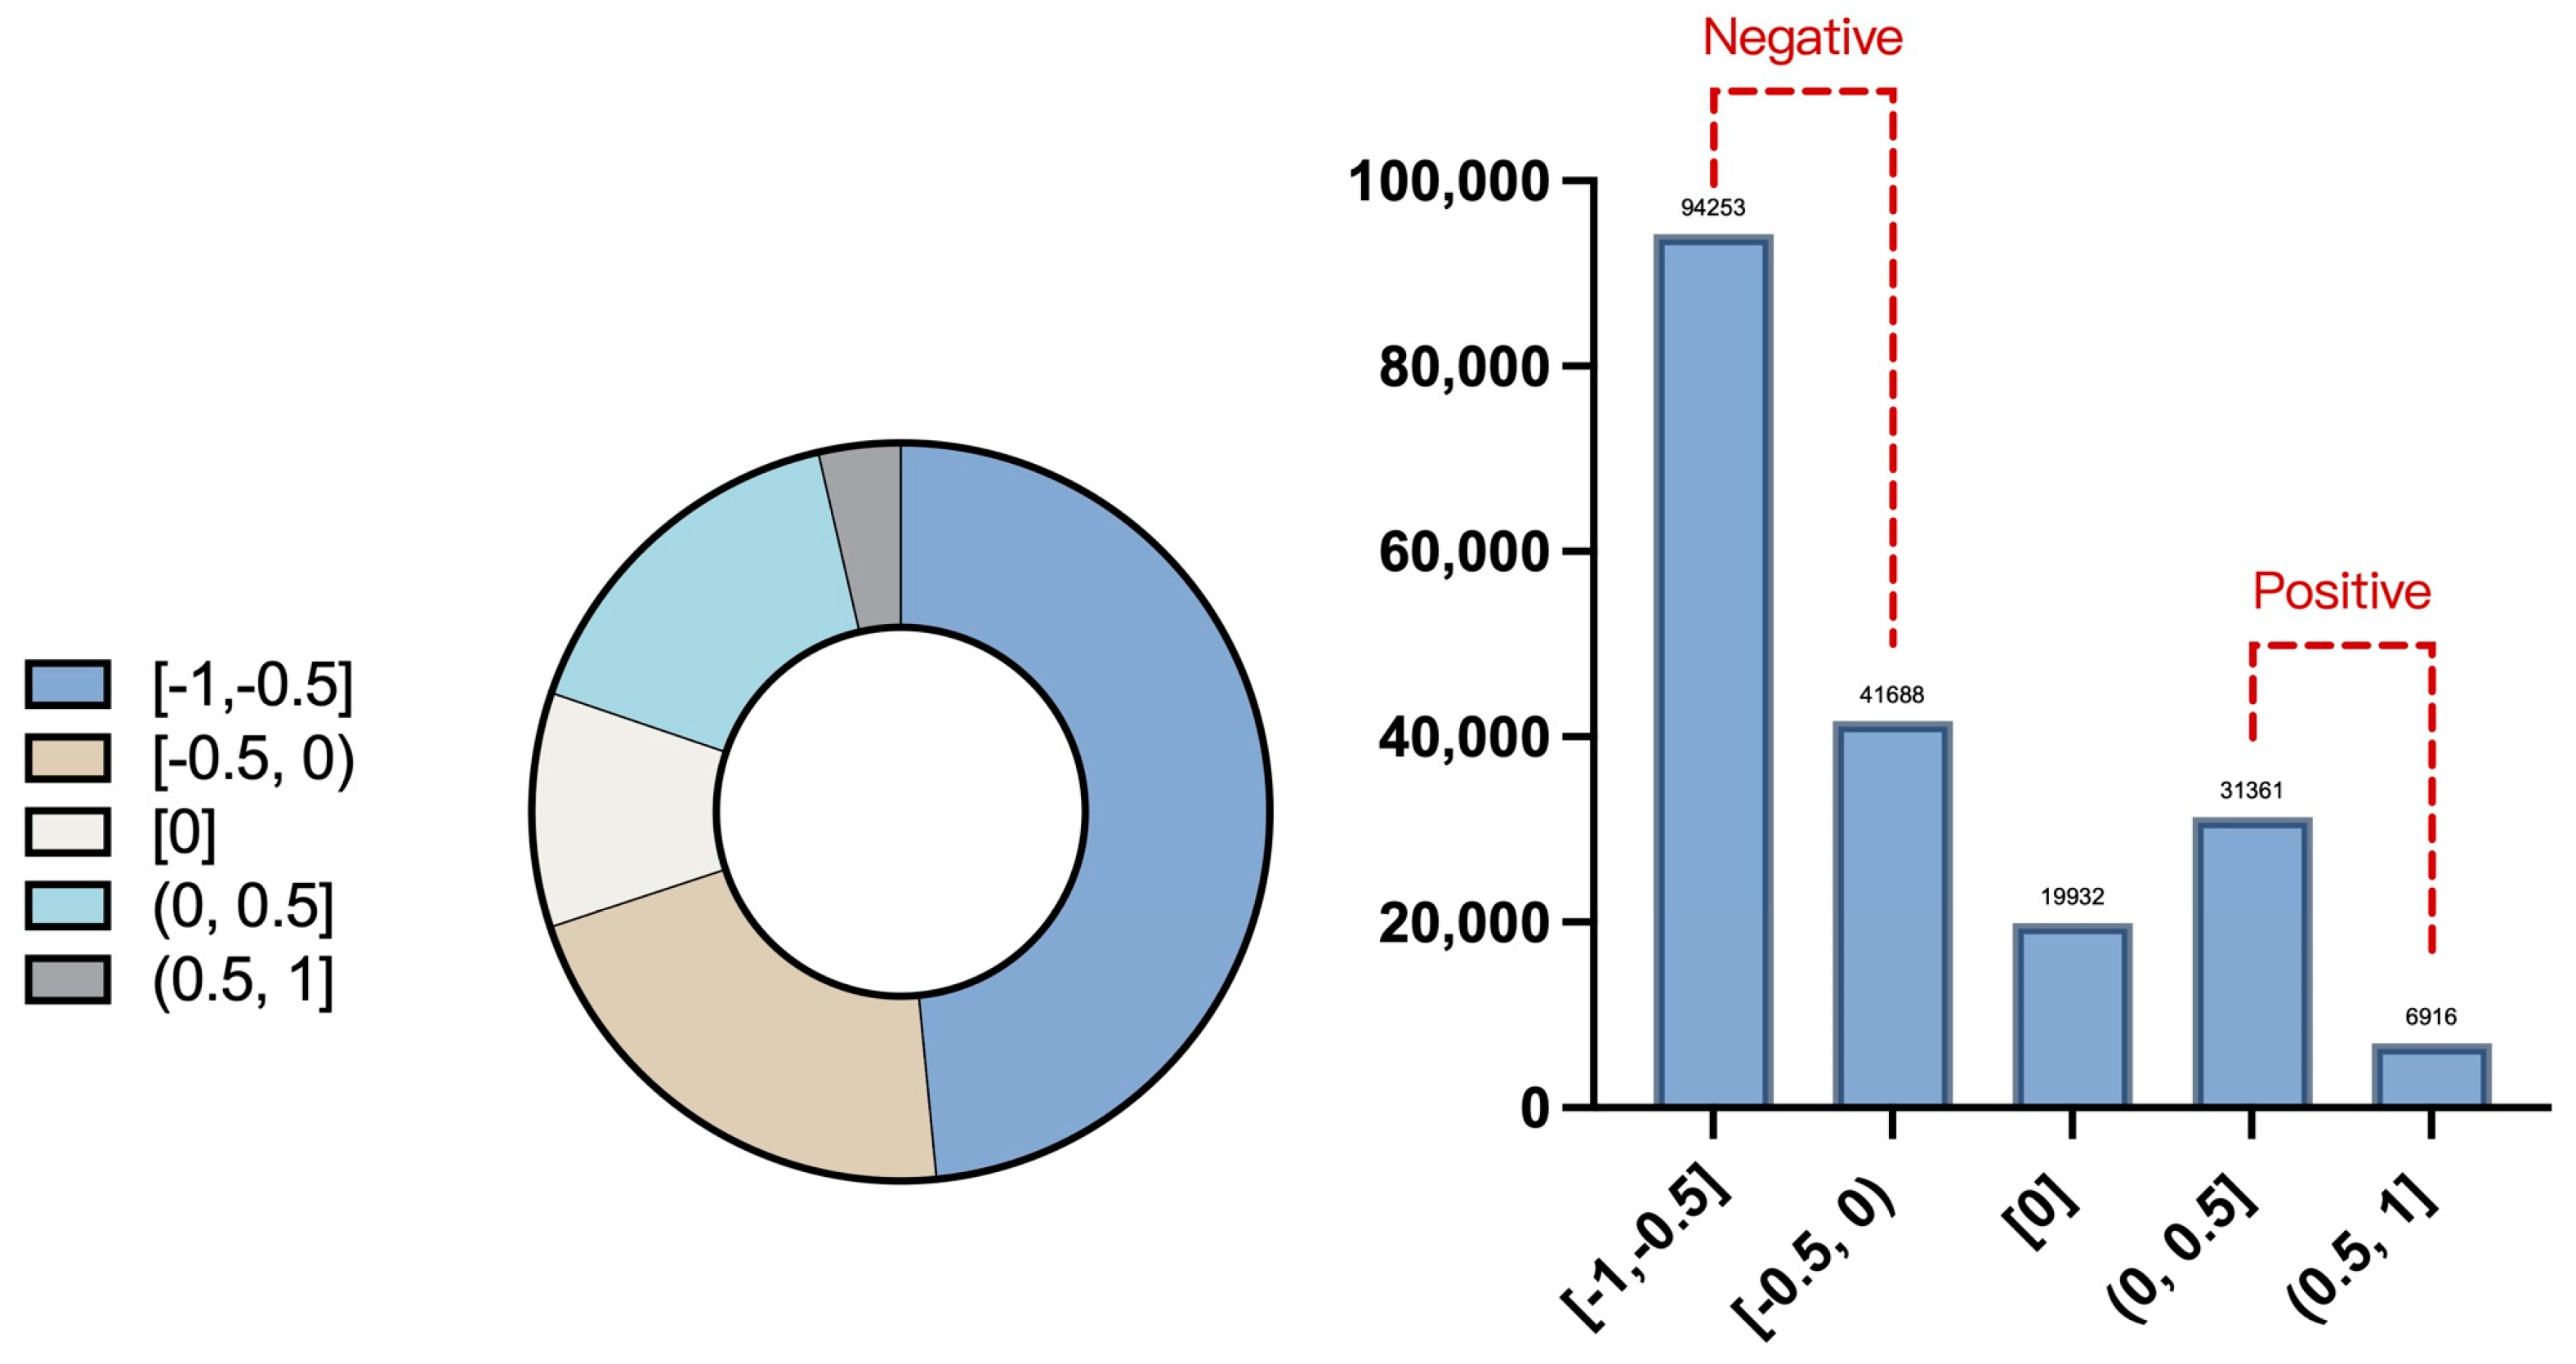
| Sentiment Score | [−1, −0.5) | [−0.5, 0) | [0] | (0, 0.5] | (0.5, 1] |
|---|---|---|---|---|---|
| Count | 94,253 | 41,688 | 19,932 | 31,361 | 6916 |
| Proportion (%) | 48.5 | 21.5 | 10.2 | 16.2 | 3.6 |
| Candidates | Mean | Positive (%) | Negative (%) |
|---|---|---|---|
| Baerbock | −0.372 | 2.6 | 46.13 |
| Laschet | −0.325 | 4.24 | 45.58 |
| Scholz | −0.225 | 8.38 | 32.35 |
| Weidel | −0.275 | 4.24 | 32.68 |
| Candidate | High-Frequency Negative Words |
|---|---|
| Olaf Scholz | langweilig (boring), schweigt (silent), mechanisch (mechanical), zurückhaltend (reserved), passiv (passive), arrogant (arrogant), skandalös (scandal-ridden), reserviert (conservative) |
| Armin Laschet | inakzeptabel (unacceptable), posiert (pretentious), pietätlos (disrespectful, irreverent), grinsend (smirking), aalglatt (slick, cunning), unprofessionell (unprofessional), hinterhältig (insidious), sarkastisch (sarcastic), arrogant (arrogant), entscheidungsunfähig (indecisive), schwach (weak), unangemessen (inappropriate), zögerlich (hesitant), dominant (domineering), autoritär (authoritarian), manipulativ (manipulative), unbeliebt (unpopular), polarisierend (polarizing), frech (rude), kontrovers (controversial) |
| Annalena Baerbock | schlampig (messy, slovenly), debil (dumb), unehrlich (dishonest), hochstaplerin (hypocrite, fraud), arrogant (arrogant), naiv (naïve), inkompetent (incompetent), laut (loud), vorlaut (talkative), frech (rude), idealistisch (idealistic), schwach (weak), heuchlerisch (hypocritical), hysterisch (hysterical), unweiblich (not feminine enough), emotional (emotional), weibisch (effeminate), sensibel (overly sensitive, condescending towards women), kompetenzlos (incapable) |
| Alice Weidel | rechtsextrem (far-right extremist), nationalistisch (nationalist), spaltend (divisive), provokativ (provocative), populistisch (populist), polarisiert (polarized), radikal (radical), spaltend (creating division), empathielos (lacking empathy), provokant (provocative), unpopular (unpopular), hasserfüllt (full of hatred), unversöhnlich (uncompromising), kampfeslustig (belligerent) |
| Kruskal–Wallis Test | |
|---|---|
| p value | <0.0001 |
| p value summary | **** |
| Do the medians vary signif. (p < 0.05)? | Yes |
| Number of groups | 3 |
| Kruskal–Wallis statistic | 147.8 |
| Dunn’s Multiple Comparisons Test | Mean Rank Diff. | Significant? | Summary | Adjusted p Value |
|---|---|---|---|---|
| Neutral vs. Positive | −220.3 | Yes | **** | <0.0001 |
| Neutral vs. Negative | −283.7 | Yes | **** | <0.0001 |
| Positive vs. Negative | −63.38 | Yes | * | 0.029 |
| Test Details | Mean Rank 1 | Mean Rank 2 | Mean Rank Diff. | n1 | n2 | Z |
|---|---|---|---|---|---|---|
| Neutral vs. Positive | 432.5 | 652.8 | −220.3 | 400 | 400 | 8.993 |
| Neutral vs. Negative | 432.5 | 716.2 | −283.7 | 400 | 400 | 11.58 |
| Positive vs. Negative | 652.8 | 716.2 | −63.38 | 400 | 400 | 2.587 |
| Spearman r | Negative (n = 400) | Positive (n = 400) |
|---|---|---|
| r | −0.2581 | 0.2523 |
| 95% confidence interval | −0.3499 to −0.1613 | 0.1553 to 0.3445 |
| p (two-tailed) | <0.0001 | <0.0001 |
| p value summary | **** | **** |
| Exact or approximate p value? | Approximate | Approximate |
| Significant? (alpha = 0.05) | Yes | Yes |
| Simple Linear Regression | Positive (n = 400) | Negative (n = 400) |
|---|---|---|
| Best-fit values | ||
| Slope | 80.96 | −107.9 |
| Y-intercept | 12.99 | −1.939 |
| X-intercept | −0.1605 | −0.01798 |
| 1/slope | 0.01235 | −0.009272 |
| 95% Confidence Intervals | ||
| Slope | 51.85 to 110.1 | −139.7 to −75.97 |
| Y-intercept | 0.4000 to 25.59 | −19.21 to 15.33 |
| X-intercept | −0.4755 to −0.003772 | −0.1408 to 0.1969 |
| Goodness of Fit | ||
| R2 (R squared) | 0.06986 | 0.1 |
| F | 29.89 | 44.23 |
| DFn, DFd | 1, 398 | 1, 398 |
| p | <0.0001 | <0.0001 |
| Deviation from zero? | Significant | Significant |
| Equation | Y = 80.96X + 12.99 | Y = −107.9X − 1.939 |
| Data | ||
| Total values | 400 | 400 |
| Number of missing values | 0 | 0 |
Disclaimer/Publisher’s Note: The statements, opinions and data contained in all publications are solely those of the individual author(s) and contributor(s) and not of MDPI and/or the editor(s). MDPI and/or the editor(s) disclaim responsibility for any injury to people or property resulting from any ideas, methods, instructions or products referred to in the content. |
© 2025 by the authors. Licensee MDPI, Basel, Switzerland. This article is an open access article distributed under the terms and conditions of the Creative Commons Attribution (CC BY) license (https://creativecommons.org/licenses/by/4.0/).
Share and Cite
Zhang, Y.; Zhou, B.; Hu, Y.; Zhai, K. From Individual Expression to Group Polarization: A Study on Twitter’s Emotional Diffusion Patterns in the German Election. Behav. Sci. 2025, 15, 360. https://doi.org/10.3390/bs15030360
Zhang Y, Zhou B, Hu Y, Zhai K. From Individual Expression to Group Polarization: A Study on Twitter’s Emotional Diffusion Patterns in the German Election. Behavioral Sciences. 2025; 15(3):360. https://doi.org/10.3390/bs15030360
Chicago/Turabian StyleZhang, Yixuan, Bing Zhou, Yiyan Hu, and Kun Zhai. 2025. "From Individual Expression to Group Polarization: A Study on Twitter’s Emotional Diffusion Patterns in the German Election" Behavioral Sciences 15, no. 3: 360. https://doi.org/10.3390/bs15030360
APA StyleZhang, Y., Zhou, B., Hu, Y., & Zhai, K. (2025). From Individual Expression to Group Polarization: A Study on Twitter’s Emotional Diffusion Patterns in the German Election. Behavioral Sciences, 15(3), 360. https://doi.org/10.3390/bs15030360