1. Introduction
The high level of contamination by heavy metals (HM) or, more generally, potentially toxic elements (PTEs), in abandoned mines is a severe environmental problem for public health [
1]. In the case of mercury, and according to the World Health Organization (WHO) [
2,
3], the inhalation of mercury can produce harmful effects on the nervous, immune, and digestive systems, lungs, and kidneys, and may be fatal. The main problem related to mercury in decommissioned mines, which makes it different from other PTEs, is the presence of mercury vapor in the atmosphere because of the polluted waste material stored in these areas.
In this regard, the importance of this problem has led to a vast scientific bibliography on this topic, as it is very complex to define a unique approach. Some of the topics studied in the last few decades are: mercury (Hg) concentration in soil and water in contaminated sites [
4,
5,
6,
7]; emission rates of Hg into the atmosphere and the distribution of contamination surrounding sites contaminated with mercury [
8,
9,
10,
11,
12,
13,
14,
15,
16,
17]; development of emission models to analyze the potential risks related to Hg contamination [
18,
19,
20]; influence of contamination on people’s health, either from a general perspective [
21,
22] or more specific studies on human diseases [
23,
24,
25]; occupational risks related to the work in these areas [
26,
27]; and remediation of contaminated sites [
28,
29,
30,
31,
32,
33,
34,
35]. Sánchez-Castro et al. [
36] gather an exhaustive review of the most important remediation techniques for sites impacted by heavy metals or PTEs, highlighting the following:
Physical processes, basically soil management, include landfilling, surface capping and encapsulation. All of them are mechanical operations that could alter the physical soil structure and affect its natural biological activity. These techniques are usually very disruptive to the treated site and relatively expensive. However, they can help in the stabilization of contaminants in mining areas where the soils have been previously disrupted [
30,
37].
Thermal desorption, vitrification and electrokinetics are the other available physical methods for soil restoration. However, the high cost and logistic complexity have been an important barrier to their usage as a reclamation option for mine soils.
Chemical methods are mainly used for solubilization, stabilization and redox transformation of HMs. Inorganic materials, such as lime, phosphate-based compounds, fly ash, and also organic amendments such as biochar, biosolids or compost are commonly applied to buffer the soil pH, reduce HMs availability and improve nutritional status, water-holding capacity, and soil structure [
38,
39].
Utilization of solid bio-waste, from local wastewater treatment plants or livestock manure, for tailings remediation with high concentrations of HMs, enhancing the properties of the soil to support plant growth for revegetation as well as the recovery of metal from waste, has also been planned by some mining companies in the context of the circular economy [
40].
Once these mine soils have been physically and chemically stabilized, the common next step is the successful establishment of a plant cover. The vegetation cover (or with other materials) of Hg-contaminated materials can strongly limit the reemission of this element to the atmosphere [
7,
16]. On the other hand, plants favor the ecological development of the ecosystem, enhance the fertility of the soil, and contribute to the stabilization of soil in open pits and slopes [
41]. In addition, HMs spread due to wind erosion and groundwater leaching is also reduced [
42].
The analysis presented here is focused on the remediation using physical methods of the mercury contamination produced via gaseous mercury emissions from the demolition debris of a former metallurgical plant. A peculiarity of this metal is the high volatility of its elemental form (Hg
0), which is easily released into the atmosphere from natural surfaces after the reduction in oxidized forms (Hg
2+) that are dominant in terrestrial and aquatic environments [
16]. For this purpose, a novel solution is presented, consisting of covering the contaminated debris (capping) with by-products of the industry, which implies the reuse of these by-products and their revaluation in the context of a circular economy. The proposed by-products, mainly fly-ashes and blast furnace slags, are produced in large quantities by the local industry (coal-burning power plant and steel factory) and, if there is no other valorization alternative, are deposited in large quantities in landfills, which means a high environmental impact and entails significant management costs for their maintenance.
In order to evaluate the advantages of this proposed solution, it is compared with two others that also apply physical methods: the removal and transfer of the debris to an authorized landfill (landfilling) and the isolation of the debris via encapsulation (encapsulation). The comparison was made from three perspectives: (1) economic, (2) carbon footprint and (3) ESG (environmental, social and governance) criteria.
This study is the continuation of previous studies in the same areas related to Hg emissions from contaminated waste:
Preliminary analysis was provided in [
43], where it was demonstrated that particle concentrations of As and Hg in the air were minimal.
Then, empirical and chemical–physical models were developed to predict the Hg gaseous concentration emissions at any temperature in highly contaminated areas [
44,
45].
Finally, a Health and Safety Protocol for the management of building demolition waste with high mercury contamination was proposed [
20].
2. Description of the Mercury Mining Sites
Mercury mining and smelting have had an important role in the industrial activity of the region [
11] and El Terronal and La Soterraña were the most important Asturian Hg mines (
Figure 1). They have been exploited by underground mining techniques, using a room and pillar method, reaching more than 500 m deep.
The modern exploitation began in the middle of the 19th century, and the best years for the mercury mining–metallurgical companies that benefited from Asturian cinnabar correspond to the period 1880–1905. These were notable both for the economic performance obtained, as well as for the industrial development achieved and the technical innovation experienced, which allowed production to reach 1500 flasks/year (1 flask = 34.5 kg Hg).
In the twentieth century, Asturias continued to be an important Hg producer on a global scale. Nevertheless, the decline in Hg prices caused a crisis leading to the successive closure of all the mines between 1973 and 1974. In this period, the technological level of the Hg mining industry in Asturias was similar to that existent in the main production areas in the world. Asturias mercury production reached 10,000 flasks/year which represented 5% of the global production of Hg.
El Terronal mine [
4,
11,
46] was in operation during the nineteenth and twentieth centuries, up to 1974. In the late seventies and eighties, the site was used for the irregular disposal of waste coming from other industries (coal mining, mechanical workshops, etc.). Thus, the legacy of the historical activities of mining, mineral and pyrometallurgical processing remained in the form of abandoned industrial installations, including shafts, mining buildings, chimneys and the roasting furnace (
Figure 2A). The roasting furnace was dismantled, with significant quantities of mining and metallurgical wastes stocked in piles on the surface (
Figure 2B). A general view of the current situation of the site is shown in [
47].
The other important mine was La Soterraña [
4,
27,
48], located near the town of Pola de Lena, in which mining and smelting were in operation for decades, with the ore being processed on-site in a large rotary furnace (
Figure 3A). As in the previous case study, there is an important legacy of ruins and spoil heaps because of the intense activity. Up to now, no preventive measures to avoid the dispersion of Hg to the environment have been undertaken.
The metallurgical plant buildings were demolished in 1989 and debris from the demolition, which has a high mercury content, remained on site (
Figure 3B). A general view of the current situation of the site is shown in [
49].
The type of debris treated in both cases was specifically demolition debris from metallurgical plants. It is the type of rubble with the highest mercury contamination and is an actual source of gaseous Hg emissions [
44,
45].
In both cases, it is a heterogeneous waste, a mixture of demolition debris from the buildings and concrete structures that supported the roasting furnaces, on the one hand, and waste deposited in the roaster, chimneys and ducts (dust, soot, etc.), on the other.
Alternatives to Avoid Hg Emission
The measures taken to reduce or, where appropriate, eliminate gaseous Hg emissions into the air from contaminated demolition debris were different in the two cases: in El Terronal, the treatment was ex situ, and in La Soterraña, an in situ technology was used.
According to Santibáñez et al. [
42], ex situ technologies require the excavation of contaminated soil, transport to the treatment area and disposal of the treated soil at permitted locations. In general, these processes can be more controlled and can achieve better results in a shorter time than other techniques, but they are expensive and soil disruptive. Moreover, mostly in the case of Hg, the excavation of a contaminated soil can also strongly increase the volatilization of this element, thus posing a relevant concern for the health of workers and local inhabitants. This should be considered when assessing the remediation strategy. In situ technologies are carried out directly at the contaminated site, soil disturbance is minimized, and there is less exposure of workers and citizens to the contaminants than in the ex situ technologies; furthermore, the in situ treatments are considered cost-effective.
At the El Terronal site, there were special circumstances that determined the ex situ solution adopted. Indeed, at only a few tens of meters from the boundary of the contaminated area there are inhabited dwellings, which means that the problem of Hg emissions into the atmosphere and the high concentrations of Hg in the environment posed a high potential risk to the population. This led to the fact that, in 2018, the administration obliged the property to remove the most contaminated debris, i.e., demolition debris from the metallurgical plant furnaces, to an authorized landfill (
Figure 4).
The property complied with the requirements of the environmental authority but encountered the problem that the nearest authorized waste manager (about 50 km away) did not accept this type of material contaminated with Hg, and it had to be sent to a landfill located more than 260 km away, with the consequent risk of transporting hazardous materials.
On the other hand, this critical risk for the population did not exist at the La Soterraña site. Thus, another more innovative action was carried out in situ within the framework of the SUBProducts4LIFE project, a research project co-funded by the European Union as a part of the LIFE initiative. The adopted innovative remediation strategy carried out at La Soterrana involves reusing industrial waste (mainly coal ash and blast furnace slag) to restore polluted soils, brownfield sites and building debris connected to Hg mining in the decommissioned site of La Soterraña. The initiative seeks to demonstrate cutting-edge circular economy concepts, using industrial subproducts that, if there is no other valorization alternative, remain in waste disposals or landfills.
An impermeable cell or container was built at the base where the demolition rubble was deposited and then was covered with two by-products of the industry: fly ashes from a coal-burning power plant and slags from the blast furnace of a steel factory.
The rubble was removed to build the impermeable cell and then relocated inside it (
Figure 5). The cell was a pool of 600 m
2 limited by the high walls that previously exist and new small concrete walls of 1.20 m high. The work was carried out under very risky conditions, because the Hg concentration in air was very high, and a safety protocol for working in this area had to be developed [
27].
Fly ashes are considered not to be dangerous waste and slags are considered an inert material, following Spanish legislation, and their use is common in civil works for road filling or road slopes. Both by-products were characterized to avoid the introduction of a new concern for the local environment: the concentration of Hg and As in these by-products was negligible in comparison with the demolition waste [
50]. On the other hand, companies which supply by-products have experience in managing large landfills in which these by-products are deposited; consequently, their potential effects on the environment, of very low intensity, are well known.
Regarding the possibility of water contamination, the rain cannot produce leachates due to the low hydraulic conductivity of the fly ashes (that does not allow the water to pass) and due to fact that the treatment cell base and sides are isolated.
Since the quantity of rubble treated is in the same order of magnitude, around 1000 t, a comparative analysis, ex situ vs. in situ, can be made of the two different alternatives used for the treatment of the rubble, considering different points of view such as technical, economic, and environmental.
3. Materials and Methods
The comparative analysis between the two solutions was completed according to the following steps which were developed later:
By analyzing the mercury concentration in the debris and the mercury emissions into the atmosphere, it was demonstrated that the debris in both sites was equivalent from an environmental point of view.
By measuring the mercury concentration in the air, it was demonstrated that, in the case of La Soterraña, covering the rubble with slag and ash eliminates emissions, either on a small scale or full scale; if the solution worked for La Soterraña and the debris are similar, it can be concluded that this solution should also work for El Terronal.
With the real data from both projects, the costs and carbon footprint of each project under real conditions were compared quantitatively and a qualitative analysis was performed according to ESG criteria for both projects.
Three solutions for El Terronal were compared, based on the actual data:
Removal of debris to a nearby landfill.
A conventional solution: encapsulation of the rubble with HDPE geomembranes.
A novel solution: covering the contaminated debris with industrial by-products.
3.1. Procedure Used to Compare the Contamination Potential of Demolition Debris
Two indexes are used to demonstrate that demolition debris have an equivalent contamination potential: the Potential Ecological Risk Index (E
r) and the Geo-Accumulation Index (I
geo). The Potential Ecological Risk Index (E
r) [
51], is defined by Equation (1):
where C
Hg is the measured concentration of mercury in debris (mg/kg or ppm) and C
Hg0 denotes the local soil background value (mg/kg or ppm). T
r is the toxicity coefficient of the toxic element (mercury).
The relationship between the potential ecological risk coefficient and hazard degree of E
r was graded as shown in
Table 1.
In the case of extremely high Hg concentrations, it is better to use the Geo-Accumulation Index [
52], as in Equation (2), because it implies the use of a logarithmic scale.
where C
Hg and C
Hg0 are the measured concentration of mercury in debris and the local soil background value (mg/kg or ppm), respectively. K represents the natural variability in background values that may be due to differences in rock characteristics at different locations. The classification of the I
geo is shown in
Table 2.
3.2. Procedure Used to Compare the Proposed Solutions
On the other hand, solutions adopted to diminish or eliminate mercury emissions are compared using three criteria: costs, carbon footprint, and ESG criteria. The calculation of the total cost C
T of each project is obtained by adding the individual costs, which are the result of multiplying the unit of work W
i by the corresponding unit cost c
i: (Equation (1)), and the carbon footprint is calculated in the same way (Equation (2)):
where E
T are the total CO
2 emissions associated with the project; E
i are the CO
2 emissions associated with the energy and materials used; r
i are the corresponding emission rates.
Finally, the Thomson and Reuters Pillars and Categories, provided in Seth [
53] and Elhers et al. [
54], are taken as a reference to compare the different solutions with respect to the ESG criteria (see
Table 3).
4. Results
4.1. Comparison between the Demolition Debris in Both Mining Sites
4.1.1. Mercury Contamination of Debris
The first factor to compare in the debris in both mining sites is the Hg concentration in the demolition debris, which is similar in both sites. In the case of the El Terronal site, data were taken from Fernández-Martínez et al. [
46]. These authors point out that this rubble had very high mercury contamination levels, with an average mercury concentration of approximately 9800 ppm, showing an important variation according to granulometry between 4600 ppm in the coarser fractions and 28,400 ppm in the finer ones.
In the case of La Soterraña, samples taken during the development of the SUBproducts4LIFE project, published by Ayala and Fernández [
50], show mercury contamination of the same order of magnitude as at the other site. The concentration of Hg varies between 6346 and 34,691 ppm, with an average value of about 17,954 ppm.
4.1.2. Mercury Emission from the Debris
Another way to compare the debris and determine that they are equivalent, in terms of negative effects, is to determine the mercury emission pattern in the air. For this purpose, sampling was carried out, with each sampling consisting of a 1 to 2 h continuous monitoring of the mercury concentration in the air above the debris. Measurements were taken with a LUMEX RA-915 Hg analyzer, a portable multifunctional atomic absorption spectrometer (AAS) with Zeeman background correction, which eliminates the effect of interfering impurities. This equipment has an analytical gaseous Hg range of 1–100,000 ng/m3. All the measurements were carried out at 1.0–1.5 m above ground level, which is the recommended height for airborne environmental values, also useful for occupational risk purposes. The representative value is the mean value of the concentration over the 1–2 h period.
It is known that weather conditions such as temperature, wind, rain, relative humidity, atmospheric pressure, or solar radiation can influence the emission of gaseous mercury [
17,
20]. For example, the wind dilutes the concentration of Hg over the demolition debris, the emission is lower when it has been raining on the previous days due to water evaporation, the fact that clouds can diminish emissions due to lower solar radiation, etc. To avoid the influence of these variables, the measurements were taken on sunny days without rain, clouds, and wind. They represent the worst conditions for each season, that are the most conducive for high gaseous Hg emissions. Consequently, the remediation strategy to limit gaseous Hg emissions based on them will also be effective under any other conditions. On the other hand, the range of variation in the atmospheric pressure at this latitude does not significantly influence emissions. Finally, although the relative humidity could have an influence, this variable strongly depends on temperature, which means that the gaseous mercury concentration can be expressed as a function of only the temperature. That is, taking the measurements at moments of atmospheric stability with sun, without rain, and without wind, the Hg gas emissions depend mainly on the temperature, and other conditions produce only an aleatory dispersion of the emission value. So, sampling was completed usually at noon at different temperatures to include the influence of this variable on emissions. In general terms, coldest temperatures correspond to winter days and hottest ones to summer. Intermediate temperatures are from autumn and spring. The distance from El Terronal to La Soterraña is only of about 11 km; consequently, the general climatic conditions during the year are the same. Complete information about how the measures were taken can be found in [
27,
44].
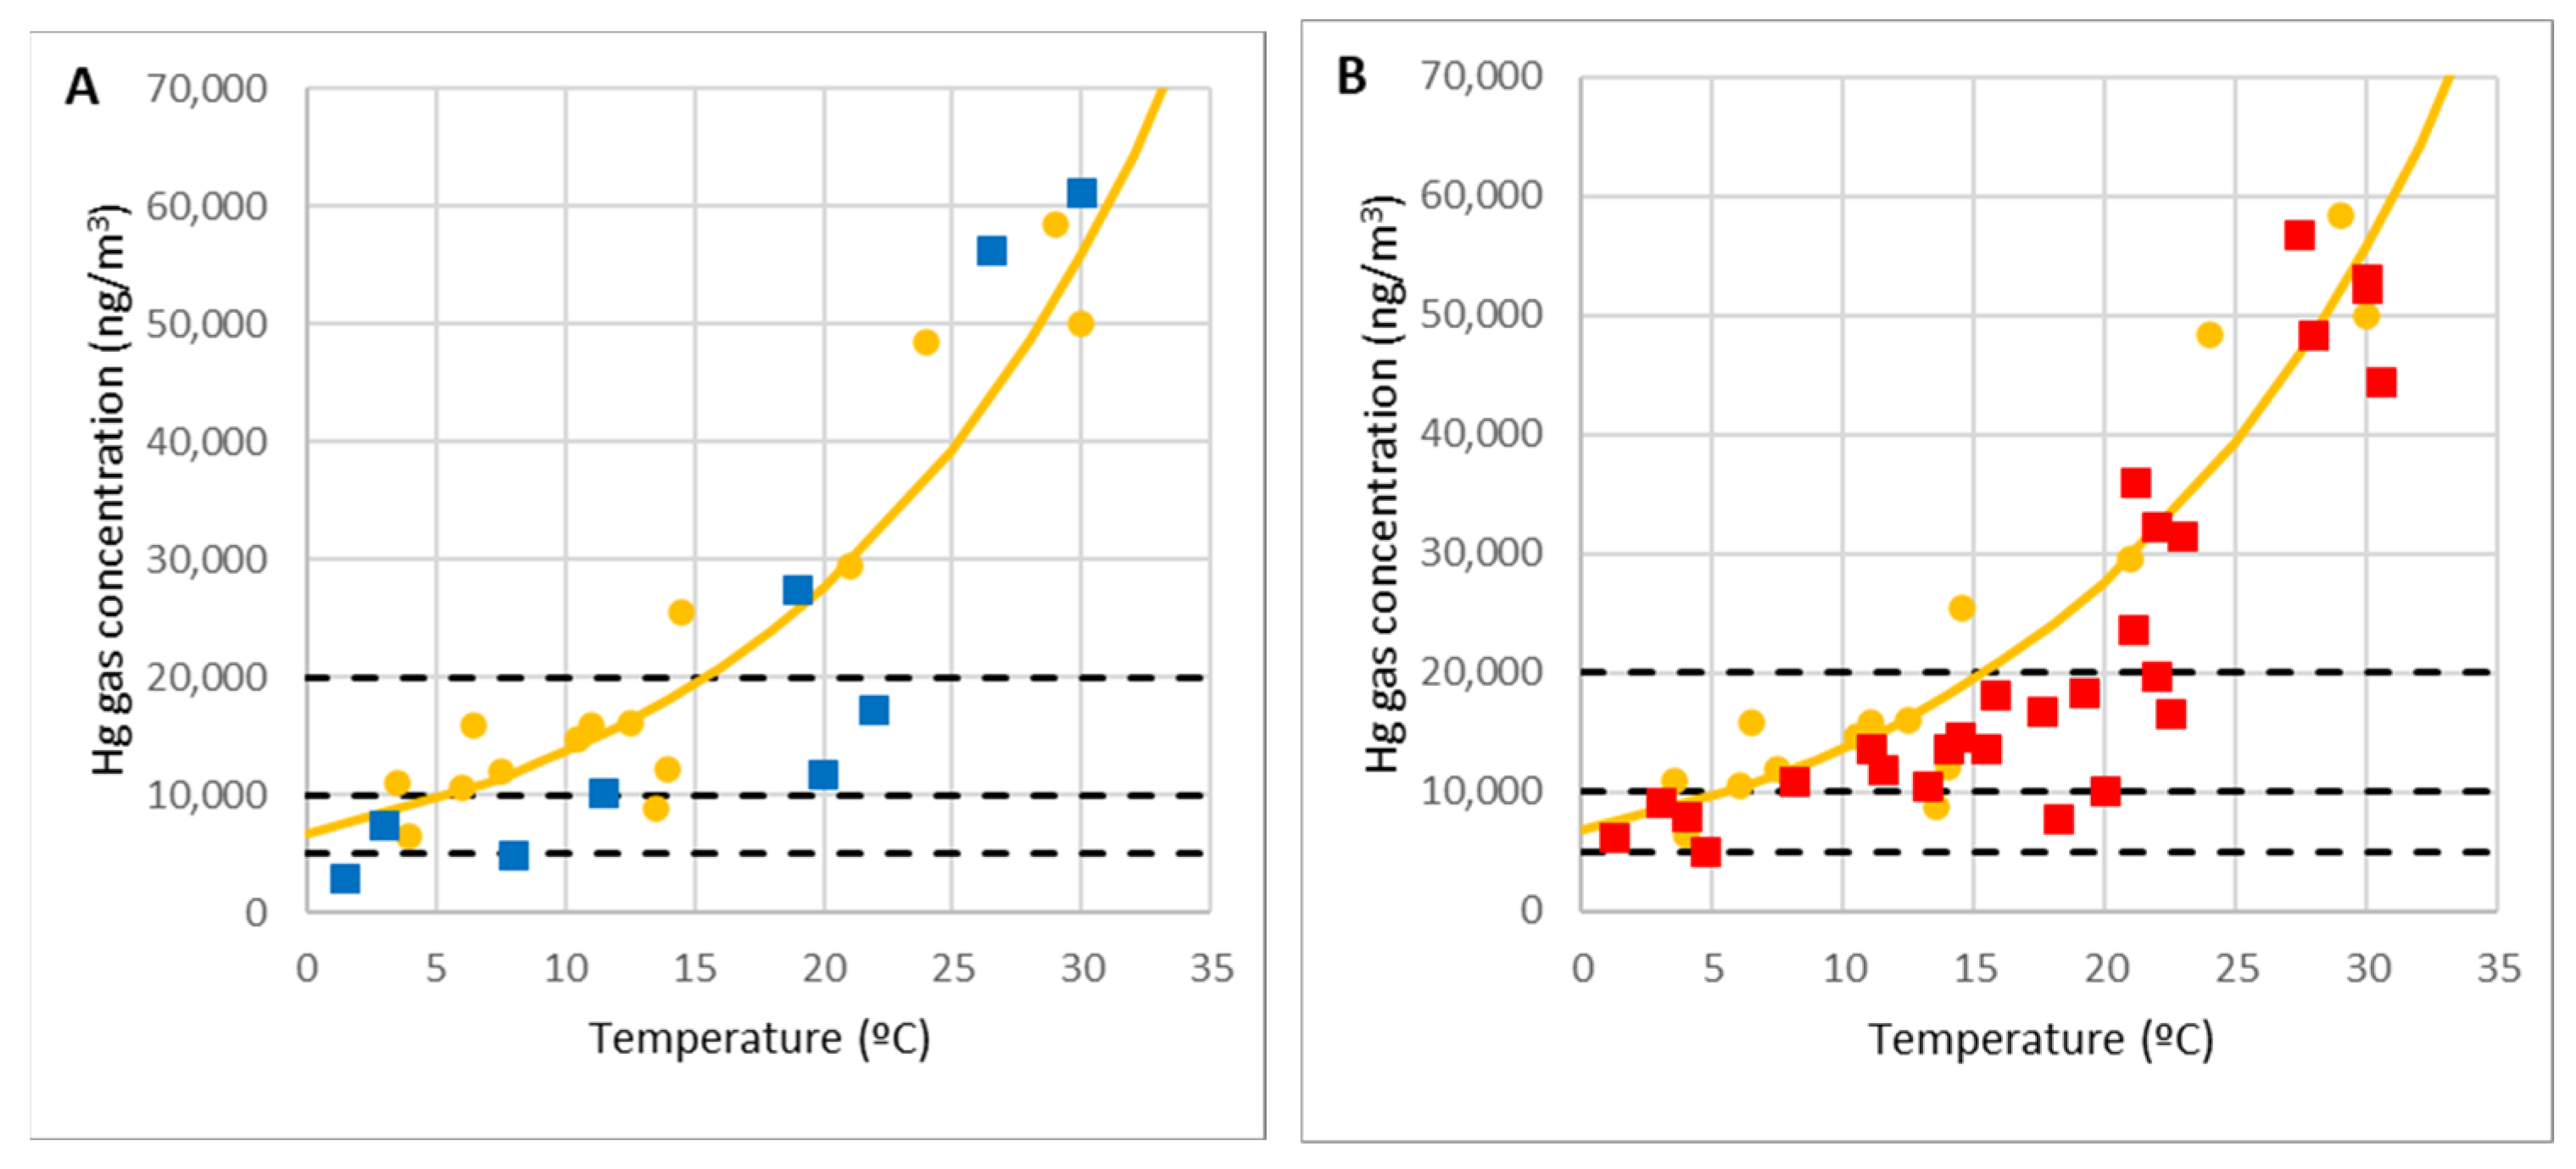
In the case of El Terronal, a total of 14 samples were taken.
Figure 6A shows the result of the measurements (blue dots) superimposed on the curve determined empirically at La Soterraña (yellow dots and line) [
44]. A total of 27 measurements were taken at La Soterraña at different temperatures.
Figure 6B shows the results (red dots) superimposed on the empirical curve [
44]. Overall,
Figure 6 illustrates how the emission pattern is similar in both cases.
Furthermore, it is shown that for temperatures between 20 °C and 25 °C, results are consistent with the maximum values recorded by Loredo et al. [
11] and Loredo et al. [
48] at La Soterraña (45,800 ng/m
3) and El Terronal (40,000 ng/m
3). In our case, higher maximum values of mercury in the air were recorded, because they were measured at the highest temperatures recorded in Asturias (30 °C). To point out the very high concentrations reached at high temperatures, the lines corresponding to the occupational exposure limit value OELV = 20,000 ng/m
3 and the lines of 50% and 25% of OELV are also represented.
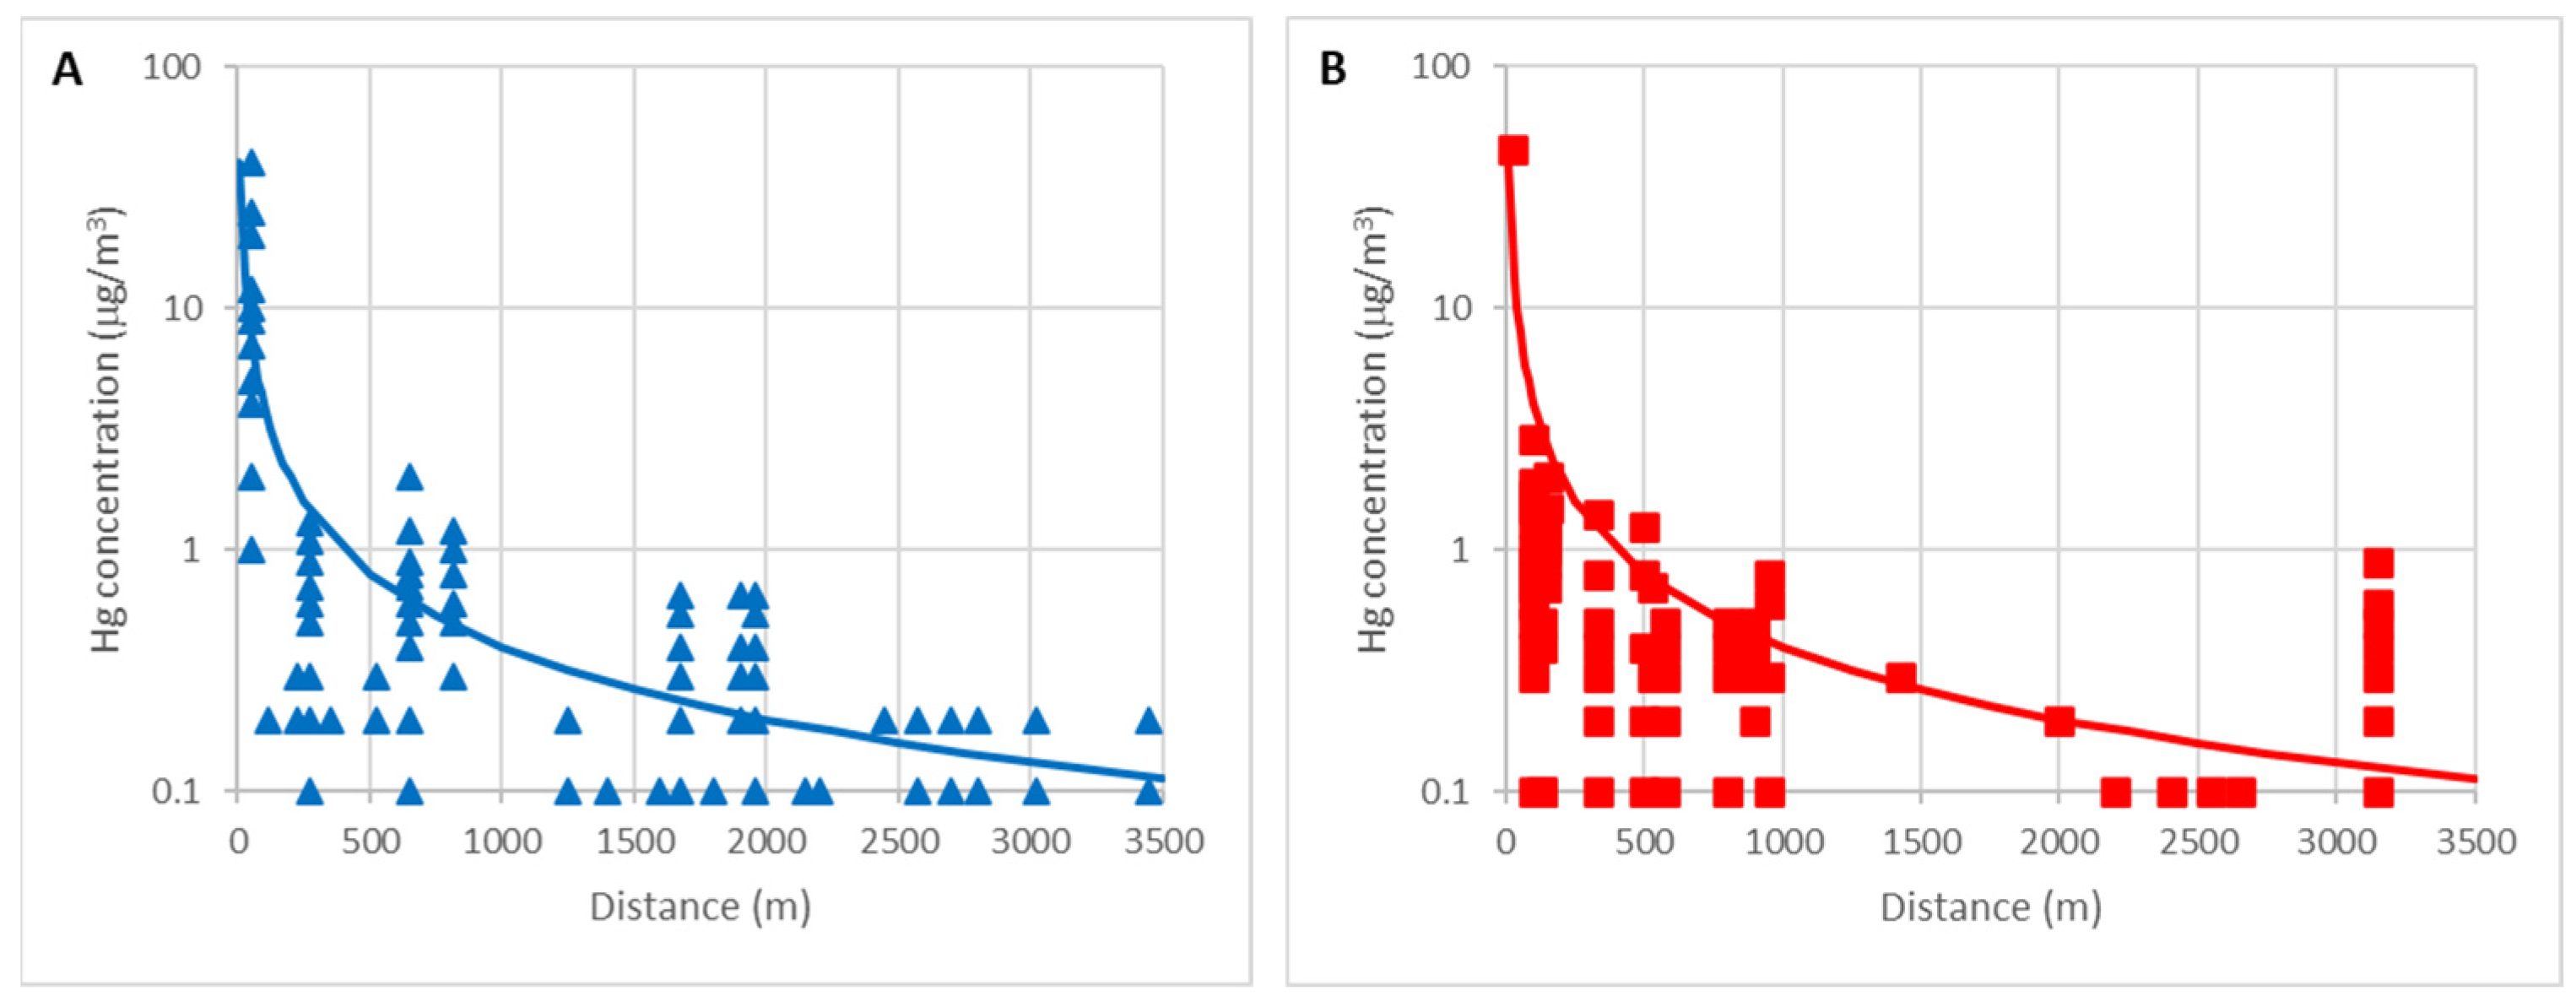
4.1.3. Long-Range Diffusion of Gaseous Mercury
In the same way, the variation curves of the mercury concentration in the air away from the demolition debris are compared in both sites.
Figure 7A,B shows the curves determined by Loredo et al. [
48], for El Terronal (A) and La Soterraña (B). In both cases, the mercury concentration decreases with the inverse of the distance as demonstrated empirically by Rodriguez et al. [
44] and by applying the Ficks diffusion laws according to Rodriguez et al. [
45] for short distance.
At certain distances, the mercury concentration is higher than expected. This is because there are important population centers at that distance (Mieres, Pola de Lena), where there are other sources of mercury emissions.
4.1.4. Potential Risk Associated with Contaminated Debris
In
Table 4, the calculations of the ecological potential risk, E
r, and the geo-accumulation, I
geo, indexes associated with contaminated debris are shown. As mentioned above, the values of Hg concentration in the debris at El Terronal and La Soterraña are 9800 and 17,954 ppm, respectively.
The value of parameter K is 1.5, according to other similar studies [
55,
56]. The toxicity coefficient for mercury is T
r = 40. In the calculation, the background values are the minimum values for El Terronal and La Soterraña, C
Hg0 = 0.7 and C
Hg0 = 0.6, reported by Wcislo [
26] and Boente et al. [
57], similar to the background content in Asturian surface soil, C
Hg0 = 0.5 ppm.
As can be seen in
Table 4, both indexes take values of the same order of magnitude and thus, the environmental risks associated with the debris are similar in both mining sites.
4.2. Analysis of the Use of Industrial By-Products to Avoid Gaseous Mercury Emissions
According to Sinnett et al. [
32], remediation technologies can be described as physical (e.g., placing a barrier between a source and a receptor), chemical or biological methods (e.g., removing, degrading or immobilizing the contaminants). One of the main objectives of the project in La Soterraña site was to use industrial waste (blast furnace slag and coal ashes) to improve the environment by covering a large part of the demolition rubble with slag and ashes.
As it was demonstrated in previous works [
44,
45] on this site, there was an area with demolition debris in its original location, which behaved as an emitting source of gaseous mercury.
Figure 8A shows a Hg-gas record obtained at 15.5 °C; the average concentration reached 13,680 ng/m
3. On the other hand, there was a second area with demolition rubble covered with slag and ashes and it was also verified that the layer of slag and ashes stopped the emissions from the rubble that was covered up.
Figure 8B shows a record of the monitoring of gaseous Hg over the covered rubble on the same day. With a temperature of 15.5 °C, the average concentration of Hg in the air is 814 ng/m
3, utterly different from the point previously analyzed.
It was also demonstrated that the emissions of Hg gas and its concentration in the air strongly depended on the temperature, as shown in
Figure 9A. With temperatures around 30 °C, the average Hg gas concentration in the rubble air reached almost 60,000 ng/m
3, much more than the occupational exposure limit value, OELV = 20,000 ng/m
3 (dotted line). Nevertheless, as shown in
Figure 9B, the concentration of gaseous Hg over the covered debris was low, like other site points. The average value was less than 2000 ng/m
3 and the maximum measures carried out under worst conditions were always below 4000 ng/m
3.
It is important to point out that the Hg-gas concentration in the air over covered debris is not a consequence of emissions from this waste, but results from the dispersion of Hg gas from the rubble that remains uncovered. In effect, the concentration of Hg in the air over the covered area is the same as the concentration of Hg in other points at the same distance in which there is no contaminated waste. If there was no uncovered debris near the covered area, the concentration of Hg would always remain below the annual average limit 1000 ng/m
3, suggested by WHO for atmospheric Hg, taken in this work as the reference limit value. The environmental authorities can require a lower limit value [
15] or accept a higher one according to the specific problem, for example, 10% of the occupational limit, this is 2000 ng/m
3. In brief, the concentration of gaseous Hg dropped drastically by covering the rubble with slag and ashes. It should be noted that covering the contaminated material is an effective safety measure for reducing environmental impact.
4.3. Comparison between the Two Real Implemented Solutions
Table 5 shows the results of the calculations performed using unit costs and actual prices (see
Table A1 in
Appendix A). It should be noted that these can be abnormally high prices resulting from extreme working conditions, an environment with mercury and arsenic contamination with high temperatures, perhaps even having restrictions on working hours, as described in [
27].
Thus, the cost per ton of rubble treated by subproducts is cheaper, amounting to approximately 98 EUR/t (73% of the cost of the rubble removal). The saving is mainly due to the high price of the contaminated waste management in an authorized waste disposal site.
It should be noted that, if mercury-contaminated debris had not been accepted at this authorized waste disposal located 260 km away, the removed debris would have to be sent to the only landfill that would safely accept it, the Mercury Technology Centre, a national reference center 750 km away. In this case, the cost would increase and, therefore, the relative cost of the new solution would decrease to 53% of the cost of rubble removal.
As in the previous calculation, actual data estimated during the execution of the project have been applied, as well as common, average emission ratios. The energy used comes entirely from the diesel consumption of the machinery. For road transport, an emission ratio of 2630 gCO
2 per liter of diesel fuel is considered, based on the study made by López and Sánchez [
58], while in the work of the heavy machinery, a ratio of 3250 gCO
2/L is assumed, according to Shillaber et al. [
59]. In terms of materials, HDPE sheeting is associated with 3000 gCO
2/m
2 according to Rodrigo [
60], while low-strength concrete is associated with emissions of 166 kg/m
3 according to Rodriguez et al. [
61], which coincides with the trend in emissions of new concrete [
62].
It should be noted that the value of the parameters to be used depends on the location and circumstances in which the projects are developed. However, as it is a comparative analysis between two alternatives and the same values are used in both cases, the numerical value used is not so relevant to the result.
Regarding carbon footprint analysis, there are three ways to associate it with ashes according to Chen et al. [
63] and Seto et al. [
64]: (1) based on an economic balance, (2) on a mass balance or (3) according to the so-called system expansion method. However, in different studies on the use of ashes in cement manufacture, it is assumed that ashes are not associated with CO
2 emissions [
65,
66,
67,
68].
According to the system expansion method presented by Babbitt and Lidner [
69], a by-product is industrial waste produced in a primary process that is, subsequently, used in a secondary process. In this case, the by-product is only associated with the CO
2 emissions corresponding to the second process, not to the primary one. In other words, the emissions associated with the by-products are those related to their loading, transport and spreading. García-Segura et al. [
68] added another relevant reason to consider; the ashes were extracted from the flue gas precisely to avoid particulate pollution, so they already have a positive impact regardless of their subsequent use. By-products are usually deposited in landfills or dumps until they are put to use. A landfill is an artificial accumulation of a substance that in principle has no value, although it may become valuable. In this sense, the landfill behaves as a deposit, i.e., a natural accumulation, of that material and no emissions are associated with its generation.
Table 6 summarizes the results of the carbon footprint calculations. The CO
2 emissions per ton of rubble treated using by-products are about 48 kgCO
2/t, compared to 51 kgCO
2/t produced through the removal of the rubble. This means that with the use of by-products, the carbon footprint is practically the same, about 94% of that achieved with rubble removal. Similarly, if the rubble had to be sent to the Mercury Technology Centre, the CO
2 emissions of this solution would be much higher, and the carbon footprint of the by-product solution would be 36% of the carbon footprint produced through the rubble removal.
Finally, the two solutions are compared concerning the ESG criteria. However, this is only completed qualitatively via indicating the criteria where the two solutions are equivalent, or one of them is better. As can be seen in
Table 7, the proposed new solution using ash and slag outperforms the old one in seven of the ten categories of the ESG analysis.
4.4. Comparison between the Newly Proposed Solution and Previous Solutions
In the previous section, the solution of covering the debris with by-products was found to be more economically and environmentally advantageous. Results from La Soterraña can be extrapolated to El Terronal and the solution adopted in El Terronal, removing the rubble, can then be compared with other alternative solutions that could have been implemented on the same site. Specifically, the following three simplified solutions are analyzed:
- (a)
Rubble removal and shipment to authorized landfill (the same solution described above). It has to be said that this is an unrealistic solution, because the transfer of contaminated rubble to another region would be very difficult to assume (except, as mentioned, to the Mercury Technology Centre landfill 750 km away) and, in any case, it would only be possible if the amount of rubble was small.
- (b)
Creation of a safety deposit on-site by encapsulation of the rubble using geomembranes. It is assumed that a 2 mm thick HDPE geomembrane or sheet would be placed on the floor, on top of that a 20 cm layer of aggregate on which the rubble would be placed. Finally, the rubble would be covered with HDPE sheeting to form an isolated encapsulation.
- (c)
Covering the rubble with a 50 cm layer of ashes, as proposed in the SUBproducts4LIFE, looking for the simplest and most efficient solution to stop mercury emissions with the lowest carbon footprint.
Table 8 and
Table 9 compare the solutions where only the parts with the highest impact on both cost and carbon footprint, are taken into account (see
Table A3 and
Table A4 of
Appendix A). For the aggregate used in solution (b), a standard market price of EUR 7/t and average emissions of 5.36 kgCO
2/t are considered [
70,
71].
Vegetation can inhibit mercury emission from the soil, especially during summer and autumn [
34,
35]. Nevertheless, demolition debris is an extremely aggressive environment for plants and plants cannot grow, and finally will die. Consequently, in this case, vegetation cannot be considered as a solution itself but a useful complementary action with any of the alternatives studied.
It is found that, concerning the solution adopted, the encapsulation and ash coating solutions are advantageous. The costs per ton are approximately EUR 133, 77 and 55/t in the three cases. In other words, the cost reduction is approximately 42% with the encapsulation solution and up to 59% with the use of a by-product solution. In terms of saving money, considering the rest of tasks as equal, the encapsulation represents a saving of EUR 56/t and the use of by-products EUR 78/t in respect of removal of the debris.
In the same way, it is observed that the carbon footprint for the three solutions is approximately 51, 13 and 11 kgCO2/t. In other words, the carbon footprint reduction is approximately 73% with encapsulation and 79% with coating. Similarly, the encapsulation represents a reduction of 38 kgCO2/t and the use of by-products 40 kgCO2/t in respect of removal of the waste.
Overall, the solution of covering the rubble with coal ash is the most advantageous of the three options. Furthermore, it is found that, if this solution had been used, both the cost and the carbon footprint would have been less than half of the solution of removing the rubble.
Regarding the qualitative analysis according to the ESG criteria, the same results obtained in the previous section would be achieved.
5. Discussion
Gaseous mercury emissions from La Soterraña have been compared with those from another similar mining site, El Terronal, showing that the metallurgical plant demolition debris in both cases are equivalent. Indeed, the mercury concentration in the debris is of the same order and the Hg emissions from the debris and their diffusion in the surroundings follow the same physicochemical laws. Likewise, from the calculation of the Potential Ecological Risk Index and the Geo-Accumulation Index, the same conclusion is reached: the potential risk to the environment is the same in both cases.
It has been demonstrated that the solution of covering the contaminated area with by-products is a good alternative in terms of atmospheric Hg contamination management of abandoned sites. The new alternative proposed within the SUBproducts4LIFE project has been compared to two conventional options, achieving clear benefits from an environmental and economic perspective.
In this respect, the alternative of removing the debris and transferring it to an authorized landfill is only acceptable if public health is at stake. Moreover, this solution is only feasible in the case of a moderate amount of debris and when the distance to the landfill is small. Otherwise, the other two solutions are better.
While encapsulation is a viable option, the cost is higher than the new alternative proposed and it involves the use of natural resources. In addition, it does not serve as a base for foundations or footings in the recovered site or for tree planting, only with herbaceous plants.
Moreover, the new alternative reintroduces a byproduct to the system, slag and ashes, without any current use that has to be stored in a landfill, thus eliminating mercury emissions in the short and long term. Therefore, there is a double beneficial effect in terms of environmental impact and cost associated with its management: elimination of the waste disposal needs for slag and ashes and of mercury emissions.
It has been proved that on-site treatment represents half the cost and reduces the risks of transport and deposition since the material is kept in a place that is already contaminated. The contamination is not carried to another site and, therefore, the potential environmental impact in other places or during transportation is eliminated.
Considering that: (a) the debris had the same concentration of Hg, (b) the emissions from the debris follow the same law (follow the empirical or chemical–physical model) it is shown that the SUBproducts4LIFE solution would have been perfectly valid for the El Terronal site. It can be shown that the hazard indices estimated are drastically reduced if the contaminated waste is covered [
8].
Due to a solution being considered useful if the emissions are reduced below 1000 ng/m3, this new alternative was not compared with encapsulation in terms of absolute gaseous Hg emissions, and this could be a topic to more extensively examine in other studies.
Further research should be also completed on the usage of landfill materials for the inertization of other types of waste. As in this study, there are important potential synergies.
In addition, water contamination remediation using ashes and slag should also be explored, avoiding the contact of rainwater with debris. Data about the effect of rainwater and Hg mobility after the cover represent a key aspect to be evaluated before implementing the proposed solution for remediation of contaminated sites. Preliminary results concerning this demonstrate that, in the case studied, the low hydraulic conductivity of ashes means that most of the water does not pass through them, thus diminishing the possibility of becoming contaminated.
The SUBproducts4LIFE approach can be the first transitory solution that improves the situation until a definitive integral treatment is implemented. In this regard, it could be a proper solution for other smaller dumps with Hg problems in Asturias, such as Brañalamosa, Maramuñiz, Caunedo, and Olicio.
6. Conclusions
Within the framework of the SUBproducts4LIFE research project, a novel solution that eliminates mercury emissions into the atmosphere from demolition debris has been tested on a full scale at the La Soterraña site. It is a physical method that consists of covering the contaminated debris with industrial by-products, mainly thermal ashes and blast furnace slag. In this sense, the solution proposed can be applied to the other case study, El Terronal. This novel solution has been compared with two other conventional alternatives: removal of the debris and encapsulation.
The option of coating with by-products has important advantages since it is comparatively cheaper and involves the reuse of some byproducts, which have no economic value if they are not used, and that may have to be placed in landfills. Therefore, its usage can imply important synergies from an environmental and economic point of view, converting two problems in one common solution.
In addition, this study allows us to initiate further research in three very relevant aspects: (1) its replicability in other contaminated sites, (2) the combination of different landfill wastes and contaminated areas for remediation purposes and (3) the usage of ashes and slag to avoid rainwater contamination.
Author Contributions
Conceptualization, R.R.; methodology, R.R., Z.H. and M.B.; validation, R.R., Z.H. and B.F.; investigation, R.R., Z.H. and B.F.; data curation, R.R. and B.F.; writing—original draft preparation, R.R., M.B. and Z.H.; writing—review and editing, M.B. and B.F.; supervision, R.R.; project administration, R.R. and Z.H.; funding acquisition, R.R. All authors have read and agreed to the published version of the manuscript.
Funding
The authors would like to thank the program LIFE of the European Commission for the funding received for the project SUBproducts4LIFE (reference LIFE16 ENV/ES/000481).
Data Availability Statement
The data presented in this study are available within the manuscript.
Acknowledgments
Authors would like to thank the collaboration of the institutions and private companies that participated in the project SUBproducts4LIFE: Biosfera consultoría Medioambiental (BIOSFERA), Escorias y Derivados (EDERSA), Global Service (GService), Hidroeléctrica del Cantábrico (EDP), Instituto Asturiano de Prevención de Riesgos Laborales (IAPRL), Recuperación y Renovación (R&R) and Universidad de Oviedo (UNIOVI). Finally, the collaboration of sponsors Arcelor Mittal, Ingeniería de Montajes Norte S.A. (IMSA), Asturbelga de Minas, Lena Council, and the Instituto Nacional de Silicosis (INS) is also greatly appreciated.
Conflicts of Interest
The authors declare no conflict of interest.
Appendix A
The following tables gather the calculations of the three case studies analyzed in the manuscript.
Table A1 shows the calculations for the actual implemented solutions at El Terronla and La Soterraña sites made using unit costs and actual prices.
Table A2 summarizes the carbon footprint calculations for actual implemented solutions at El Terronal and La Soterraña sites.
Table A3 compares the costs of the three different alternatives for El Terronal site.
Table A4 shows the comparison of carbon footprint of the three different alternatives for El Terronal site.
Table A1.
Costs calculation (comparison between the two studied sites).
Table A1.
Costs calculation (comparison between the two studied sites).
| Concept | El Terronal | La Soterraña |
|---|
| 1. Mass of demolition debris (t) | 1002 | 1224 |
| 2. Management of demolition debris | | |
| Price per ton of debris (EUR/t) | 27.00 | 29.00 |
| Cost (EUR) | 27,054 | 35,496 |
| 3. Transportation to an authorized waste disposal | | |
| Distance to the authorized waste disposal (km) | 260 | N/A |
| Price per ton and km (EUR/t × km) | 0.102 | N/A |
| Cost (EUR) | 26,573 | 0 |
| 4. Waste management in authorized waste disposal | | |
| Mass of demolition debris (t) | 1002 | N/A |
| Price of waste management (EUR/t) | 80.00 | N/A |
| Cost (EUR) | 80,160 | 0 |
| 5. Treatment of demolition debris “in situ” | | |
| Length of the brick wall (m) | N/A | 80 |
| Price per meter of wall (EUR/m) | N/A | 90.50 |
| Concrete floor (m3) | N/A | 150 |
| Price of concrete (EUR/m3) | N/A | 69.00 |
| HDPE Geomembrane (m2) | N/A | 1000 |
| Price of the HDPE Geomembrane (EUR/m2) | N/A | 22.00 |
| Mass of coal ash (t) | N/A | 350 |
| Mass of furnace slags (t) | N/A | 550 |
| Price of managing slags and ashes (EUR/t) | N/A | 29.00 |
| Cost (EUR) | 0 | 65,690 |
| 6. Valorization of subproducts | | |
| Mass of coal ash (t) | N/A | 350 |
| Price of coal ash (EUR/t) | N/A | 25.00 |
| Distance from power station (km) | N/A | 25 |
| Price per ton of ash and km (EUR/t × km) | N/A | 0.13 |
| Mass of furnace slag (t) | N/A | 550 |
| Price of furnace slag (EUR/t) | N/A | 7.00 |
| Distance from steel factory (km) | N/A | 50 |
| Price per ton of slag and km (EUR/t × km) | N/A | 0.17 |
| Cost (EUR) | 0 | 18,340 |
| Total Cost (EUR) | 133,787 | 119,526 |
| Total cost per ton of debris (EUR/t) | 133.52 | 97.65 |
Table A2.
Carbon footprint determination (comparison between the two studied sites).
Table A2.
Carbon footprint determination (comparison between the two studied sites).
| Concept | El Terronal | La Soterraña |
|---|
| 1. Mass of demolition debris (t) | 1002 | 1224 |
| 2. Management of demolition debris | | |
| Working hours of machinery (h) | 35 | 40 |
| Fuel consumption (L/h) | 42 | 42 |
| CO2 emission rate (gCO2/L) | 3250 | 3250 |
| Carbon footprint (kg CO2) | 4778 | 5460 |
| 3. Transportation to an authorized waste disposal | | |
| Distance to the authorized waste disposal (km) | 260 | N/A |
| Fuel consumption per ton and km (L/(t × km) | 0.064 | N/A |
| Total fuel consumption (L) | 16,721 | N/A |
| CO2 emission rate (gCO2/L) | 2630 | N/A |
| Carbon footprint (kg CO2) | 43,976 | 0 |
| 4. Waste management in authorized waste disposal | | |
| Working hours of machinery (h) | 35 | N/A |
| Fuel consumption (L/h) | 20 | N/A |
| CO2 emission rate (gCO2/L) | 3250 | N/A |
| Carbon footprint (kg CO2) | 2275 | 0 |
| 5. Treatment of demolition debris “in situ” | | |
| Concrete floor (m3) | N/A | 150 |
| CO2 emission rate of concrete (gCO2/m3) | N/A | 166,000 |
| HDPE Geomembrane (m2) | N/A | 1000 |
| CO2 emission rate of Geomembrane (gCO2/m2) | N/A | 3000 |
| Working hours of machinery (h) | N/A | 112 |
| Fuel consumption (L/h) | N/A | 42 |
| CO2 emission rate (gCO2/L) | N/A | 3250 |
| Carbon footprint (kg CO2) | 0 | 43,188 |
| 6. Valorization of subproducts | | |
| Mass of coal ash (t) | N/A | 350 |
| CO2 emission rate of coal ash (gCO2/t) | N/A | 0.0 |
| Distance from power station (km) | N/A | 25 |
| Fuel consumption per ton of ash and km (L/(t × km) | N/A | 0.080 |
| CO2 emission rate of fuel (gCO2/L) | N/A | 2630 |
| Mass of furnace slag (t) | N/A | 550 |
| CO2 emission rate of furnace slag (gCO2/t) | N/A | 0.0 |
| Distance from steel factory (km) | N/A | 50 |
| Fuel consumption per ton of slag and km (L/(t × km) | N/A | 0.105 |
| CO2 emission rate of fuel (gCO2/L) | N/A | 2630 |
| Carbon footprint (kg CO2) | 0 | 9435 |
| Total Carbon footprint (kg CO2) | 51,029 | 58,083 |
| Total Carbon footprint per ton of debris (kg CO2/t) | 50.9 | 47.45 |
Table A3.
Costs calculation (comparison between different alternatives in the same site).
Table A3.
Costs calculation (comparison between different alternatives in the same site).
| Concept | Terronal (a) | Terronal (b) | Terronal (c) |
|---|
| 1. Mass of demolition debris (t) | 1000 | 1000 | 1000 |
| 2. Management of demolition debris | | | |
| Price per ton of debris (EUR/t) | 27.00 | 27.00 | 27.00 |
| Cost (EUR) | 27,000 | 27,000 | 27,000 |
| 3. Transportation to an authorized landfill | | | |
| Distance to the authorized waste disposal (km) | 260 | N/A | N/A |
| Price per ton and km (EUR/t × km) | 0.102 | N/A | N/A |
| Cost (EUR) | 26,520 | 0 | 0 |
| 4. Waste management in authorized landfill | | | |
| Mass of demolition debris (t) | 1000 | N/A | N/A |
| Price of waste management (EUR/t) | 80.00 | N/A | N/A |
| Cost (EUR) | 80,000 | 0 | 0 |
| 5. Treatment of demolition debris “in situ” | | | |
| Length of the brick wall (m) | N/A | 100 | 100 |
| Price per meter of wall (EUR/m) | N/A | 90.50 | 90.50 |
| HDPE Geomembrane (m2) | N/A | 1600 | N/A |
| Price of the HDPE Geomembrane (EUR/m2) | N/A | 22.00 | N/A |
| Mass of aggregate or coal ash (t) | N/A | 180 | 350 |
| Price of managing aggregate or ash (EUR/t) | N/A | 29.00 | 29.00 |
| Cost (EUR) | 0 | 49,110 | 18,500 |
| 6. Valorization of subproducts | | | |
| Mass of aggregate or coal ash (t) | N/A | 180 | 350 |
| Price of aggregate or coal ash (EUR/t) | N/A | 7.00 | 25.00 |
| Distance from quarry or power station (km) | N/A | 15 | 15 |
| Price of aggregate or ash and km (EUR/t × km) | N/A | 0.13 | 0.13 |
| Cost (EUR) | 0 | 1611 | 9433 |
| Total Cost (EUR) | 133,520 | 77,721 | 54,933 |
| Total cost per ton of debris (EUR/t) | 133.52 | 77.22 | 54.93 |
Table A4.
Carbon footprint determination (comparison between different alternatives in the same site).
Table A4.
Carbon footprint determination (comparison between different alternatives in the same site).
| Concept | Terronal (a) | Terronal (b) | Terronal (c) |
|---|
| 1. Mass of demolition debris (t) | 1000 | 1000 | 1000 |
| 2. Management of demolition debris | | | |
| Working hours of machinery (h) | 35 | 35 | 35 |
| Fuel consumption (L/h) | 42 | 42 | 42 |
| CO2 emission rate (gCO2/L) | 3250 | 3250 | 3250 |
| Carbon footprint (kg CO2) | 4778 | 4778 | 4778 |
| 3. Transportation to an authorized landfill | | | |
| Distance to the authorized waste disposal (km) | 260 | N/A | N/A |
| Fuel consumption per ton and km (L/(t × km) | 0.064 | N/A | N/A |
| Total fuel consumption (L) | 16,640 | N/A | N/A |
| CO2 emission rate (gCO2/L) | 2630 | N/A | N/A |
| Carbon footprint (kg CO2) | 43,763 | 0 | 0 |
| 4. Waste management in authorized landfill | | | |
| Working hours of machinery (h) | 35 | N/A | N/A |
| Fuel consumption (L/h) | 20 | N/A | N/A |
| CO2 emission rate (gCO2/L) | 3250 | N/A | N/A |
| Carbon footprint (kg CO2) | 2275 | 0 | 0 |
| 5. Treatment of demolition debris “in situ” | | | |
| HDPE Geomembrane (m2) | N/A | 1600 | N/A |
| CO2 emission rate of Geomembrane (gCO2/m2) | N/A | 3000 | N/A |
| Working hours of machinery (h) | N/A | 18 | 35 |
| Fuel consumption (L/h) | N/A | 42 | 42 |
| CO2 emission rate (gCO2/L) | N/A | 3250 | 3250 |
| Carbon footprint (kg CO2) | 0 | 7257 | 4778 |
| 6. Valorization of subproducts | | | |
| Mass of aggregate or coal ash (t) | N/A | 180 | 350 |
| CO2 emission rate of aggregate or ash (gCO2/t) | N/A | 5360 | 0.0 |
| Distance from quarry/power station (km) | N/A | 15 | 15 |
| Fuel consumption aggregate or ash (L/(t × km) | N/A | 0.080 | 0.080 |
| CO2 emission rate of fuel (gCO2/L) | N/A | 2630 | 2630 |
| Carbon footprint (kg CO2) | 0 | 1533 | 1105 |
| Total Carbon footprint (kg CO2) | 50,816 | 13,567 | 10,660 |
| Total Carbon footprint per ton (kg CO2/t) | 50.82 | 13.57 | 10.66 |
References
- Hylander, L.D.; Meili, M. 500 Years of Mercury Production: Global Annual Inventory by Region until 2000 and Associated Emissions. Sci. Total Environ. 2003, 304, 13–27. [Google Scholar] [CrossRef] [PubMed]
- WHO. Mercury and Health. World Health Organization. 2017. Available online: https://www.who.int/news-room/fact-sheets/detail/mercury-and-health (accessed on 1 July 2023).
- WHO. Air Quality Guidelines for Europe. World Health Organization. 2000. Available online: https://www.who.int/publications/i/item/9789289013581 (accessed on 10 August 2023).
- Loredo, J.; Ordóñez, A.; Gallego, J.R.; Baldo, C.; García-Iglesias, J. Geochemical Characterisation of Mercury Mining Spoil Heaps in the Area of Mieres (Asturias, Northern Spain). J. Geochem. Explor. 1999, 67, 377. [Google Scholar] [CrossRef]
- Lin, Y.; Larssen, T.; Vogt, R.D.; Feng, X. Identification of Fractions of Mercury in Water, Soil and Sediment from a Typical Hg Mining Area in Wanshan, Guizhou Province, China. Appl. Geochem. 2010, 25, 60–68. [Google Scholar] [CrossRef]
- Ordóñez, A.; Álvarez, R.; Charlesworth, S.; Miguel, E.D.; Loredo, J. Risk Assessment of Soils Contaminated by Mercury Mining, Northern Spain. J. Environ. Monit. 2011, 13, 128–136. [Google Scholar] [CrossRef] [PubMed]
- Yan, J.; Wang, C.; Wang, Z.; Yang, S.; Li, P. Mercury concentration and speciation in mine wastes in Tongren mercury mining area, southwest China and environmental effects. Appl. Geochem. 2019, 106, 112–119. [Google Scholar] [CrossRef]
- Wang, S.; Feng, X.; Qiu, G.; Shang, L.; Li, P.; Wei, Z. Mercury Concentrations and Air/Soil Fluxes in Wuchuan Mercury Mining District, Guizhou Province, China. Atmos. Environ. 2007, 41, 5984–5993. [Google Scholar] [CrossRef]
- Scholtz, M.T.; Van Heyst, B.J.; Schroeder, W.H. Modelling of Mercury Emissions from Background Soils. Sci. Total Environ. 2003, 304, 185–207. [Google Scholar] [CrossRef]
- Kotnik, J.; Horvat, M.; Dizdarevič, T. Current and Past Mercury Distribution in Air over the Idrija Hg Mine Region, Slovenia. Atmos. Environ. 2005, 39, 7570–7579. [Google Scholar] [CrossRef]
- Loredo, J.; Soto, J.; Alvarez, R.; Ordóñez, A. Atmospheric Monitoring at Abandoned Mercury Mine Sites in Asturias (NW Spain). Environ. Monit. Assess. 2007, 130, 201–214. [Google Scholar] [CrossRef]
- Zhu, J.; Wang, D.; Liu, X.; Zhang, Y. Mercury Fluxes from Air/Surface Interfaces in Paddy Field and Dry Land. Appl. Geochem. 2011, 26, 249–255. [Google Scholar] [CrossRef]
- Qiu, G.; Feng, X.; Meng, B.; Sommar, J.; Gu, C. Environmental Geochemistry of an Active Hg Mine in Xunyang, Shaanxi Province, China. Appl. Geochem. 2012, 27, 2280–2288. [Google Scholar] [CrossRef]
- Cabassi, J.; Tassi, F.; Venturi, S.; Calabrese, S.; Capecchiacci, F.; D’Alessandro, W.; Vaselli, O. A New Approach for the Measurement of Gaseous Elemental Mercury (GEM) and H2S in Air from Anthropogenic and Natural Sources: Examples from Mt. Amiata (Siena, Central Italy) and Solfatara Crater (Campi Flegrei, Southern Italy). J. Geochem. Explor. 2017, 175, 48–58. [Google Scholar] [CrossRef]
- Vaselli, O.; Nisi, B.; Rappuoli, D.; Cabassi, J.; Tassi, F. Gaseous Elemental Mercury and Total and Leached Mercury in Building Materials from the Former Hg-Mining Area of Abbadia San Salvatore (Central Italy). Int. J. Environ. Res. Public Health 2017, 14, 425. [Google Scholar] [CrossRef] [PubMed]
- Floreani, F.; Pavoni, E.; Gosar, M.; Covelli, S. Evasion of Gaseous Elemental Mercury from Forest and Urban Soils Contaminated by Historical and Modern Ore Roasting Processes (Idrija, Slovenia). Atmosphere 2023, 14, 1036. [Google Scholar] [CrossRef]
- Miller, M.; Gustin, M.; Eckley, C. Measurement and scaling of air-surface mercury exchange from substrates in the vicinity of two Nevada gold mines. Sci. Total Environ. 2011, 409, 3879–3886. [Google Scholar] [CrossRef] [PubMed]
- Lindberg, S.E.; Kim, K.H.; Meyers, T.P.; Owens, J.G. Micrometeorological Gradient Approach for Quantifying Air/Surface Exchange of Mercury Vapor: Tests over Contaminated Soils. Environ. Sci. Technol. 1995, 29, 126–135. [Google Scholar] [CrossRef] [PubMed]
- Llanos, W.; Kocman, D.; Higueras, P.; Horvat, M. Mercury Emission and Dispersion Models from Soils Contaminated by Cinnabar Mining and Metallurgy. J. Environ. Monit. 2011, 13, 3460–3468. [Google Scholar] [CrossRef]
- Esbrí, J.M.; Higueras, P.; Martínez-Coronado, A.; Naharro, R. 4D dispersion of total gaseous mercury derived from a mining source: Identification of criteria to assess risks related to high concentrations of atmospheric mercury. Atmos. Chem. Phys. 2020, 20, 12995–13010. [Google Scholar] [CrossRef]
- Kim, K.-H.; Kabir, E.; Jahan, S.A. A Review on the Distribution of Hg in the Environment and Its Human Health Impacts. J. Hazard. Mater. 2016, 306, 376–385. [Google Scholar] [CrossRef]
- Wu, Z.; Zhang, L.; Xia, T.; Jia, X.; Wang, S. Heavy Metal Pollution and Human Health Risk Assessment at Mercury Smelting Sites in Wanshan District of Guizhou Province, China. RSC Adv. 2020, 10, 23066–23079. [Google Scholar] [CrossRef]
- Phelps, R.W.; Clarkson, T.W.; Kershaw, T.G.; Wheatley, B. Interrelationships of Blood and Hair Mercury Concentrations in a North American Population Exposed to Methylmercury. Arch. Environ. Health 1980, 35, 161–168. [Google Scholar] [CrossRef] [PubMed]
- Koenigsmark, F.; Weinhouse, C.; Berky, A.J.; Morales, A.M.; Ortiz, E.J.; Pierce, E.M.; Pan, W.K.; Hsu-Kim, H. Efficacy of Hair Total Mercury Content as a Biomarker of Methylmercury Exposure to Communities in the Area of Artisanal and Small-Scale Gold Mining in Madre de Dios, Peru. Int. J. Environ. Res. Public Health 2021, 18, 13350. [Google Scholar] [CrossRef] [PubMed]
- González-Valoys, A.C.; Esbrí, J.M.; Campos, J.A.; Arrocha, J.; García-Noguero, E.M.; Monteza-Destro, T.; Martínez, E.; Jiménez-Ballesta, R.; Gutiérrez, E.; Vargas-Lombardo, M. Ecological and Health Risk Assessments of an Abandoned Gold Mine (Remance, Panama): Complex Scenarios Need a Combination of Indices. Int. J. Environ. Res. Public Health 2021, 18, 9369. [Google Scholar] [CrossRef] [PubMed]
- Wcisło, E.; Bronder, J.; Bubak, A.; Rodríguez-Valdés, E.; Gallego, J.L.R. Human Health Risk Assessment in Restoring Safe and Productive Use of Abandoned Contaminated Sites. Environ. Int. 2016, 94, 436–448. [Google Scholar] [CrossRef] [PubMed]
- Rodríguez, R.; Garcia-Gonzalez, H.; Pastrana, Á.; Hernández, Z. Health and Safety Protocol for the Management of Building Demolition Waste with High Mercury Contamination. Buildings 2023, 13, 1310. [Google Scholar] [CrossRef]
- Khalid, S.; Shahid, M.; Niazi, N.K.; Murtaza, B.; Bibi, I.; Dumat, C. A comparison of technologies for remediation of heavy metal contaminated soils. J. Geochem. Explor. 2016, 182, 247–268. [Google Scholar] [CrossRef]
- Song, B.; Zeng, G.; Gong, J.; Liang, J.; Xu, P.; Liu, Z.; Zhang, Y.; Zhang, C.; Cheng, M.; Liu, Y.; et al. Evaluation methods for assessing effectiveness of in situ remediation of soil and sediment contaminated with organic pollutants and heavy metals. Environ. Int. 2017, 105, 43–55. [Google Scholar] [CrossRef]
- Liu, L.; Li, W.; Song, W.; Guo, M. Remediation techniques for heavy metal-contaminated soils: Principles and applicability. Sci. Total Environ. 2018, 633, 206–219. [Google Scholar] [CrossRef]
- Souza, L.R.R.; Pomarolli, L.C.; da Veiga, M.A.M.S. From classic methodologies to application of nanomaterials for soil remediation: An integrated view of methods for decontamination of toxic metal(oid)s. Environ. Sci. Pollut. Res. 2020, 27, 10205–10227. [Google Scholar] [CrossRef]
- Sinnett, D.; Bray, I.; Baranyi, G.; Braubach, M.; Netanyanhu, S. Systematic Review of the Health and Equity Impacts of Remediation and Redevelopment of Contaminated Sites. Int. J. Environ. Res. Public Health 2022, 19, 5278. [Google Scholar] [CrossRef]
- Xu, Q.; Wu, B.; Chai, X. In Situ Remediation Technology for Heavy Metal contaminated Sediment: A Review. Int. J. Environ. Res. Public Health 2022, 19, 16767. [Google Scholar] [CrossRef] [PubMed]
- Fantozzi, L.; Ferrara, R.; Dini, N.; Tamburello, L.; Pirrone, N.; Sprovieri, F. Study on the reduction of atmospheric mercury emissions from mine waste enriched soils through native Grass cover in the Mt. Amiata region of Italy. Environ. Res. 2013, 125, 69–74. [Google Scholar] [CrossRef] [PubMed]
- Floreani, F.; Zappella, V.; Faganeli, J.; Covelli, S. Gaseous mercury evasion from bare and grass-covered soils contaminated by mining and ore roasting (Isonzo River alluvial plain, Northeastern Italy). Environ. Pollut. 2023, 318, 120921. [Google Scholar] [CrossRef] [PubMed]
- Sánchez-Castro, I.; Molina, L.; Prieto-Fernández, M.A.; Segura, A. Past, present and future trends in the remediation of heavy-metal contaminated soil—Remediation techniques applied in real soil-contamination events. Heliyon 2023, 9, 16692. [Google Scholar] [CrossRef] [PubMed]
- Dhaliwal, S.S.; Singh, J.; Taneja, P.K.; Mandal, A. Remediation techniques for removal of heavy metals from the soil contaminated through different sources: A review. Environ. Sci. Pollut. Res. 2020, 27, 1319–1333. [Google Scholar] [CrossRef] [PubMed]
- Kelly, C.; Peltz, C.; Stanton, M.; Rutherford, D.; Rostad, C. Biochar application to hardrock mine tailings: Soil quality, microbial activity, and toxic element sorption. Appl. Geochem. 2014, 43, 35–48. [Google Scholar] [CrossRef]
- Touceda-González, M.; Álvarez-López, V.; Prieto-Fernández, A.; Rodríguez-Garrido, B.; Trasar-Cepeda, C.; Mench, M.; Puschenreiter, M.; Quintela-Sabarís, C.; Macías-García, F.; Kidd, P.S. Aided phytostabilisation reduces metal toxicity, improves soil fertility and enhances microbial activity in Cu-rich mine tailings. J. Environ. Manag. 2017, 186, 301–313. [Google Scholar] [CrossRef] [PubMed]
- Parameswaran, K. Sustainability Initiatives at ASARCO LLC: Global Challenges, Consequences, and Prospects; John Wiley & Sons: Hoboken, NJ, USA, 2016; pp. 424–452. [Google Scholar] [CrossRef]
- Parameswaran, K. Sustainability considerations in innovative process development. In Innovative Process Development in Metallurgical Industry; Springer: Berlin/Heidelberg, Germany, 2016; pp. 257–280. [Google Scholar]
- Santibánez, C.; Verdugo, C.; Ginocchio, R. Phytostabilization of copper mine tailings with biosolids: Implications for metal uptake and productivity of Lolium perenne. Sci. Total Environ. 2008, 395, 1–10. [Google Scholar] [CrossRef]
- García-González, H.; García-Ordiales, E.; Rodríguez, R. Analysis of the airborne mercury and particulate arsenic levels close to an abandoned waste dump and buildings of a mercury mine and the potential risk of atmospheric pollution. SN Appl. Sci. 2022, 4, 76. [Google Scholar] [CrossRef]
- Rodríguez, R.; Garcia-Gonzalez, H.; García-Ordiales, E. Empirical Model of Gaseous Mercury Emissions for the Analysis of Working Conditions in Outdoor Highly Contaminated Sites. Sustainability 2022, 14, 13951. [Google Scholar] [CrossRef]
- Rodríguez, R.; Fernández, B.; Malagón, B.; Garcia-Ordiales, E. Chemical-Physical Model of Gaseous Mercury Emissions from the Demolition Waste of an Abandoned Mercury Metallurgical Plant. Appl. Sci. 2023, 13, 3149. [Google Scholar] [CrossRef]
- Fernández-Martínez, R.; Loredo, J.; Ordóñez, A.; Rucandio, I. Mercury availability by operationally defined fractionation in granulometric distributions of soils and mine wastes from an abandoned cinnabar mine. Environ. Sci. Process. Impacts 2014, 16, 1069–1075. [Google Scholar] [CrossRef] [PubMed]
- Pozo El Terronal (Mieres-Asturias) a Vista de Dron; Ax1 Ahora: El Terronal, Asturias. 2022. Available online: https://www.youtube.com/watch?v=jpjVMXrdAU4 (accessed on 31 July 2023).
- Loredo, J.; Ordóñez, A.; Álvarez, R. Environmental impact of toxic metals and metalloids from the Muñón-Cimero mercury-mining area (Asturias, Spain). J. Hazard. Mater. 2006, 136, 455–467. [Google Scholar] [CrossRef] [PubMed]
- Mina de La Soterraña (Lena—Asturias) a Vista de Dron; Ax1 Ahora: La Soterraña, Asturias. 2022. Available online: https://www.youtube.com/watch?v=PE0gvoT_QJc (accessed on 31 July 2023).
- Ayala, J.; Fernández, B. Industrial waste materials as adsorbents for the removal of as and other toxic elements from an abandoned mine spoil heap leachate: A case study in Asturias. J. Hazard. Mater. 2020, 384, 121446. [Google Scholar] [CrossRef] [PubMed]
- Hakanson, L. An ecological risk index for aquatic pollution control. A sedimentological approach. Water Res. 1980, 14, 8. [Google Scholar] [CrossRef]
- Müller, G. Index of geoaccumulation in sediments of the Rhine River. Geojournal 1969, 2, 108–118. [Google Scholar]
- Seth, R.; Gupta, S.; Gupta, H. ESG Investing: A Critical Overview. Hans Shodh Sudha 2021, 2, 69–80. [Google Scholar]
- Ehlers, T.; Elsenhuber, U.; Jegarasasingam, A.; Jondeau, E. Deconstructing ESG Scores: How to Invest with Your Own Criteria. In BIS Working Papers; International Monetary Fund: Basel, Switzerland, 2022; pp. 1–48. Available online: https://www.bis.org/publ/work1008.pdf (accessed on 1 May 2023).
- Xiao, X.; Zhang, J.X.; Wang, H.; Han, X.X.; Ma, J.; Ma, Y.; Luan, H.J. Distribution and health risk assessment of potentially toxic elements in soils around coal industrial areas: A global meta-analysis. Sci. Total Environ. 2020, 713, 135292. [Google Scholar] [CrossRef]
- Chai, Y.; Guo, F. Potentially Toxic Element Contamination in Soils Affected by the Antimony Mine Spill in Northwest China. Toxics 2023, 11, 359. [Google Scholar] [CrossRef]
- Boente, C.; Baragaño, D.; García-González, N.; Forján, R.; Colina, A.; Gallego, J.R. A holistic methodology to study geochemical and geomorphological control of the distribution of potentially toxic elements in soil. Catena 2022, 208, 105730. [Google Scholar] [CrossRef]
- López, J.M.; Sánchez, J. Consumo de Energía y Emisiones Asociadas al Transporte por Coche y Camión; Grupo Gestor del Proyecto EnerTrans: Madrid, Spain, 2008; ISBN 978-84-89649-45-3. [Google Scholar]
- Shillaber, C.; Mitchell, J.; Dove, J. Energy and Carbon Assessment of Ground Improvement Works. I: Definitions and Background. J. Geotech. Geoenviron. Eng. 2016, 142, 04015083. [Google Scholar] [CrossRef]
- Rodrigo, D. Huella de Carbono de una geomembrana alvatech pead vs capa tradicional de arcilla. In Versos, Vertederos y Sostenibilidad; Grupo Armando Álvarez: Bilbao, Spain, 2018. [Google Scholar]
- Rodriguez, R.; Fernández, P.; Pérez, F.; Malagón, B. Relevance of the concrete used for the support and lining in tunnels excavated through different rockmasses from safety, economic and environmental point of view. In Proceedings of the World Congress on Advances in Structural Engineering and Mechanics, Jeju Island, Republic of Korea, 17–21 September 2019. [Google Scholar]
- Anhefop. Guía Para la Reducción de la Huella de Carbono de la Industria Del Hormigón Preparado; Asociación Nacional Española de Fabricación de Hormigón Preparado (ANEFHOP): Madrid, Spain, 2022; p. 16. [Google Scholar]
- Chen, C.; Habert, G.; Bouzidi, Y.; Jullien, A.; Ventura, A. LCA allocation procedure used as an incitative method for waste recycling: An application to mineral additions in concrete. Resour. Conserv. Recycl. 2010, 54, 1231–1240. [Google Scholar] [CrossRef]
- Seto, K.A.; Churchill, C.J.; Panesar, D.K. Influence of fly ash allocation approaches on the life cycle assessment of cement-based materials. J. Clean. Prod. 2017, 157, 65–75. [Google Scholar] [CrossRef]
- Nisbet, M.A.; Marceau, M.L.; VanGeem, M.G. Environmental Life Cycle Inventory of Portland Cement Concrete; Portland Cement Association: Washington, DC, USA, 2002. [Google Scholar]
- Huntzinger, D.; Eatmon, T. A life-cycle assessment of Portland cement manufacturing: Comparing the traditional process with alternative technologies. J. Clean. Prod. 2009, 17, 668–675. [Google Scholar] [CrossRef]
- Collins, F. Inclusion of carbonation during the life cycle of built and recycled concrete: Influence on their carbon footprint. Int. J. Life Cycle Assess. 2010, 15, 549–556. [Google Scholar] [CrossRef]
- García-Segura, T.; Yepes, V.; Alcalá, J. Life cycle greenhouse gas emissions of blended cement concrete including carbonation and durability. Int. J. Life Cycle Assess. 2014, 19, 3–12. [Google Scholar] [CrossRef]
- Babbitt, C.W.; Lindner, A.S. A life cycle comparison of disposal and beneficial use of coal combustion products in Florida. Part 1: Methodology and inventory of materials, energy and emissions. Int. J. Life Cycle Assess. 2008, 13, 202–211. [Google Scholar] [CrossRef]
- Sjunnesson, J. Life Cycle Assessment of Concrete; Lund University: Lund, Sweden, 2005. [Google Scholar]
- Latawiec, R.; Woyciechowski, P.; Kowalski, J. Sustainable Concrete Performance—CO2-Emission. Environments 2022, 5, 27. [Google Scholar] [CrossRef]
| Disclaimer/Publisher’s Note: The statements, opinions and data contained in all publications are solely those of the individual author(s) and contributor(s) and not of MDPI and/or the editor(s). MDPI and/or the editor(s) disclaim responsibility for any injury to people or property resulting from any ideas, methods, instructions or products referred to in the content. |
© 2023 by the authors. Licensee MDPI, Basel, Switzerland. This article is an open access article distributed under the terms and conditions of the Creative Commons Attribution (CC BY) license (https://creativecommons.org/licenses/by/4.0/).


