
Optimization of Pyrolysis Parameters by Design of Experiment for the Production of Biochar from Sewage Sludge

 ,
,  ,
,  , ,
, ,
Abstract
1. Introduction
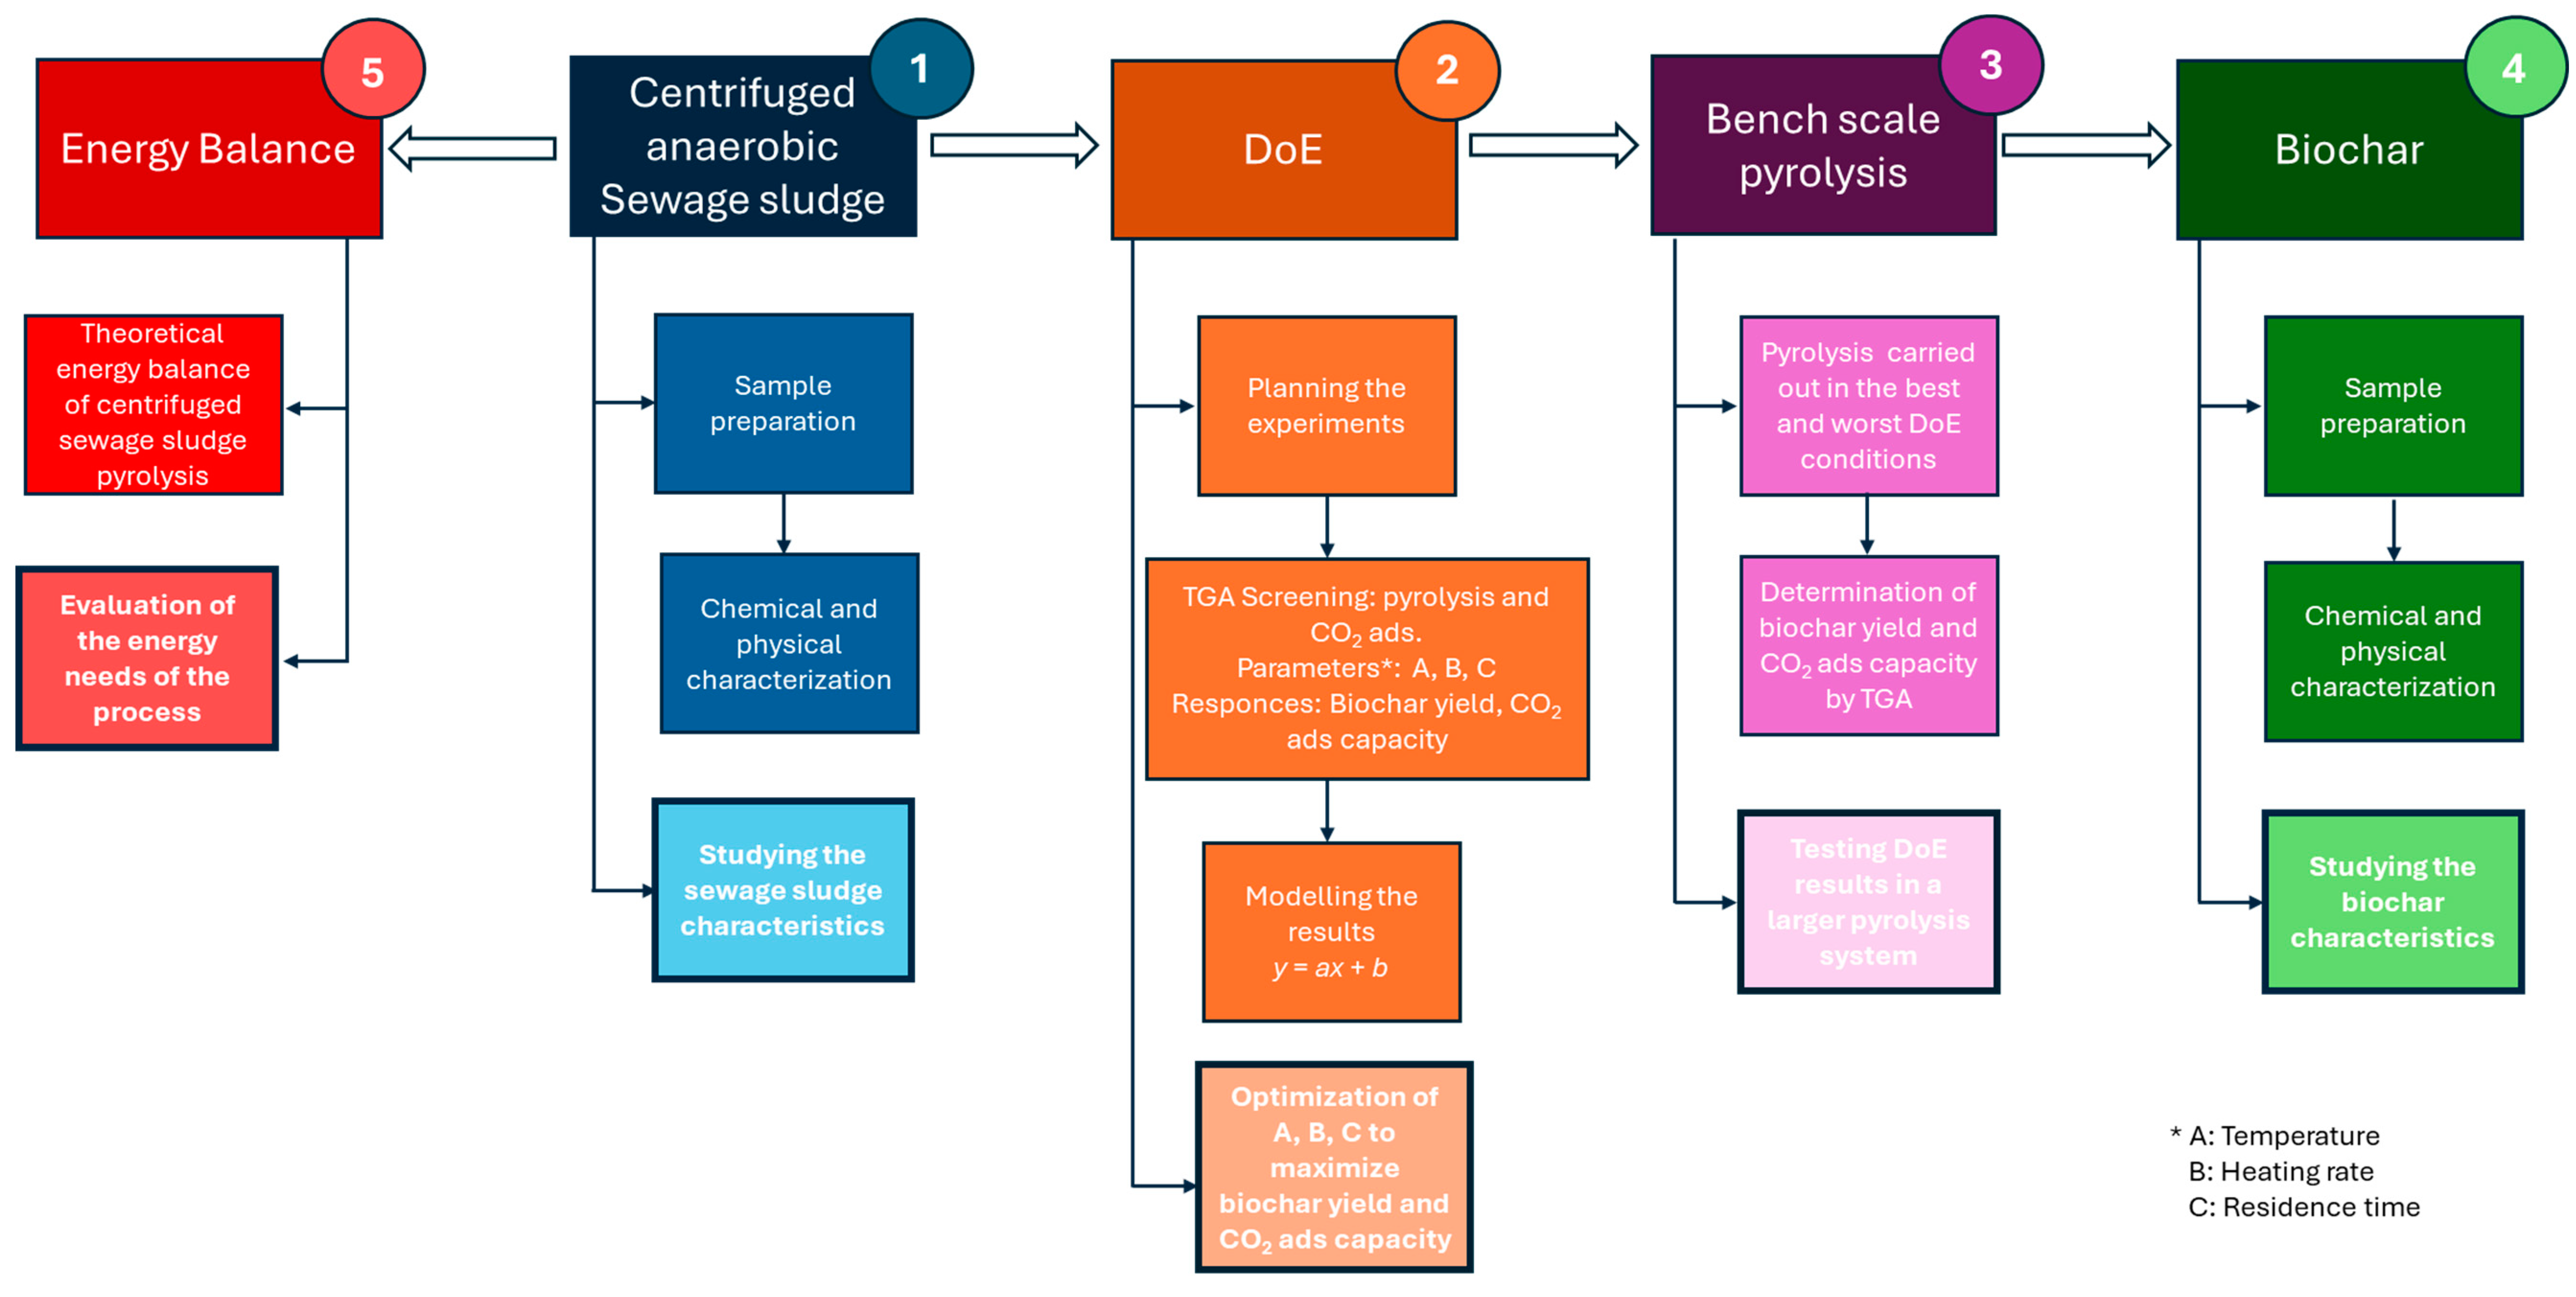
2. Materials and Methods
2.1. Sample Characterization
2.2. Pyrolysis and CO2 Adsorption Experiments through TGA
2.3. Pyrolysis through a Bench Scale Semi-Batch Reactor
3. Results and Discussion
3.1. Sewage Sludge Characterization
3.2. Optimization of Design Parameters for Biochar Production
3.3. Biochar Produced by a Semi-Batch Bench Scale Reactor
3.4. Theoretical Energy Balance
4. Conclusions
Supplementary Materials
Author Contributions
Funding
Data Availability Statement
Conflicts of Interest
References
- Bagheri, M.; Bauer, T.; Burgman, L.E.; Wetterlund, E. Fifty years of sewage sludge management research: Mapping researchers’ motivations and concerns. J. Environ. Manag. 2023, 325, 116412. [Google Scholar] [CrossRef] [PubMed]
- European Commission. A New Circular Economy Action Plan. Available online: https://www.un.org/sustainabledevelopment/sustainable-consumption-production/ (accessed on 16 September 2024).
- European Commission. Bioeconomy: The European Way to Use Our Natural Resources: Action Plan 2018; European Commission, Directorate-General for Research and Innovation: Brussels, Belgium, 2018. [Google Scholar] [CrossRef]
- European Parliament and the Council. Regulation (EU) 2019/1009 of 5 June 2019 Laying Down Rules on the Making Available on the Market of EU Fertilising Products and Amending Regulations (EC) No 1069/2009 and (EC) No 1107/2009 and Repealing Regulation (EC) No 2003/2003. Available online: https://eur-lex.europa.eu/eli/reg/2019/1009/oj (accessed on 16 September 2024).
- European Commission. Farm to Fork Strategy for a Fair, Healthy and Environmentally-Friendly Food System. Available online: https://food.ec.europa.eu/horizontal-topics/farm-fork-strategy_en (accessed on 16 September 2024).
- European Commission. Biodiversity Strategy for 2030 Bringing Nature Back into Our Lives. Available online: https://ec.europa.eu/research/environment/index.cfm?pg=nbs (accessed on 16 September 2024).
- European Commission. EU Soil Strategy for 2030 Reaping the Benefits of Healthy Soils for People, Food, Nature and Climate. Available online: https://www.eea.europa.eu/data-and-maps/dashboards/land-take-statistics#tab-based-on-data (accessed on 16 September 2024).
- European Commission. Strategic Plan 2020–2024 DG Climate Action. European Commission 2020. Available online: https://commission.europa.eu/publications/strategic-plan-2020-2024-climate-action_en (accessed on 16 September 2024).
- Eurostat. Sewage Sludge Production and Disposal from Urban Wastewater. Available online: https://ec.europa.eu/eurostat/databrowser/view/ten00030/default/table?lang=en (accessed on 12 June 2024).
- ISPRA. Rapporto Rifiuti Speciali; ISPRA: Rome, Italy, 2021; ISBN 978-88-448-1052-8. [Google Scholar]
- European Commission. The Commission Decides to Refer ITALY to the Court of Justice of the European Union for Failure to Fully Comply with the Urban Wastewater Treatment Directive. Available online: https://ec.europa.eu/commission/presscorner/detail/en/ip_24_1234 (accessed on 18 June 2024).
- Volpi, M.P.C.; Silva, J.C.G.; Hornung, A.; Ouadi, M. Review of the Current State of Pyrolysis and Biochar Utilization in Europe: A Scientific Perspective. Clean Technol. 2024, 6, 152–175. [Google Scholar] [CrossRef]
- Nakao, S.; Yogo, K.; Goto, K.; Kai, T.; Yamada, H. Advanced CO2 Capture Technologies; Springer International Publishing: Cham, Switzerland, 2019. [Google Scholar] [CrossRef]
- Karimi, M.; Shirzad, M.; Silva, J.A.C.; Rodrigues, A.E. Biomass/Biochar carbon materials for CO2 capture and sequestration by cyclic adsorption processes: A review and prospects for future directions. J. CO2 Util. 2022, 57, 101890. [Google Scholar] [CrossRef]
- Ozkan, M.; Akhavi, A.A.; Coley, W.C.; Shang, R.; Ma, Y. Progress in carbon dioxide capture materials for deep decarbonization. Chem 2022, 8, 141–173. [Google Scholar] [CrossRef]
- Sharma, A.K.; Ghodke, P.K.; Chen, W.H. Progress in green adsorbent technologies from sewage sludge for wastewater remediation and carbon capture: A sustainable approach towards clean environment. Curr. Opin. Green Sustain. Chem. 2024, 46, 100883. [Google Scholar] [CrossRef]
- Leng, L.; Xiong, Q.; Yang, L.; Li, H.; Zhou, Y.; Zhang, W.; Jiang, S.; Li, H.; Huang, H. An overview on engineering the surface area and porosity of biochar. Sci. Total. Environ. 2021, 763, 144204. [Google Scholar] [CrossRef]
- Dissanayake, P.D.; Choi, S.W.; Igalavithana, A.D.; Yang, X.; Tsang, D.C.; Wang, C.-H.; Kua, H.W.; Lee, K.B.; Ok, Y.S. Sustainable gasification biochar as a high efficiency adsorbent for CO2 capture: A facile method to designer biochar fabrication. Renew. Sustain. Energy Rev. 2020, 124, 109785. [Google Scholar] [CrossRef]
- Yadav, K.; Jagadevan, S. Influence of Process Parameters on Synthesis of Biochar by Pyrolysis of Biomass: An Alternative Source of Energy. In Recent Advances in Pyrolysis; IntechOpen: London, UK, 2020. [Google Scholar] [CrossRef]
- Pelagalli, V.; Langone, M.; Matassa, S.; Race, M.; Tuffi, R.; Papirio, S.; Lens, P.N.L.; Lazzazzara, M.; Frugis, A.; Pettag, L.; et al. Pyrolysis of municipal sewage sludge: Challenges, opportunities and new valorization routes for biochar, bio-oil, and pyrolysis gas. Environ. Sci. Water Res. Technol. 2024. [Google Scholar] [CrossRef]
- Demirbas, A. Effects of temperature and particle size on bio-char yield from pyrolysis of agricultural residues. J. Anal. Appl. Pyrolysis 2004, 72, 243–248. [Google Scholar] [CrossRef]
- Angin, D. Effect of pyrolysis temperature and heating rate on biochar obtained from pyrolysis of safflower seed press cake. Bioresour. Technol. 2013, 128, 593–597. [Google Scholar] [CrossRef]
- Verrecchia, G.; Cafiero, L.; de Caprariis, B.; Dell'Era, A.; Pettiti, I.; Tuffi, R.; Scarsella, M. Study of the parameters of zeolites synthesis from coal fly ash in order to optimize their CO2 adsorption. Fuel 2020, 276, 118041. [Google Scholar] [CrossRef]
- Kaur, L.; Singh, J.; Ashok, A.; Kumar, V. Design expert based optimization of the pyrolysis process for the production of cattle dung bio-oil and properties characterization. Sci. Rep. 2024, 14, 9421. [Google Scholar] [CrossRef]
- Cha, J.S.; Park, S.H.; Jung, S.-C.; Ryu, C.; Jeon, J.-K.; Shin, M.-C.; Park, Y.-K. Production and utilization of biochar: A review. J. Ind. Eng. Chem. 2016, 40, 1–15. [Google Scholar] [CrossRef]
- Agrafioti, E.; Bouras, G.; Kalderis, D.; Diamadopoulos, E. Biochar production by sewage sludge pyrolysis. J. Anal. Appl. Pyrolysis 2013, 101, 72–78. [Google Scholar] [CrossRef]
- Inguanzo, M.; Domínguez, A.; Menéndez, J.A.; Blanco, C.G.; Pis, J.J. On the Pyrolysis of Sewage Sludge: The Influence of Pyrolysis Conditions on Solid, Liquid and Gas Fractions. J. Anal. Appl. Pyrolysis 2002, 63, 209–222. [Google Scholar] [CrossRef]
- Hu, M.; Hu, H.; Ye, Z.; Tan, S.; Yin, K.; Chen, Z.; Guo, D.; Rong, H.; Wang, J.; Pan, Z.; et al. A review on turning sewage sludge to value-added energy and materials via thermochemical conversion towards carbon neutrality. J. Clean. Prod. 2022, 379, 134657. [Google Scholar] [CrossRef]
- Cafiero, L.; Fabbri, D.; Trinca, E.; Tuffi, R.; Ciprioti, S.V. Thermal and spectroscopic (TG/DSC-FTIR) characterization of mixed plastics for materials and energy recovery under pyrolytic conditions. J. Therm. Anal. Calorim. 2015, 121, 1111–1119. [Google Scholar] [CrossRef]
- Huang, H.J.; Yuan, X.Z. The migration and transformation behaviors of heavy metals during the hydrothermal treatment of sewage sludge. Bioresour. Technol. 2016, 200, 991–998. [Google Scholar] [CrossRef]
- Zhao, C.; Hong, C.; Hu, J.; Xing, Y.; Ling, W.; Zhang, B.; Wang, Y.; Feng, L. Upgrading technologies and catalytic mechanisms for heteroatomic compounds from bio-oil—A review. Fuel 2023, 333, 126388. [Google Scholar] [CrossRef]
- Esposito, L.; Cafiero, L.; De Angelis, D.; Tuffi, R.; Ciprioti, S.V. Valorization of the plastic residue from a WEEE treatment plant by pyrolysis. Waste Manag. 2020, 112, 1–10. [Google Scholar] [CrossRef]
- Gao, N.; Li, J.; Qi, B.; Li, A.; Duan, Y.; Wang, Z. Thermal analysis and products distribution of dried sewage sludge pyrolysis. J. Anal. Appl. Pyrolysis 2014, 105, 43–48. [Google Scholar] [CrossRef]
- Hu, M.; Ye, Z.; Zhang, H.; Chen, B.; Pan, Z.; Wang, J. Thermochemical conversion of sewage sludge for energy and resource recovery: Technical challenges and prospects. Environ. Pollut. Bioavailab. 2021, 33, 145–163. [Google Scholar] [CrossRef]
- Kan, T.; Grierson, S.; De Nys, R.; Strezov, V. Comparative assessment of the thermochemical conversion of freshwater and marine micro- and macroalgae. Energy Fuels 2014, 28, 104–114. [Google Scholar] [CrossRef]
- Magdziarz, A.; Werle, S. Analysis of the combustion and pyrolysis of dried sewage sludge by TGA and MS. Waste Manag. 2014, 34, 174–179. [Google Scholar] [CrossRef] [PubMed]
- Liu, C.; Wu, Y.; Lan, G.; Ji, X.; Xia, Y.; Fu, C.; Shen, J.; Gui, J.; Liu, Y.; Qu, Y.; et al. CO2 capture performance of biochar prepared from sewage sludge after conditioning with different dewatering agents. J. Environ. Chem. Eng. 2022, 10, 108318. [Google Scholar] [CrossRef]
- Xu, X.; Kan, Y.; Zhao, L.; Cao, X. Chemical transformation of CO2 during its capture by waste biomass derived biochars. Environ. Pollut. 2016, 213, 533–540. [Google Scholar] [CrossRef]
- Samanta, A.; Zhao, A.; Shimizu, G.K.H.; Sarkar, P.; Gupta, R. Post-Combustion CO2 Capture Using Solid Sorbents: A Review. Ind. Eng. Chem. Res. 2012, 51, 1438–1463. [Google Scholar] [CrossRef]
- Fonts, I.; Azuara, M.; Gea, G.; Murillo, M.B. Study of the pyrolysis liquids obtained from different sewage sludge. J. Anal. Appl. Pyrolysis 2009, 85, 184–191. [Google Scholar] [CrossRef]
- Hossain, M.K.; Strezov, V.; Nelson, P.F. Thermal characterisation of the products of wastewater sludge pyrolysis. J. Anal. Appl. Pyrolysis 2009, 85, 442–446. [Google Scholar] [CrossRef]
- Lu, G.Q.; Low, J.C.F.; Liu, C.Y.; Lua, A.C. Surface area development of sewage sludge during pyrolysis. Fuel 1995, 74, 344–348. [Google Scholar] [CrossRef]
- Anuar Sharuddin, S.D.; Abnisa, F.; Wan Daud, W.M.A.; Aroua, M.K. A review on pyrolysis of plastic wastes. Energy Convers. Manag. 2016, 115, 308–326. [Google Scholar] [CrossRef]
- Ghodke, P.K.; Sharma, A.K.; Pandey, J.K.; Chen, W.H.; Patel, A.; Ashokkumar, V. Pyrolysis of sewage sludge for sustainable biofuels and value-added biochar production. J. Environ. Manag. 2021, 298, 113450. [Google Scholar] [CrossRef]
- Hossain, M.K.; Vladimir, V.S.; Chan, K.Y.; Ziolkowski, A.; Nelson, P.F. Influence of pyrolysis temperature on production and nutrient properties of wastewater sludge biochar. J. Environ. Manag. 2011, 92, 223–228. [Google Scholar] [CrossRef] [PubMed]
- Gao, N.; Quan, C.; Liu, B.; Li, Z.; Wu, C.; Li, A. Continuous Pyrolysis of Sewage Sludge in a Screw-Feeding Reactor: Products Characterization and Ecological Risk Assessment of Heavy Metals. Energy Fuels 2017, 31, 5063–5072. [Google Scholar] [CrossRef]
- Encinar, J.M.; González, J.F. Pyrolysis of synthetic polymers and plastic wastes. Kinetic study. Fuel Process. Technol. 2008, 89, 678–686. [Google Scholar] [CrossRef]
- Sing, K.S.W.; Everett, D.H.; Haul, R.A.W.; Moscou, L.; Pierotti, R.A.; Rouquerol, J.; Siemieniewska, T. Reporting physisorption data for gas/solid systems with special reference to the determination of surface area and porosity (Recommendations 1984). Pure Appl. Chem. 1985, 57, 603. [Google Scholar] [CrossRef]
- Mamaghani, Z.G.; Hawboldt, K.A.; MacQuarrie, S. Adsorption of CO2 using biochar—Review of the impact of gas mixtures and water on adsorption. J. Environ. Chem. Eng. 2023, 11, 109643. [Google Scholar] [CrossRef]
- Zhang, Z.; Zhou, J.; Xing, W.; Xue, Q.; Yan, Z.; Zhuo, S.; Qiao, S.Z. Critical role of small micropores in high CO2 uptake. Phys. Chem. Chem. Phys. 2013, 15, 2523. [Google Scholar] [CrossRef] [PubMed]
- Zhang, C.; Ji, Y.; Li, C.; Zhang, Y.; Sun, S.; Xu, Y.; Jiang, L.; Wu, C. The Application of Biochar for CO2 Capture: Influence of Biochar Preparation and CO2 Capture Reactors. Ind. Eng. Chem. Res. 2023, 62, 17168–17181. [Google Scholar] [CrossRef]
- Arlabosse, P.; Chavez, S.; Prevot, C. Drying of Municipal Sewage Sludge: From a Laboratory Scale Batch Indirect Dryer to the Paddle Dryer. Braz. J. Chem. Eng. 2005, 22, 227–232. [Google Scholar] [CrossRef]
- Hou, J.; Hong, C.; Ling, W.; Hu, J.; Feng, W.; Xing, Y.; Wang, Y.; Zhao, C.; Feng, L. Research progress in improving sludge dewaterability: Sludge characteristics, chemical conditioning and influencing factors. J. Environ. Manag. 2024, 351, 119863. [Google Scholar] [CrossRef] [PubMed]
- Lee, N.Y.; You, M.Y.; Lee, J.; Kim, S.; Song, P.K. Performance of Insoluble IrO2 Anode for Sewage Sludge Cake Electrodehydration Application with Respect to Operation Conditions. Coatings 2022, 12, 724. [Google Scholar] [CrossRef]
- Ardila, M.A.A.; de Souza, S.T.; da Silva, J.L.; Valentin, C.A.; Dantas, A.D.B. Geotextile tube dewatering performance assessment: An experimental study of sludge dewatering generated at a water treatment plant. Sustainability 2020, 12, 8129. [Google Scholar] [CrossRef]
- Jangde, P.K.; Singh, A.; Arjunan, T.V. Efficient solar drying techniques: A review. Environ. Sci. Pollut. Res. 2022, 29, 50970–50983. [Google Scholar] [CrossRef] [PubMed]


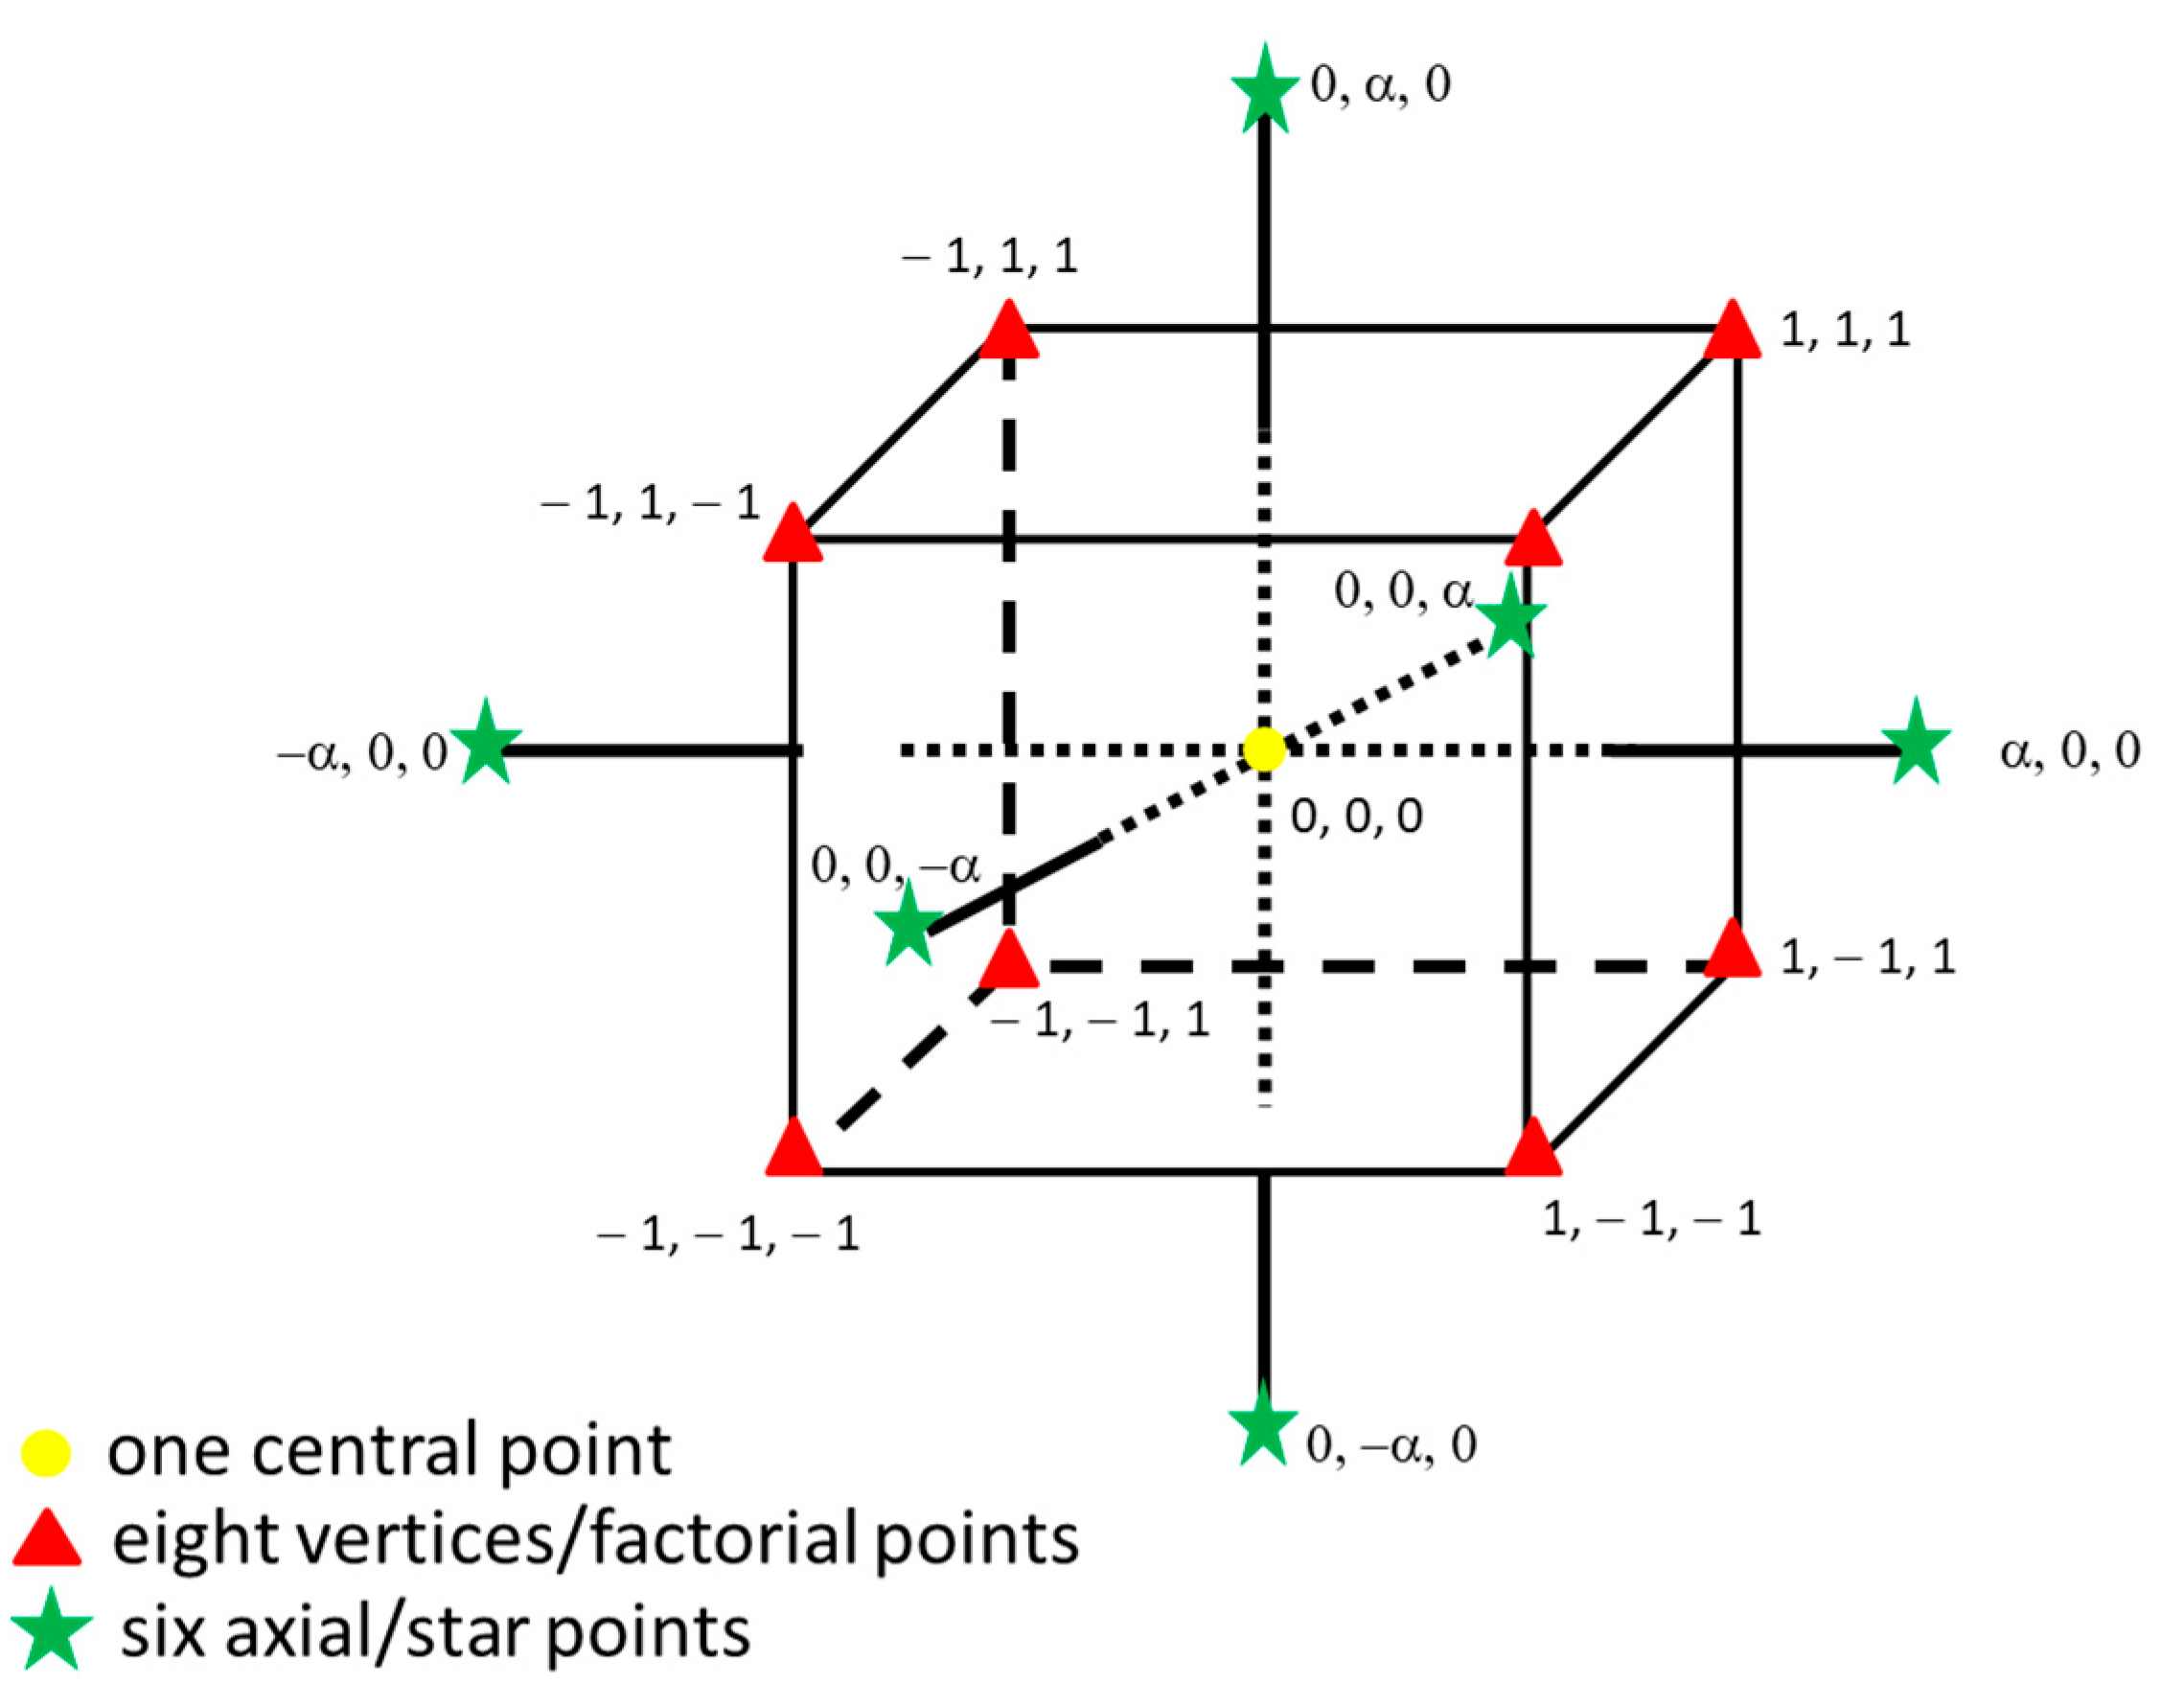
| Factor | Parameter | Unit of Measure * | −α | +α | −1 | +1 | 0 |
|---|---|---|---|---|---|---|---|
| A | Temperature | °C | 450.00 | 650.00 | 490.54 | 609.46 | 550.00 |
| B | Heating rate | °C/min | 5.00 | 50.00 | 14.12 | 40.88 | 27.50 |
| C | Residence time | min | 30.00 | 180.00 | 60.41 | 149.60 | 105.00 |
| Run | Factor A (°C) * | Factor B (°C/min) * | Factor C (min) * |
|---|---|---|---|
| 1 | 550.00 | 27.50 | 105.00 |
| 2 | 490.54 | 14.12 | 149.60 |
| 3 | 490.54 | 40.88 | 60.41 |
| 4 | 450.00 | 27.50 | 105.00 |
| 5 | 550.00 | 50.00 | 105.00 |
| 6 | 550.00 | 27.50 | 30.00 |
| 7 | 550.00 | 27.50 | 180.00 |
| 8 | 490.54 | 14.12 | 60.41 |
| 9 | 550.00 | 27.50 | 105.00 |
| 10 | 490.54 | 40.88 | 149.60 |
| 11 | 550.00 | 5.00 | 105.00 |
| 12 | 650.00 | 27.50 | 105.00 |
| 13 | 550.00 | 27.50 | 105.00 |
| 14 | 609.46 | 14.12 | 60.41 |
| 15 | 550.00 | 27.50 | 105.00 |
| 16 | 609.46 | 14.12 | 149.60 |
| 17 | 609.46 | 40.88 | 149.60 |
| 18 | 550.00 | 27.50 | 105.00 |
| 19 | 550.00 | 27.50 | 105.00 |
| 20 | 609.46 | 40.88 | 60.41 |
| Step | Sample | Atmosphere | Temperature Program | |||
|---|---|---|---|---|---|---|
| Ti (°C) | Tf (°C) | β = dT/dt (°C·min−1) | Δt Isotherm (min) | |||
| Pyrolysis | Dried sewage sludge | N2 at 100 mL/min | 25 | Trun i | βrun i | - |
| Trun i | - | Δtrun i | ||||
| Trun i | 25 | 10 | - | |||
| CO2 ads | Biochar | N2 at 20 mL/min | 25 | - | 5 | |
| CO2 at 155 mL/min | 25 | - | 45 | |||
| Moisture (wt%) | Volatile Matter (wt%) | Fixed Carbon (wt%) | Ashes (wt%) | C (wt%) | H (wt%) | N (wt%) | S (wt%) | O * (wt%) | Cl (wt%) | Br (wt%) | HHV (MJ/kg) | |
|---|---|---|---|---|---|---|---|---|---|---|---|---|
| Sewage sludge | 2.4 ± 0.6 | 57.8 ± 0.3 | 10.7 ± 0.1 | 29.2 ± 0.3 | 36 ± 1 | 5.3 ± 0.2 | 5.8 ± 0.2 | 1.1 ± 0.1 | 22.2 | 0.050 ± 0.002 | n.d. | 15.0 ± 0.3 |
| Run | Yield (wt%) | Adsorption Capacity (mol CO2 ads/kg) |
|---|---|---|
| 1 | 44.76 | 0.468 |
| 2 | 46.23 | 0.491 |
| 3 | 46.00 | 0.484 |
| 4 | 47.80 | 0.454 |
| 5 | 43.10 | 0.428 |
| 6 | 46.00 | 0.445 |
| 7 | 43.85 | 0.397 |
| 8 | 46.10 | 0.458 |
| 9 | 44.00 | 0.417 |
| 10 | 46.15 | 0.390 |
| 11 | 46.20 | 0.461 |
| 12 | 40.90 | 0.397 |
| 13 | 44.60 | 0.450 |
| 14 | 44.70 | 0.433 |
| 15 | 44.50 | 0.459 |
| 16 | 42.60 | 0.514 |
| 17 | 38.20 | 0.316 |
| 18 | 44.00 | 0.441 |
| 19 | 44.40 | 0.421 |
| 20 | 43.14 | 0.457 |
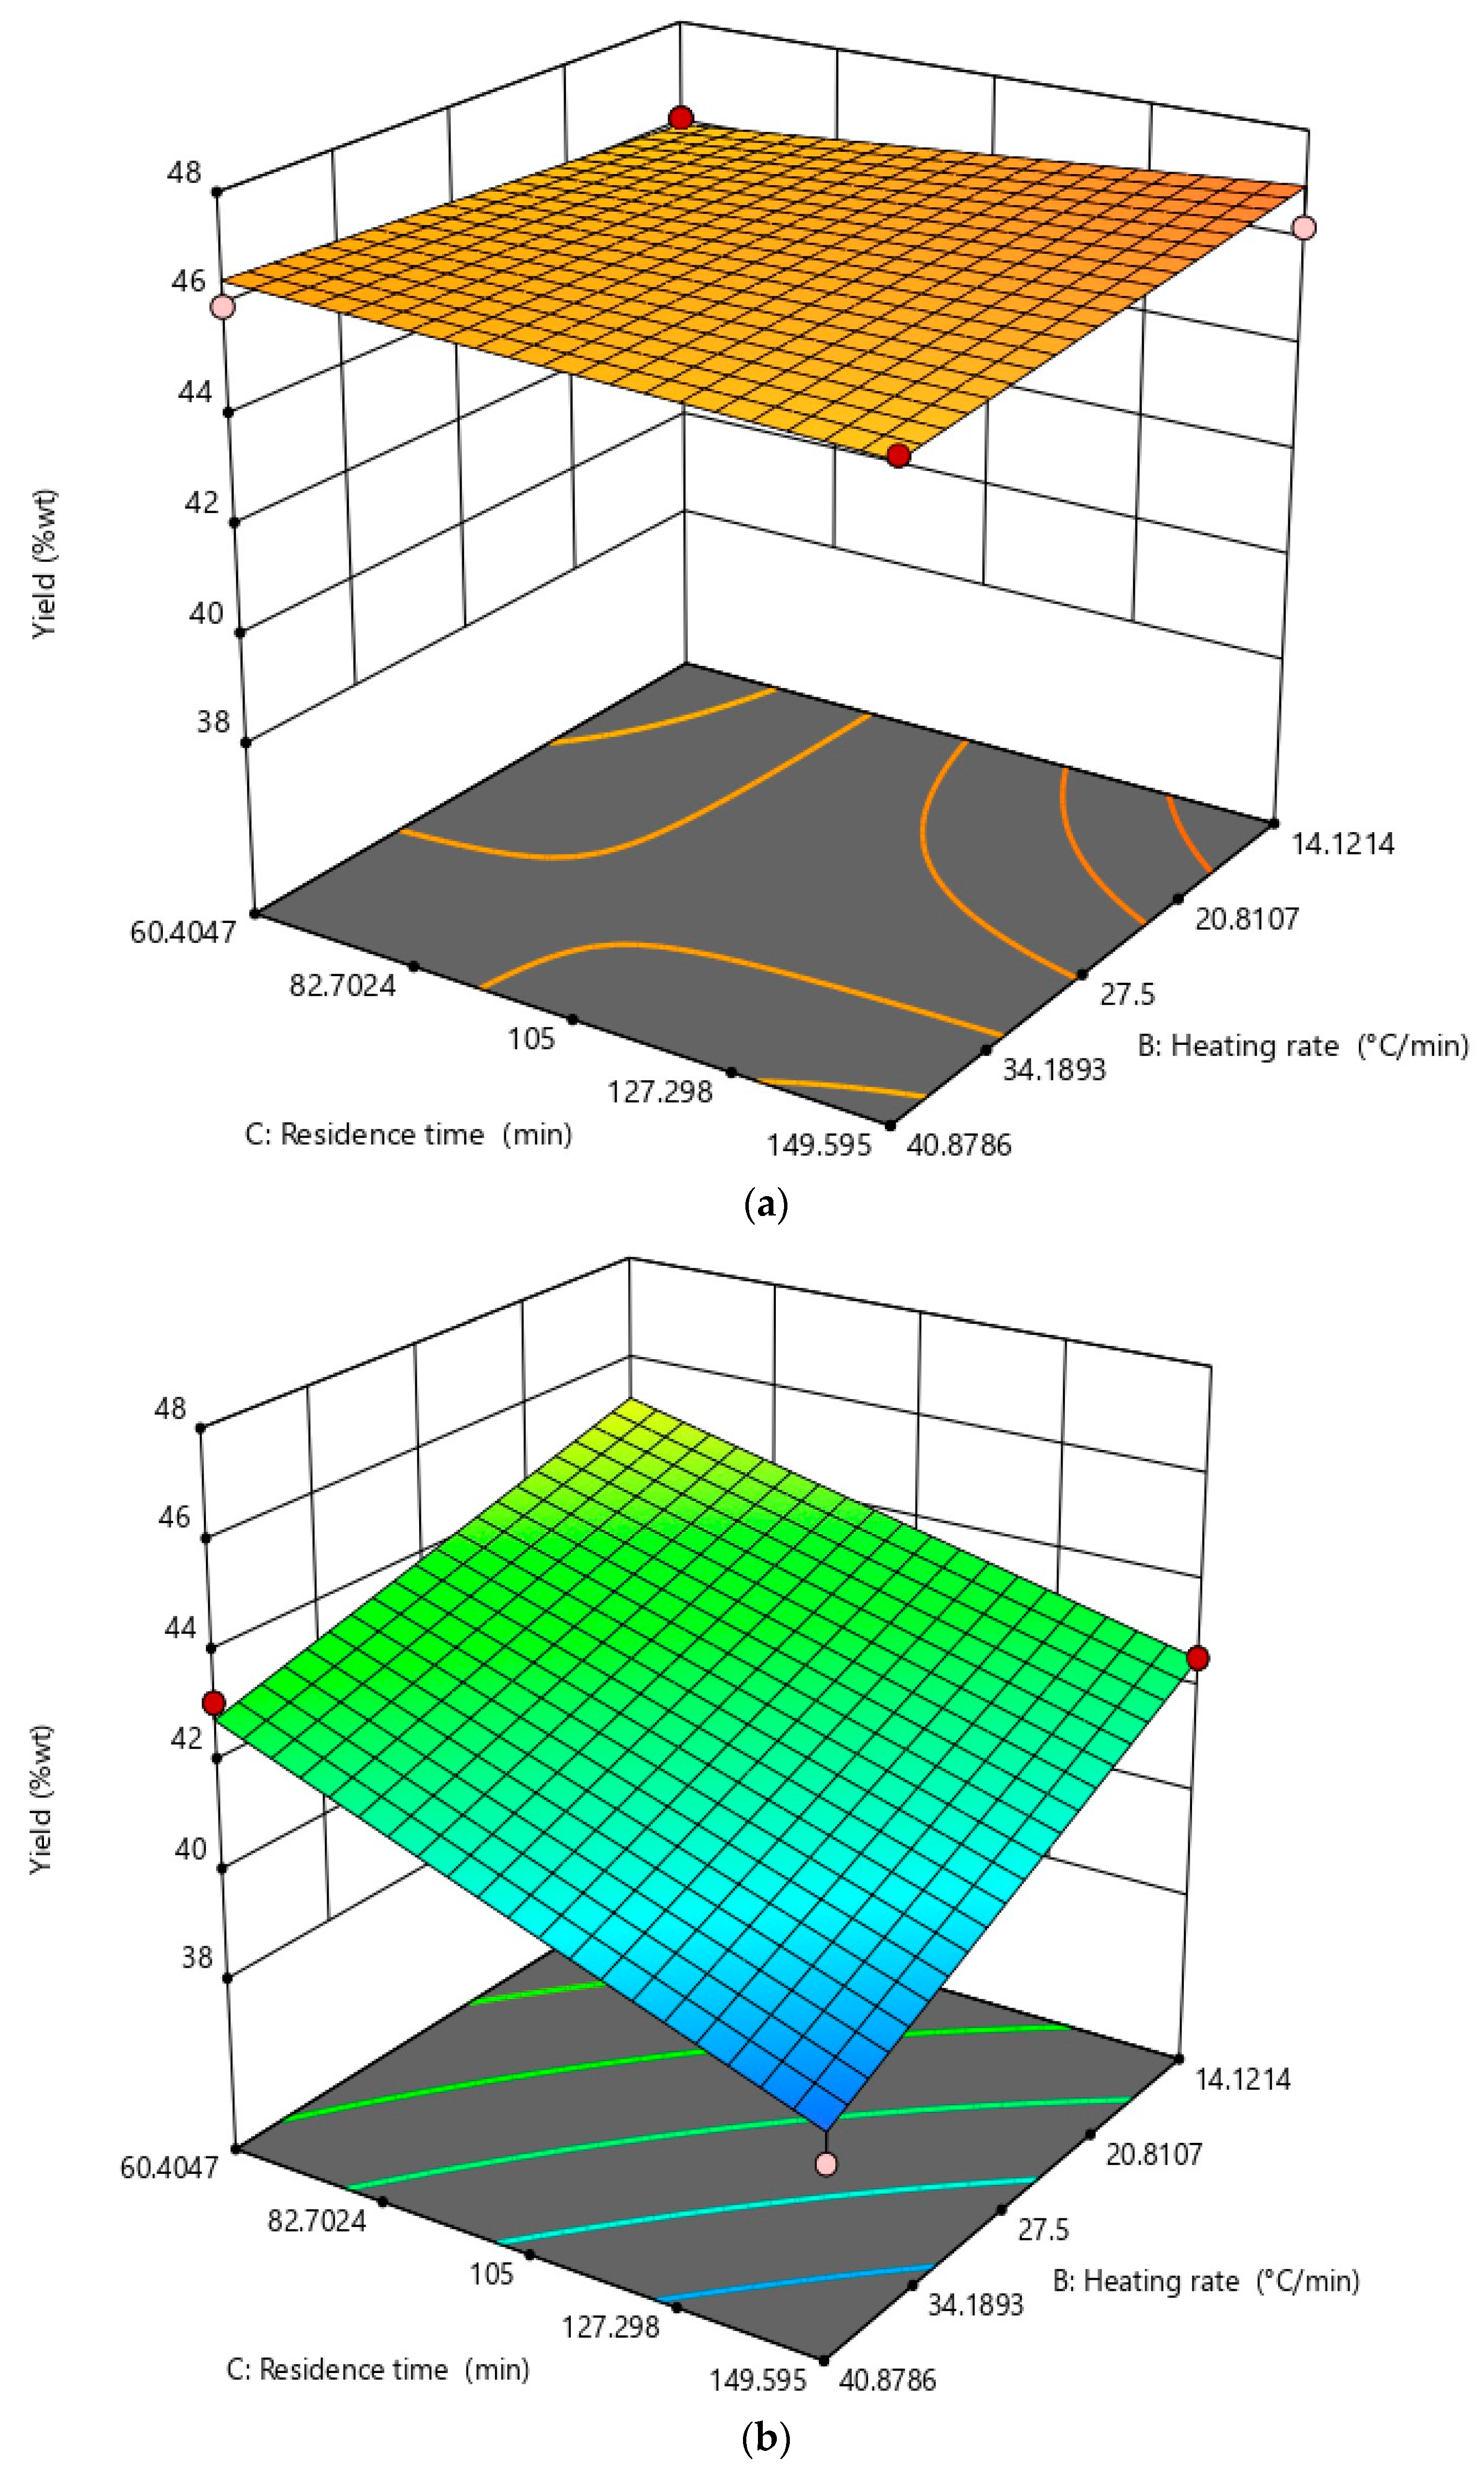
| Optimized Results | Model | p-Value | Lack of Fit p-Value | Adj-R2 | Pred-R2 |
|---|---|---|---|---|---|
| CO2 adsorption capacity | 2FI | <0.0001 | 0.4268 | 0.7396 | 0.5892 |
| Yield | 2FI | <0.0001 | 0.1147 | 0.9506 | 0.8369 |
| Test | Temperature (°C) | Heating Rate (°C/min) | Residence Time (min) | Experimental Yield (wt%) | Experimental Adsorption Capacity (mol CO2 ads/kg) | Theoretical Yield (wt%) | Theoretical Adsorption Capacity (mol CO2 ads/kg) |
|---|---|---|---|---|---|---|---|
| “Best” biochar | 491 | 20 | 150 | 43.9 | 0.735 | 46.8 | 0.476 |
| “Worst” biochar | 610 | 20 | 60 | 42.7 | 0.625 | 44.7 | 0.427 |
| Sample | Surface Area (m2/g) | Micropore Area (m2/g) | Pore Volume (cm3/g) | Micropore Volume (cm3/g) | Pore Average Diameter (Å) |
|---|---|---|---|---|---|
| Sewage Sludge | 0.46 | 0.23 | 0.004 | 0.000081 | 205.37 |
| “Best” biochar | 123.85 | 97.03 | 0.063 | 0.038 | 88.69 |
| “Worst” biochar | 102.91 | 86.85 | 0.051 | 0.034 | 104.08 |
| Sample | Moisture (wt%) | Volatile Matter (wt%) | Fixed Carbon (wt%) | Ashes (wt%) | C (wt%) | H (wt%) | N (wt%) | S (wt%) | O * (wt%) | LHV (MJ/kg) |
|---|---|---|---|---|---|---|---|---|---|---|
| “Best” biochar | 5.6 ± 0.1 | 21.1 ± 0.4 | 12.7 ± 0.3 | 60.6 ± 0.1 | 23.1 ± 0.4 | 0.40 ± 0.04 | 3.2 ± 0.1 | 0.40 ± 0.01 | 12.3 | 6.78 ± 0.09 |
| “Worst” biochar | 4.8 ± 0.2 | 17.5 ± 0.5 | 14.1 ± 0.8 | 63.7 ± 0.9 | 22.8 ± 1.7 | 0.2 ± 0.1 | 2.5 ± 0.2 | 0.5 ± 0.1 | 10.4 | 5.95 ± 0.07 |
Disclaimer/Publisher’s Note: The statements, opinions and data contained in all publications are solely those of the individual author(s) and contributor(s) and not of MDPI and/or the editor(s). MDPI and/or the editor(s) disclaim responsibility for any injury to people or property resulting from any ideas, methods, instructions or products referred to in the content. |
© 2024 by the authors. Licensee MDPI, Basel, Switzerland. This article is an open access article distributed under the terms and conditions of the Creative Commons Attribution (CC BY) license (https://creativecommons.org/licenses/by/4.0/).
Share and Cite
Cedrone, G.; Bracciale, M.P.; Cafiero, L.; Langone, M.; Mattioli, D.; Scarsella, M.; Tuffi, R. Optimization of Pyrolysis Parameters by Design of Experiment for the Production of Biochar from Sewage Sludge. Environments 2024, 11, 210. https://doi.org/10.3390/environments11100210
Cedrone G, Bracciale MP, Cafiero L, Langone M, Mattioli D, Scarsella M, Tuffi R. Optimization of Pyrolysis Parameters by Design of Experiment for the Production of Biochar from Sewage Sludge. Environments. 2024; 11(10):210. https://doi.org/10.3390/environments11100210
Chicago/Turabian StyleCedrone, Giacomo, Maria Paola Bracciale, Lorenzo Cafiero, Michela Langone, Davide Mattioli, Marco Scarsella, and Riccardo Tuffi. 2024. "Optimization of Pyrolysis Parameters by Design of Experiment for the Production of Biochar from Sewage Sludge" Environments 11, no. 10: 210. https://doi.org/10.3390/environments11100210
APA StyleCedrone, G., Bracciale, M. P., Cafiero, L., Langone, M., Mattioli, D., Scarsella, M., & Tuffi, R. (2024). Optimization of Pyrolysis Parameters by Design of Experiment for the Production of Biochar from Sewage Sludge. Environments, 11(10), 210. https://doi.org/10.3390/environments11100210