Article

Macrophytes as Key Element to Determine Ecological Quality Changes in Transitional Water Systems: The Venice Lagoon as Study Case

1
Department of Environmental Sciences, Informatics and Statistics (DAIS), University Ca’ Foscari Venice, Via Torino 155, 30170 Mestre, Italy
2
Department of Chemical, Pharmaceutical and Agricultural Sciences, University of Ferrara, Via Luigi Borsari 46, 44121 Ferrara, Italy
3
Department of Life Science and Biotechnology, University of Ferrara, via Luigi Borsari 46, 44121 Ferrara, Italy
*
Author to whom correspondence should be addressed.
Environments 2024, 11(9), 209; https://doi.org/10.3390/environments11090209
Submission received: 30 June 2024 / Revised: 16 September 2024 / Accepted: 18 September 2024 / Published: 22 September 2024

Abstract

:
According to European Union guidelines, the assessment of the ecological status of Transitional Water Systems (TWSs) should be based on the monitoring of biological communities rather than physico-chemical parameters and pollutants. Macrophytes, including aquatic angiosperms and macroalgae, are organisms that respond more quickly to environmental changes by varying the structure and biomass of their assemblages. There are several ecological indices based on macrophytes, among them the Macrophyte Quality Index (MaQI), which has been intercalibrated with water and sediment parameters, nutrient concentrations, and pollutants and is used to determine the ecological status of Italian TWSs. In the Venice Lagoon, it was applied to 87 stations, showing a significant score increase over the last ten years of monitoring (2011–2021) due to progressive lagoon environmental recovery. The dominant taxa assemblages, previously dominated by Ulvaceae, were replaced by species of higher ecological value, with an increase in the number and distribution of sensitive species, as well as the spread and cover of aquatic angiosperms. The rise in the Ecological Quality Ratio (EQR) determined by the MaQI confirms the key role of macrophyte monitoring in detecting environmental changes in TWSs. In fact, a simple check of the presence or absence of aquatic angiosperms and sensitive species is sufficient for an initial rapid assessment of the ecological status of these environments.

Graphical Abstract

1. Introduction

Since the 1990s, the European Community, in the following years recognized as the European Union, adopted the Habitats Directive (Council Directive 92/43/EEC [1]) with the aim of promoting the conservation of natural habitats and wild fauna and flora and the maintenance of biodiversity.
On 23 October 2000, the European Parliament and the Council of the European Union adopted the European Water Framework Directive (WFD, 2000/60/EC [2]), establishing a framework for community action in the field of water policy. This directive aims to preserve and improve the aquatic environment in the community with a view to establishing a framework for the protection of inland surface waters, transitional waters, coastal waters, and groundwater.
These objectives should be achieved by assessing the ecological status of water systems and monitoring the biological quality elements (BQEs: aquatic angiosperms, macroalgae, phytoplankton, fish, and benthic macrofauna) using physico-chemical parameters to support biological elements. Indeed, organisms provide more reliable answers on nutrient and pollutant impact than their concentrations [3,4]. Therefore, different ecological indices to assess the ecological status of coastal waters and transitional water systems (TWSs) based on these biological elements were set up and intercalibrated by the European Union [5].
For Mediterranean TWSs, aquatic angiosperms and macroalgae were the first intercalibrated biological elements and some Member States (Greece, France, Italy, Spain) of the Mediterranean Geographical Intercalibration Group (Med-GIG) considered these two groups as a single component called “Macrophytes”. France, Greece, and Italy proposed their own national indices: (1) the French “EXamination tool for Coastal LAgoon Macrophyte Ecological status” (EXCLAME: [6]), the Greek “Ecological Evaluation Index” (EEI: [7] and references therein), and the Italian “Macrophyte Quality Index” (MaQI: [8] and references therein).
All these indices classify species into two or more sensitivity groups and take into account macrophyte cover, but each differs from the others in terms of the number of sensitivity groups and the combination rule chosen to obtain the global Ecological Quality Ratio (EQR). EEI and EXCLAME were developed as continuous indices, which function only in the presence of a certain amount of macrophytes, whereas MaQI is a categorical index, applicable even in the presence of negligible biomass or single taxa.
In Italy, the Regional Agencies for Environmental Protection and Prevention (ARPAs) have applied MaQI to monitor the national TWSs since the late 2000s. Specifically, in the Venice Lagoon, MaQI was applied at 118 stations distributed across the entire lagoon in 2011, and at 88 stations in 2014, 2018, and 2021 [9,10,11,12]. The results of another monitoring campaign conducted at the same 88 stations in 2023 are currently under evaluation.
The aim of this paper is to demonstrate the rapid response of macrophytes to environmental changes. They are likely the best bioindicators for assessing the ecological status of TWSs. Indeed, aquatic angiosperms, particularly some sensitive macroalgae, represent the biological element that, compared to fish fauna and benthic macrofauna ([13] and references therein), respond more quickly to environmental changes, influencing the composition of macrophyte assemblages. For this reason, the changes in the vegetation of the soft substrata of the Venice Lagoon and the ecological status recorded through the application of the MaQI over a ten-year period (2011–2021) are reported and discussed, highlighting the high sensitivity of certain calcareous taxa and aquatic angiosperms.

2. Materials and Methods
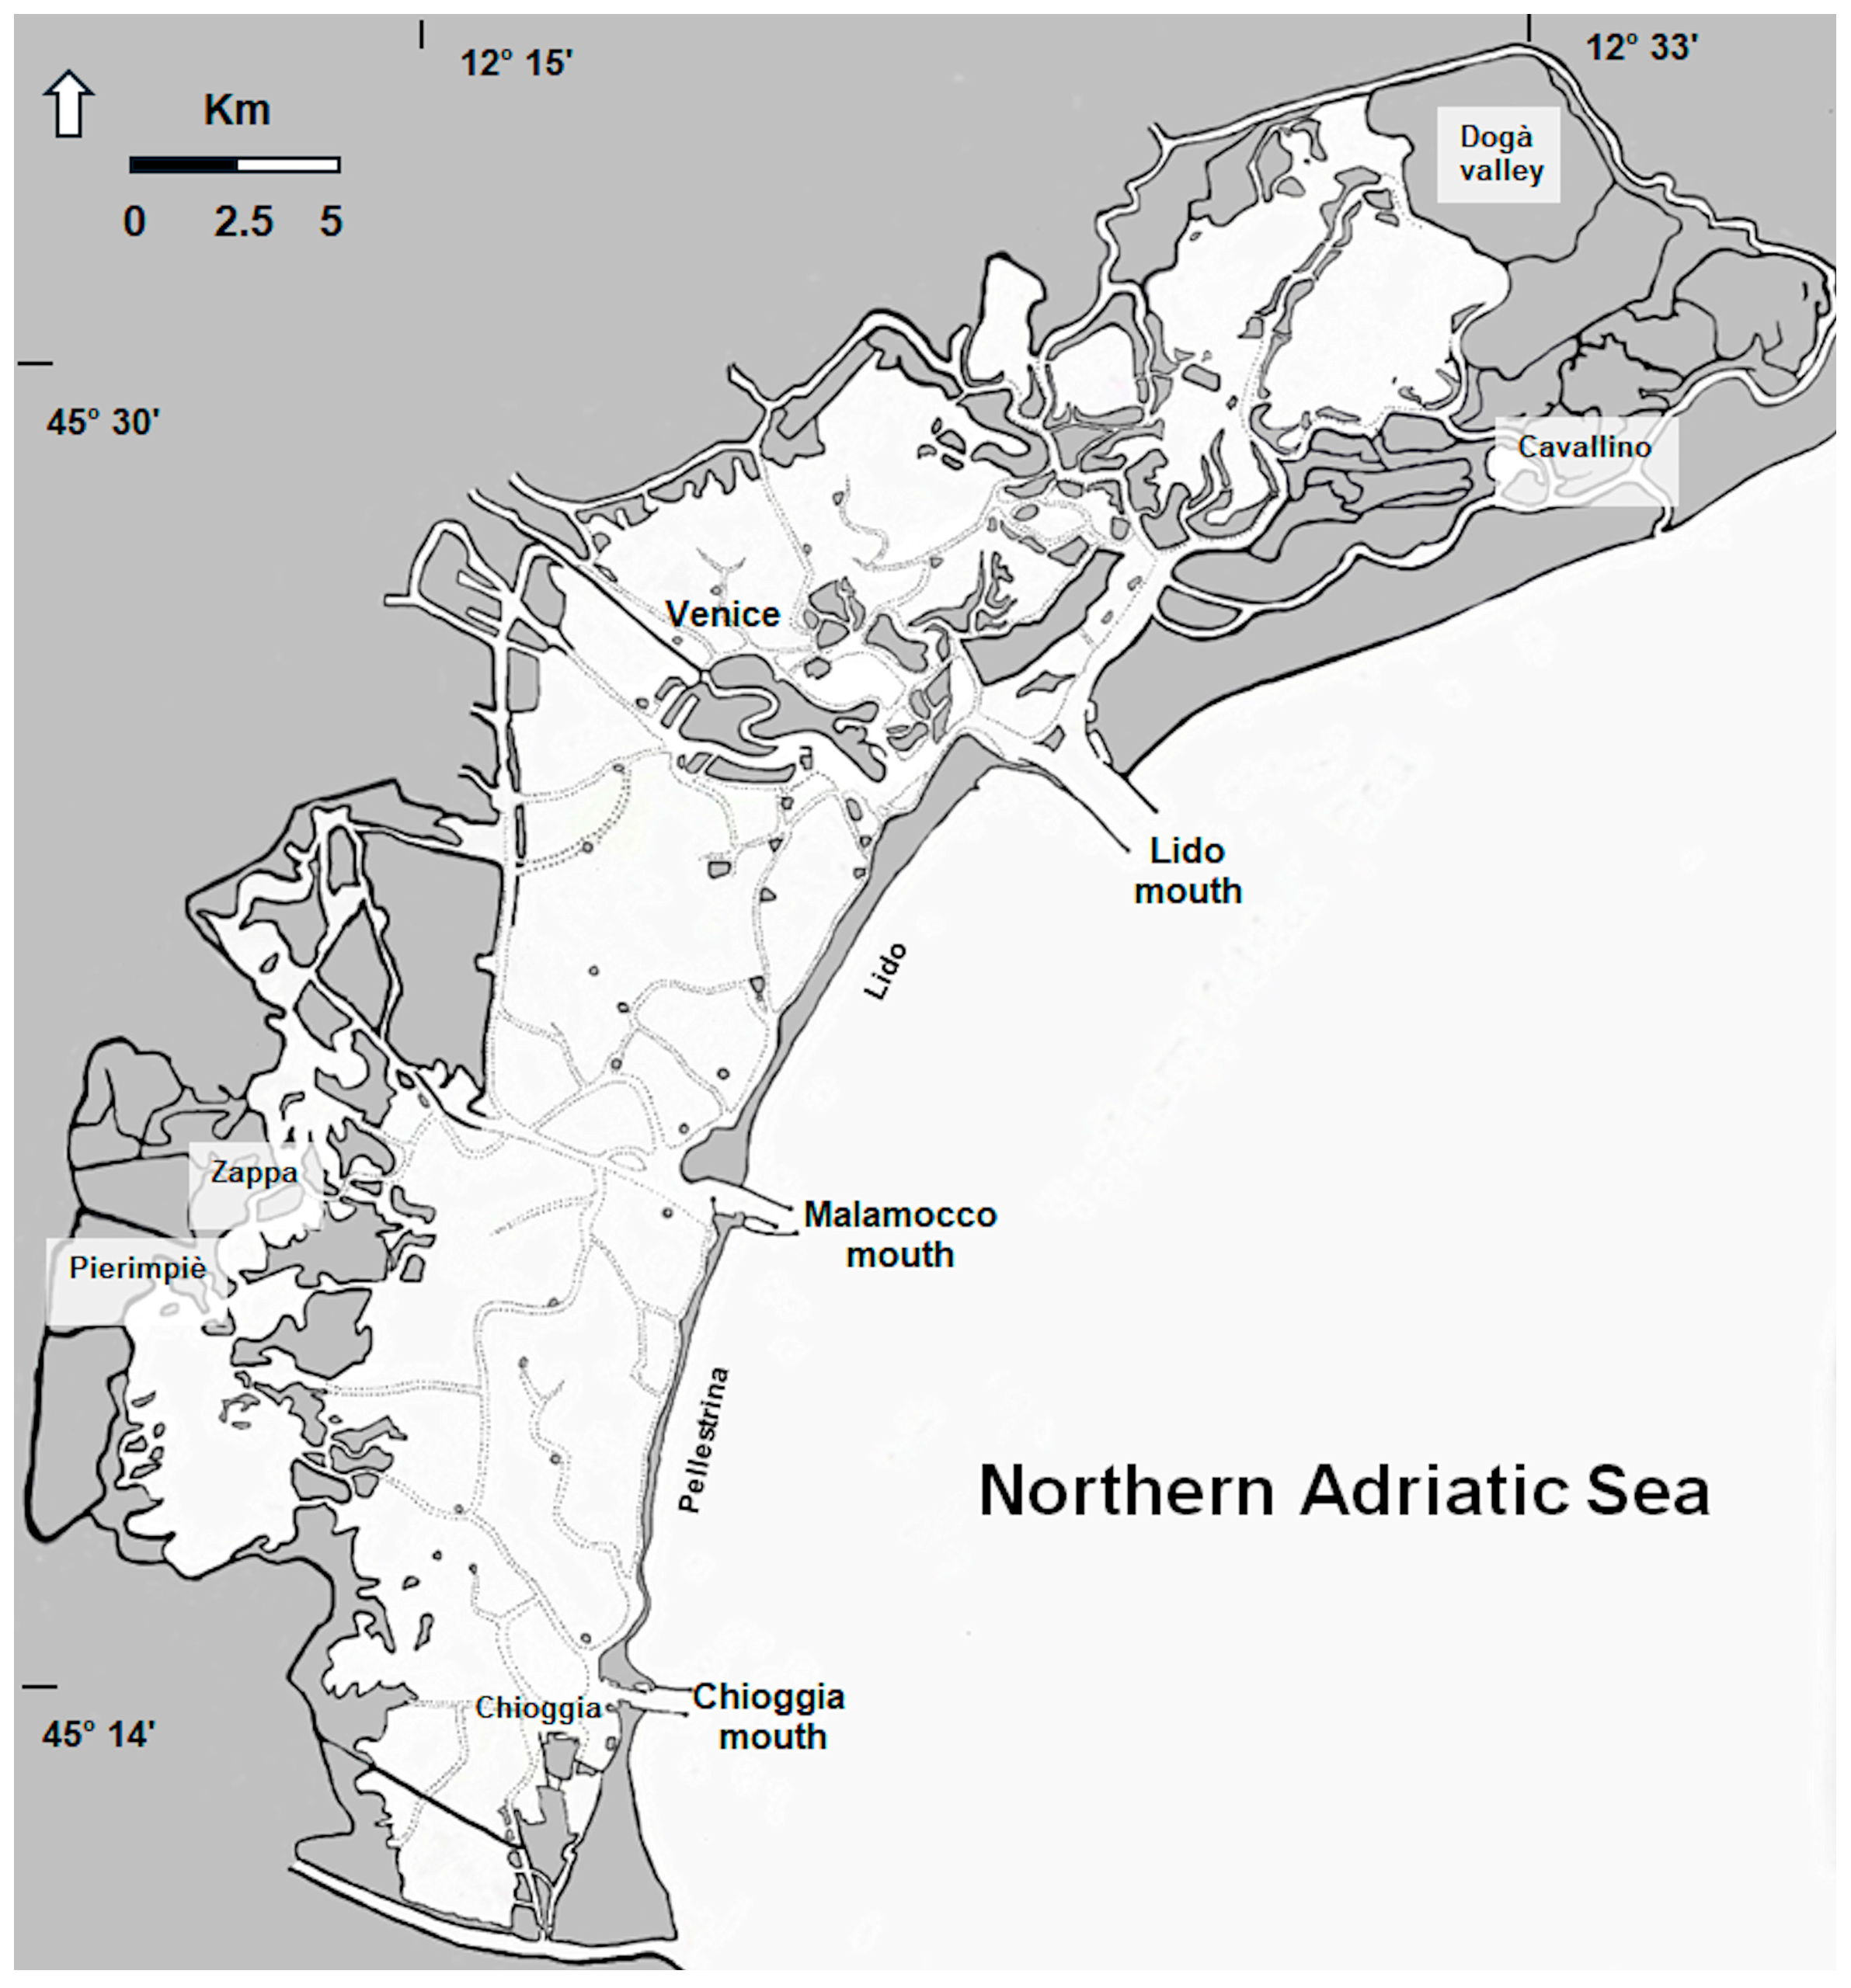
2.1. The Study Area

The Venice Lagoon (Figure 1) is a large (approx. 549 km2) and shallow (mean depth ca. 1.2 m) polyhedric basin which is characterized by very different ecological conditions representative of most Italian TWSs [14]. It is subdivided into three sub-basins (southern, central, northern), which are connected to the sea through three large (600–900 m) and deep (10–15, up to 50 m) mouths (Chioggia, Malamocco, Lido), allowing for a water exchange of approx. 60% during each tidal cycle (12 h).
Based on the mean salinity and water renewal, the lagoon open to water exchange was subdivided into 11 unmodified water bodies (WBs), i.e., one ER = Euryhaline Restricted; four ENR = Euryhaline Non-Restricted; four PR = Polyhaline Restricted; and two PNR = Polyhaline Non-Restricted). In addition, 2 modified WBs were selected, taking into account some closed fishing valleys (i.e., Zappa Valley (ZV), Pierimpiè Valley (PV) in the southern lagoon, and Dogà Valley (DV), Cavallino Valley (CV) in the northern lagoon; Figure 1). In 2014, 2018, and 2021 the monitoring of Pierimpiè Valley was discontinued, leaving Zappa Valley as the only WB in the southern lagoon. Within each WB, a number of stations (ranging from 3 to 21) proportional to its water surface area was selected. In 2011, the number of stations was 118. In 2014, 2018, and 2021, due to the homogeneity of the physico-chemical conditions recorded in some areas, this number was reduced to 87. However, a new station was added in WB ENR2, bringing the total to 88 stations. In this paper, the results obtained from the 87 stations common to the four annual surveys (2011, 2014, 2018, and 2021) were compared with a focus on changes in macrophyte taxa and aquatic angiosperm cover.

2.2. Macrophyte Sampling

The cover of aquatic angiosperms, including seagrasses and Ruppia cirrhosa (Petagna) Grande, a species also found in freshwater environments [15], was sampled twice a year, as required by the application of the MaQI. The nomenclature of macroalgae was updated following [16] and the most recent specific literature, whereas sensitive taxa were selected according to the list provided by the Italian Institute for Environmental Protection and Research [17], also including some taxa recorded more recently (provided in the Supplementary Material: Table S1).
Macrophyte cover in shallow clear waters was estimated using the Visual Census Technique [18], while in turbid waters the presence/absence of macrophytes was estimated by touching the bottom 20 times with a rake, achieving a 5% resolution [8]. The dominance of Chlorophyta or Rhodophyta was determined by sorting 3–6 subsamples of macroalgae and weighing the different drained taxa, whose abundances were calculated based on total cover (abundance = algal weight × cover). Samples were stored in a 4% formaldehyde solution and morphologically identified using a stereoscope and/or optical microscope. The DNA barcoding method was employed to distinguish taxonomically problematic taxa [19]. The ecological status of each station was obtained by applying the Macrophyte Quality Index (MaQI [8]) in accordance with the Water Framework Directive (WFD 2000/60/EC).

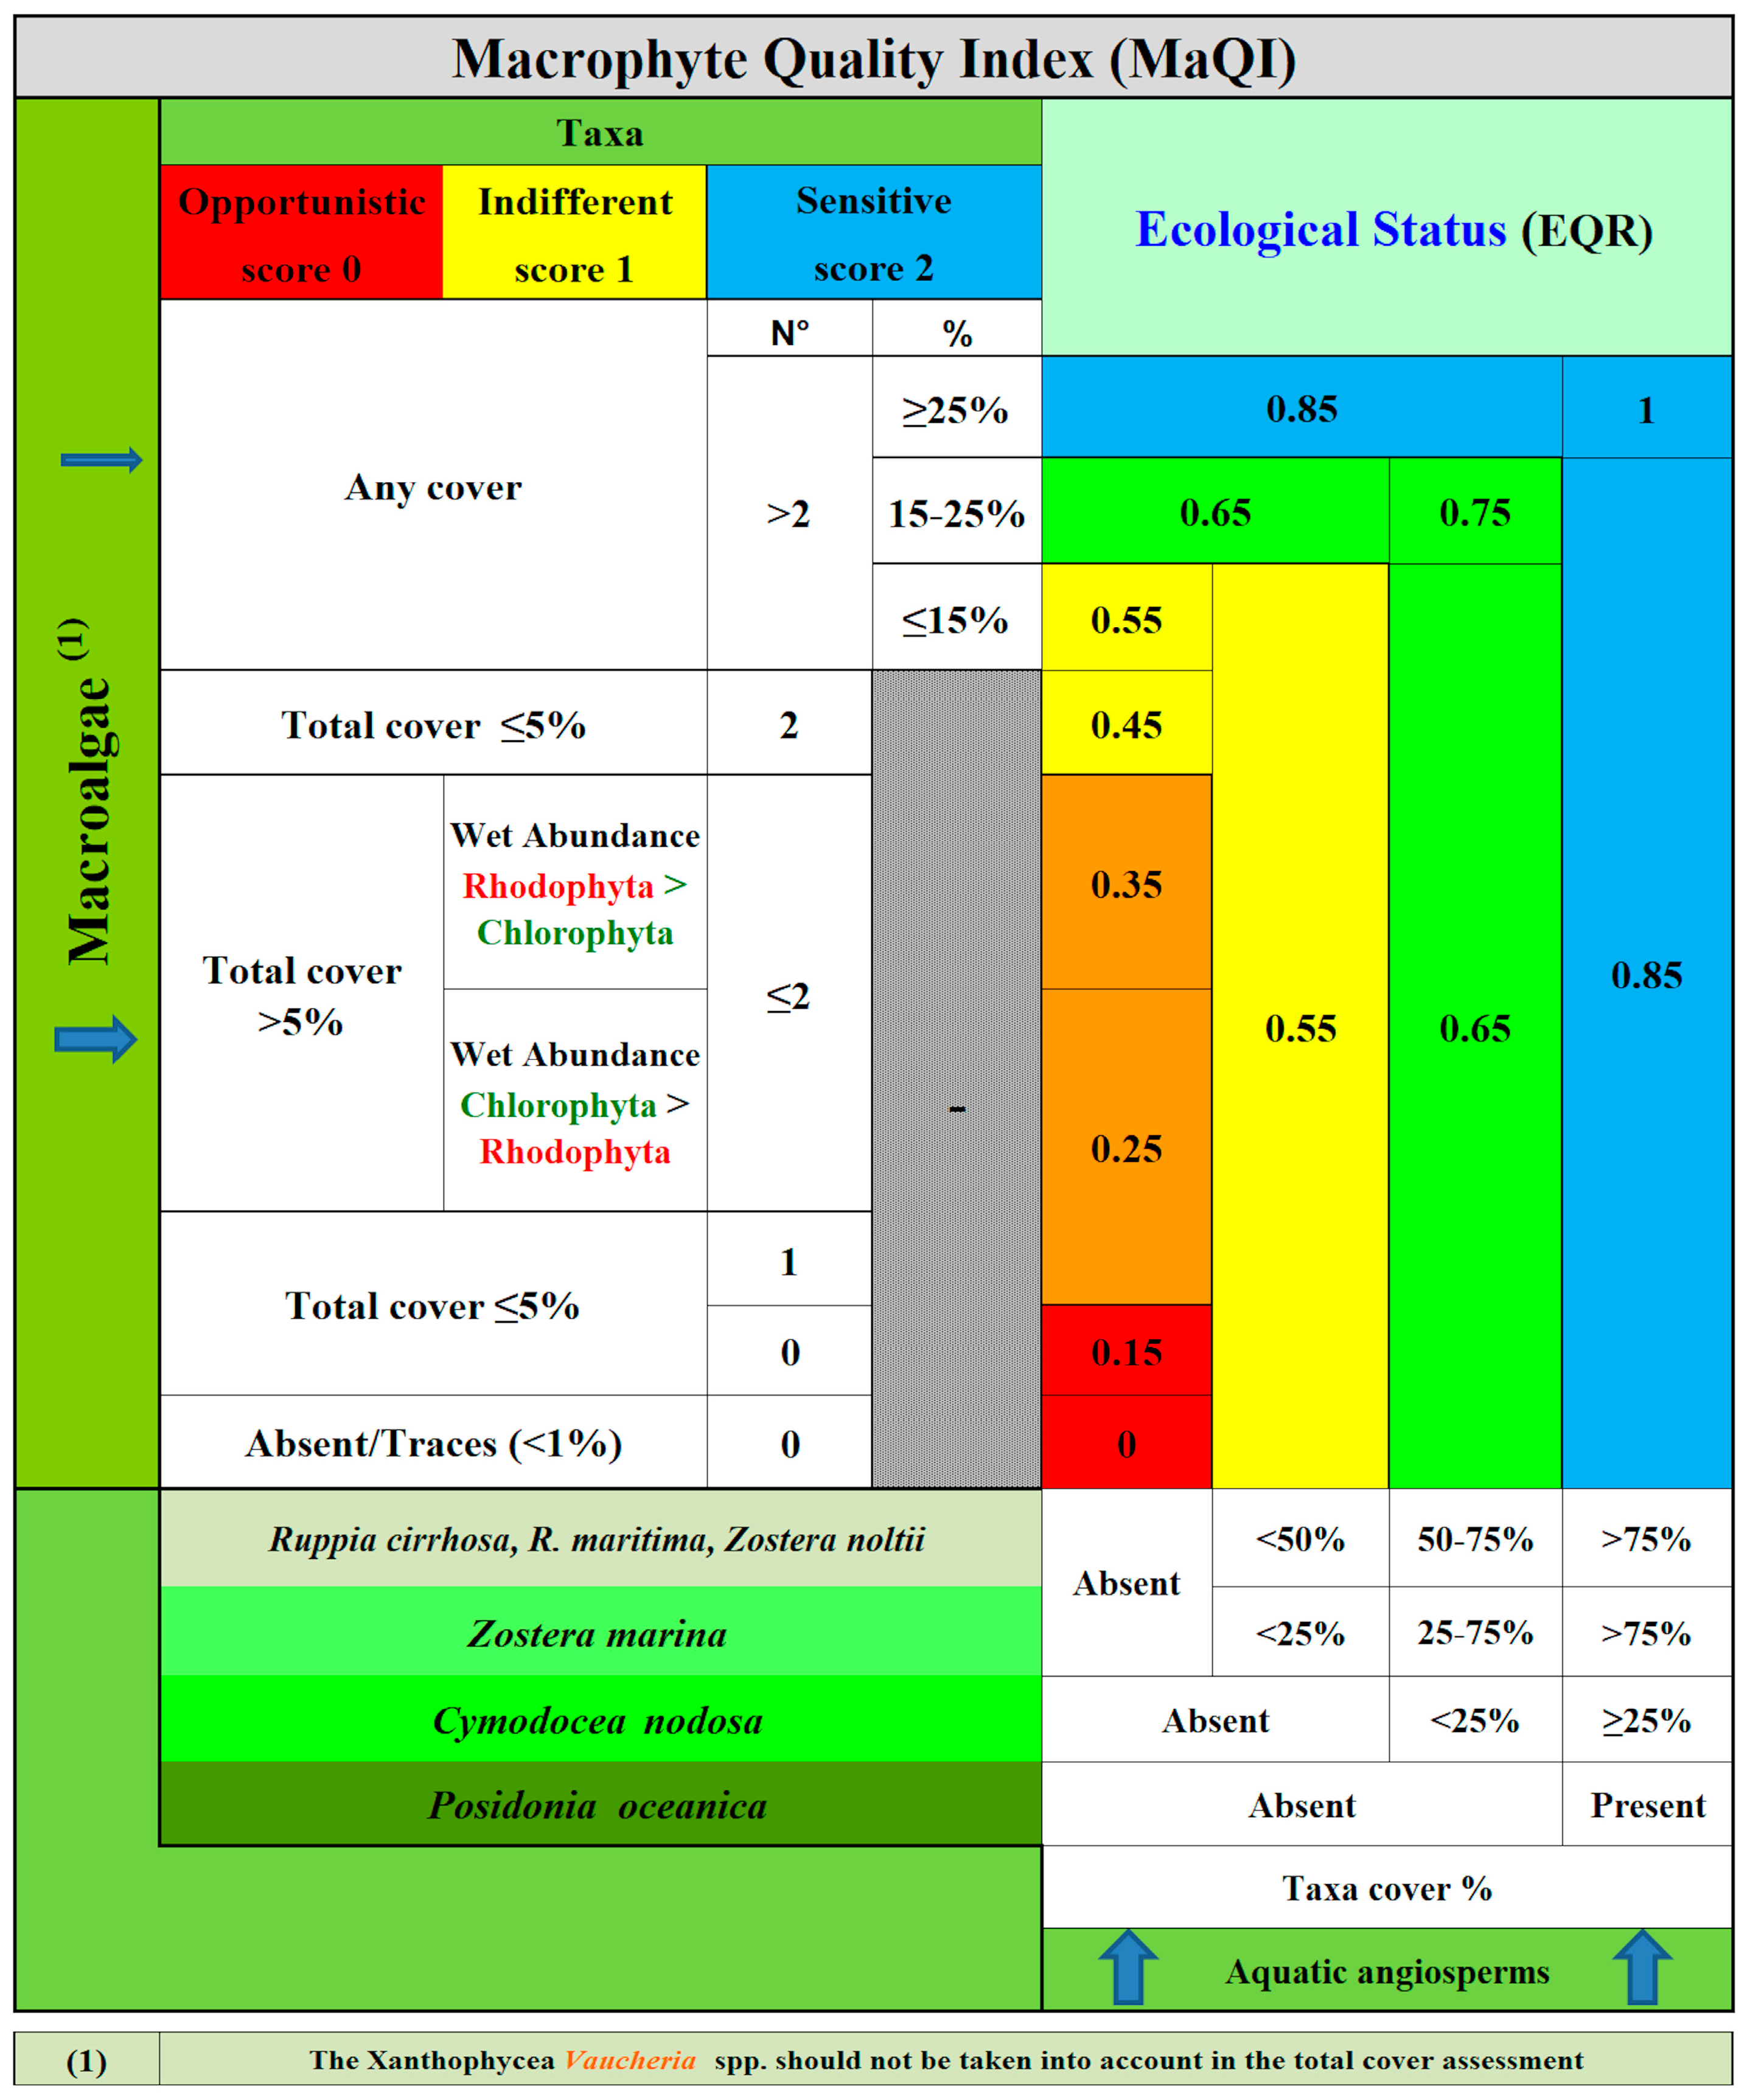
2.3. Macrophyte Quality Index (MaQI)

The MaQI is a categorical index calibrated with a high number of physico-chemical parameters, nutrients, pollutants, and macrophyte variables ([8] and references therein) and designed to work even in the presence of a minimal number of species and/or macroalgal biomass. It does not require any mathematical formula but instead relies on the measurement of the abundance of green and red algae, the number of macroalgal taxa, distinguishing sensitive from opportunistic/indifferent taxa, and the cover of individual aquatic angiosperms, as shown in Figure 2.
The Ecological Quality Ratio (EQR), which ranges from 0 to 1, is divided into five quality classes, each with two equivalent scores: (i.e., Bad in red = scores 0 and 0.15; Poor in ochre = scores 0.25 and 0.35; Moderate in yellow = scores 0.45 and 0.55; Good in green = scores 0.65 and 0.75; and High in blue = scores 0.85 and 1.00). When the values from multiple stations are averaged, the index becomes continuous, and the resulting value determines the classification of the water body (EQR: 0–0.2 = Bad; 0.2–0.4 = Poor; 0.4–0.6 = Moderate; 0.6–0.8 = Good; 0.8–1.0 = High). To apply the index, two samplings are required, one in spring and one in autumn, to account for both winter and summer species. The number of macroalgal taxa collected during the spring and autumn surveys is combined in a single list, and the ratio between total taxa and sensitive taxa is calculated. Furthermore, the maximum cover of both aquatic angiosperms and macroalgae is considered, as these may exhibit maximum growth in different stations.
The final ecological status assessment of each station is based on the integration of the abundance and/or number of macroalgal taxa with the cover of aquatic angiosperms, while the ecological assessment of each water body corresponds to the average value of the EQRs determined for each station.
The index works also in the presence of a very limited number of macroalgal species, also taking into account the small epiphytes on the shells of bivalves, gastropods, stones, poles, and other solid substrata. In the absence of aquatic angiosperms and sensitive taxa, the EQR is easy to obtain by the Chlorophyta and Rhodophyta cover and relative biomass abundances [8]. When, during two samplings, one in spring and the other in autumn to collect both cold- and warm-loving species, the cover is lower than 5%, it is assumed that there are no ecological conditions for any species to produce significant biomass. In this case, the environmental assessment is classified as Bad. Instead, if some species produce high biomass, with the presence of at most one/two sensitive species, the environment is classified as Poor, with a higher score (EQR = 0.35) when the abundance of Rhodophyceae exceeds that of Chlorophyceae (EQR = 0.25). When the number of sensitive taxa is ≥3, the assessment is based on the ratio between them and all the other taxa. The ratios used to distinguish Moderate from Good and High conditions were obtained by analyzing the vegetation and the taxa recorded in most Italian lagoons: Venice, Lesina, Orbetello ([8] and references therein), as well as Marano-Grado, Po Delta, Comacchio Valleys, Pialassa della Baiona, and Mar Piccolo of Taranto.
As regards aquatic angiosperms (i.e., Cymodocea nodosa (Ucria) Ascherson, Zostera marina Linnaeus, Nanozostera noltei (Hornemann) Tomlinson and Posluszny, Ruppia cirrhosa (Petagna) Grande), the cover range considered to be included in a specific ecological class was selected based on the ecological quality of the different species: P. oceanica > C. nodosa > Z. marina > N. noltei = R. cirrhosa = R. maritima (Figure 2). However, above a certain cover threshold, all species are considered indicators of High ecological conditions.
Due to their relationship with ecological parameters and pollutants ([8] and references therein), it was assumed that aquatic angiosperms can only be present starting from Moderate ecological conditions. The presence of C. nodosa indicates Good or High ecological conditions, while P. oceanica is found exclusively in areas with a High environmental status. However, the latter species is only present in the Marsala Lagoon in Sicily, while in the other Italian TWSs, the best conditions are represented by extensive C. nodosa prairies. More detailed information on the application of the index can be found in [8] and references therein.

2.4. Environmental Parameters

The mean values of some parameters of the water column (Reactive Phosphorus = RP; Dissolved Inorganic Nitrogen (DIN: sum of ammonium, nitrite, and nitrate); Total Chlorophyll-a = Chl-a, and Total Suspended Solids = TSSs) that could influence the vegetation are also reported.
At each station, six water column samples were collected with a homemade cylindrical sampler (diameter: 4 cm, length: 1.50 cm), which was repeatedly plunged into the water to collect samples of the entire water column, which were transferred to a tank. Mixed sub-samples of 0.1–1.0 L were filtered through GF/F Whatman glass fiber filters (pore size: 0.7 µm). Water samples and filters were stored frozen at −18 °C for the determination of the nutrient (RP and DIN) concentration, according to [20], and total Chlorophyll-a (Chl-a as the sum of the active and degraded pigment: phaeophytin-a), following [21]. Total Suspended Solids (TSSs) were determined by filtering additional 0.1–1.0 L aliquots of water through Whatman GF/F glass fiber filters previously oven-dried for 1 h at 110 °C.

2.5. Statistical Analysis Methods
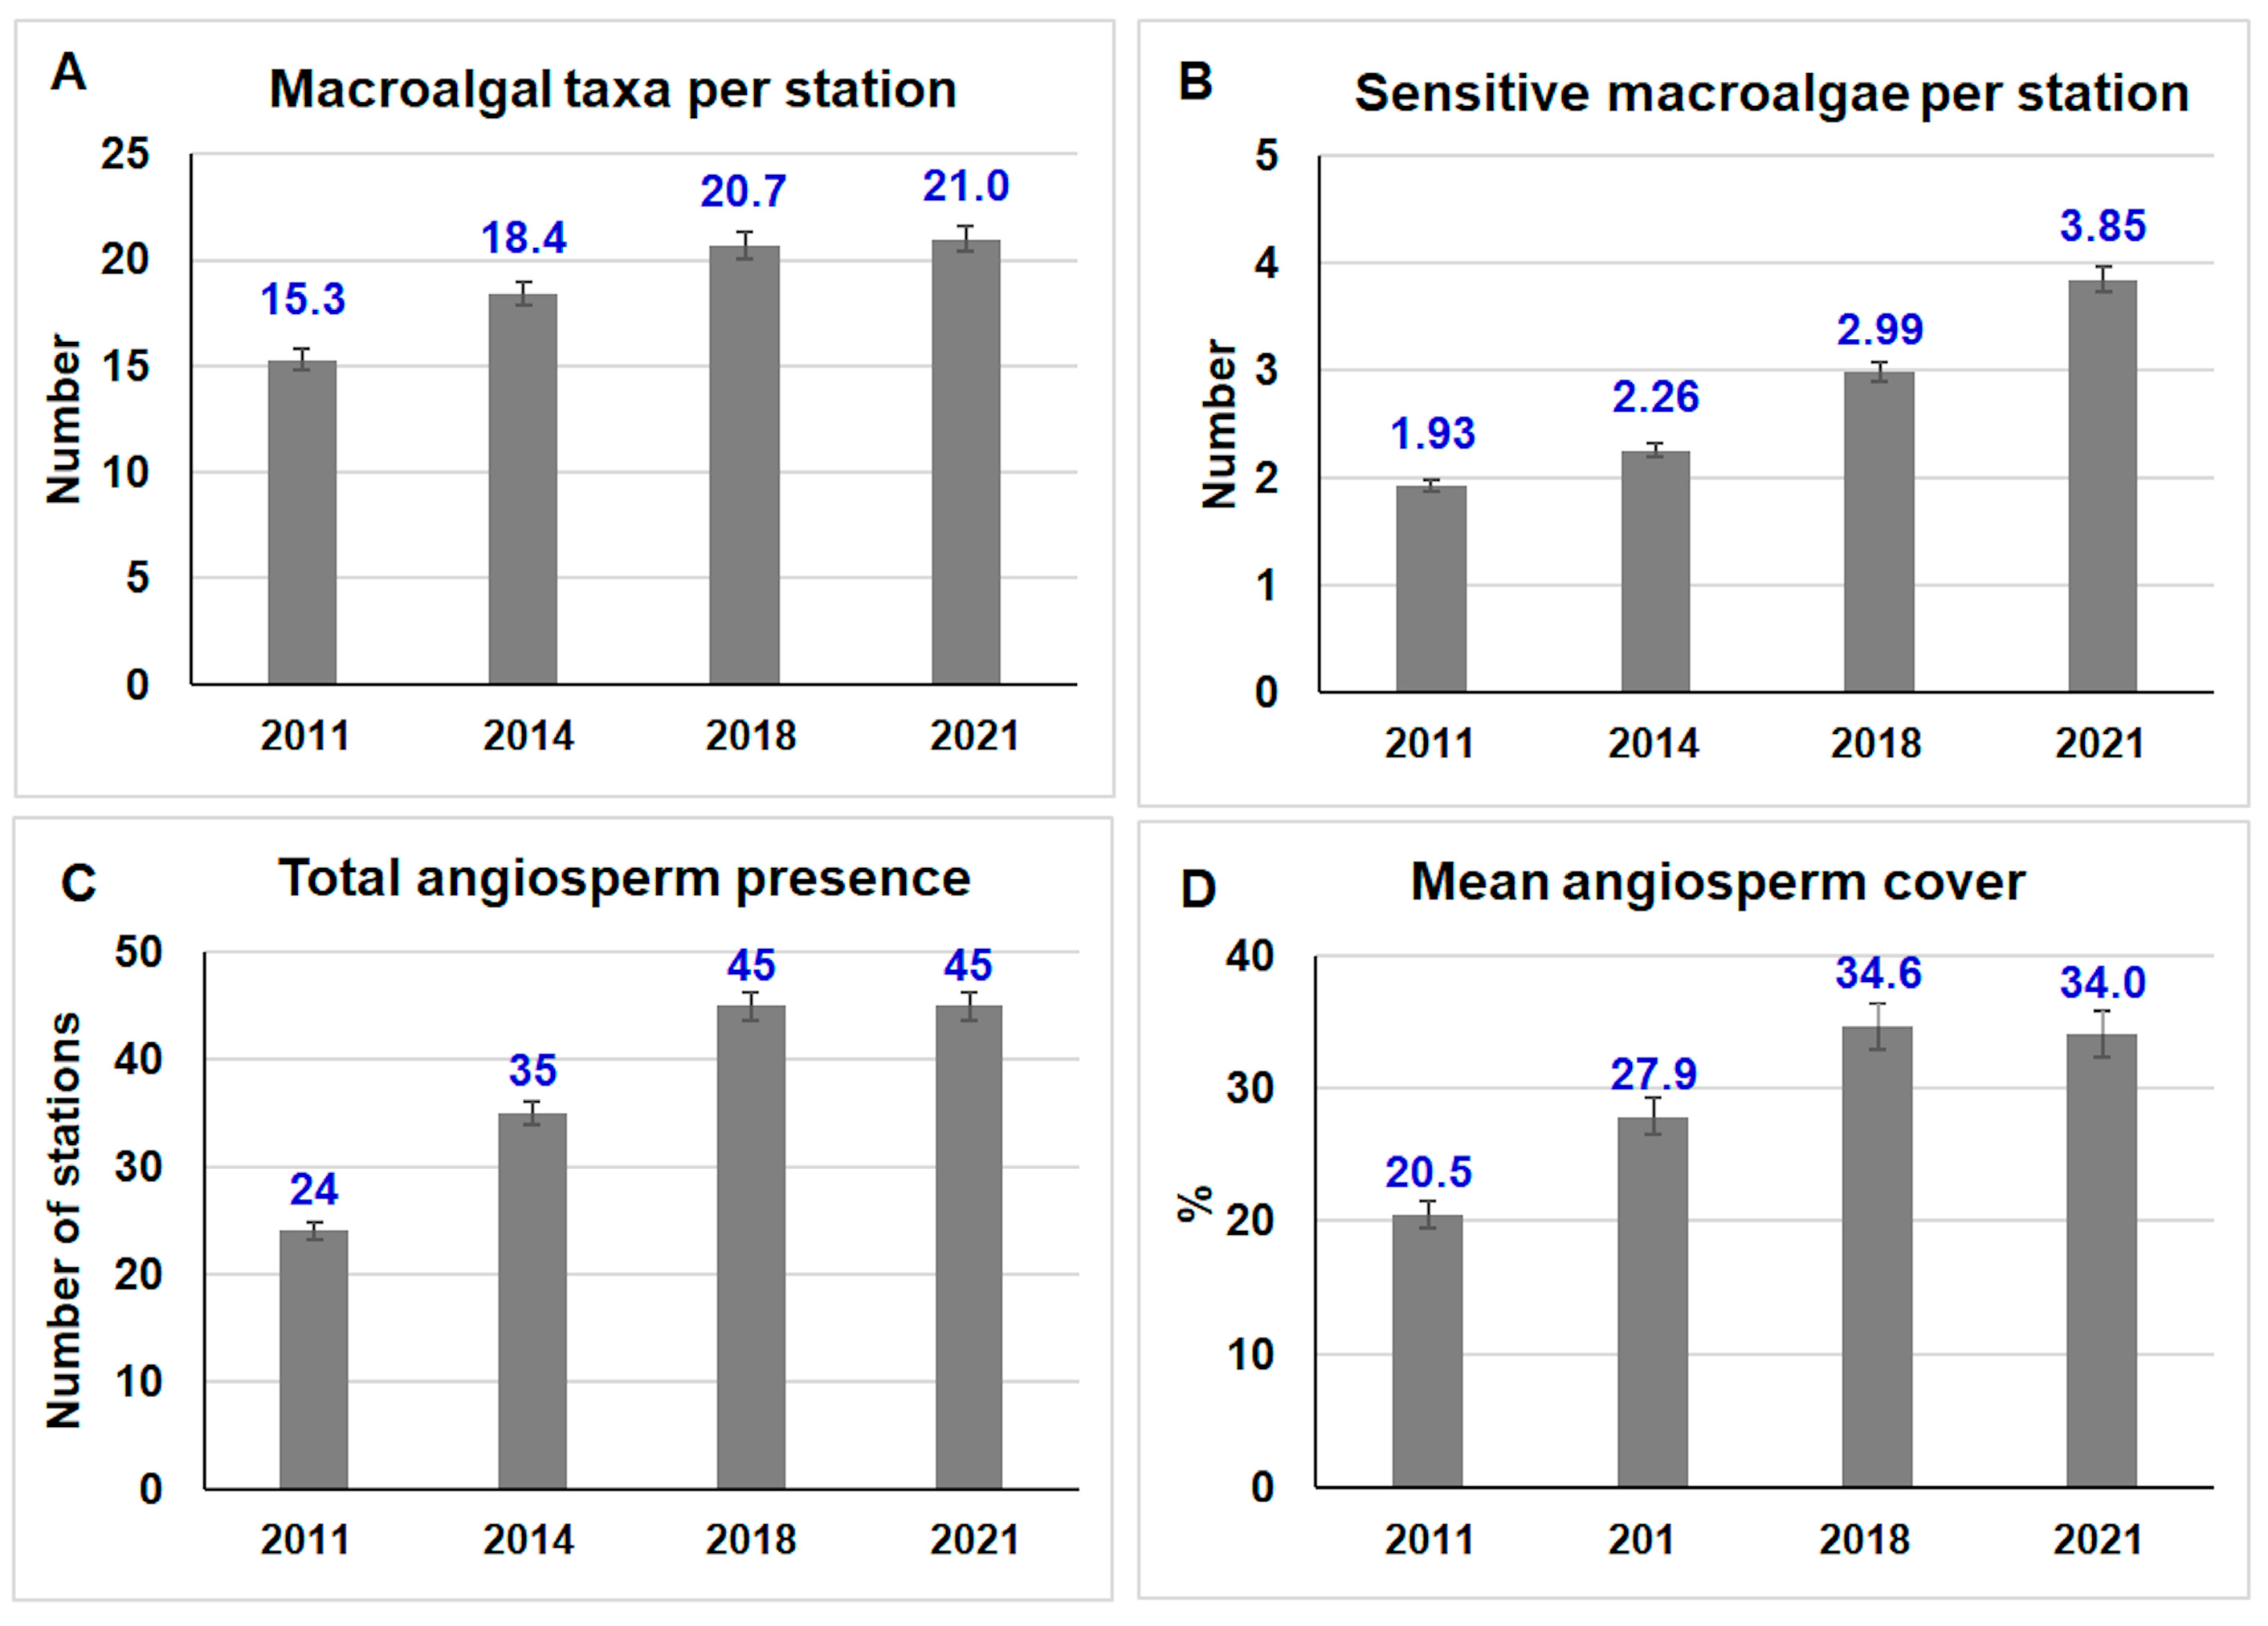
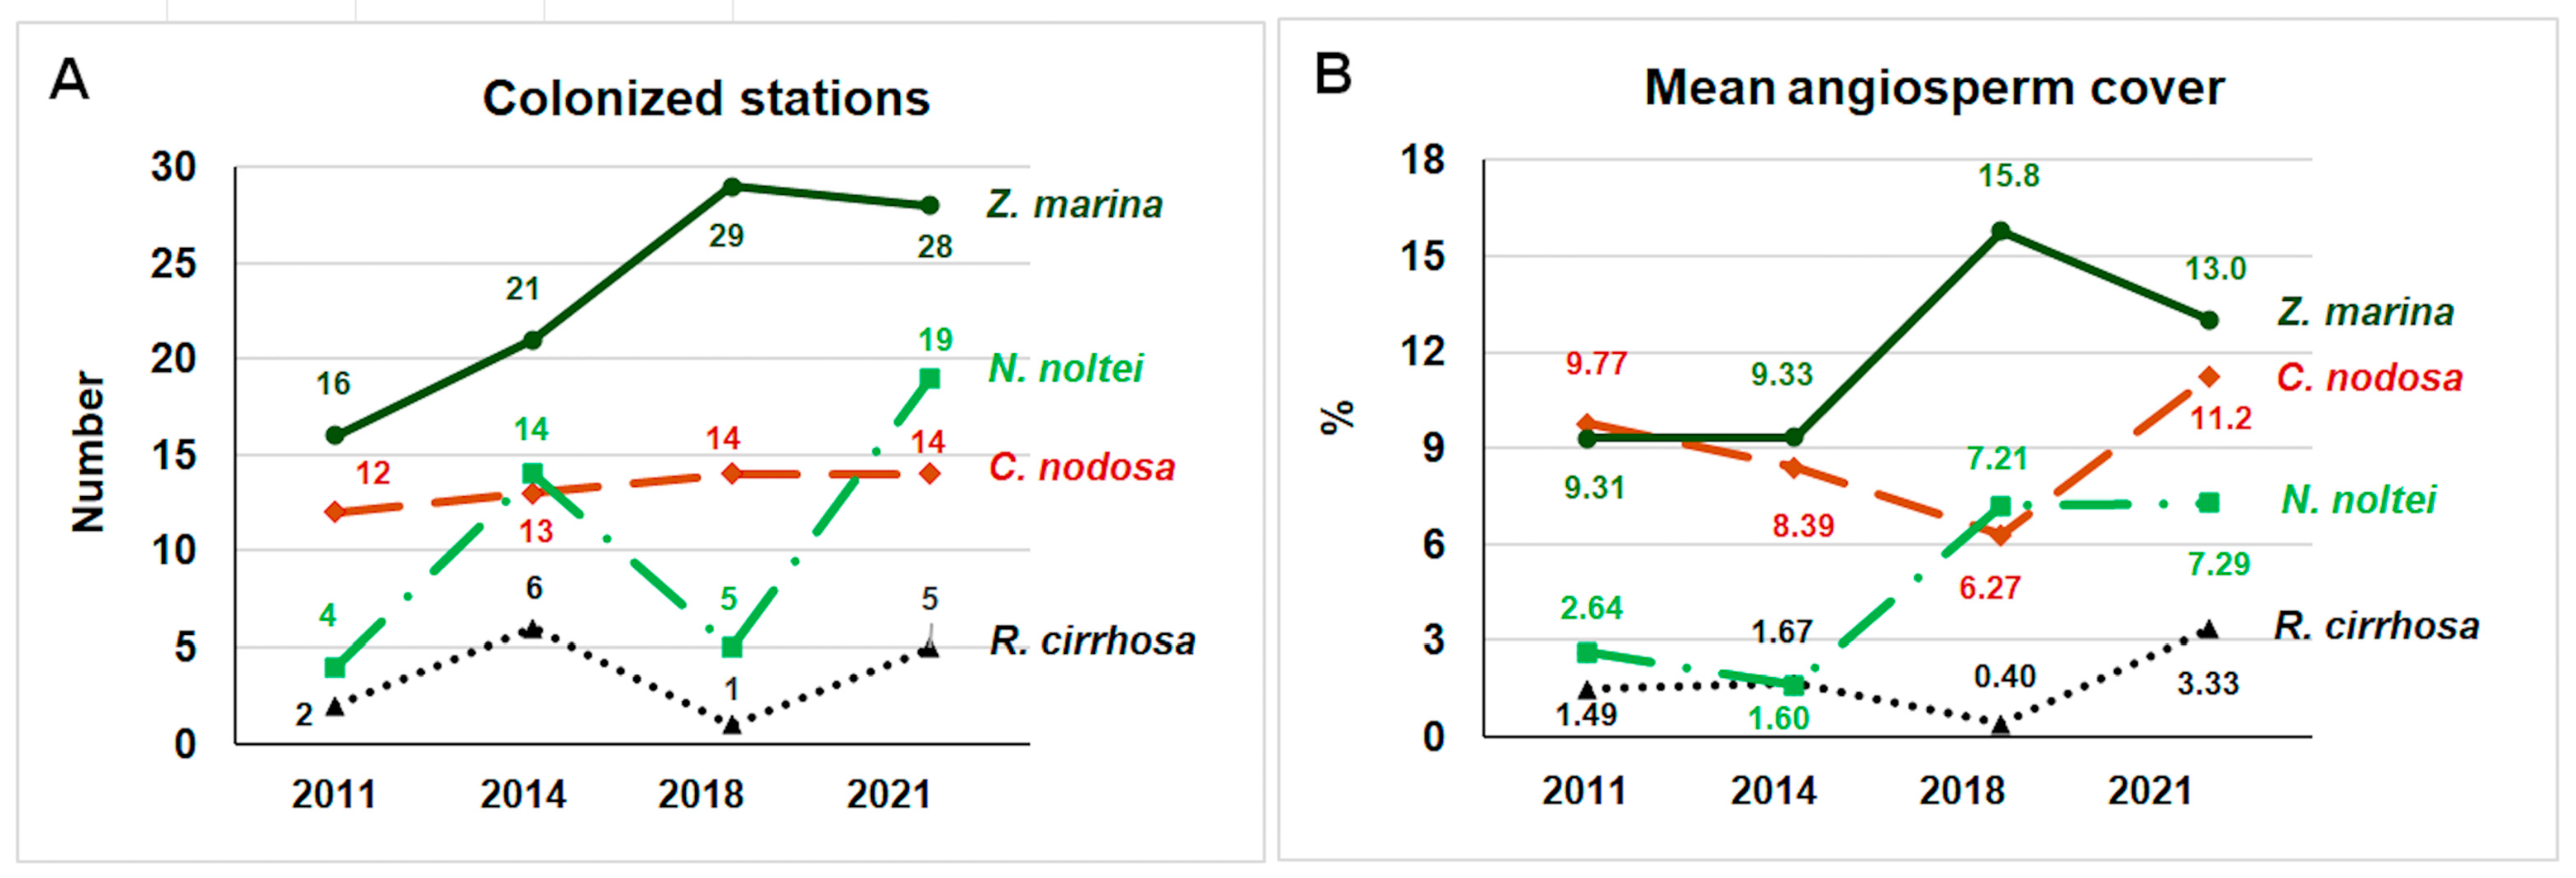
The changes in EQRs, macrophyte variables, and environmental parameters recorded over the four years (2011, 2014, 2018, 2021) were tested by the analysis of variance to evaluate the strength of each data set comparison. Prior to the analyses, the distribution of each variable was checked for normality using the Shapiro–Wilk test (p < 0.05). For normally distributed data, one-way ANOVA (p and F values) was employed, while for non-normal data, the Kruskal–Wallis test (p and H values) was used. Differences were considered significant when p < 0.05. All statistical analyses were performed using R software (version 4.4.1) and the “rstatix” package.

3. Results

The changes in the ecological status determined throughout the Venice Lagoon between 2011 and 2021 are highlighted by the EQR values recorded in 2011, 2014, 2018, and 2021 (Table 1 and Figure 3).
They concern 11 unmodified WBs and 2 highly modified WBs separated from the lagoon and open to tidal exchange by stone embankments. The mean EQRs of the unmodified WBs increased insignificantly (Kruskal–Wallis: p = 0.077, H = 0.089) from 0.401 in 2011 to 0.585 in 2021; both values correspond to Moderate conditions. If we consider the mean values of the 87 stations separately, the EQR has grown significantly (Kruskal–Wallis: p < 0.001, H = 0.100), from 0.459 (Moderate conditions) in 2011 to 0.658 (Good conditions) in 2021.
The EQR difference between 2021 and 2011 was positive in all the WBs except for PR4, where the score decreased from 0.317 to 0.283, although it remained in the same quality class. The highest EQR increase was recorded in ER (0.404), ENR3 (0.366), and PR2 (0.300), corresponding to increments of 2.02, 1.83, and 1.50 classes of ecological status, respectively (one quality class = 0.2). ER (13 stations), in the northernmost region of the lagoon, increased from Moderate (2011) to Good (2014) and High conditions (2018–2021) (Kruskal–Wallis: p < 0.001, H = 0.516). ENR3 (3 stations), placed in the southern basin, around the city of Chioggia, changed from Moderate to Good conditions (Kruskal–Wallis: p = 0.072, H = 0.058), whereas PR2 (4 stations), in the choked areas of the southern basin, significantly improved from Poor to Good conditions (Kruskal–Wallis: p < 0.05, H = 0.816). PR4, PNR1, ZV (Zappa Valley), and DV-CV (Dogà and Cavallino Valleys) maintained the assessment recorded in 2011, although PR4 showed a slight decline in score. All the other WBs showed an EQR increase of up to 1.17 quality classes.
The changes in the ecological conditions were linked to significant variations in lagoon vegetation, including a progressive increase in the number of sensitive macroalgal species per station (from 1.93% in 2011 to 3.85% in 2021), in the number of stations colonized by aquatic angiosperms (from 24 to 45), and in the total angiosperm cover (from 20.5% to 34%) (Figure 4).
The total number of macroalgal taxa ranged from 126 in 2021 to 127 in 2014, 132 in 2018, and 131 in 2021. Although the mean number of macroalgal taxa per station exhibited a slight increase (from 18.7 in 2011 to 21.0 in 2021) (Figure 4A), the mean number of sensitive taxa, which mainly colonized stations with Moderate–Good–High ecological conditions, approximately doubled (from 1.93 taxa in 2011 to 3.85 taxa in 2021, Kruskal–Wallis: p < 0.001, H = 0.157) (Figure 4B). Many taxa that were present only in a limited number of stations in 2011 progressively increased their spread in the following years while thionitrophilous algae such as Ulvaceae and Cladophoraceae decreased in both biomass and species number.
Similarly, the number of stations colonized by aquatic angiosperms increased from 24 in 2011 to 45 in 2018 and 2021. The total cover of angiosperms across all 87 stations changed from 20.5% to 34.6%, though this change was not statistically significant (Kruskal–Wallis: p < 0.05, H = 0.045) (Figure 4C,D).
Among them, N. noltei showed the highest increase in the number of colonized stations, rising from 4 in 2011 to 19 in 2021, with a significant increase (Kruskal–Wallis: p = 0.01, H = 0.050) in mean total cover, ranging from 2.64% in 2011 to 7.29% in 2021) (Figure 5).
Z. marina, although it colonized 12 new stations in 2021 (16 in 2011 and 28 in 2021), with a total mean cover ranging from 9.77% to 15.8% in 2018 and 13.0% in 2021, showed changes that were not significant (Kruskal–Wallis: p = 0.059, H = 0.015). Similarly, the increases in C. nodosa and R. cirrhosa were not significant. C. nodosa colonized 12–14 stations, with a cover ranging from 9.77% to 11.2% (Kruskal–Wallis: p = 0.793, H = 0.005), while R. cirrhosa colonized only 1–6 stations, with a cover increase ranging from 1.49% in 2011 to 2.33% in 2021 (Kruskal–Wallis: p = 0.254, H = 0.002) (Figure 5). However, R. cirrhosa, which in 2014 was present only in the modified Dogà and Cavallino fishing valleys, was subsequently recorded in the northern lagoon areas open to water tides (water body ER).
Figure 6 shows the mean values of some water parameters measured in the water column of the 87 stations that could affect the changes in macrophytes.
The mean Reactive Phosphorus (RP), the Dissolved Inorganic Nitrogen (DIN = sum of ammonium, nitrite, nitrate) concentrations, and the mean Total Suspended Solid (TSS) amounts showed significant changes (Figure 6). RP ranged from 0.14 µM in 2011 to 0.18 µM in 2021 (Kruskal–Wallis: p < 0.001, H = 0.108), and DIN from 11.5 µM in 2011 to 5.81 µM in 2021 (Kruskal–Wallis: p < 0.001, H = 0.263), with a minimum mean value (3.46 µM) in 2018. TSSs ranged from 38.8 mg L−1 in 2011 to 35.3 mg L−1 in 2021 (Kruskal–Wallis: p = 0.001, H = 0.062). The mean Chlorophyll-a (Chl-a) concentration also showed a significant increase, ranging from 0.71 µg L−1 in 2011 to 2.79 µg L−1 (Kruskal–Wallis: p < 0.001, H = 0.447), with a maximum value (3.80 µg L−1) in 2018.

4. Discussion

The ecological quality of many Italian TWSs has been assessed by studying the relationships between macrophytes, environmental parameters, nutrients, and pollutants since the last decades of the 20th century [22,23], particularly in the Venice Lagoon, the largest and most studied TWS in the Mediterranean Sea ([2,24] and references therein). Based on these studies, and in compliance with the requirements of the Water Framework Directive (WFD 2000/60/EC), the MaQI developed by [8] and references therein has been applied by the Italian Regional Agencies for Environmental Prevention and Protection (ARPAs) since the late 2000s. Although some data from other Italian lagoons are also available [25], the analyses conducted in the Venice Lagoon are the most comprehensive for evaluating changes in macrophyte assemblages triggered by various anthropogenic stressors. In fact, the results reported in this paper were obtained from numerous research projects and covered the entire lagoon from 2011 to 2021, representing nearly the totality of environmental conditions present in the main Italian TWSs [14]. The MaQI is capable of detecting significant changes in the lagoon’s ecological status. In particular, the variation in the number of sensitive macroalgae and the cover and spread of aquatic angiosperms are the core of the index. Indeed, small sensitive calcareous taxa (SCTs) of the genera Hydrolithon (Foslie) Foslie, Pneophyllum Kützing, and Melobesia J.V. Lamouroux are particularly well-suited for detecting environmental changes in all Italian TWSs [26]. These taxa are particularly affected by pH changes, which primarily result from fluctuations in trophic conditions. During the spring–summer macrophyte growth, the pH of the water column can rise to up to 9.5 in the presence of high biomasses of opportunistic macroalgae. However, when these collapse, the pH can drop to values close to or below 7.00. Under these conditions, SCTs are unable to survive and/or grow, while the presence of other sensitive macroalgae of larger sizes is hindered by the overgrowth of opportunistic species, such as Ulvaceae and/or Gracilariaceae, whose daily relative growth rate (RGR) can easily exceed 5% [27]. Moreover, the presence/absence and density of SCTs in the lives of aquatic angiosperms or on large macroalgal thalli can predict the evolution of the ecological status towards better or worse conditions. Results from previous studies ([28] and references therein) indicate that macroalgae are more efficient than aquatic angiosperms in detecting environmental changes. Indeed, in pristine or nearly pristine TWS conditions, SCTs and aquatic angiosperms are favored. As ecological conditions deteriorate, SCTs disappear before aquatic angiosperms. On the contrary, in areas lacking plants, SCTs appear first, followed by the recolonization of bottoms by aquatic angiosperms. This is because macroalgae spread via spores (30–60 µm) and small gametes (2–8 µm), behaving like phytoplankton, whereas aquatic angiosperms produce larger seeds (1–3 mm up to over 1 cm), which are more difficult to disperse. So, macroalgae can rapidly colonize new areas or disappear with changing ecological conditions within a few months, whereas angiosperms take a few years to do so. Furthermore, recolonization is nearly impossible or requires many years if there are no nearby plants to provide seeds.
For this reason, in the Venice Lagoon, the angiosperm repopulation was accelerated by the transplant of approx. 100,000 rhizomes, each with one or more leaf bundles as part of the Life SERESTO (LIFE12-NAT-IT-000331 [29] and Life LAGOON REFRESH (LIFE16-NAT-IT-000663 [30] projects. Over a period of 10 years, aquatic angiosperms repopulated approx. 20 km2 of the lagoon bottoms with dense populations. Similarly, transplants of aquatic angiosperms are currently underway in some lagoons of the Po Delta (Italy), in the Amvrakikos lagoons (Greece), and in the Mar Menor (Spain) as part of the Life project TRANSFER (LIFE19-NAT-IT-000264 [31]. Indeed, the presence of well-structured aquatic angiosperm populations supports faster environmental recovery by counteracting bottom erosion, trapping CO2, oxygenating the environment, creating ideal habitats for benthic macrofauna and fish fauna, and promoting traditional fishing and various recreational activities [32,33,34,35].
In the literature, many papers address the relationship between just a few macrophyte variables (i.e., species, spread, cover) and some environmental parameters [22,36,37,38,39], whereas, in previous papers by our research group ([8] and references therein), numerous correlations between macrophytes and water column and surface sediment parameters were analyzed simultaneously, leading to the development of the latest version of the MaQI. Subsequent studies, such as [28] and references therein, confirmed the strong positive correlation between the MaQI and some environmental parameters, especially water transparency, temperature, pH, salinity, and sediment grain size and density, along with an inverse correlation with nutrient and pollutant concentrations in the water column and surface sediments. Indeed, anthropogenic pressures, especially variations in pollutant and nutrient inputs, have a significant impact on phytoplankton and macroalgal biomass and ultimately on the change of the dominant species [36,38,40,41,42]. In the Venice Lagoon, pollutants such as organic contaminants [43], heavy metals [23], and nutrient concentrations ([28] and references therein), both in the water column and surface sediments, have been declining since the 1990s.
Moreover, other environmental impacts associated with aquaculture, such as the harvesting of the Manila clam Ruditapes philippinarum Adams and Reeve, have significantly reduced since the 2010s. As a result, the lagoon has shown progressive recovery with a reduction in nutrient concentration in both the water column and surface sediments and changes in primary production and macrophyte assemblages ([28] and reference therein). Data collected between 2011 and 2021 (Figure 6) show a significant decrease in Dissolved Inorganic Nitrogen (DIN), while phosphorus (RP) levels had already decreased in the previous decade. As a consequence, Chl-a concentrations increased, showing mean values close to those recorded before the period of intense clam harvesting and benthic vegetation changes. In particular, the percentage of sensitive macroalgae per station and the presence and cover of aquatic angiosperms nearly doubled. Among them, R. cirrhosa, which has disappeared from the open lagoon since the early 2000s [44], began recolonizing choked areas of the lagoon open to tidal exchanges in 2014. Additionally, N. noltei and Z. marina increased their presence in inner lagoon areas, which had previously been more affected by eutrophication phenomena. The MaQI highlighted the improvement in the conditions of WBs, particularly in the choked areas of the northern lagoon, where the ecological status increased by two ecological classes over ten years. However, in general, EQR increased in almost whole the WBs except in PR3, where it decreased slightly, although the water body’s ecological assessment remained Poor.
The ability of macroalgae to respond and adapt quickly to environmental stressors is demonstrated in several studies. Some authors [36] described the variation in macroalgal composition and structure along a gradient of nutrient enrichment coming from an urban sewage outfall. In this study, the authors reported that Ulva-dominated communities appeared close to the sewage outfall, whereas Corallina-dominated communities replaced Ulvaceae at intermediate levels of nutrient enrichment. Cystoseira-dominated communities thrived in the reference site and also in areas with nutrient levels threefold higher than those reported from unpolluted sites, decreasing along the gradient of nutrient enrichment. These authors found that the ecological status assessment based on indicator species had high correlations between species abundances and pollution levels, with good performance in water quality assessment. Another study [45] reported that changes in nutrient concentrations promote the production of nitric oxide, which triggers a fast sporulation of Ulva. As a result, Ulva thalli quickly occupied large areas of the sea, developing into green tides. Other authors [46] enhanced the role of other parameters, such as increased water turbidity, due to eutrophication in the Baltic Sea as the cause of the upward expansion of Fucus vesiculosus Linnaeus. Indeed, the lower limit of this alga had moved upwards from a maximum of 11.5 m in 1943/44 to 8.5 m in 1984.
Moreover, ref. [47] reported that ocean acidification and the increase in ultraviolet B (UVB) irradiance affect macroalgal physiology, life cycles, and community structure. The same authors showed that most of the examined macroalgae can respond quickly to global ocean warming and that slight warming can improve their growth rates. Conversely, [48,49] found that rising water temperatures were very deleterious for cold-loving macroalgae, especially some Phaeophyceae such as Fucales.
All of these studies confirm the key role of macrophytes in detecting environmental changes much more than the analysis of environmental parameters [7,8] or other biological elements [13]. Therefore, the assessment of species composition and biomass should be the primary approach when studying the ecological status of TWSs. In fact, a simple check on the presence/absence of aquatic angiosperms and sensitive species is sufficient for a rapid assessment of the ecological conditions of the environment.

Supplementary Materials

The following supporting information can be downloaded at: https://www.mdpi.com/article/10.3390/environments11090209/s1; Table S1: Macroalgae and scores of the Italian Transitional Systems (TWSs) according to the Macrophyte Quality Index (MaQI). Opportunistic taxa = score = 0; Indifferent taxa = score 1; Sensitive taxa = score 2. In blue score of sensitive taxa.

Author Contributions

Conceptualization, A.S.; methodology, A.S. and A.A.S.; validation, A.S.; formal analysis, A.B., Y.T., G.S., M.A.W. and A.A.S.; data curation, A.S. and A.A.S.; writing—original draft preparation, A.S.; writing—review and editing, A.B., Y.T., M.A.W., K.S., G.S. and A.A.S.; supervision—M.A.W., K.S. and A.A.S.; funding acquisition, A.S. All authors have read and agreed to the published version of the manuscript.

Funding

The research was in part supported by ARPA Veneto (Regional Agency for Environmental Prevention and Protection of Veneto) in the framework of Mo.V.Eco. I (CUP: J19E11002230002), Mo.V.Eco. II (J19G13001420002), Mo.V.Eco. III (CUP: J19I17000360002), and Mo.V.Eco IV (CUP: J19F18001050002) projects.

Data Availability Statement

The original contributions presented in the study are included in the article and Supplementary Material, further inquiries can be directed to the corresponding author.

Conflicts of Interest

The authors declare no conflicts of interest.

References

  1. Council Directive 92/43/EEC of 21 May 1992 on the Conservation of Natural Habitats and of Wild Fauna and Flora. Document 01992L0043-20130701. Available online: http://data.europa.eu/eli/dir/1992/43/2013-07-01 (accessed on 25 August 2024).
  2. European Parliament and Council Water Framework Directive, 2000/60/EC. of 23 October 2000 Establishing a Framework for Community Action in the Field of Water Policy. Document 32000L0060. Available online: http://data.europa.eu/eli/dir/2000/60/oj (accessed on 25 August 2024).
  3. Borja, Á. The European water framework directive: A challenge for nearshore, coastal and continental shelf research. Cont. Shelf Res. 2005, 25, 1768–1783. [Google Scholar] [CrossRef]
  4. Borja, Á.; Franco, J.; Valencia, V.; Bald, J.; Muxika, I.; Belzunce, M.J.; Solaun, O. Implementation of the European water framework directive from the Basque country (northern Spain): A methodological approach. Mar. Poll. Bull. 2004, 48, 209–218. [Google Scholar] [CrossRef] [PubMed]
  5. Borja, Á.; Josefson, A.B.; Miles, A.; Muxika, I.; Olsgard, F.; Phillips, G.; Rodrıguez, J.G.; Rygg, B. An approach to the intercalibration of benthic ecological status assessment in the North Atlantic ecoregion, according to the European Water Framework Directive. Mar. Poll. Bull. 2007, 55, 42–52. [Google Scholar] [CrossRef]
  6. Derolez, V.; Oheix, J.; Gimard, A.; Laugier, T. Indicateur Macrophytes Exclame Pour les Lagunes Poly-et eu-halines (EXamination Tool for Coastal LAgoon Macrophyte Ecological Status). IFREMER, Agence Frąncaise pour la Biodiversité. Ministère de l’Environnement. 2006. Available online: https://envlit.ifremer.fr/content/download/122599/file/MED-MET-Macrophytes.pdf (accessed on 24 June 2024).
  7. Orfanidis, S.; Panayotidis, P.; Ugland, K.I. Ecological Evaluation Index continuous formula (EEI-c) application: A step forward for functional groups, the formula and reference condition values. Mediterr. Mar. Sci. 2011, 12, 199–231. [Google Scholar] [CrossRef]
  8. Sfriso, A.; Facca, C.; Bonometto, A.; Boscolo, R. Compliance of the Macrophyte Quality index (MaQI) with the WFD (2000/60/EC) and ecological status assessment in transitional areas: The Venice lagoon as study case. Ecol. Indic. 2014, 46, 536–547. [Google Scholar] [CrossRef]
  9. Regione del Veneto. Monitoring Plan for the Venice Lagoon Pursuant to Directive 2000/60/EC Aimed at Defining the Ecological Status (Legislative Decree N. 152/2006 s.m.i). Line 2: EQB: Macrophytes, Mo.V.Eco. I. Final Report, 2012; pp. 23 + Tables and Figures. Available online: https://bur.regione.veneto.it/BurvServices/Pubblica/DettaglioDecreto.aspx?id=294424&highlight=true (accessed on 25 June 2024).
  10. Regione del Veneto. Monitoring Plan for the Venice Lagoon Pursuant to Directive 2000/60/EC Aimed at Defining the Ecological Status (Legislative Decree N. 152/2006 s.m.i). EQB: Macrophytes, Mo.V.Eco. II. Final Report, 2015; pp. 27 + Tables and Figures. Available online: https://bur.regione.veneto.it/BurvServices/Pubblica/DettaglioDecreto.aspx?id=379241&highlight=true (accessed on 17 September 2024).
  11. Regione del Veneto. Monitoring Plan for the Venice Lagoon Pursuant to Directive 2000/60/EC Aimed at Defining the Ecological Status (Legislative Decree N. 152/2006 s.m.i). EQB: Macrophytes, Mo.V.Eco. III. Final Report, 2019; pp. 26 + Tables and Figures. Available online: https://bur.regione.veneto.it/BurvServices/Pubblica/DettaglioDecreto.aspx?id=367174 (accessed on 17 September 2024).
  12. Regione del Veneto. Monitoring Plan for the Venice Lagoon Pursuant to Directive 2000/60/EC Aimed at Defining the Ecological Status (Legislative Decree N. 152/2006 s.m.i). EQB: Macrophytes- Mo.V.Eco. IV, Final Report, 2022; pp. 19 + Tables and Figures. Available online: https://bur.regione.veneto.it/BurvServices/Pubblica/DettaglioDecreto.aspx?id=386914 (accessed on 17 September 2024).
  13. Sfriso, A.; Buosi, A.; Tomio, Y.; Juhmani, A.-S.; Facca, C.; Wolf, M.; Sfriso, A.A.; Franzoi, P.; Scapin, L.; Bonometto, A.; et al. Environmental restoration by aquatic angiosperm transplants in transitional water systems: The Venice Lagoon as a case study. Sci. Total Environ. 2021, 795, 148859. [Google Scholar] [CrossRef]
  14. Sfriso, A.; Buosi, A.; Facca, C.; Sfriso, A.A. Role of environmental factors in affecting macrophyte dominance in transitional environments: The Italian Lagoons as a study case. Mar. Ecol. 2017, 38, e12414. [Google Scholar] [CrossRef]
  15. Short, F. World Atlas of Seagrasses; University of California Press: Berkeley, CA, USA, 2003; p. 332. [Google Scholar]
  16. Guiry, M.D.; Guiry, G.M. AlgaeBase. World-Wide Electronic Publication, University of Galway. Available online: https://www.algaebase.org (accessed on 16 August 2024).
  17. ISPRA (Istituto Superiore per la Protezione e la Ricerca Ambientale). Implementazione della Direttiva 2000/60/EC. Linee Guida per L’applicazione del Macrophyte Quality Index (MaQI); TW—Sistema di Classificazione Ecologica—Macrofite; ISPRA: Roma, Italy, 2014; p. 30. [Google Scholar]
  18. Mellors, J.E. An evaluation of a rapid visual technique for estimating seagrass biomass. Aquat. Bot. 1991, 42, 67–73. [Google Scholar]
  19. Hebert, P.D.; Cywinska, A.; Ball, S.L.; deWaard, J.R. Biological identifications through DNA barcodes. Proc. Biol. Sci. 2003, 270, 313–321. [Google Scholar] [CrossRef]
  20. Strickland, J.D.H.; Parsons, T.R. A Practical Handbook of Seawater Analyses, 2nd ed.; Bulletin of Fishery Research Board of Canada: Ottawa, Canada, 1984; pp. 1–310. [Google Scholar]
  21. Lorenzen, C.J. Determination of Chlorophyll and Phaeopigments: Spectrophotometric Equations. Limnol. Oceanogr. 1967, 12, 343–346. [Google Scholar] [CrossRef]
  22. Chapman, A.R.O.; Craigie, J.S. Seasonal growth in Laminaria longicruris: Relations with dissolved inorganic nutrients and internal reserves of nitrogen. Mar. Biol. 1977, 40, 197–205. [Google Scholar] [CrossRef]
  23. Bellucci, L.G.; Frignani, M.; Paolucci, D.; Ravanelli, M. Distribution of heavy metals in sediments of the Venice Lagoon: The role of the industrial area. Mar. Pollut. Bull. 2002, 40, 65–76. [Google Scholar] [CrossRef]
  24. Bernardello, V.; Bonometto, A.; Boscolo Brusà, R.; Cacciatore, F.; Oselladore, F.; Ponis, E. Transitional Waters—Biological Quality Element Macrophytes MaQI-TW (Acque di Transizione-Elemento Qualità Biologica Macrofite MaQI-TW. ISPRA). On line Data Sheet Update 2023. Available online: https://indicatoriambientali.isprambiente.it/it/acque-marino-costiere-e-transizione/acque-di-transizione-elemento-di-qualita-biologica-macrofite-maqi-tw (accessed on 4 September 2024).
  25. Cecere, E.; Petrocelli, A.; Izzo, G.; Sfriso, A. Flora and Vegetation of the Italian Transitional Water Systems; CoRiLa, Multigraf: Spinea, Italy, 2009; p. 278. [Google Scholar]
  26. Sfriso, A.; Buosi, A.; Wolf, M.A.; Sciuto, K.; Molinaroli, E.; Mistri, M.; Munari, C.; Moro, I.; Sfriso, A.A. Microcalcareus seaweeds a sentinel of trophic changes and CO2 trapping in transitional waters. Ecol. Indic. 2020, 118, 1–10. [Google Scholar] [CrossRef]
  27. Le, B.; Shin, J.A.; Kang, M.-G.; Sun, S.; Yang, S.H.; Chung, G. Enhanced growth rate and ulvan yield of Ulva pertusa using light-emitting diodes (LEDs). Aquacult. Int. 2018, 26, 937–946. [Google Scholar] [CrossRef]
  28. Sfriso, A.; Buosi, A.; Sciuto, K.; Wolf, M.; Tomio, Y.; Juhmani, A.-S.; Sfriso, A.A. Effect of ecological recovery on macrophyte dominance and production in the Venice Lagoon. Front. Mar. Sci. 2022, 9, 882463. [Google Scholar] [CrossRef]
  29. Life SERESTO. Habitat 1150* (Coastal Lagoon) Recovery by SEagrass RESTOration. A New Strategic Approach to Meet HD & WFD Objectives. LIFE12-NAT-IT-000331. Available online: https://una.city/nbs/venezia/life-seagrass-restoration (accessed on 25 June 2024).
  30. Life LAGOON REFRESH. Coastal Lagoon Habitat (1150*) and Species Recovery by Restoring the Salt Gradient Increasing Fresh Water Input. LIFE16-NAT-IT-000663. Available online: www.lifelagoonrefresh.eu (accessed on 25 June 2024).
  31. Life TRANSFER. Seagrass Transplantation for Transitional Ecosystem Recovery. LIFE19-NAT-IT-000264. Available online: www.lifetransfer.eu (accessed on 25 June 2024).
  32. Boström, C.; Jackson, E.L.; Simenstad, C.A. Seagrass landscapes and their effects on associated fauna: A review. Estuar. Coast. Shelf Sci. 2006, 68, 383–403. [Google Scholar] [CrossRef]
  33. Bos, A.R.; Bouma, T.J.; de Kort, G.L.J.; van Katwijk, M.M. Ecosystem engineering by annual intertidal seagrass beds: Sediment accretion and modification. Estuar. Coast. Shelf Sci. 2007, 74, 344–348. [Google Scholar] [CrossRef]
  34. Duarte, C.M.; Sintes, T.; Marbà, N. Assessing the CO2 capture potential of seagrass restoration projects. J. Appl. Ecol. 2013, 50, 1341–1349. [Google Scholar] [CrossRef]
  35. Ondiviela, B.; Losada, I.J.; Lara, J.L.; Maza, M.; Galván, C.; Bouma, T.J.; van Belzen, J. The role of seagrasses in coastal protection in a changing climate. Coast. Eng. 2014, 87, 158–168. Available online: https://www.sciencedirect.com/journal/coastal-engineering (accessed on 25 June 2024). [CrossRef]
  36. Arévalo, R.; Pinedo, S.; Ballesteros, E. Changes in the composition and structure of Mediterranean rocky-shore communities following a gradient of nutrient enrichment: Descriptive study and test of proposed methods to assess water quality regarding macroalgae. Mar. Pollut. Bull. 2007, 55, 104–113. [Google Scholar] [CrossRef]
  37. Ramos, J.B.E.; Schulz, K.G.; Voss, M.; Narciso, A.; Müller, M.N.; Reis, F.V.; Cachão, M.; Azeve, E.B. Nutrient-specific responses of a phytoplankton community: A case study of the North Atlantic Gyre. J. Plankton Res. 2017, 39, 744–761. [Google Scholar] [CrossRef]
  38. Kautsky, L.; Kautsky, H. Algal species diversity and dominance along gradients of stress and disturbance in marine environments. Vegetatio 1989, 83, 259–267. [Google Scholar] [CrossRef]
  39. Kornfeldt, R.A. Relation between nitrogen and phosphorus content of macroalgae and the waters of northern Oresund. Bot. Mar. 1982, 25, 197–201. [Google Scholar]
  40. Rijstenbil, J.W.; Haritonidis, S. Macroalgae, Eutrophication and Trace Metal Cycling in Estuaries and Lagoons; Thessaloniki, Greece. Symposium Proceedings Sub Group III, Action COST-48 (Aquatic Primary Biomass-Marine Macroalgae. Commission of the European Communities; BRIDGE—DG XII; Brussels, Belgium NIOPO-CEMO, Yerseke, The Netherlands, 1993; p. 167.
  41. Schramm, W.; Nienhuis, P.H. Marine Benthic Vegetation: Recent Changes and the Effects of Eutrophication; Springer: Berlin, Germany, 1996; Volume 123, p. 470. [Google Scholar]
  42. Valiela, I.; McClelland, J.; Hauxwell, J.; Behr, P.J.; Hersh, D.; Foreman, K. Macroalgal blooms in shallow estuaries: Controls and ecophysiological and ecosystem consequences. Limnol. Oceanogr. 1997, 42, 1105–1118. [Google Scholar] [CrossRef]
  43. Cassin, D.; Dominik, J.; Botter, M.; Zonta, R. PAH and PCB contamination in the sediments of the Venice Lagoon (Italy) before the installation of the MOSE flood defence works. Environ. Sci. Pollut. Res. Int. 2018, 25, 24951–24964. [Google Scholar] [CrossRef]
  44. Mannino, A.M.; Menéndez, M.; Obrador, B.; Sfriso, A.; Triest, L. The genus Ruppia L. (Ruppiaceae) in the Mediterranean region: An overview. Aquat. Bot. 2015, 124, 1–9. [Google Scholar] [CrossRef]
  45. Wang, H.; Wang, G.; Gu, W. Macroalgal blooms caused by marine nutrient changes resulting from human activities. J. Appl. Ecol. 2020, 57, 766–776. [Google Scholar] [CrossRef]
  46. Kautsky, N.; Kautsky, H.; Kautsky, U.; Waern, M. Decreased depth penetration of Fucus vesiculosus (L.) since the 1940’s indicates eutrophication of the Baltic Sea. Mar. Ecol. Prog. Ser. 1986, 28, 1–8. [Google Scholar] [CrossRef]
  47. Ji, Y.; Xu, Z.; Zou, D.; Gao, K. Ecophysiological responses of marine macroalgae to climate change factors. J. Appl. Phycol. 2016, 28, 2953–2967. [Google Scholar] [CrossRef]
  48. Mota, C.F.; Engelen, A.H.; Serrao, E.A.; Pearson, G.A. Some don’t like it hot: Microhabitat-dependent thermal and water stresses in a trailing edge population. Funct. Ecol. 2015, 29, 640–649. [Google Scholar] [CrossRef]
  49. Wilson, K.L.; Kay, L.M.; Schmidt, A.L.; Lotze, H.K. Effects of increasing water temperatures on survival and growth of ecologically and economically important seaweeds in Atlantic Canada: Implications for climate change. Mar. Biol. 2015, 162, 2431–2444. [Google Scholar] [CrossRef]
Figure 1. Map of the Venice Lagoon.
Environments 11 00209 g001
Figure 2. Macroalgal Quality Index (MaQI) scheme to assess the ecological status of transitional water systems (TWSs). As indicated by the Water Framework Directive (WFD 2000/60/EC) the Ecological Quality Ratio (EQR) values are highlighted in red (Bad conditions), ochre (Poor conditions), yellow (Moderate conditions), green (Good conditions) and light blue (High conditions).
Environments 11 00209 g002
Figure 3. Ecological Quality Ratio (EQR) changes determined by the Macrophyte Quality Index (MaQI) in the water bodies (WBs) of the Venice Lagoon from 2011 to 2021. Legend: DV = Dogà Valley; CV = Cavallino Valley; ZV = Zappa Valley; ER = Euryhaline Restricted; ENR = Euryhaline Non-Restricted; PR = Polyhaline Restricted; PNR = Polyhaline Non-Restricted.
Environments 11 00209 g003
Figure 4. Changes in (A) the mean number of total macroalgal taxa per station; (B) the mean number of sensitive macroalgal taxa per station; (C) the total number of stations colonized by aquatic angiosperms; (D) the mean percentage of aquatic angiosperm cover in the total stations during the 4 sampling years.
Environments 11 00209 g004
Figure 5. (A) Number of colonized stations by each angiosperm species; (B) total mean cover of each angiosperm in the 87 stations between 2011 and 2021.
Environments 11 00209 g005
Figure 6. (A) Mean values of Reactive Phosphorus (RP); (B) Dissolved Inorganic Nitrogen (DIN = sum of ammonium, nitrite, nitrate); (C) Total Chlorophyll-a (Chl-a); and (D) Total Suspended Solids (TSSs) in the 87 stations between 2011 and 2021.
Environments 11 00209 g006
Table 1. Comparison of the mean Macroalgal Quality Index (MaQI) Ecological Quality Ratios (EQRs) in the period 2011–2021 determined for the 11 unmodified water bodies (WBs) for the 2 highly modified WBs and for all the stations. Significant values (p < 0.05, H) were determined by the application of the Kruskal–Wallis test (p < 0.05, H) for non-normal data and one-way ANOVA (p < 0.05, F) for normally distributed data. NS = not significant. In the last column, significant values are in blue.
MaQI EQR Changes
Ecological Quality Ratio (EQR)
Water BodiesStation Number2011201420182021Difference 2021–2011Kruskal–Wallis Test 2011–2021
UnmodifiedEuryhaline RestrictedER130.4080.6310.8540.8120.404p < 0.001, H = 0.516
Euryhaline Non-Restricted 1ENR1210.7210.7690.7690.8710.150NS: p = 0.082, H = 0.051
Euryhaline Non-Restricted 2ENR270.4790.6290.7140.6710.192NS: p = 0.235, F = 1.560
Euryhaline Non-Restricted 3ENR330.4170.4830.7500.7830.366NS: p = 0.072. H = 0.058
Euryhaline Non-Restricted 4ENR4100.5200.4900.5300.6150.095NS: p = 0.263, H = 0.014
Polyhaline Restricted 1PR160.3170.2920.5330.4670.150NS: p = 0.295, H = 0.010
Polyhaline Restricted 2PR240.3250.3500.3750.6250.300p < 0.05, H = 0.816
Polyhaline Restricted 3PR330.3170.3170.3500.5500.233NS: p = 0.369, H = 0.048
Polyhaline Restricted 4PR430.3170.3170.3170.283−0.033NS: p = 0.456, H = 0.111
Polyhaline Non-Restricted 1PNR150.3300.3500.3300.3500.020NS: p = 0.317, H < 0.001
Polyhaline Non-Restricted 2PNR290.2610.3500.3940.4060.144NS: p = 0.266, H = 0.015
ModifiedZappa ValleyZV10.2500.2500.2500.2500NS: p = 0.317, H < 0.001
Dogà Valley, Cavallino ValleyDV-CV20.9250.9250.9250.9250NS: p = 0.266, H = 0.015
Means of all stations870.4590.5420.6200.6580.199p < 0.001, H = 0.100
Means of the 11 unmodified water bodies0.4010.4530.5380.5850.184NS: p = 0.077, H = 0.089
Disclaimer/Publisher’s Note: The statements, opinions and data contained in all publications are solely those of the individual author(s) and contributor(s) and not of MDPI and/or the editor(s). MDPI and/or the editor(s) disclaim responsibility for any injury to people or property resulting from any ideas, methods, instructions or products referred to in the content.

