Article

The Dynamics of the Concentration and Speciation of Arsenic in Private Drinking Water Wells in Eastern Wisconsin, USA

1
Department of Geosciences, University of Wisconsin–Milwaukee, Milwaukee, WI 53201, USA
2
Department of Civil and Environmental Engineering, University of Wisconsin–Milwaukee, Milwaukee, WI 53201, USA
*
Authors to whom correspondence should be addressed.
Environments 2024, 11(4), 75; https://doi.org/10.3390/environments11040075
Submission received: 7 March 2024 / Revised: 29 March 2024 / Accepted: 4 April 2024 / Published: 9 April 2024

Abstract

:
About 2.5 billion people rely on groundwater as their main drinking water source, and arsenic pollution within the groundwater system can cause serious short- and long-term health issues. Within the natural environment, arsenic generally exists as oxyanions which have two oxidation states, As(III) and As(V). Under ambient pH conditions, As(V) is primarily present as an anion (i.e., H2AsO4) while As(III) tends to be uncharged (i.e., H3AsO3), making it much more difficult to remove As(III) through existing treatment techniques such as adsorption and reverse osmosis (RO). In Eastern Wisconsin, the dolomite and dolomite/sandstone aquifers represent a major drinking water source and high arsenic concentrations have been observed. Previous studies showed that arsenic can be released into private drinking water wells due to the oxidation of sulfide-bearing minerals with arsenic impurities that are usually dispersed within the dolomite and sandstone bedrock. However, there is a lack of information on the concentrations of each arsenic species as well as arsenic dynamics during water pumping/usage. The primary goals of this research were (1) to quantify the baseline concentrations of each arsenic species within selected Eastern Wisconsin private drinking water wells, and (2) to determine how the arsenic concentrations and species could be affected by continuous water usage. Our results showed that As(III) was the dominant species of arsenic, and during continuous water usage, there could be an upward trend in arsenic concentration (there was minimal change in arsenic speciation). Upon the completion of water pumping, arsenic concentrations decreased over time and returned to pre-pumping levels. Our findings highlighted the importance of quantifying the speciation and dynamics of arsenic during water use to the assessment of public health risks and the design of appropriate water treatment techniques.

1. Introduction

About 2.5 billion people rely on groundwater as the main drinking water source [1] and there are growing concerns about the public health risks associated with groundwater contamination [2]. Arsenic is a common constituent in many groundwater systems throughout the world and when used as a drinking water source, arsenic contamination in groundwater can cause various short- and long-term health effects in humans such as cardiovascular disease, blood disorders, gastrointestinal complications, neurologic disorders, pulmonary disease, renal failure, skin lesions, and cancer [3,4]. Within the natural environment, arsenic generally exists as oxyanions which have two oxidation states, As(III) (arsenite) and As(V) (arsenate) [2]. Under circumneutral groundwater conditions (e.g., pH ~ 7), As(V) is primarily present as an anion (i.e., H2AsO4) while more than 99% of As(III) will be uncharged (i.e., H3AsO3 or As(OH)3), making it much more difficult for As(III) to be removed from water [5]. Walker et al. [6] demonstrated that while >95% of As(V) could be removed through reverse osmosis (RO), the removal efficiency was generally <45% when more than 50% of the arsenic exists as As(III). Additionally, As(III) is considered to be more toxic than As(V) [7,8,9,10,11]. Many factors can contribute to the higher toxicity of As(III). Generally, the ingested arsenic will be taken up in the intestine and transported to the liver, where arsenic can be transformed through different metabolic pathways [12]. It was reported that As(V) needs to be reduced to As(III) to be taken up by the cells [8]. As(III) also exhibited higher affinity to sulfhydryl groups, making it more reactive with human tissues [13]. Additionally, it was observed that As(III) could be methylated into monomethylarsonous acid (MMAIII), which was highly toxic to human hepatocytes, and the order of toxicity was MMAIII > As(III) > As(V) [14].
In the United States, the current maximum contaminant limit (MCL) for arsenic in public drinking water is 10 µg/L. Households that rely on private domestic wells, however, are responsible for testing their own drinking water and are often unaware of the associated health risks. A study by the United States Geological Survey (USGS) estimated that 44 million people in the United States use private domestic wells for their drinking water and 2.1 million of those people are affected by arsenic concentrations above the MCL [15]. Surveys on private well arsenic concentrations within the state of Wisconsin revealed that arsenic concentrations in many private wells were above 10 µg/L, and several wells exhibited concentrations exceeding 1000 µg/L [16,17,18,19].
In Eastern Wisconsin, there are four major aquifer systems (from top to bottom): the surface sand and gravel aquifer, the dolomite aquifer, the dolomite and sandstone aquifer, and the crystalline bedrock aquifer [20]. Both the dolomite aquifer and the underlying dolomite and sandstone aquifer contain sulfide-bearing minerals such as pyrite and marcasite, which in turn can contain up to 1% (weight) of arsenic impurities [16,21,22,23,24]. The introduction of oxygen into the borehole could lead to the oxidative dissolution of the sulfide-bearing minerals, which subsequently could result in high arsenic concentration in the well water [21,25,26]. Additionally, Fe(II) released during the dissolution of sulfide minerals could be slowly oxidized into iron (oxy)hydroxide, which can serve as adsorbents for arsenic. The oxidation of As(III) to As(V), however, was slow as compared to the oxidative dissolution of the sulfide-containing minerals, and As(III) was the dominant form of arsenic [16]. In this case, the reduction of iron (oxy)hydroxide under reducing conditions was reported to release arsenic within the groundwater system [16,21,25,26]. Within this region, there were also substantial variations in the distribution of arsenic within the aquifer materials. As a result, it was reported that under non-pumping conditions, there were marked variations in aqueous arsenic concentrations, which were found to be closely related to arsenic concentrations in the aquifer materials [25].
Although several previous studies have quantified arsenic concentrations within the dolomite aquifer in Eastern Wisconsin, there is a lack of investigations into arsenic speciation (e.g., As(III) or As(V)) as well as the temporal dynamics of arsenic concentrations within private drinking water wells, particularly during continuous water usage, which is essential to the assessment of public health risks and the design and implementation of appropriate arsenic removal techniques. To fill this knowledge gap, we selected eleven private drinking water wells in Eastern Wisconsin and determined the concentrations of arsenic, As(III) and As(V). Additionally, we investigated the dynamics of arsenic concentrations and speciation in six of the eleven private drinking water wells when there was continuous water usage.

2. Study Area and Method

2.1. Study Area

This study was initiated by carefully examining the local geology and identifying areas where (1) there was a lack of information on arsenic in groundwater and private drinking water wells, and (2) arsenic concentrations could be potentially high. From the selected areas (Figure S1 in Supplementary Materials), we contacted ~40 randomly selected property owners to seek their permission for well access and water sampling. Based on the responses that we received from the property owners, eleven private drinking water wells were selected for this research, and water samples were collected to quantify total arsenic concentrations, as well as concentrations of As(III) and As(V), respectively (Table 1 and Figure S1). Due to changes in the permission that we received from the property owners of the eleven private drinking water wells, the dynamics of arsenic concentrations and speciation during continuous water usage were investigated for six (W1 to W6) of the eleven private drinking water wells.
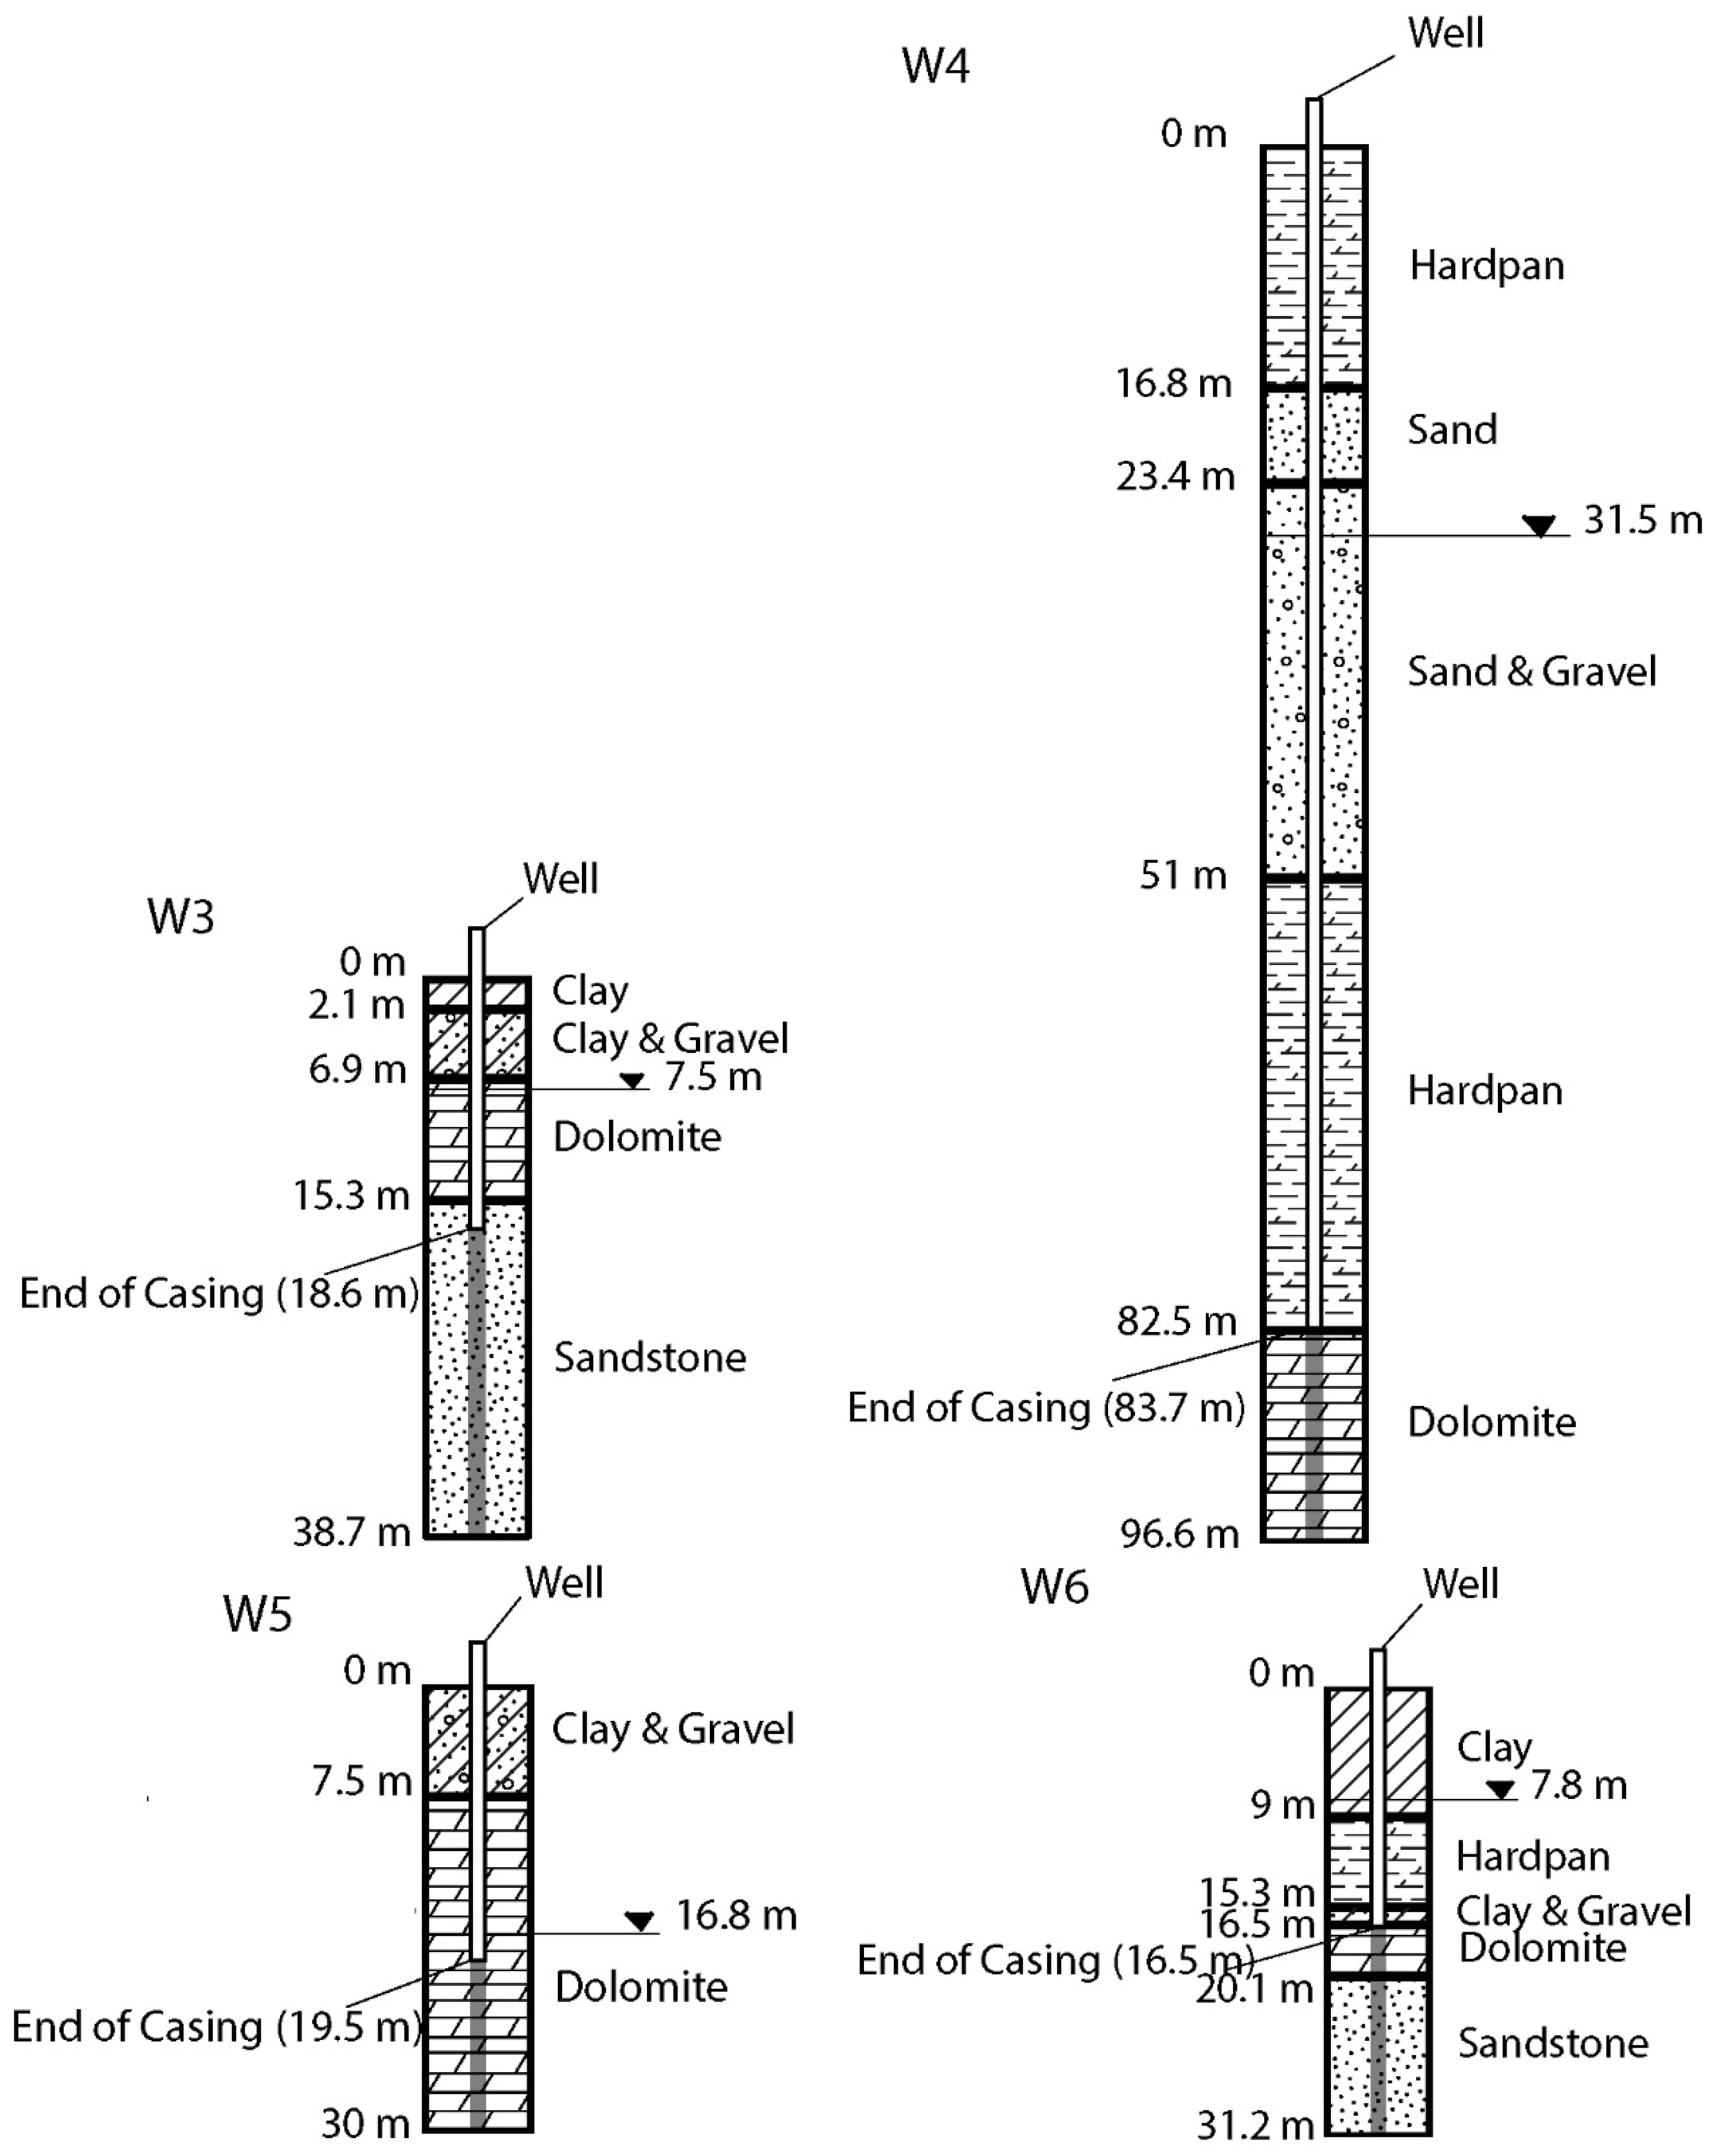
The well-boring log reports are included in Figure 1 (W1–W6) and Figure S2 (W7–W11). As can be seen from the well boring logs, the depth of the wells ranged from 30 m to 96.6 m beneath the ground surface (bgs), and the static water level varied between 7.5 m and 31.5 m bgs. All wells were screened within the dolomite and sandstone aquifer.
Previous studies on the distribution and behavior of arsenic within the dolomite and sandstone showed that there was a minimal amount of arsenic within the quartz (of the sandstone) and dolomite fractions [16]. However, experimental results of acid digestion, X-ray analysis, Raman spectroscopy, and electron probe micro analysis (EPMA) clearly indicated the presence of arsenic in sulfide minerals such as pyrite and marcasite which could occur as dispersed grains, veins, and nodules within both the dolomite and sandstone [16]. Additionally, the sulfide-bearing minerals could occur as a discrete horizon which is often known as the sulfide cement horizon (SCH) [16,25]. Geographically, SCH could be found across Eastern Wisconsin from the Illinois border in the south to the Michigan border in the north [22]. Stratigraphically, SCH could exist as a thin and distinct layer between the dolomite and sandstone [25]. As a result, high arsenic concentrations in private well water were often found in regions where SCH and water table intersect [27]. A few studies showed that exposure of the sulfide-bearing, arsenic-enriched minerals to an oxygenated environment could lead to the rapid release of arsenic into aqueous phase [26,27]. Among the 11 private wells selected for this study, four wells (W3, W6, W10, and W11) are cased across the dolomite and sandstone aquifers, which potentially could include the SCH.

2.2. Well Water Sampling

The private wells were first sampled in March 2019 to test for background arsenic concentrations and speciation following protocols that were established by the Wisconsin Department of Natural Resources (WDNR) [28,29]. Similar sampling procedures have also been used for arsenic investigations in other parts of the United States [30]. Briefly, water samples were collected early in the morning prior to any substantial water use within the household. During the sampling event, water was extracted from a spigot before the inlet to the water storage tank, usually located in the property’s basement, directly linked to the well to ensure that the water sample was unaltered by any household filtration systems (Figure S3) [30]. Before the sample was collected, the water from the holding tank was drained, and water samples were collected using 250 mL polyethylene (PE) bottles from the spigots (located before the storage tank) once the pump began to run [28,29]. Water quality parameters, including pH, temperature, and specific conductivity, were determined during this event using a calibrated YSI Professional Plus multiparameter probe. The alkalinity of one water sample at each site was immediately quantified through acid titration using a Hach digital titrator test kit following Hach method 8203. The concentrations of major cations (Ca2+, Mg2+, K+, and Na+) in the well water were determined using inductively coupled plasma mass spectrometry (ICP-MS) (Thermo Scientific Element 2/XR, Waltham, MA, USA). The concentrations of major anions (Cl, NO3, PO43−, and SO42−) were measured using high performance liquid chromatography (HPLC) equipped with a conductivity detector (Dionex ICS-1000, Sunnyvale, CA, USA). The collected water samples were immediately returned to the laboratory for the analysis of total arsenic, As(III) and As(V).
To investigate the potential fluctuations in arsenic concentrations and speciation during typical water pumping/usage, a second round of well water sampling was carried out around June 2019. As previously explained, only 6 wells (W1–W6) were sampled in this round. The time zero water samples were collected using 250 mL PE bottles in a similar fashion as round 1. Water samples were then collected every 20 min for a total of 1 h during continuous pumping. It was observed that the pumping rate for each well was pre-set by the maintenance contractor and varied slightly from one well to another usually based on building footage and the size of water storage tanks. The actual flow rates were thus determined by timing how long it took to fill up a 20 L bucket. The measured flow rates varied between 16 and 20 L per minute.
A third round of sampling was conducted in August 2019 at two locations (i.e., wells W5 and W6) based on the analysis of arsenic concentration/speciation dynamics. In addition to water sample collection during water pumping, water samples were also collected after pumping had ceased to examine the evolution of arsenic concentrations and speciation following water pumping. The final round of water sampling also involved locations W5 and W6. They were re-sampled in October 2019 to check whether the results obtained during the third round of sampling were reproducible.

2.3. The Determination of Total Arsenic Concentrations and Arsenic Speciation

The water samples were placed in a cooler with ice and upon return to the laboratory, arsenic concentrations were determined using inductively coupled plasma mass spectrometry (ICP-MS) following the EPA standard method 200.8 [31]. The limit of detection (LOD) for arsenic concentrations was determined to be 0.1 µg/L. The quality assurance/quality control (QA/QC) procedures included periodic analysis of laboratory reagent blanks, standard arsenic solutions, and calibration solutions [31,32]. For the determination of As(V) and As(III) concentrations, an anion-exchange method modified from previous studies was used [32,33]. Briefly, anion-exchange resin (100–200 mesh, AG 1-X8 from Bio-Rad, Hercules, CA, USA) was first treated with 1 M of NaOH and 1 M of acetic acid, respectively. One gram of treated resin was then wet-packed in chromatography columns (Bio-Rad, Hercules, CA, USA). An aliquot of a groundwater sample was adjusted to a pH of 6 and passed through the anion-exchange resin columns. At pH 6, As(V) is primarily present as an anion (i.e., H2AsO4), while As(III) is not charged (i.e., H3AsO3). As a result, the neutral As(III) species could pass through the column while the anionic As(V) species would be retained within the resin column. Samples before (influent) and after (effluent) column separation were acidified to 1–2% HNO3 for determination of total arsenic and As(III) concentrations, respectively. As(V) concentrations were determined as the difference between total arsenic and As(III) concentrations. This method was validated using a standard addition test of As(III), As(V), and mixtures of As(III) and As(V) samples with predetermined concentrations [32,33].

3. Results and Discussion

3.1. Water Chemistry and Arsenic Concentrations and Speciation

The pH of the well water was generally near or above 7.0 but below 8.0 (Table S1). The water temperature varied between 10.85 and 13.40 °C, which is consistent with groundwater aquifers in the state of Wisconsin [34]. Because the wells were all screened within the dolomite/sandstone formation, the cations in the well water were dominated by Ca2+ and Mg2+ presumably originating from the dissolution of carbonate minerals such as dolomite, while the concentrations of K+ and Na+ were one order of magnitude lower (Table S1). For the major anions, the concentrations of bicarbonate ranged from 206 to 651 mg/L, while the concentrations of nitrate and phosphate were generally below the detection limit. The concentrations of chloride and sulfate were generally 1–2 orders of magnitude lower than that of bicarbonate and exhibited significant variations. For instance, the sulfate concentration in well W5 was 2.16 mg/L, while its concentration in W7 was 117.72 mg/L. Overall, the measured well water chemistry was within the range that was typically observed in Wisconsin [34].
The specific conductivity of the groundwater samples ranged from ~333 µS/cm to ~1415 µS/cm (Table S1). The specific conductivity of a water sample reflects its ability to conduct an electric current, and because the concentrations of charged ionic species in the water make it more conductive, specific conductivity can provide a semi-quantitative measure of ion concentration in the water [35]. An empirical coefficient, K, can be used to estimate total ion concentrations from measured specific conductivity values and the value of K mostly ranges between 0.55 and 0.75 [35]. In this research, when the concentrations of major ions were combined, it was found that the average ratio between the total measure ion concentrations (mg/L) and specific conductivity (µS/cm) was 0.59, well within the empirical range of K values, suggesting that there was good consistency between the measured major ion concentrations and the spcific conductivity values.
Because the arsenic-containing sulfide minerals represent major sources of arsenic in the private wells, the measured Eh values of the well water were generally negative, suggesting reducing redox conditions (Table S1). The range of the Eh values was −223.80 mV (well W3) to −303.15 mV (well W5). The observed Eh values were consistent with measurements obtained from research wells located in Northeastern Wisconsin [25].
The concentrations and speciation of arsenic are presented in Table 2. For most of the selected wells, the total arsenic concentrations exceeded the MCL, and the highest observed arsenic concentration was 764.83 µg/L (well W10). The property owner of this private well quickly switched to alternative water sources after learning that the arsenic concentration in the well water was >76 times higher than the MCL. The quantification of arsenic speciation indicated that, except for well W9, the reduced form of arsenic, As(III), accounted for more than 50% of total arsenic. In a previous study, Sorg et al. examined the spatial variations in arsenic concentration and speciation across the United States and reported that As(III) was the primary form of arsenic in 28 out of 65 wells. Particularly, As(III) was the primary species in the Upper Midwest region (including 1 sample collected in Wisconsin). It was also reported that As(III) accounted for >87.5% of total arsenic in a research well drilled in Northeastern Wisconsin [25]. For wells W1 to W6, we performed two rounds of water sampling, and consistent results were observed in terms of both arsenic concentration and speciation (Table 2).
Four out of eleven wells (i.e., wells W3, W6, W10, and W11) are cased across the dolomite and sandstone aquifers which could include the SCH (Figure 1 and Figure S2). Our observations showed that wells W10 and W11 contained the highest levels of arsenic (i.e., 764.83 and 51.17 µg/L, respectively), which confirmed that SCH could lead to high arsenic concentrations in private well water [27].
Shafer et al. performed a meta-analysis of groundwater geochemical data and tested their association with both total arsenic concentrations and the fractions of As(III) using multivariate statistical methods, and the findings indicated that most geochemical factors (e.g., pH, Ca2+, or SO42− concentrations) were not strongly correlated with total arsenic concentrations or As(III) fractions, except for redox conditions, which could explain a large fraction of the variance in the measured fractions of As(III) [36]. In this research, our results also showed insignificant correlations between water chemistry parameters such as pH or sulfate concentrations with total arsenic concentrations or arsenic fraction values. Linear regression analyses between pH and sulfate concentrations with total arsenic concentrations showed that the R2 values were 0.06 and 0.03, respectively. Additionally, no strong correlation was observed between the measured As(III) fractions and Eh values (R2 = 0.001). The lack of correlations between groundwater geochemical factors and arsenic concentrations and speciation reflected the strong spatial variations in arsenic distribution and behavior within Eastern Wisconsin and could pose challenges in attempts to model and predict arsenic contamination in private wells.

3.2. Dynamics of Arsenic Concentrations and Speciation during Well Pumping

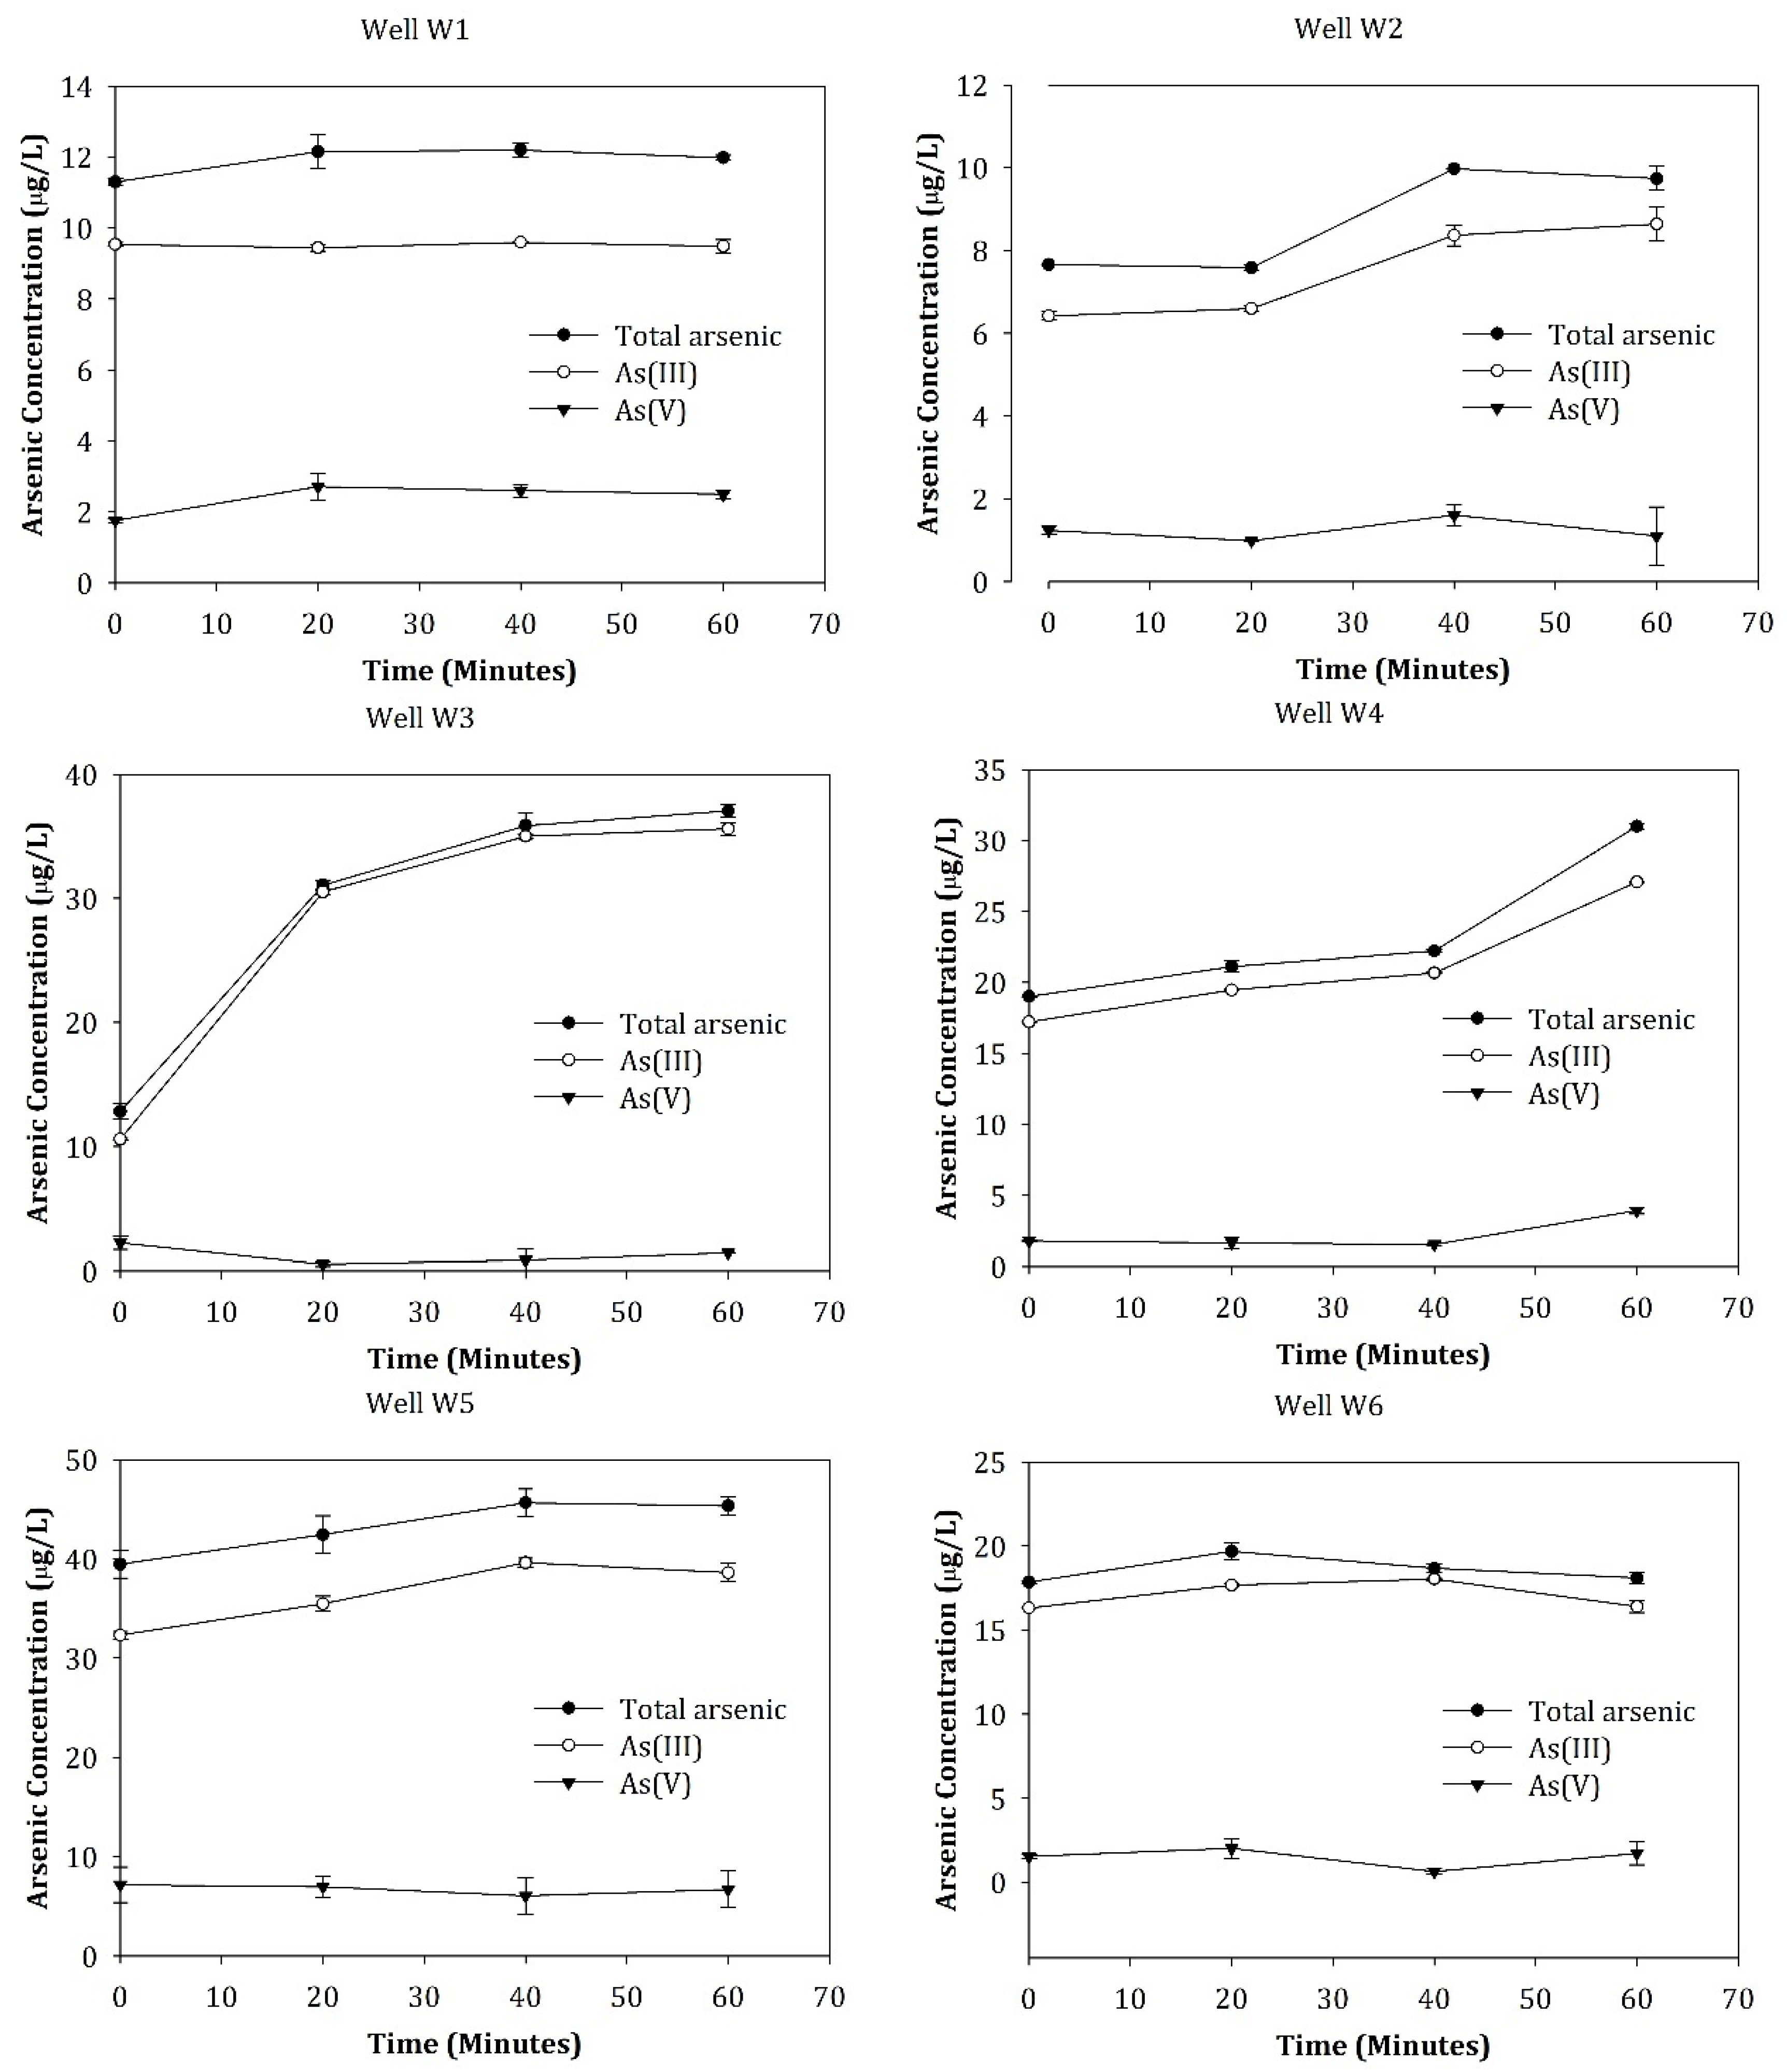
To examine the potential temporal dynamics of arsenic concentrations and speciation during well pumping and water usage, water samples were collected from wells W1 to W6 when the wells were continuously pumped. The results are shown in Figure 2.
For wells W1 and W6, the total arsenic concentrations remained largely unchanged during the 1 h of pumping (~240–300 gallons of water pumping), and there were no significant variations in arsenic speciation. For instance, for well W6, the arsenic concentration before the initiation of pumping was 17.84 ± 0.10 µg/L. Following 20 min of pumping, the arsenic concentration increased slightly to 19.68 ± 0.48 µg/L and then dropped to 18.10 ± 0.33 µg/L toward the completion of the pumping test.
For wells W2, W4, and W5, there were clear increases in arsenic concentrations during pumping (Figure 2). Particularly, although the initial arsenic concentrations in well W2 was 7.66 ± 0.00 (µg/L) before water pumping, it approached ~10 µg/L (i.e., the MCL) following 40 min of pumping. It seems that the increase in total arsenic concentrations was primarily caused by the increase in As(III) concentrations. Accordingly, the fraction of As(III) to total arsenic also increased over time. For instance, the fraction of As(III) increased from 81.85% to 86.75%.
For well W3, within 20 min of water use, the total arsenic concentration rose from 12.84 ± 0.63 µg/L to 31.05 ± 0.42 µg/L, which further increased to 37.04 ± 0.49 µg/L. There was also a close match between total arsenic and As(III) concentrations, suggesting that the increase in total arsenic concentration was also primarily caused by a rise in As(III) concentration.
In the state of Wisconsin, private well owners can voluntarily test their well water for arsenic concentrations and the contractors would generally flush the well for a few minutes before collecting the water samples which would be analyzed at certified laboratories. Moreover, the speciation of arsenic in the well water was generally not tested. Due to the relatively higher toxicity of As(III) than As(V), and the particular challenges in the removal of As(III) using common water treatment techniques, our results showed that such practices can potentially underestimate the concentrations of total arsenic and particularly As(III) that the homeowners may be exposed to during continuous water usage.

3.3. Dynamics of Arsenic Concentrations and Speciation following Intensive Well Pumping

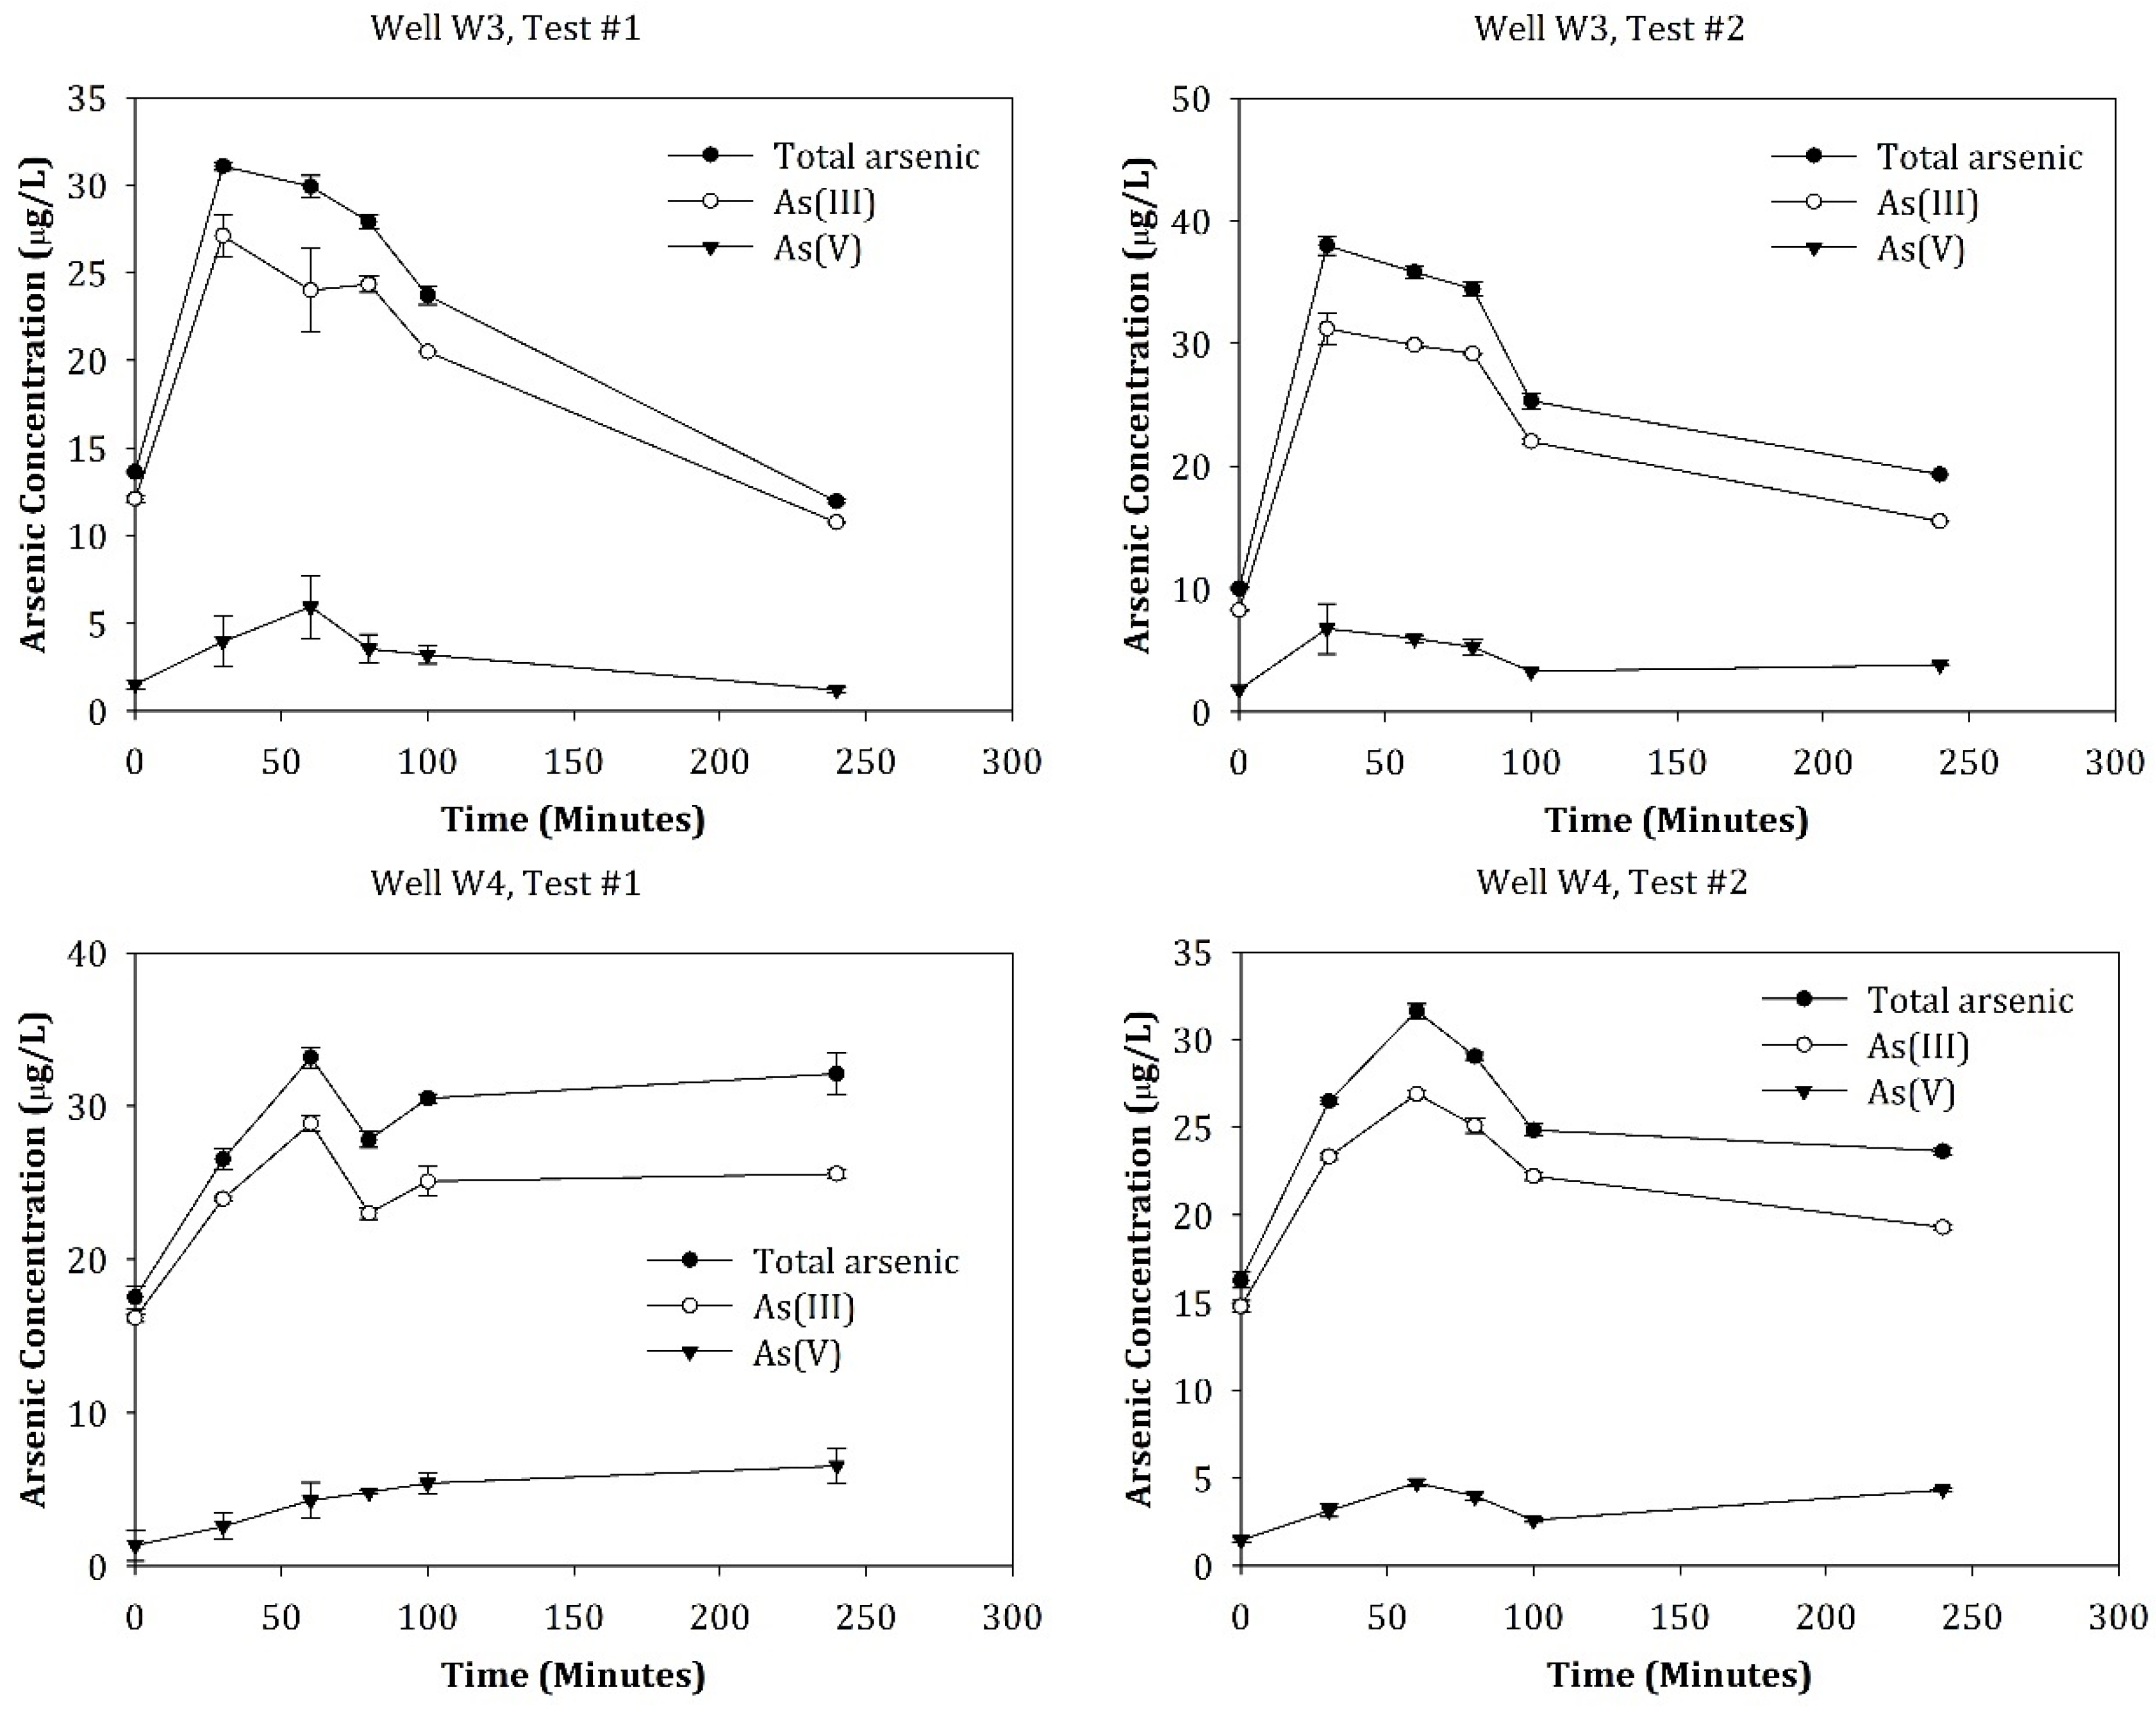
Since wells W3 and W4 exhibited the most significant increase in arsenic concentrations during well pumping, two extra rounds of water sampling were performed to further examine the dynamics of arsenic concentrations and speciation during and following the continuous water pumping. The results are shown in Figure 3. For the two rounds of water sampling, the two wells were firstly pumped continuously for 60 min and water samples were collected at 30 min and 60 min, respectively. The pump was then turned off, and the wells were allowed to recover. At preselected time intervals, the pumps were briefly turned back on to collect well water samples for arsenic quantification.
Consistent with results obtained during the second round of well sampling, arsenic concentrations in wells W3 and W4 rose rapidly during water pumping, and As(III) was the dominant form of arsenic (Figure 3). Upon the completion of water pumping, arsenic concentrations in well W3 slowly dropped over time, and after ~3 h, the arsenic concentrations returned to pre-pumping levels. It also appeared that total arsenic, As(III), and As(V) concentrations all followed the same rise-drop patterns over time. For well W4, water pumping also led to increases in total As(III) and As(V) concentrations (Figure 3). Following the water pumping phase, however, the arsenic concentrations remained elevated for at least 3 h.

3.4. Mechanisms Underlying the Arsenic Dynamics during and following Water Pumping

Sulfide-containing minerals such as pyrite and marcasite, which exist as dispersed grains, veins, and nodules within the dolomite and sandstone or as discrete cemented horizons represent the major sources of arsenic within the private wells in Eastern Wisconsin [16]. It was previously shown that the introduction of oxidants such as chlorine (for disinfection purposes) or oxygen could mobilize arsenic from these minerals on the time scales of minutes to hours [16,25,37]. For instance, when SCH samples, which contained 22 to 674 mg/kg of arsenic, were oxidized by oxygen (~8 mg/L) through batch experiments, the total arsenic concentrations increased from 0 to ~15 µg/L [37]. The release of arsenic was also observed when pyrite nodules separated from sandstone samples were kept in aqueous solutions exposed to the air [16]. It is worth noting that because the oxidation of As(III) to As(V) was slow as compared to the oxidative dissolution rate of sulfide-containing minerals, As(III) tends to be the dominant form of arsenic [16].
The oxidation of sulfide-containing minerals such as pyrite can be described by the following reaction [36]:
2FeS2 + 7O2 +2H2O → 2Fe2+ + 4H+ + 4SO42−
As such, the Fe(II) could be oxidized to Fe(III), which would form precipitates such as iron (oxy)hydroxides (Equation (2)), and the iron (oxy)hydroxides could subsequently sequester the mobilized arsenic through adsorption [16,37]. Reaction (1) could also produce H+. However, field observations did not indicate any substantial changes in water pH during the water pumping experiments. For instance, for well W3, water pH remained constant at 7.23 during the pumping event of June 2019. The stable pH values observed were caused by the buffering capacity of bicarbonate (578 mg/L), which originated from the dissolution of dolomite.
4Fe2+ + O2 +6H2O → 4FeOOH + 8H+
The net effects of the two competing processes (arsenic release and then adsorption) depend on the kinetics of Fe(II) oxidation, Fe(III) precipitation, and the adsorption of arsenic by the iron (oxy)hydroxide, which could vary based on the speciation of arsenic and water chemistry conditions [9,34,35]. For instance, it was reported that when the sulfide minerals were oxidized by oxygen (from the air) or strong oxidants (Cl2) through batch experiments, the release of sulfate (which reflected the oxidation of sulfide minerals) was comparable, but the concentrations of total arsenic was significantly lower in the case of Cl2, suggesting adsorptive removal of arsenic from the aqueous phase, presumably by the iron (oxy)hydroxides which could be produced at a faster rate under the presence of Cl2 [21,23,36]. In contrast, Thornburg and Sahai observed that when SCH samples were oxidized by oxygen in a series of batch experiments, arsenic concentrations peaked at ~1 h following oxygen exposure, and then decreased with time, indicating that the released arsenic from the oxidation of sulfide minerals could be partly removed from the aqueous phase through adsorption by the ferric (oxy)hydroxide [16].
Based on findings from previous studies, the main source of arsenic found in the private wells (Table 1) should be sulfide minerals such as pyrite and marcasite that are dispersed within the dolomite and sandstone. When oxygen was introduced into the well either from the air or by aquifer de-watering during significant water pumping, arsenic could be released into the well water rapidly (on the time scale of minutes) when the sulfide minerals were oxidized [21,25,26,37], leading to the increasing arsenic concentrations (Figure 2). The rate at which arsenic would be introduced to the well water would depend on hydrogeological and geochemical conditions such as local porosity, permeability, flow velocity, as well as the quantity and distribution of the arsenic-containing nodules, which can vary significantly at local scales and are hard to predict [22]. For instance, if the porosity and permeability were high, the area of the local cone of depression might be very small and the arsenic-containing nodules might not be exposed to oxygen, and there would be a lower rate of arsenic release into the well water. The observed variations in the patterns of arsenic concentration dynamics could be reflecting the combination of the related factors [24]. Because the redox conditions were generally reducing (Table S1) and the oxidation of As(III) in the presence of air or pure oxygen was generally slow [38], the dominant form of arsenic was As(III).
Once the continuous pumping from well W3 was completed, several factors could have contributed to the dropping trend in arsenic concentrations. As previously mentioned, water from the surrounding areas would follow the gradient of the hydraulic head and flow toward the well. For well W3, it was likely that the water returning to the well contained lower concentrations of arsenic (and As(III) and As(V)), and this would dilute the well water and subsequently lead to lower arsenic concentrations. Moreover, the adsorption of arsenic by the ferric (oxy)hydroxide, which could form slowly when oxygen was introduced into the borehole, could also lower aqueous arsenic concentrations [25,26]. It was likely that for well W4, the returning flow was slow due to factors such as low permeability or hydraulic head gradient, and/or the returning flow also contained a significant amount of arsenic, and as a result, the arsenic levels in the well water did not change rapidly over time.
Reaction (1) would suggest that along with the oxidation of arsenic-containing minerals such as pyrite, sulfate could also be introduced into the well water. The synchronizing patterns in arsenic and sulfate concentrations were reported in laboratory batch experiments, where sulfate concentrations were ~0 upon initial exposure to oxidants such as oxygen [37]. Data obtained from the field, however, indicated that there were generally insignificant correlations between well arsenic (total arsenic or As(III)) and sulfate concentrations [25,36]. In this research, the relationship between arsenic and sulfate concentrations during well pumping is shown in Figure 4. Consistent with previous field studies [36], a clear trend between the two concentrations was not observed. In the private drinking water wells selected for this research, the sulfate concentrations were generally 3 orders of magnitude higher than arsenic concentrations. It was likely that the amount of sulfate produced from the oxidation of the pyrite nodules was negligible relative to high concentrations of sulfate in the water before water was pumped. Further studies are warranted to investigate the mechanisms underlying the potential strong variations in arsenic concentrations during well pumping under field conditions.
This study examined the dynamics and speciation of naturally occurring arsenic in private drinking water wells located in Eastern Wisconsin. Our findings showed that there was a substantial increase in arsenic concentrations during continuous water usage. It is a common practice that a single well sample is collected without significant well pumping for the determination of total arsenic concentrations. Our results showed that the reliance on a single arsenic concentration measurement can significantly underestimate the health risks exposed to water consumers as arsenic concentrations during water usage can be markedly higher.
Our results also confirmed that As(III) was the dominant arsenic species. Under the ambient geochemical conditions (e.g., pH > 7), As(III) tends to exist as arsenite which has negligible charges. The lack of electrical charge would pose challenges to the removal of arsenic through various water treatment techniques such as filtration and reverse osmosis. Special attention should be paid to the oxidation of As(III) to As(V) in the design of point-of-use arsenic removal techniques.
We also observed significant variations in the behavior of arsenic (including As(III) and As(V)) in private drinking water wells. Future studies are warranted to expand the geographic coverage and scope (e.g., to include more geochemical parameters) of related studies and to develop predictive models that can identify high-risk areas.

Supplementary Materials

The following supporting information can be downloaded at: https://www.mdpi.com/article/10.3390/environments11040075/s1, Figure S1: The map of counties within Wisconsin where the research was performed; Figure S2: Boring log reports for wells W7–W11 that were studied in this research.; Figure S3: Illustration of private well water supply system and the location of water sample collection (Source: [39]). The spigot is hilighted with the red circle; Table S1: Background water quality results for the selected 11 wells (n = 3, exepct for bicarbonate measurements). BDL means below detection limit. NA means not available. For NaHCO3, only one measurement was performed due to time limit. The average ratio of cations and anions charges was 91.2%.

Author Contributions

Conceptualization, S.X. and Y.W.; methodology, E.P, S.X. and Y.W.; formal analysis, E.P., S.X. and Y.W.; investigation, E.P., S.X. and Y.W.; resources, E.P., S.X. and Y.W.; data curation, E.P., S.X. and Y.W.; writing—original draft preparation, E.P., S.X. and Y.W.; writing—review and editing, E.P., S.X. and Y.W.; visualization, S.X.; supervision, Y.W. and S.X.; project administration, S.X.; funding acquisition, Y.W. and S.X. All authors have read and agreed to the published version of the manuscript.

Funding

This research was funded by University of Wisconsin System and Wisconsin Groundwater Research Council (WRI18R002).

Data Availability Statement

The data from this research will be available from the corresponding author (S.X.) upon request.

Acknowledgments

We are grateful to the property owners who allowed us to access their private drinking water wells to conduct this research. The comments provided by the anonymous reviewers led to the improvement of our manuscript and are acknowledged.

Conflicts of Interest

The authors declare no conflict of interest.

References

  1. Grönwall, J.; Danert, K. Regarding Groundwater and Drinking Water Access through A Human Rights Lens: Self-Supply as A Norm. Water 2020, 12, 419. [Google Scholar] [CrossRef]
  2. Smedley, P.L.; Kinniburgh, D.G. A review of the source, behaviour and distribution of arsenic in natural waters. Appl. Geochem. 2002, 17, 517–568. [Google Scholar] [CrossRef]
  3. Smith, A.H.; Hopenhayn-Rich, C.; Bates, M.N.; Goeden, H.M.; Hertz-Picciotto, I.; Duggan, H.M.; Wood, R.; Kosnett, M.J.; Smith, M.T. Cancer risks from arsenic in drinking water. Environ. Health Perspect. 1992, 97, 259–267. [Google Scholar] [CrossRef] [PubMed]
  4. Hughes, M.F. History of Arsenic as a Poison and a Medicinal Agent. In Arsenic; John Wiley & Sons: Hoboken, NJ, USA, 2015; pp. 1–22. [Google Scholar] [CrossRef]
  5. Reid, M.S.; Hoy, K.S.; Schofield, J.R.M.; Uppal, J.S.; Lin, Y.; Lu, X.; Peng, H.; Le, X.C. Arsenic speciation analysis: A review with an emphasis on chromatographic separations. TrAC Trends Anal. Chem. 2020, 123, 115770. [Google Scholar] [CrossRef]
  6. Walker, M.; Seiler, R.L.; Meinert, M. Effectiveness of household reverse-osmosis systems in a Western US region with high arsenic in groundwater. Sci. Total Environ. 2008, 389, 245–252. [Google Scholar] [CrossRef] [PubMed]
  7. USEPA. National Primary Drinking Water Regulations: Long Term 2 Enhanced Surface Water Treatment Rule; U.S. Environmental Protection Agency: Washington, DC, USA, 2006.
  8. Agency for Toxic Substances and Disease Registry (ATSDR). Toxicological Profile for Arsenic; U.S. Department of Health and Human Services, Public Health Service: Washington, DC, USA, 2007.
  9. Byron, W.R.; Bierbower, G.W.; Brouwer, J.B.; Hansen, W.H. Pathologic changes in rats and dogs from two-year feeding of sodium arsenite or sodium arsenate. Toxicol. Appl. Pharm. 1967, 10, 132–147. [Google Scholar] [CrossRef]
  10. Tamio, M.; Nobuko, S.; Mayumi, A.; Sadao, U.; Yukio, S. Chemical form-dependent induction of hepatic zincthionein by arsenic administration and effect of co-administered selenium in mice. Toxicol. Lett. 1987, 39, 63–70. [Google Scholar] [CrossRef]
  11. Willhite, C.C.; Ferm, V.H. Prenatal and Developmental Toxicology of Arsenicals. In Nutritional and Toxicological Aspects of Food Safety; Friedman, M., Ed.; Springer: Boston, MA, USA, 1984; pp. 205–228. [Google Scholar] [CrossRef]
  12. Raab, A.; Feldmann, J. Arsenic. In Encyclopedia of Analytical Science, 2nd ed.; Worsfold, P., Townshend, A., Poole, C., Eds.; Elsevier: Oxford, UK, 2005; pp. 132–141. [Google Scholar] [CrossRef]
  13. Vahter, M.; Concha, G. Role of Metabolism in Arsenic Toxicity. Pharmacol. Toxicol. 2001, 89, 1–5. [Google Scholar] [CrossRef] [PubMed]
  14. Petrick, J.S.; Ayala-Fierro, F.; Cullen, W.R.; Carter, D.E.; Vasken Aposhian, H. Monomethylarsonous Acid (MMAIII) Is More Toxic Than Arsenite in Chang Human Hepatocytes. Toxicol. Appl. Pharm. 2000, 163, 203–207. [Google Scholar] [CrossRef]
  15. Ayotte, J.D.; Medalie, L.; Qi, S.L.; Backer, L.C.; Nolan, B.T. Estimating the High-Arsenic Domestic-Well Population in the Conterminous United States. Environ. Sci. Technol. 2017, 51, 12443–12454. [Google Scholar] [CrossRef]
  16. Thornburg, K.; Sahai, N. Arsenic occurrence, mobility, and retardation in sandstone and dolomite formations of the Fox River Valley, eastern Wisconsin. Environ. Sci. Technol. 2004, 38, 5087–5094. [Google Scholar] [CrossRef] [PubMed]
  17. Riewe, T. Wisconsin: Geologic Solution for Private Wells in Outagamie and Winnebago Counties; U.S. Environmental Protection Agency: Washington, DC, USA, 2015.
  18. Benson, D. Test for arsenic, Ozaukee well owners told. Milwaukee Journal Sentinel, 15 July 2009. [Google Scholar]
  19. WDNR. Arsenic in Drinking Water: Drinking Water Wells Tested with Arsenic Levels Greater than 10 ppb; Wisconsin Department of Natural Resources: Madison, WI, USA, 2017.
  20. Kassulke, N.; Chern, L. Groundwater, Wisconsin’s Buried Treasury; Wisconsin Department of Natural Resources: Madison, WI, USA, 2006.
  21. Schreiber, M.E.; Simo, J.A.; Freiberg, P.G. Stratigraphic and geochemical controls on naturally occurring arsenic in groundwater, eastern Wisconsin, USA. Hydrogeol. J. 2000, 8, 161–176. [Google Scholar] [CrossRef]
  22. Luczaj, J.A.; McIntire, M.J.; Olson Hunt, M.J. Geochemical Characterization of Trace MVT Mineralization in Paleozoic Sedimentary Rocks of Northeastern Wisconsin, USA. Geosciences 2016, 6, 29. [Google Scholar] [CrossRef]
  23. Burkel, R.S.; Stoll, R.C. Naturally occurring arsenic in sandstone aquifer water supply wells of north-eastern Wisconsin. Ground Water Monit. Remediat. 1999, 19, 114–121. [Google Scholar] [CrossRef]
  24. Root, T.L.; Gotkowitz, M.B.; Bahr, J.M.; Attig, J.W. Arsenic Geochemistry and Hydrostratigraphy in Midwestern U.S. Glacial Deposits. Ground Water 2010, 48, 903–912. [Google Scholar] [CrossRef]
  25. Gotkowitz, M.B.; Schreiber, M.E.; Simo, J.A. Effects of water use on arsenic release to well water in a confined aquifer. Ground Water 2004, 42, 568–575. [Google Scholar] [CrossRef]
  26. Schreiber, M.E.; Gotkowitz, M.B.; Simo, J.A.; Freiberg, P.G. Mechanisms of Arsenic Release to Ground Water from Naturally Occurring Sources, Eastern Wisconsin. In Arsenic in Ground Water: Geochemistry and Occurrence; Welch, A.H., Stollenwerk, K.G., Eds.; Springer: Boston, MA, USA, 2003; pp. 259–280. [Google Scholar] [CrossRef]
  27. Simo, T. Geologic Constraints on Arsenic in Groundwater with Applications to Groundwater Modeling; University of Wisconsin Aquatic Sciences Center: Madison, WI, USA, 1994. [Google Scholar]
  28. Nessman, M. How to Collect a Water Sample; Wisconsin Department of Natural Resources: Madison, WI, USA, 2010.
  29. Clean Water Testing, LLC. How to Take a Water Sample; Clean Water Testing, LLC: Appleton, WI, USA, 2015. [Google Scholar]
  30. Flanagan, S.V.; Spayd, S.E.; Procopio, N.A.; Chillrud, S.N.; Ross, J.; Braman, S.; Zheng, Y. Arsenic in private well water part 2 of 3: Who benefits the most from traditional testing promotion? Sci. Total Environ. 2016, 562, 1010–1018. [Google Scholar] [CrossRef]
  31. USEPA. Method 200.8: Determination of Trace Elements in Waters and Wastes by Inductively Coupled Plasma-Mass Spectrometry; U.S. Environmental Protection Agency: Washington, DC, USA, 1994.
  32. Wang, L.; Giammar, D.E. Effects of pH, dissolved oxygen, and aqueous ferrous iron on the adsorption of arsenic to lepidocrocite. J. Colloid Interface Sci. 2015, 448, 331–338. [Google Scholar] [CrossRef]
  33. Wilkie, J.A.; Hering, J.G. Rapid oxidation of geothermal arsenic(III) in streamwaters of the eastern Sierra Nevada. Environ. Sci. Technol. 1998, 32, 657–662. [Google Scholar] [CrossRef]
  34. Heller, S.A. Seasonal Geochemistry of Springs from Dolomite Aquifers of Southwestern Wisconsin; Wisconsin Geological and Natural History Survey: Madison, WI, USA, 1992.
  35. Hem, J.D. Study and Interpretation of the Chemical Characteristics of Natural Water; U.S. Geological Survey: Reston, VA, USA, 1985.
  36. Shafer, M.; Overdier, J.T.; Kerr, S.C. Arsenic Species (III,V) Distribution In Wisconsin Groundwaters: Field Measurements and Prediction Using Multivariate Analysis of Geochemical Data; University of Wisconsin Aquatic Sciences Center: Madison, WI, USA, 2007. [Google Scholar]
  37. West, N.; Schreiber, M.; Gotkowitz, M. Arsenic release from chlorine-promoted alteration of a sulfide cement horizon: Evidence from batch studies on the St. Peter Sandstone, Wisconsin, USA. Appl. Geochem. 2012, 27, 2215–2224. [Google Scholar] [CrossRef]
  38. Bissen, M.; Frimmel, F.H. Arsenic—A Review. Part II: Oxidation of Arsenic and Its Removal in Water Treatment. Acta Hydrochim. Hydrobiol. 2003, 31, 97–107. [Google Scholar] [CrossRef]
  39. New York State Department of Health. Individual Water Supply Wells—Fact Sheet #2. 2018. Available online: https://www.health.ny.gov/environmental/water/drinking/regulations/fact_sheets/fs2_water_storage.htm (accessed on 1 March 2024).
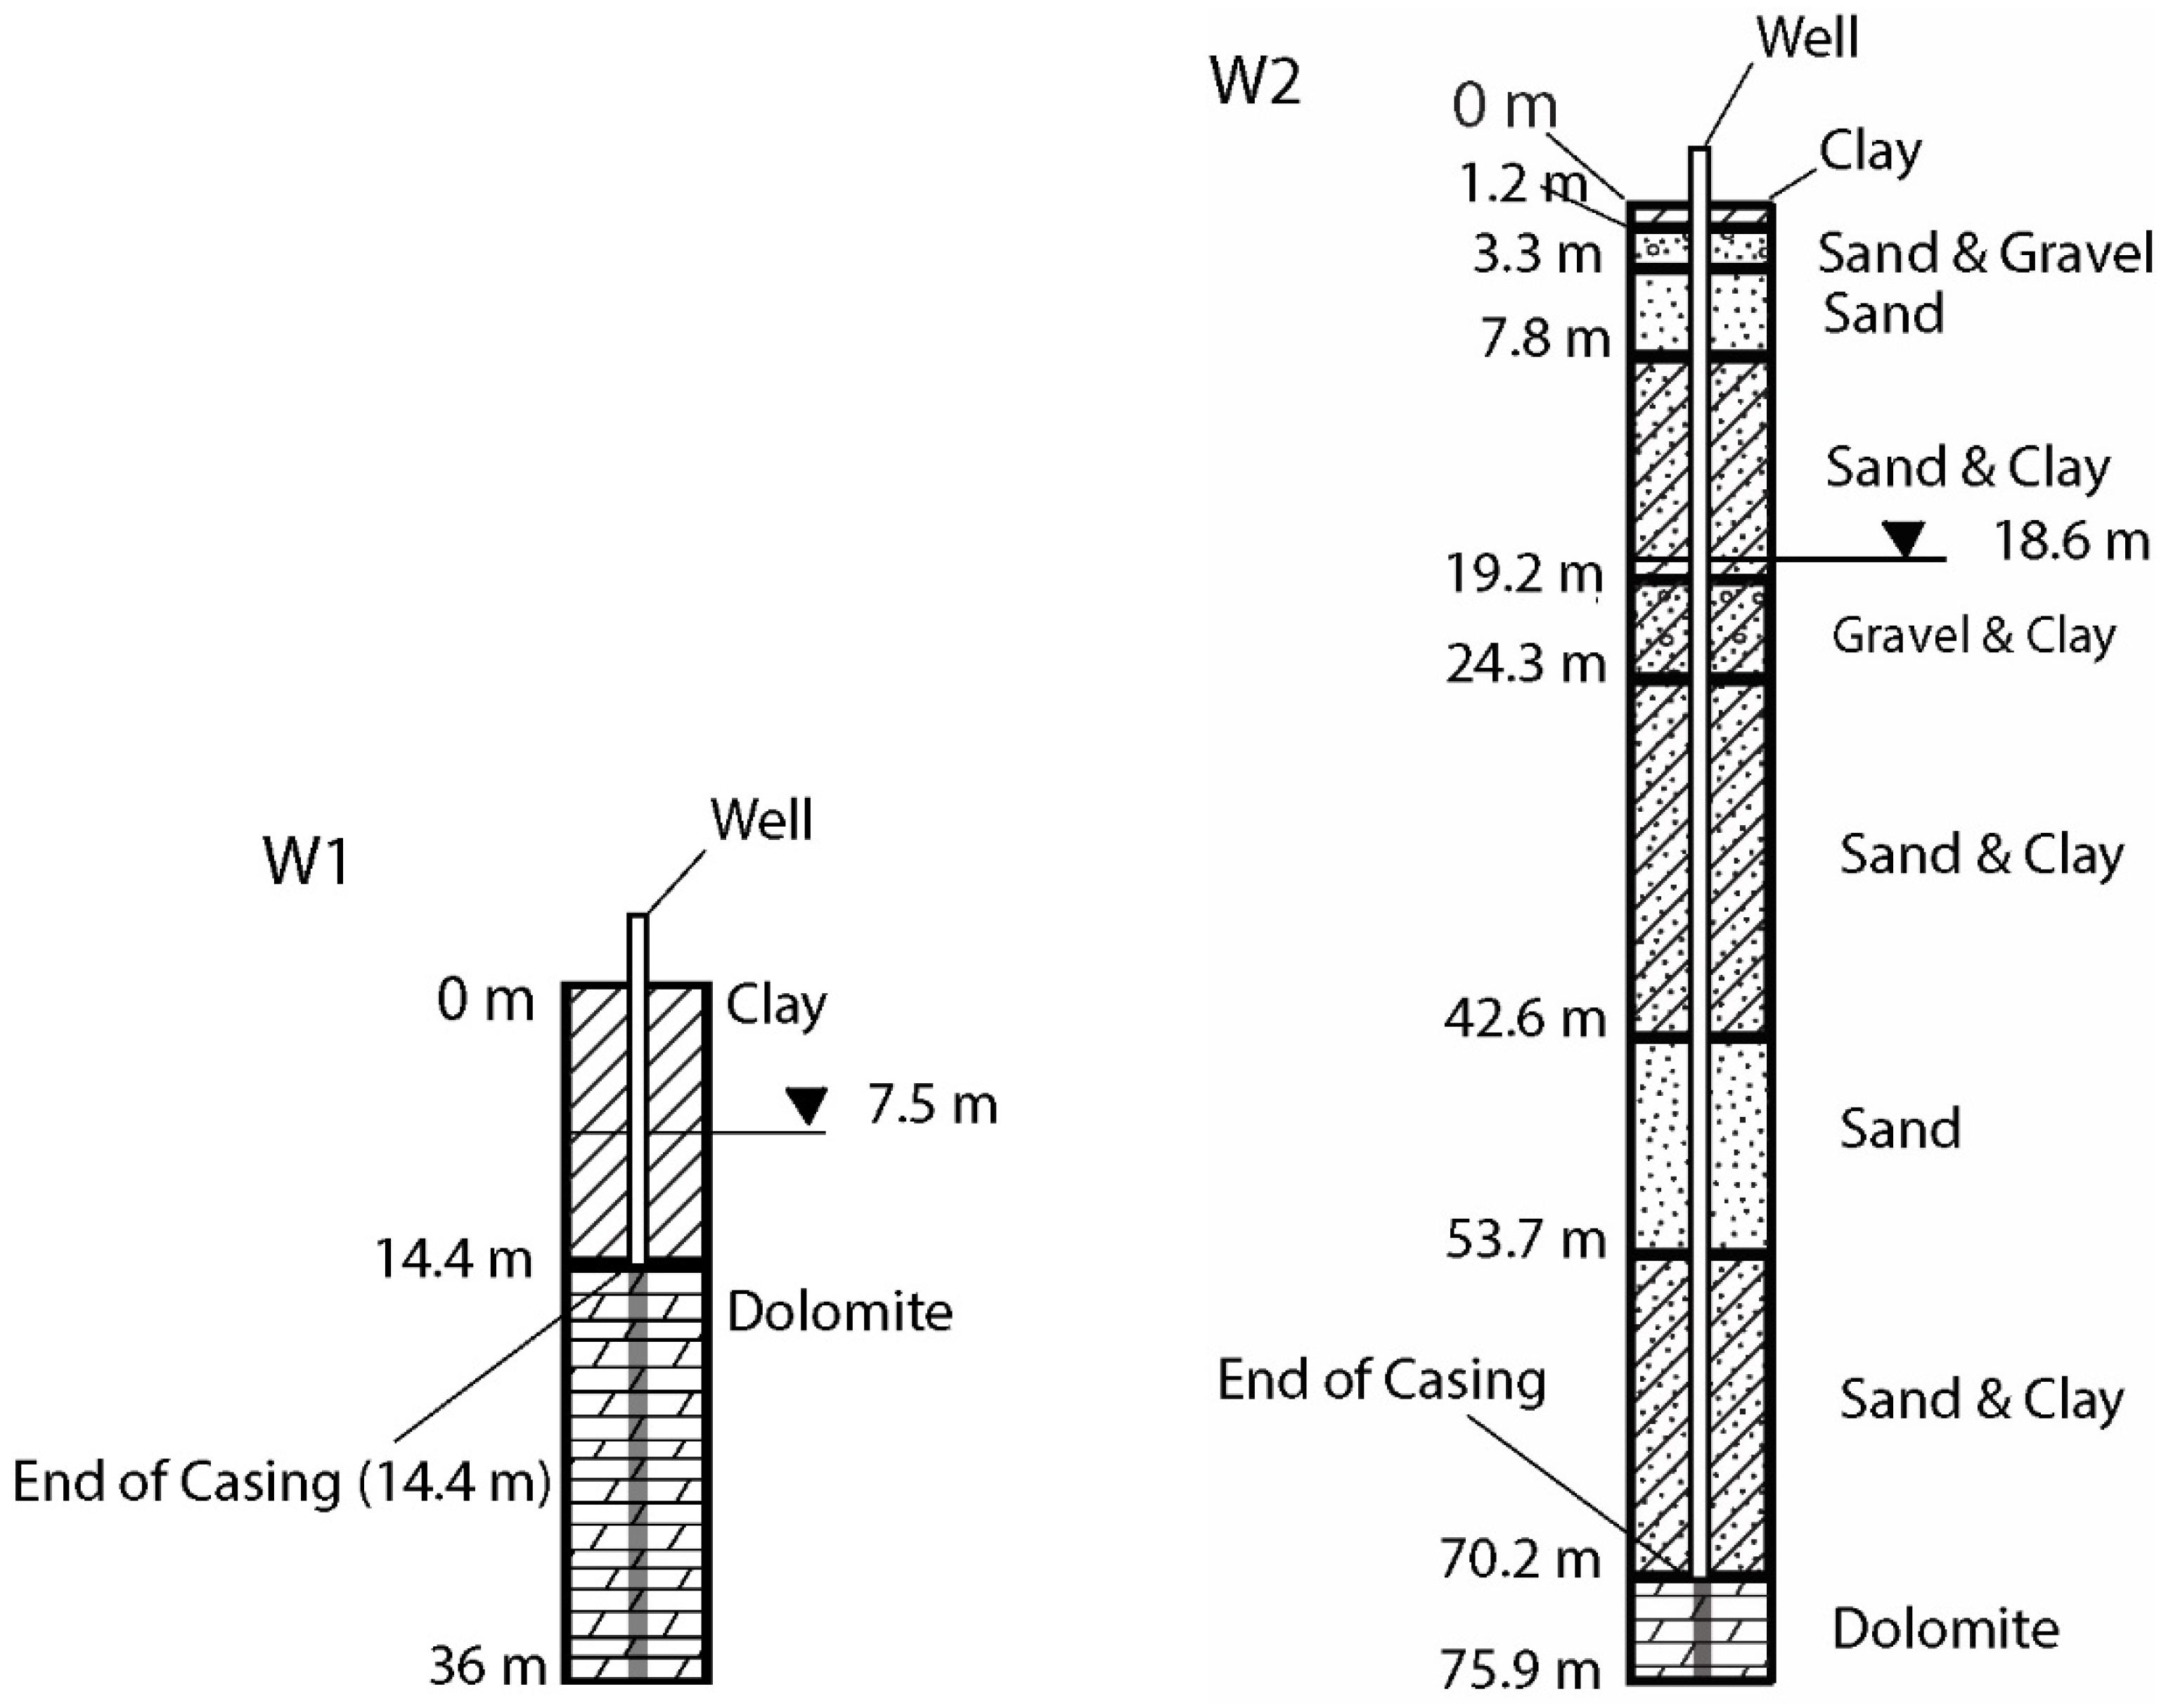
Figure 1. Boring log for wells (W1W6) that were studied in this research. ▼ represents the water table.
Environments 11 00075 g001aEnvironments 11 00075 g001b
Figure 2. The dynamics of total arsenic, As(III), and As(V) concentrations for wells W1 to W6 during continuous well pumping.
Environments 11 00075 g002
Figure 3. The dynamics of total arsenic, As(III), and As(V) concentrations during and following well pumping for wells W3 and W4.
Environments 11 00075 g003
Figure 4. Conclusions and environmental implications.
Environments 11 00075 g004
Table 1. List of private drinking wells that were selected for this research. The county map can be found in Figure S1.
Well IDCountyAquiferWell Screen Depth (m)
W1OzaukeeDolomite14.4–36
W2WashingtonDolomite70.2–75.9
W3DodgeDolomite + Sandstone18.6–38.7
W4JeffersonDolomite83.7–96.6
W5OutagamieDolomite19.5–30
W6WinnebagoDolomite + Sandstone16.5–31.2
W7WaukeshaDolomite35.1–79.5
W8WaukeshaDolomite21.6–43.5
W9WaukeshaDolomite23.1–55.5
W10WinnebagoDolomite + Sandstone12.6–42.6
W11WinnebagoDolomite + Sandstone12.9–24
Table 2. Total arsenic concentrations and fractions of As(III) and As(V) for the eleven private wells (n = 3).
Well NumberArsenic Results from First Sampling EventArsenic Results from Second Sampling Event
Total Arsenic (µg/L)As(III) (%)As(V) (%)Total Arsenic (µg/L)As(III) (%)As(V) (%)
W19.00 ± 0.2376.223.811.29 ± 0.1184.415.6
W26.80 ± 0.2976.923.17.66 ± 0.0083.816.2
W314.25 ± 0.5173.526.512.84 ± 0.6382.517.5
W421.13 ± 0.4788.811.219.01 ± 0.0790.89.2
W539.77 ± 1.6482.417.639.46 ± 1.3981.918.1
W617.80 ± 0.6481.918.117.84 ± 0.1091.48.6
W79.85 ± 1.0171.128.9NANANA
W88.05 ± 0.1479.021.1NANANA
W912.74 ± 0.2445.654.4NANANA
W10764.83 ± 15.8885.714.3NANANA
W1151.17 ± 1.4680.319.7NANANA
NA—not applicable.
Disclaimer/Publisher’s Note: The statements, opinions and data contained in all publications are solely those of the individual author(s) and contributor(s) and not of MDPI and/or the editor(s). MDPI and/or the editor(s) disclaim responsibility for any injury to people or property resulting from any ideas, methods, instructions or products referred to in the content.