Article

Life Cycle Assessment of Immobilised and Slurry Photocatalytic Systems for Removal of Natural Organic Matter in Water

by
Dan C. A. Gowland
1,
Neil Robertson
2 and
Efthalia Chatzisymeon
1,*
1
Institute for Infrastructure and Environment, School of Engineering, The University of Edinburgh, Edinburgh EH9 3JL, UK
2
EaStCHEM School of Chemistry, Joseph Black Building, King’s Buildings, Edinburgh EH9 3FJ, UK
*
Author to whom correspondence should be addressed.
Environments 2024, 11(6), 114; https://doi.org/10.3390/environments11060114
Submission received: 1 April 2024 / Revised: 17 May 2024 / Accepted: 19 May 2024 / Published: 28 May 2024
(This article belongs to the Special Issue Photocatalytic Applications in Wastewater Treatment)

Abstract

:
This study investigates the environmental impacts caused by the scaling up of the photocatalytic purification of drinking water using ultraviolet light-emitting diode technology. The life cycle assessment methodology was utilised to estimate the environmental impacts of two different reactor setups commonly used in lab-scale studies: an immobilised and a suspended TiO2 catalytic system. The functional unit adopted was the treatment of 1 L of water with an initial 7.8 mg/L concentration of natural organic matter, achieving a final 1 mg/L concentration. The use of a suspended photocatalyst was found to have an environmental footprint that was 87% lower than that of the immobilised one. From the sensitivity analysis, the environmental hotspots of the treatment process were the electricity usage and immobilised catalyst production. Therefore, alternative scenarios investigating the use of a renewable electricity mix and recyclable materials were explored to enhance the environmental performance of the photocatalytic treatment process. Using a renewable electricity mix, a decrease of 55% and 15% for the suspended and immobilised catalyst, respectively, was observed. Additionally, the process of recycling the glass used to support the immobilised catalyst achieved a maximum reduction of 22% in the environmental impact from the original scenario, with 100 glass reuses appearing to provide diminishing returns on the environmental impact savings.

1. Introduction

Advanced oxidation processes (AOPs) are becoming an increasingly investigated area for water treatment owing to their rapid reaction rates, low reactor footprints and simplicity in use [1,2]. Within the area of AOPs, photocatalysis is an up-and-coming area of research given recent advancements in UV LEDs, leading to reduced operational costs and environmental impacts as well as increased energy efficiency [3,4]. Ongoing research on the photocatalytic removal of natural organic matter (NOM) is based on the use of TiO2 semiconductors as sensitisers for light-induced redox processes [5,6]. However, from a practical standpoint, photocatalysis is yet to be widely rolled out as a method of water treatment, with research focussing more on catalyst design and specific pollutant targets rather than real water simulations [7]. A significant bottleneck that photocatalyst researchers must deal with is the means of applying the catalyst [8,9]. Dispersing the photocatalyst particles amongst the sample water is perhaps the easiest method, which also leads to the efficient use of the catalyst surface area and therefore impressive reaction rates, but this also adds a hindering catalyst recovery step [10], often ultrafiltration [11]. To circumvent this, many researchers immobilise catalysts onto a substrate to optimise the reusability and limit any leaching of the catalyst into the water supply. The disadvantage of this tends to be a reduction in reaction efficiency, requiring more catalyst and a higher light intensity per unit to treat the water [12]. Some of these disadvantages can be mitigated with the reactor design when scaling up the process, by maximising the catalyst illumination and avoiding mass transfer limitations [8,13,14]. Another important parameter to consider is the optimum amount of catalyst needed for each reactor setup. A slurry reactor’s catalyst concentration has a great impact on the radiation distribution and, therefore, the photocatalytic activity [15,16,17]. The photon penetration is inhibited throughout the reactor above a certain catalyst concentration, therefore lowering the overall reaction rate. Similarly, in immobilised systems, the thickness of the catalyst film is crucial as it can affect the quantity of light absorbed [18]. Different irradiation configurations for immobilised systems can be employed: one is to introduce light from the support side and another from the solution side. For the support side configuration, the optimal film thickness determines the maximum kinetic rate [19]. Increasing the film thickness past its optimal thickness results in decreased reactor performance. Meanwhile, for the solution side configuration, further increasing the film thickness does not enhance the reaction rate. Herein lies a delicate balance between the practicality (immobilisation) and efficacy (dispersion) of a photocatalytic reactor system designed for general drinking water treatment. Many studies have compared the removal efficiencies of slurry vs. immobilised systems [20,21], such as Manassero et al. [11], where slurry configurations were usually found to be the most efficient setup for target removal, with the issue of catalyst removal being mentioned as a practical downside [22]. Despite the wealth of interest in this area, a categoric study of the environmental sustainability of these two systems has yet to be undertaken.
Of the various methodologies available to assess the environmental sustainability of photocatalytic water treatment processes, life cycle assessments (LCA) are often utilised [3,23,24,25,26]. A common aim amongst these LCAs is to categorically assess the economic and performance issues preventing photocatalysis from achieving widespread implementation in industry, as this type of quantifiable evaluation can help to highlight contributing factors to the problems inhibiting this scaling up. Recent examples include the investigation by Foteinis et al. [27] that assessed the removal of 1 mg 17 α-ethynylestradiol (EE2) per litre of wastewater using several common AOPs. Their findings suggested that the environmental sustainability of AOP water treatment was directly proportional to the treatment efficiency but inversely proportional to the treatment time. This was attributed to the large energy input per unit time as the electricity consumption was the main environmental contributor in all of the light-driven processes that were included.
Similarly, LCAs have been used to help to determine the optimum conditions for a reaction by balancing the efficacy with the environmental impact, such as in the work published by Costamagna et al. [28]. This publication suggested that despite 1700 mg/L of cerium-doped zinc oxide displaying the highest degradation efficiency, a photocatalyst concentration of 800 mg/L could reduce the overall environmental impact. This was a compromise between the reaction rate and the input of electrical energy and the synthesis of the material, which may not have been immediately clear without the utilisation of an LCA.
Although there are several LCAs of photocatalysis for water treatment, the majority of these papers focus on the removal of specific micropollutants rather than generalised NOM. Furthermore, the use of immobilised over suspended photocatalysts is almost taken for granted due to the practicalities in reactor design and operation. This comparison with catalyst states for photocatalytic NOM removal is a significant gap that could prove to be an important factor to consider when designing water treatment works.
This work aimed to examine the environmental sustainability of immobilised versus slurry photocatalytic systems over their whole life cycles. Experiments were carried out to estimate the reusability of immobilised and suspended TiO2 catalysts in real water matrices. The sustainability and associated environmental impacts of the two different treatment systems were analysed by the life cycle assessment (LCA) methodology. The use of LCA can allow the quantification of the environmental emissions of a system in a clear and impartial overview of the treatment technology. Therefore, the findings of this work can become a valuable tool for future research approaches in large-scale photocatalytic water treatment and material development when considering how the reactor and catalyst choice can affect the sustainability of the treatment process. The application of solar disinfection and decontamination processes as described for low- and middle-income countries [29,30] was beyond the scope of this study.

2. Materials and Methods

2.1. Materials

The photocatalysts that were studied are presented in Table 1. Immobilised (IM) catalysts were prepared according to the procedures outlined by Odling et al. [31]. In summary, a potassium bifluoride solution was used to etch the glass slides, which were then immersed in a P25 titania suspension composed of a Ti(OBu)4 solution. P25 TiO2 (0.667 g) was then added to this solution and the etched slides were then immersed in the suspension for 5 min, before being drained and dried at 150 °C and then annealed at 500 °C for 1 h. This was repeated three times to build up a robust film.
The raw natural water was collected from a drinking water reservoir at the influent of a drinking water treatment plant in Scotland in the United Kingdom. The raw water was filtered with 0.45 μm × 55 mm polyvinylidene fluoride (PVDF) membrane filters to remove particulate matter. Its main physicochemical characteristics after filtration were pH = 8.4, abs254 = 0.215, TOC = 7.8 mg/L, and turbidity = 2.1 NTU.

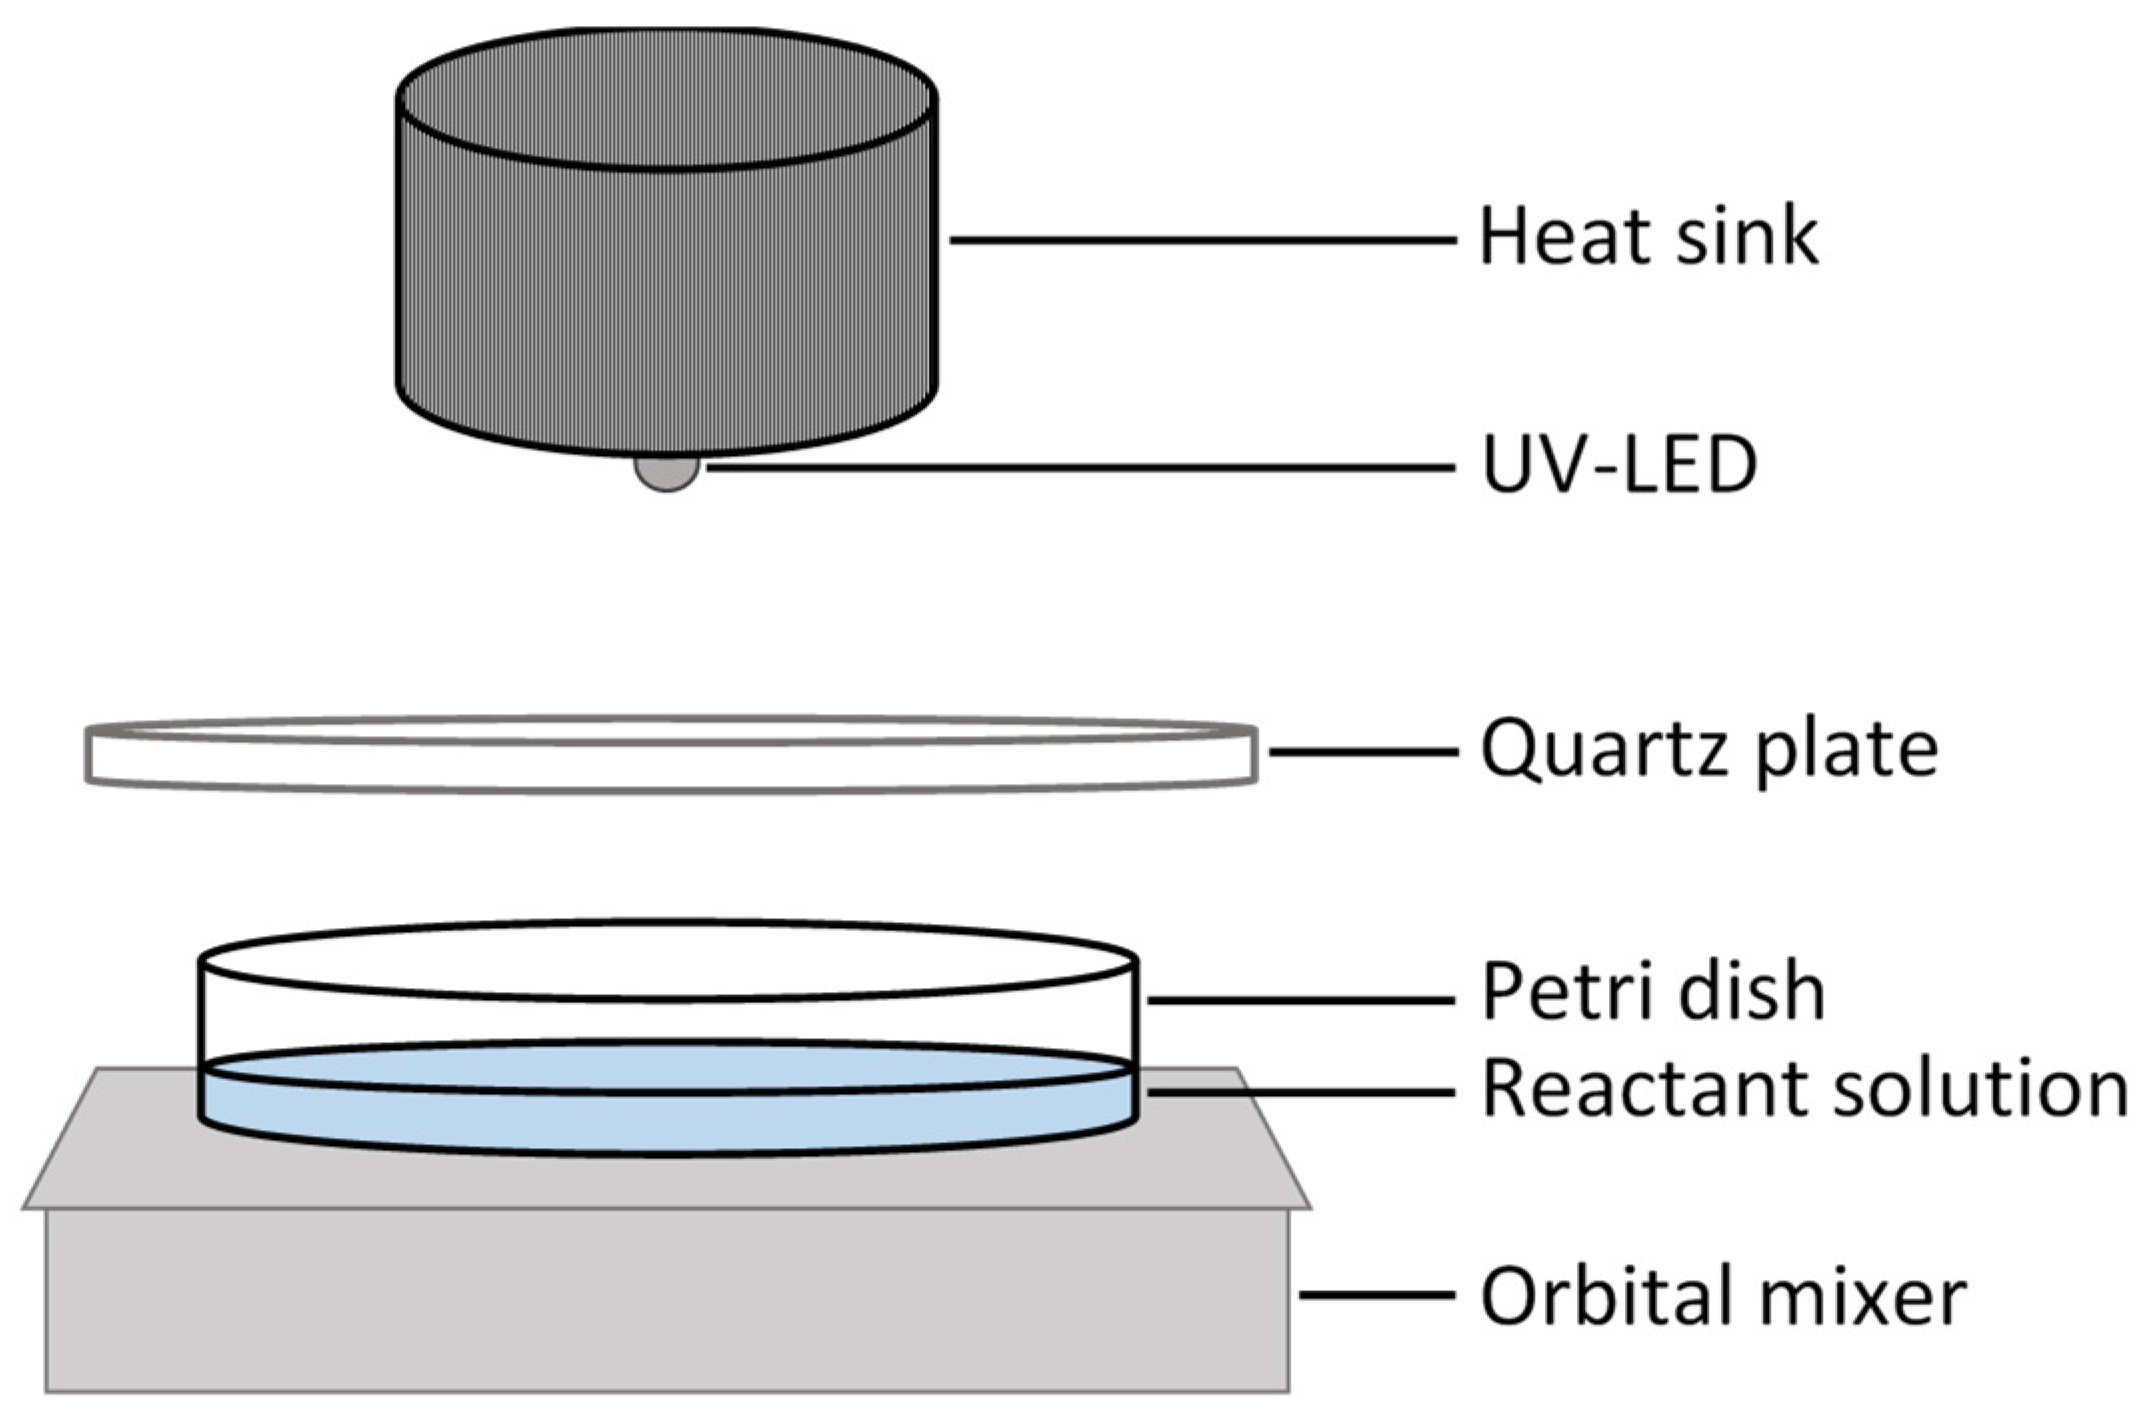
2.2. Photocatalytic Experiments

Experiments were performed at lab scale in a batch operation setup (as shown in Figure 1). An indium gallium nitride (InGaN) UVA emitter (UV-LED; λ = 365 nm, LZ4-00U600, LED Engin, San Jose, CA, USA) was employed, providing continuous irradiation. A heat sink (588-SV-LED-176E, Ohmite S Series, Ohmite Mfg. Co., Warrenville, IL, USA) was attached to the LED to prevent a radiant flux decrease due to temperature variations. The LED was directed downwards towards a quartz protective plate to reduce solution contamination and evaporation. The reactor, which was composed of borosilicate glass and had a diameter of 8 cm and height of 2 cm, had an illuminated area of 50.3 cm2. This was shielded with an aluminium-lined container to prevent outside light from affecting the results. The UV-LED irradiation source was connected in series to a DC power supply as the source of irradiation. In a typical suspension reaction, 25 mL of water was mixed with the appropriate amount of catalyst and then introduced into the reactor, which remained under continuous stirring provided by an orbital mixer at 40 rpm to promote the uniform dispersion of the catalyst particles. Each experiment began with the solution being stirred in the dark for 30 min to correct for the adsorption equilibrium of NOM on the catalyst surface. After these dark 30 min, the UV-LED was switched on (taken as t = 0). This procedure was similar to that of the immobilised photocatalytic experiments, since 25 mL of filtered raw water was added into the photoreactor containing a 7.5 × 2.5 cm TiO2-coated glass slide. Samples were withdrawn from the reactor and mineralisation was determined by measuring the UV absorbance of the samples at 254 nm based on standard method 5910 B using a Cary 100 Scan UV–Vis Spectrophotometer (VARIAN, Palo Alto, CA, USA). Reusability tests were also carried out for both the immobilised and suspended catalytic systems. For these tests, after the initial photocatalytic run, the suspended catalyst was removed by centrifuging at 6000 rpm for 30 min and then reused in a fresh sample of raw water. In the case of the immobilised catalysts, the TiO2-coated glass slide was reused for the photocatalytic oxidation of fresh raw water.

2.3. LCA Methodology

SimaPro 9.2.0.1 was used as the life cycle analysis software in this work and the International Organization for Standardization (ISO) 14040 [32] and ISO 14044 [33] were followed to perform the LCA.

2.3.1. Goal and Scope

This study’s primary aim was to determine the most environmentally sustainable photocatalytic process for water remediation at large-scale centralised treatment plants by comparing immobilised (IM) with suspended (SUS) catalysis. The application of solar disinfection and decontamination processes as described for low- and middle-income countries [22,24] was beyond the scope of this study. The removal of NOM was used as a case study, the environmental hotspots were investigated, and a sensitivity analysis was carried out to identify areas for sustainability improvement.

2.3.2. Functional Unit

The functional unit was defined as the treatment of 1 L of surface water, since the focus of this investigation was on the amount of drinking water that could be treated. Both the immobilised and suspended treatment processes were compared over the time taken to obtain a final NOM concentration of 1 mg/L. This was chosen due to targets in NOM levels for industrial water treatment plants, as there is a general international consensus that a concentration of dissolved organic carbon (DOC) < 2 mg/L is preferable in finished drinking water [34,35].

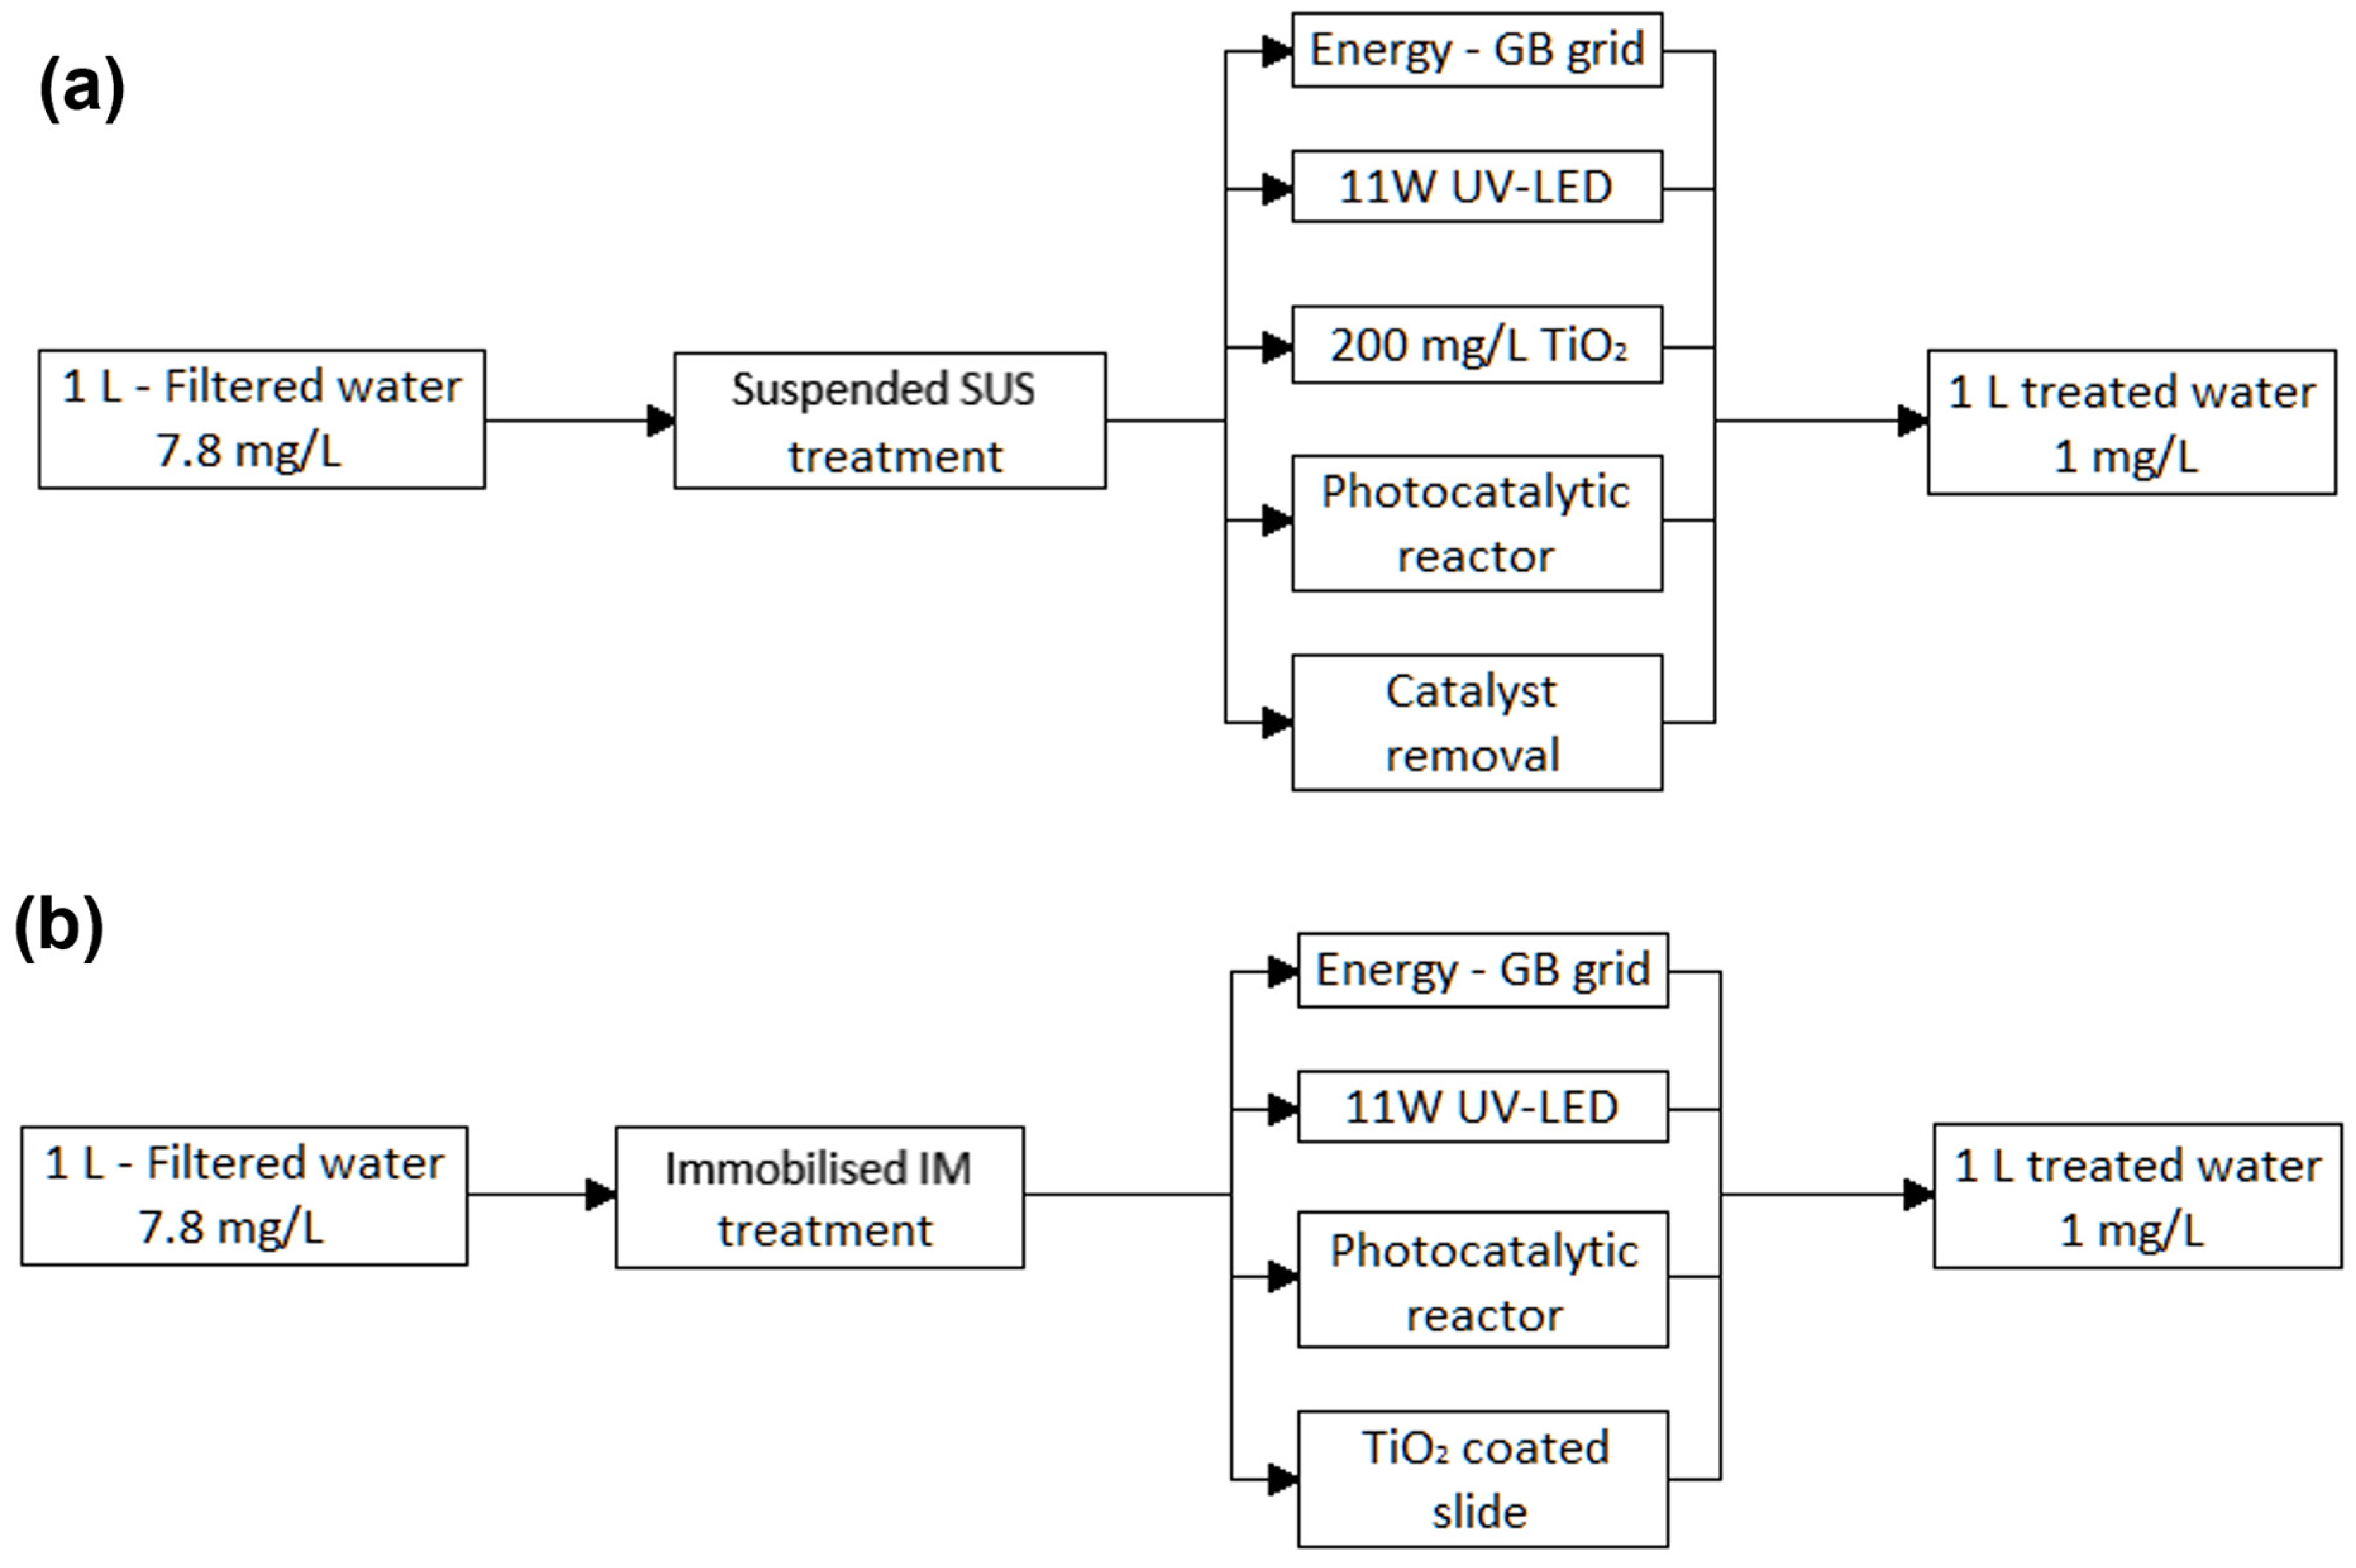
2.3.3. System Boundary

The system boundary for both photocatalytic systems is shown in Figure 2. The system flows can be categorised as (i) energy consumption, (ii) equipment assemblies, (iii) catalyst materials, and (iv) the outputs to nature.

2.3.4. Life Cycle Inventory

Table 2 presents the raw material and inputs to SimaPro for both the IM and SUS systems. The UV-LED reactor comprised a diode, heat sink, quartz plate, glass dish, and orbital stirrer. SimaPro includes a comprehensive selection of databases containing extensive information detailing various materials commonly employed in manufacturing processes. Within the Ecoinvent 3 database, an LED array is already pre-defined and readily available for employment in life cycle inventory (LCI) analyses. However, some components within the experimental setup made it necessary to create new inventory entries using materials catalogued within the database. For instance, although the Ecoinvent 3 database lacks a specific record for an LED heatsink, a new product record can be generated using the SimaPro material designation Aluminium alloy, AlMg3 [RER]|production, as the heat sink is typically composed of aluminium. According to the experimental findings (Figure 3), the treatment duration required to reduce the initial 7.8 mg/L of NOM in the raw water to 1 mg/L was estimated at 75 min and 37 min for the IM and SUS photocatalysts, respectively. Moreover, considering the catalyst reusability assessments (Figure 4), the lifespan of both the IM and SUS catalysts was determined as 500 min.

2.3.5. Life Cycle Impact Assessment

Two life cycle impact assessment (LCIA) methodologies were utilised in this investigation: ReCiPe 2016 and IPCC 2021. ReCiPe 2016, an internationally acknowledged framework, employs a variety of impact categories with corresponding characterisation factors. At the midpoint level, 18 impact categories are examined, which are subsequently consolidated into 9 damage pathways. At the endpoint level, these midpoint impact categories are then multiplied by damage factors, resulting in aggregation into three overarching damage categories: human health, ecosystems, and resources. Another midpoint category assessed by ReCiPe is the “global warming” category, which diverges from the IPCC 2021 GWP 100a approach as it includes climate-carbon feedback for non-CO2 greenhouse gasses (GHG). Given the widespread recognition of IPCC 2021 as an LCIA method, it was chosen in this study to quantify the carbon footprint.
The IPCC 2021 impact assessment method is time-specific when comparing processes based on CO2 equivalent (CO2eq) emissions, specifically GHG emissions, which serve as a metric for the measurement of the global warming potential (GWP). This is due to different greenhouse gasses exhibiting differing lifetimes in the atmosphere. For instance, methane has a relatively short lifetime, persisting in the atmosphere for ~12 years, rendering it more influential in the short-term perspective, whereas CO2 remains in the environment for longer durations, ranging from 30 to 95 years. Emphasising the significance of timescales per unit of mass, the impact of methane on climate change over a 20-year period is 84 times greater than that of CO2, yet, over a 100-year period, this difference diminishes to 28 times greater [36]. In this study, the 100-year timeframe was selected (IPCC 2013 GWP 100a).

3. Results and Discussion

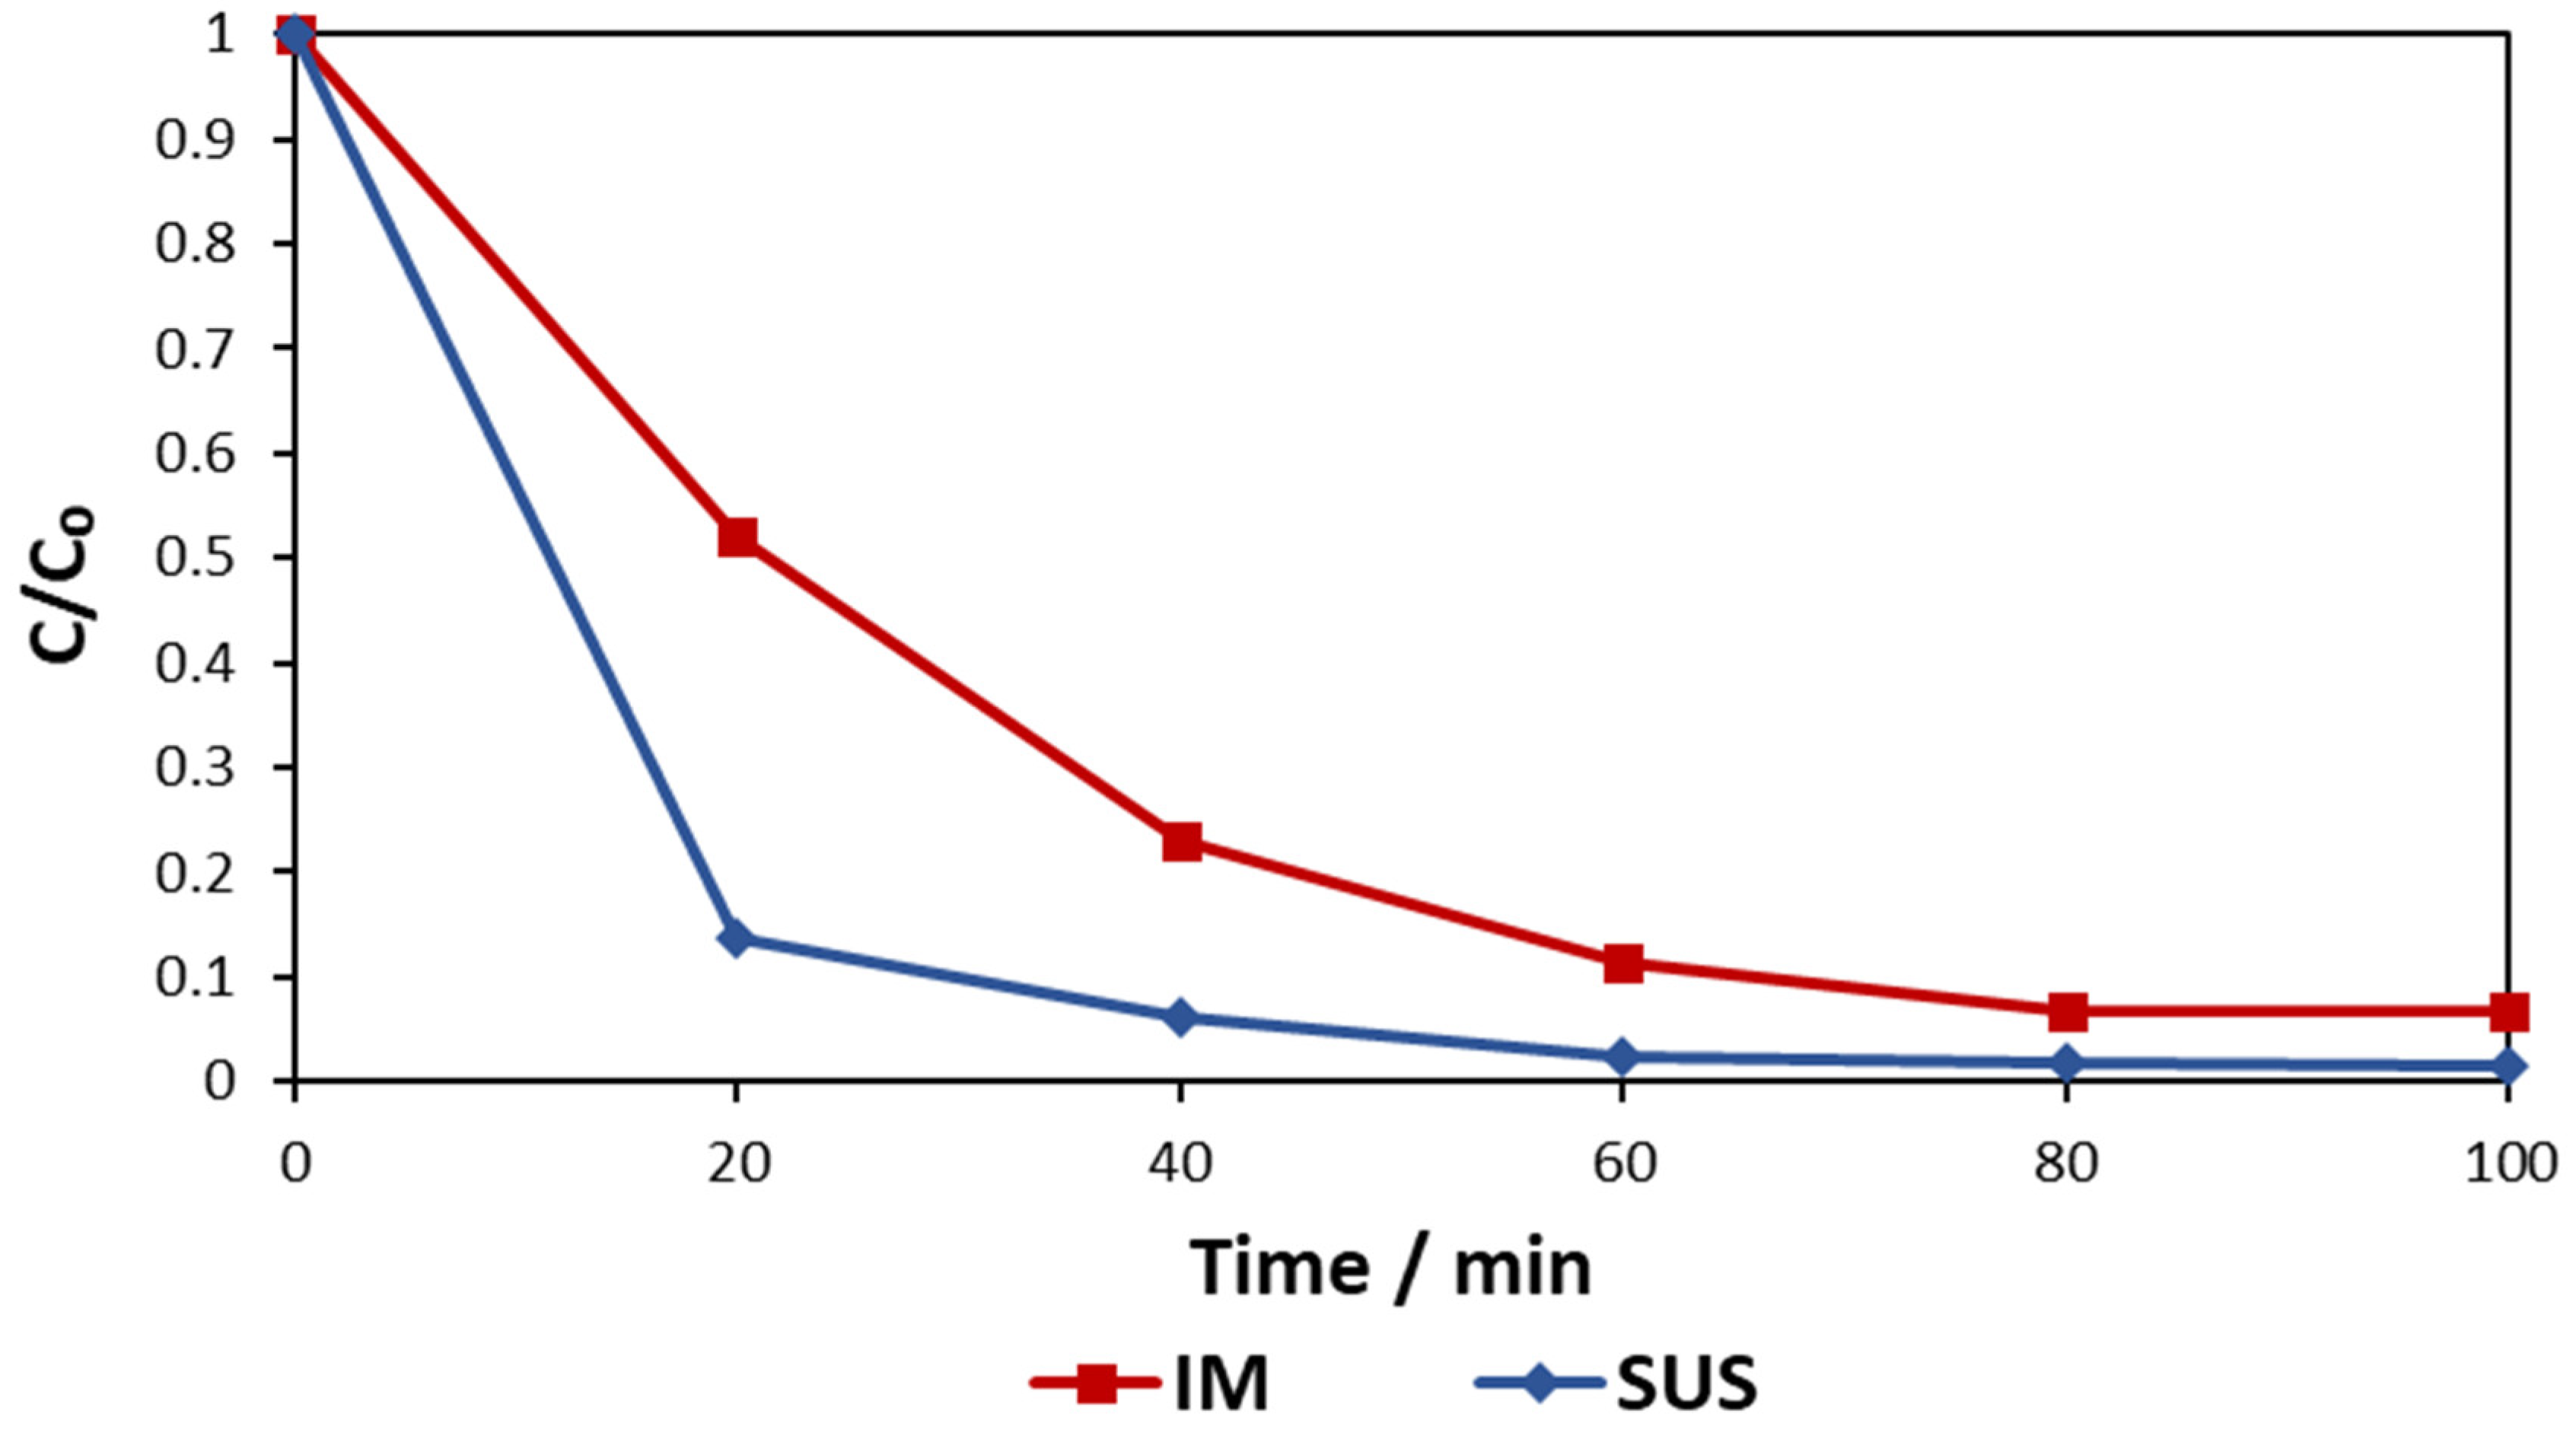
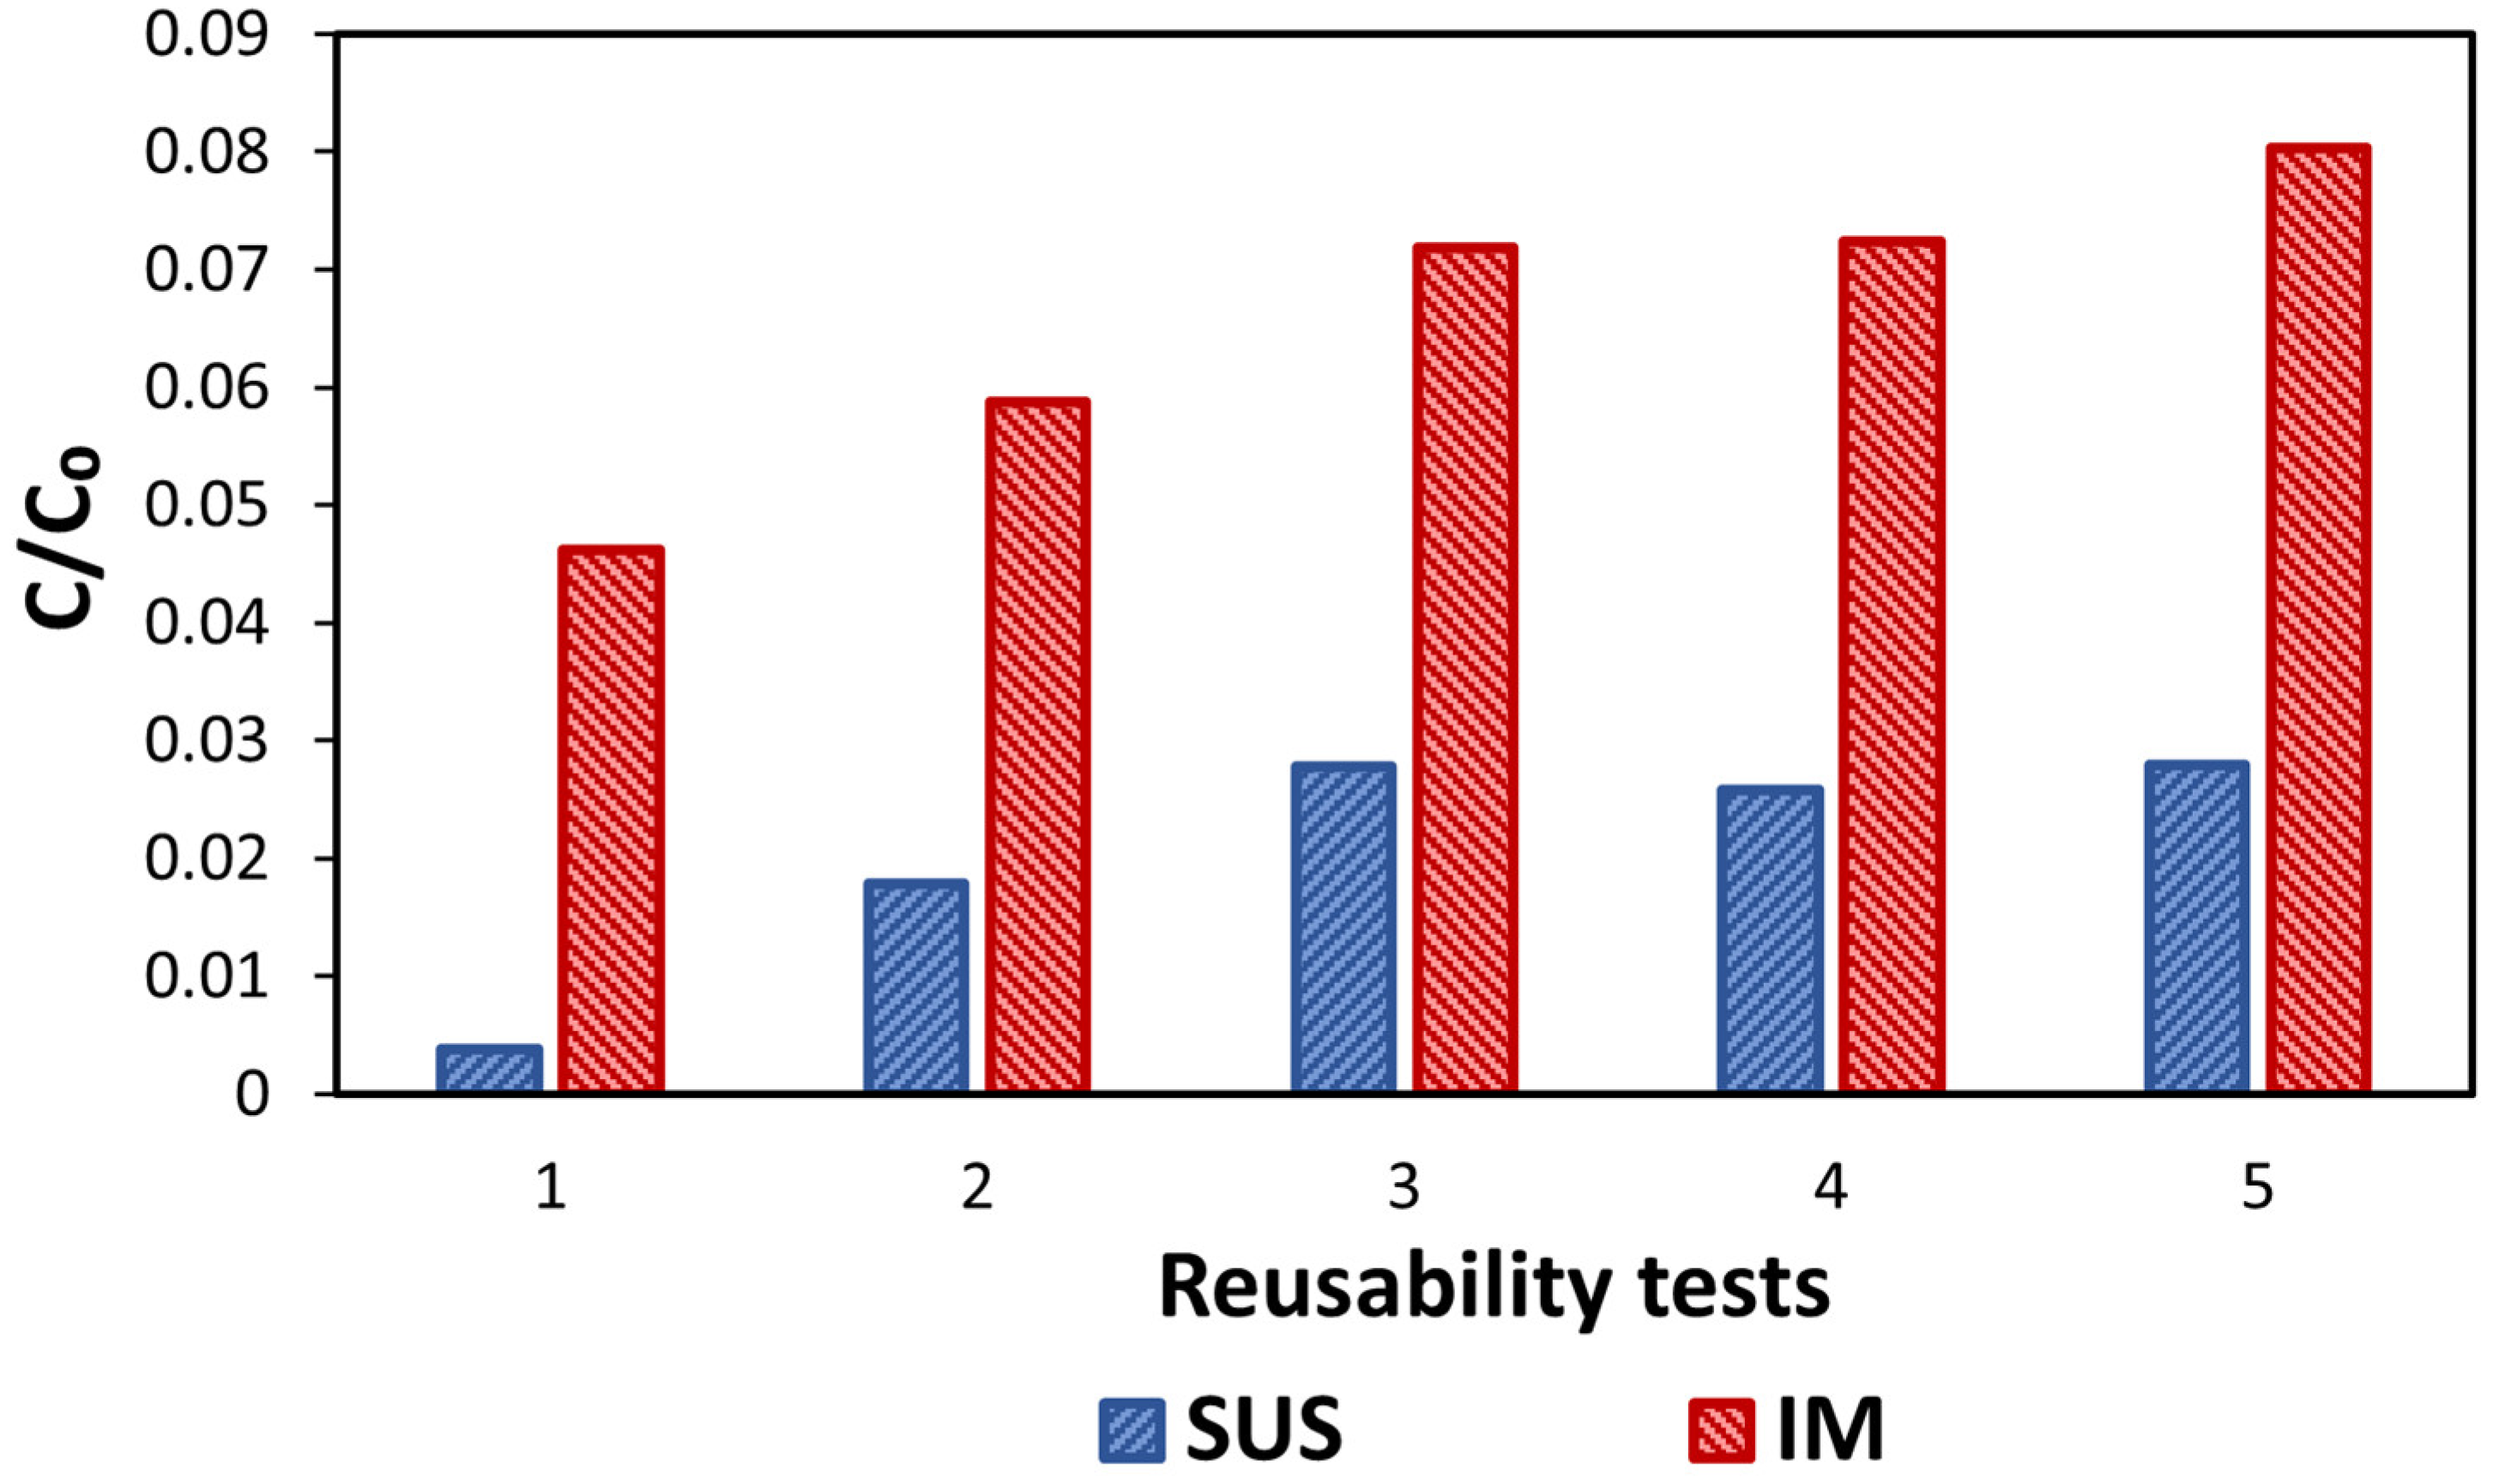
3.1. Suspended vs. Immobilised Photocatalysis

The capabilities of photocatalytic NOM removal were investigated by comparing the immobilised P25 TiO2 glass slides to P25 TiO2 suspensions under the same conditions, and the results are shown in Figure 3. These experiments showed that the suspended catalyst outperformed the immobilised catalyst reactions, achieving a 99% reduction in the NOM concentration when compared to an 89% reduction from the immobilised catalysts after 60 min of treatment. Concerning the reaction rates, these fit well with a pseudo-first-order reaction, with coefficients of 0.0346 min−1 and 0.0599 min−1 for the immobilised and suspended catalysts, respectively. This result is consistent with the literature and can be explained by the suspended catalyst having a far higher available surface area, which increases the mass transfer capabilities, as well as a higher level of irradiated surface to undergo reactions [8,11,16,37].
To further explore the amount of the catalyst that could be consecutively used for NOM photocatalytic treatment, reusability tests were carried out. Estimating the reusability of the catalysts enabled the assessment of the viability of these catalysts in an industrial process. The results, as shown in Figure 4, suggest that the NOM removal was slightly decreased by about 3% after the first three consecutive reusability tests and remained almost unchanged after this. Nevertheless, in both cases, the removal of NOM was very high and remained practically unchanged after five consecutive tests, which indicates that there is no need to replace the catalyst, either IM or SUS, for the first 500 min (8.3 h) of photocatalytic treatment. Hence, it was decided that the lifetime of the catalysts for the LCA could be assumed as 500 min.

3.2. LCA Results

3.2.1. LCIA Results Using IPCC Framework

Applying the IPCC 2021 Life Cycle Impact Assessment (LCIA) methodology, the global warming potential (GWP) for both the SUS and IM processes was calculated as 0.0218 kg CO2eq and 0.162 kg CO2eq, respectively. This indicates 87% higher carbon emissions associated with IM compared to SUS catalysts. The disparity is attributed to the duration required to treat the raw water, which in turn influences the electricity consumption, with additional energy needed for UV-LED illumination and the continuous agitation of the reactant mixture. Notably, the IM process requires 2.03 times longer to treat 1 L of surface water than the SUS treatment (Figure 3). Consequently, this divergence in treatment duration significantly impacts the sustainability of the IM catalyst, as it demands additional electricity consumption to achieve the target NOM discharge limit of 1 mg/L. It is often observed that, for advanced oxidation processes, such as photocatalysis, the GWP is roughly correlated to the energy consumption [27,28,38,39]; this was also observed in this study for both the SUS and IM processes. Therefore, in efforts to reduce the contributions of water treatment to climate change and global warming, methods to lower the energy consumption and actions to increase the adoption of renewable energy usage should be taken. Moreover, the pivotal steps that differentiate the two processes, immobilising titania on a substrate and separating a suspended catalyst after treatment, vary significantly in energy usage. The IM process is more energy-intensive than SUS. This can be attributed to the lengthy calcination process of the IM catalyst that requires multiple rounds of high-temperature furnace use, as compared to the slurry removal pumps that, based on the reactor design, could be gravity-assisted. It was calculated that the IM calcination and the SUS catalyst separation processes accounted for 0.120 kg CO2eq and 0.00270 kg CO2eq, respectively, which represents a 97.8% decrease in carbon emissions from IM and SUS.
Figure 5 shows the various grouped individual contributions considered in the system boundary to the overall environmental footprint for both the SUS and IM treatments. The contributions of the individual factors accounted for in the SimaPro software were grouped into three categories: reactor-related, catalyst-related, and electricity-related. Reactor-related factors include all contributions from processes involved in the production and maintenance of the reactor setup, including the reaction vessel and stirring configuration. Catalyst-related factors include the contributions from producing the amount of catalyst used per system unit. Electricity-related factors include only the electricity used to run a reaction for the system unit, including that used to power the LEDs, stirring, and pumps for filtration. These percentages suggest that the contributions to the sustainability of photocatalytic processes vary greatly depending on the catalyst setup being used. To be more specific, the largest variation in the contributors to the environmental footprints was found for the catalyst production, which contributed by 82.5% and only 0.6% for the IM and SUS processes, respectively. This was due to the wide variety of components required in the immobilisation process, including an intensive catalyst calcination step, whereas the SUS treatment required only a small amount of P25 titania. The contributions of the photocatalytic reactor did not vary as significantly for the two processes, with 16.9% and 1.2% for the SUS and the IM, respectively. This was expected due to the relative similarity of the reactor setups with the addition of the separation equipment (i.e., ultrafiltration step) required for the SUS setup.

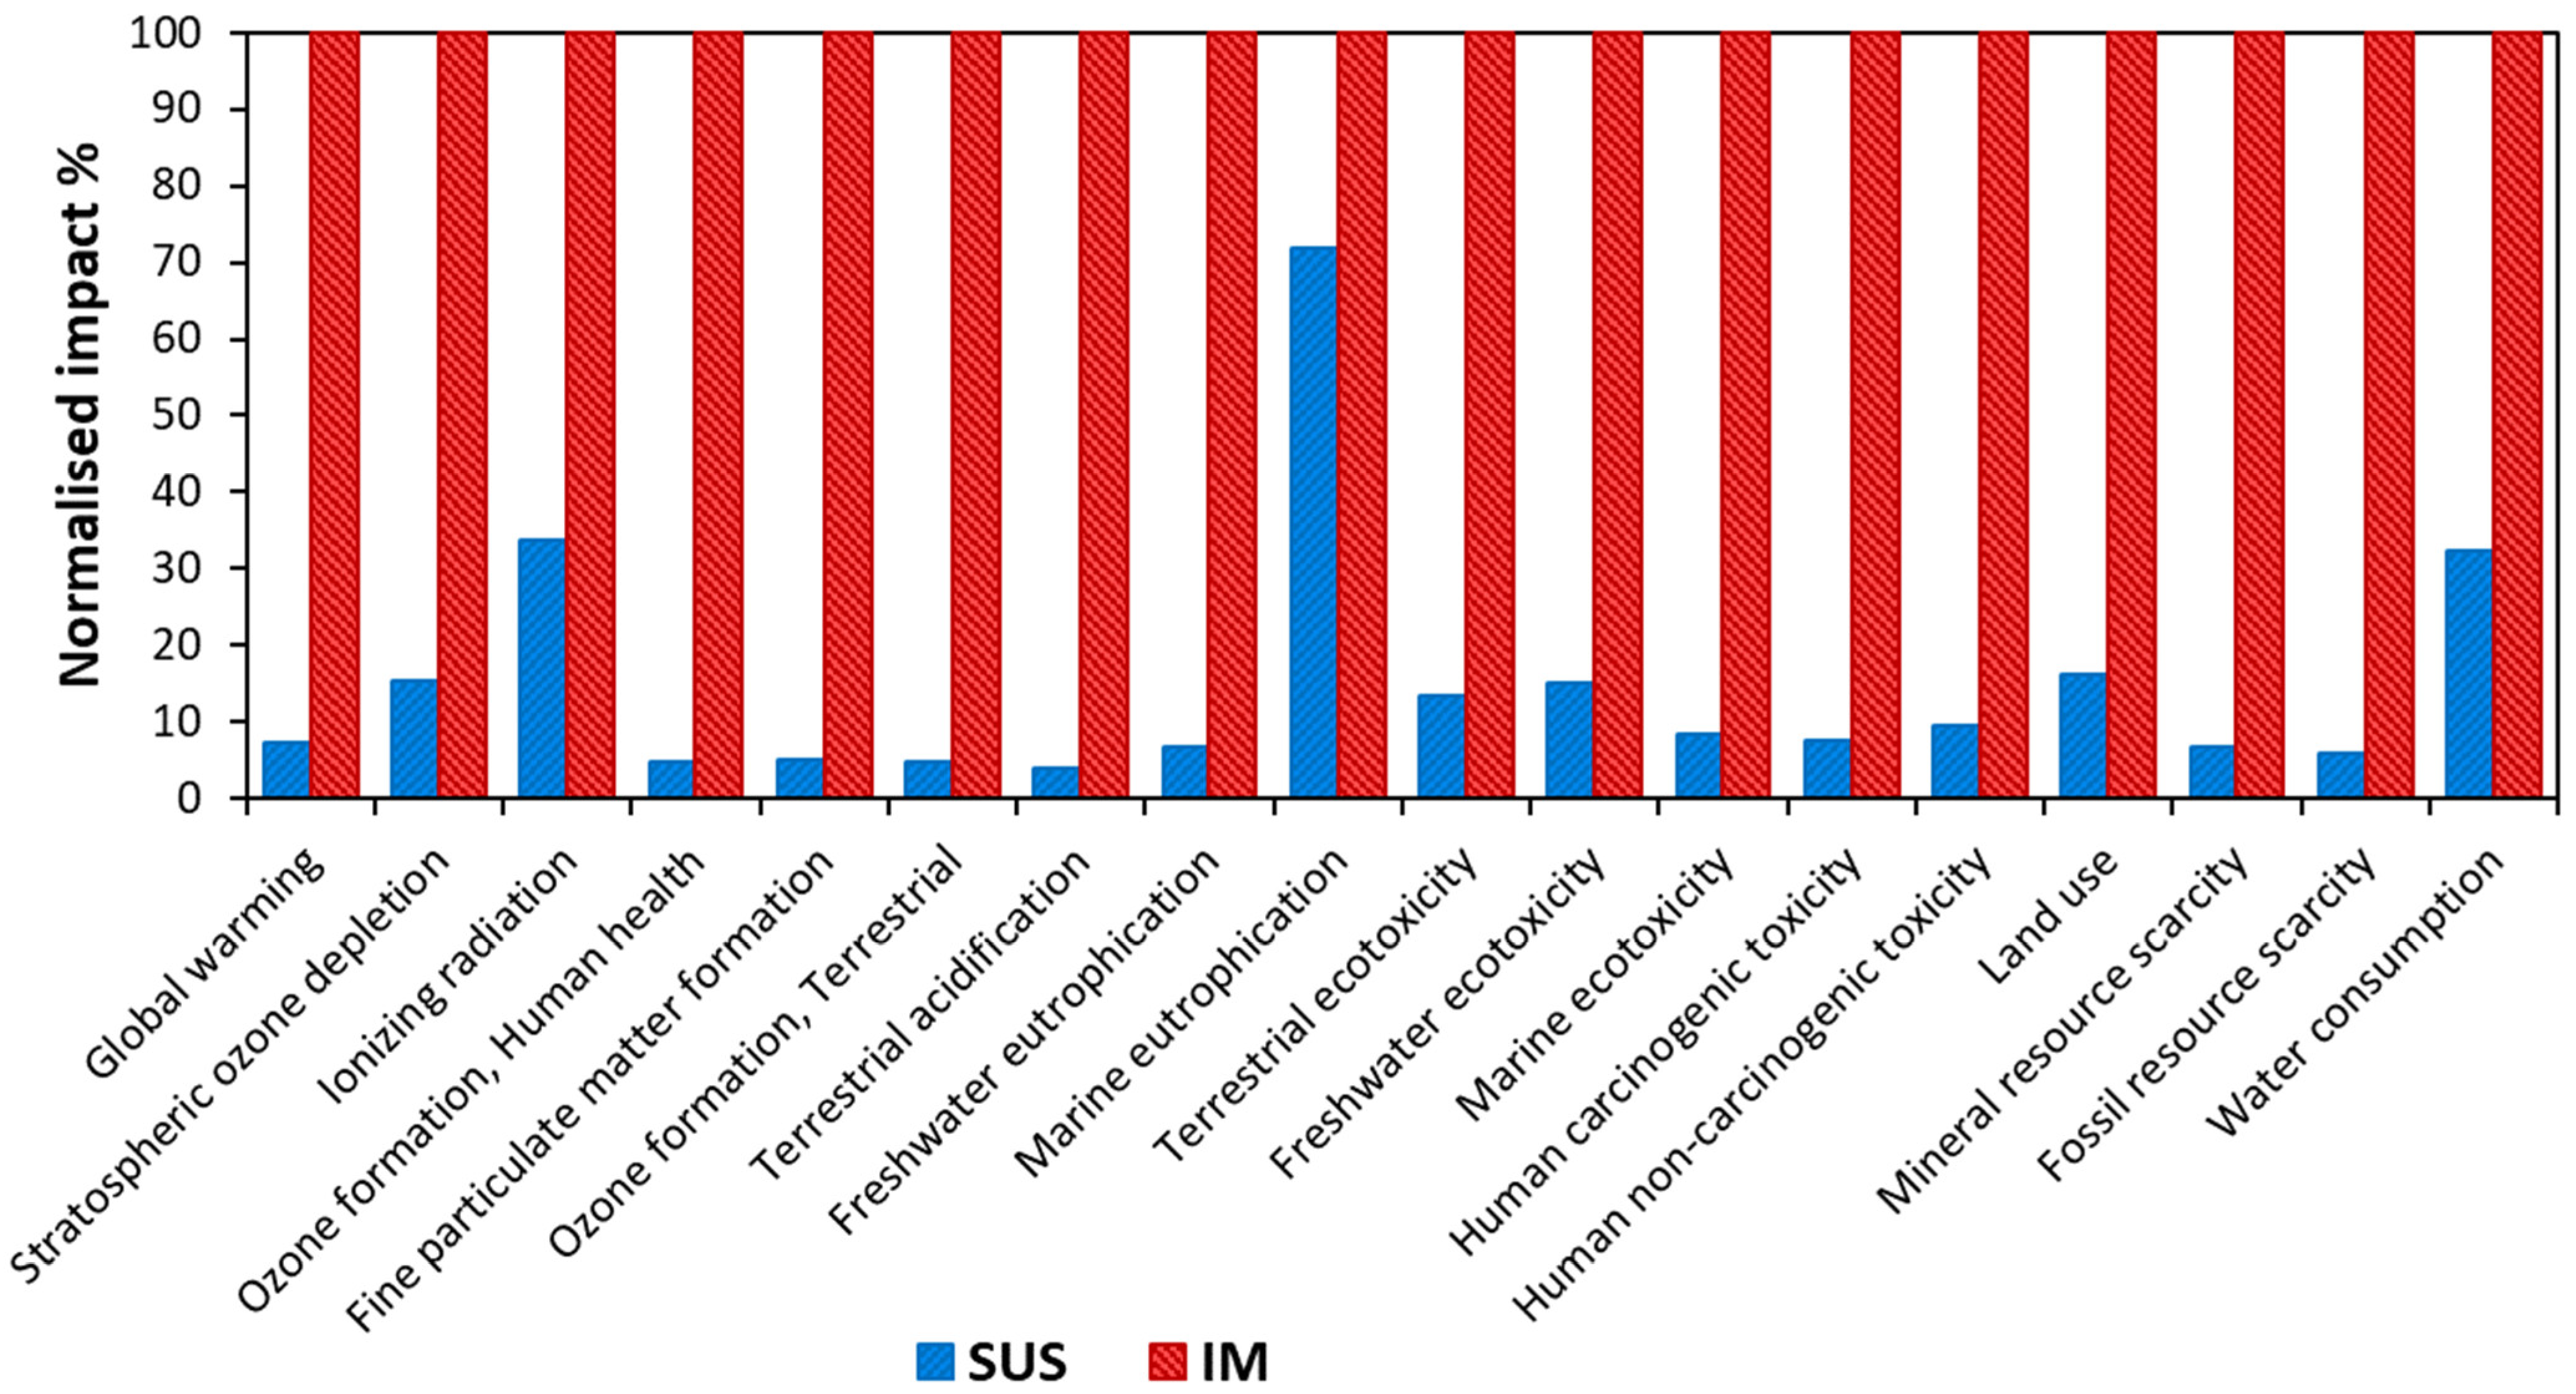
3.2.2. LCIA Results Using ReCiPe Framework

The ReCiPe characterisation model (midpoint-oriented indicators) was used to calculate the contribution of each factor to the 18 midpoint impact categories. Figure 6 shows the normalised midpoint results when comparing the SUS and IM processes for the treatment of surface water. The main findings at the midpoint level show that SUS is more environmentally sustainable than IM, with SUS having at least a 55% lower impact than the IM in all categories except one, specifically marine eutrophication. The contributions to this category had a 33% lower impact on SUS compared to IM. The marine eutrophication category relies on the assumption that marine ecosystems tend to be limited by nitrogen. It uses a simplified nitrogen air fate and transport assumption that 70% of the nitrogen inputs into surface freshwater ecosystems make their way to coastal waters.
The normalised results reveal that the midpoint impact categories most significantly affected were ranked as follows: human carcinogenic toxicity > freshwater eutrophication > ionising radiation > fossil resource scarcity > terrestrial ecotoxicity. The remaining impact categories displayed notably lower normalised scores. An LCA investigating solar-Fenton treatment for secondary-treated urban effluents similarly identified significant impacts to these categories, which was attributed to the consumption of oil for electricity generation, thereby suggesting a significant reduction in this impact through the adoption of solar energy, which would eliminate fossil fuel consumption for the powering of the reaction process [23,40].
Subsequently, the data were aggregated utilising ReCiPe’s three endpoint damage categories: ‘human health’, ‘ecosystems’, and ‘resources’ (Figure 7). Similar to the midpoint findings, the endpoint outcomes showed that the predominant concerns associated with photocatalytic oxidation techniques primarily pertain to their impacts on human health. Specifically, the SUS process yielded 5.04 mPt for human health, followed by only 0.337 mPt for ecosystems and 0.0165 mPt for resources. A similar pattern was observed with the IM catalyst setup, generating 32.1 mPt, 2.11 mPt, and 0.139 mPt for human health, ecosystems, and resources, respectively. These adverse effects on human health are attributed to its energy consumption, which was generated by a notable lack of renewable electricity.

3.2.3. Alternative Scenario 1: Renewable Electricity Mix

Given that electricity was one of the main contributors to the environmental footprint, especially that of the IM systems, mainly through the catalyst’s calcination step and the relatively high irradiation time, an alternate scenario to the main comparison was tested using a 100% renewable electricity mixture, rather than the 2022 GB electricity mix, which comprised 41% renewable energy [41]. This was to gauge whether a significant improvement in sustainability could be achieved in the future by reducing the environmental and health impacts associated with fossil fuel use. This scenario was also tested to determine whether one treatment would be affected more than the other due to the sustainability of the electricity production. A common flaw highlighted in UV treatment systems is the excessive use of electricity, an area that further studies could investigate by looking at the impact of using renewable electricity [3,24]. Due to the considerable environmental contribution from electricity in AOPs, the first alternative scenario investigated was the use of an electricity mix based on the renewable electricity output of Scotland. In 2020, 97% of Scotland’s gross electricity consumption came from renewable sources, including about 71% from wind energy and 18.1% from hydro [42]. Comparing this to 43.1% of the UK’s electricity coming from renewables in 2020, it is reasonable to assume that both IM and SUS water treatment would benefit from a less carbon-intensive energy source. Table 3 shows the relative electricity mix that was used in the original scenario and alternative scenario 1, which was decided using Scotland’s electricity production in 2020. The percentages consider the electricity mix from renewables used in 2020 and assumes that they supply 100% of the electricity supply, as these are the rough proportions that Scotland plans to use for its target net-zero electricity consumption. The largest contributing electricity source in alternative scenario 1 was onshore wind, followed by hydro and offshore wind, with additional contributions from bioenergy, solar, and tidal energy.

Scenario 1—LCIA Results Using IPCC Framework

Utilising the IPCC 2021 LCIA method, the GWP was 0.00989 and 0.138 kg CO2eq for the SUS and IM processes, respectively, which represents a 93% decrease in carbon emissions from IM to SUS. Although both methods saw a decrease in their climate impacts from the original scenario, IM achieved a significantly lower reduction (15%) compared to SUS (55%) when compared to the original energy mix. This can be explained by the differences in the percentage contributions of the individual components, as shown in Figure 5. In the original case, the SUS process’ percentage electricity contribution (82.5%) is 3.6 times higher than that of the IM process (22.4%) and is therefore reduced by roughly 3.6 times more when the electricity’s contribution is lowered by using renewables (64.4% and 9.9% for SUS and IM, respectively).
Figure 8 groups the individual percentage contributions, for both the SUS and IM treatments, into three categories depending on whether they are reactor-related, catalyst-related, or electricity-related. These percentages offer further insights into why the SUS treatment was affected more by the change in energy supply. The trend shown in the contributors to the environmental footprints was that the electricity contribution decreased and other contributions increased. For example, the catalyst contribution for IM increased from 82.5% in the original scenario to 88.7%, whereas the SUS setup’s environmental footprint rose from 0.6% to 1.5%. The contributions of the photocatalytic reactor increased dramatically for SUS, rising from 16.9% to 34.1%. This was expected due to the relative similarity of the reactor setups with the addition of the separation equipment required for the SUS setup.

Scenario 1—LCIA Results Using ReCiPe Framework

Using the ReCiPe characterisation model (midpoint-oriented indicators), the contribution of each parameter to each of the 18 midpoint impact categories was calculated. Figure 9 shows the midpoint results (characterisation) when comparing the SUS and IM processes using 100% renewable energy sources. At the midpoint level, the main findings show little change from the original scenario, with almost every category increasing the relative difference between SUS and IM, except, notably, marine eutrophication. The relative contributions to this category increased with the SUS process, growing from 67% to 72% when compared to IM. This is most likely because the reactor setup is a large contributor to this category, so changing the electricity contributions has little effect.
These data were again aggregated using ReCiPe’s endpoint damage categories: ‘human health’, ‘ecosystems’, and ‘resources’ (Figure 10). Similar to the original scenario’s results, the endpoint results implied that the greatest concern with photocatalytic oxidation techniques is by far the impacts that they have on human health; the SUS process generated 2.24 mPt for human health (55% reduction from the original scenario), 0.136 mPt for ecosystems (60% reduction from original scenario), and 0.00658 mPt for resources (60% reduction from original scenario). The same trend was identified with IM, yielding 26.4, 1.7, and 0.119 mPt for human health, ecosystems, and resources (18%, 19%, and 14% reductions), respectively. These data show that the relative reductions in harm to the three categories were not proportionately affected when changing the electricity mixture. The impact on resources was reduced much less in the IM process when compared to SUS; this could again be due to the increased demand for materials for the immobilisation process, making it the most influential factor in determining the process’ environmental impact, whereas the SUS process is mostly dictated by the energy demand and source.

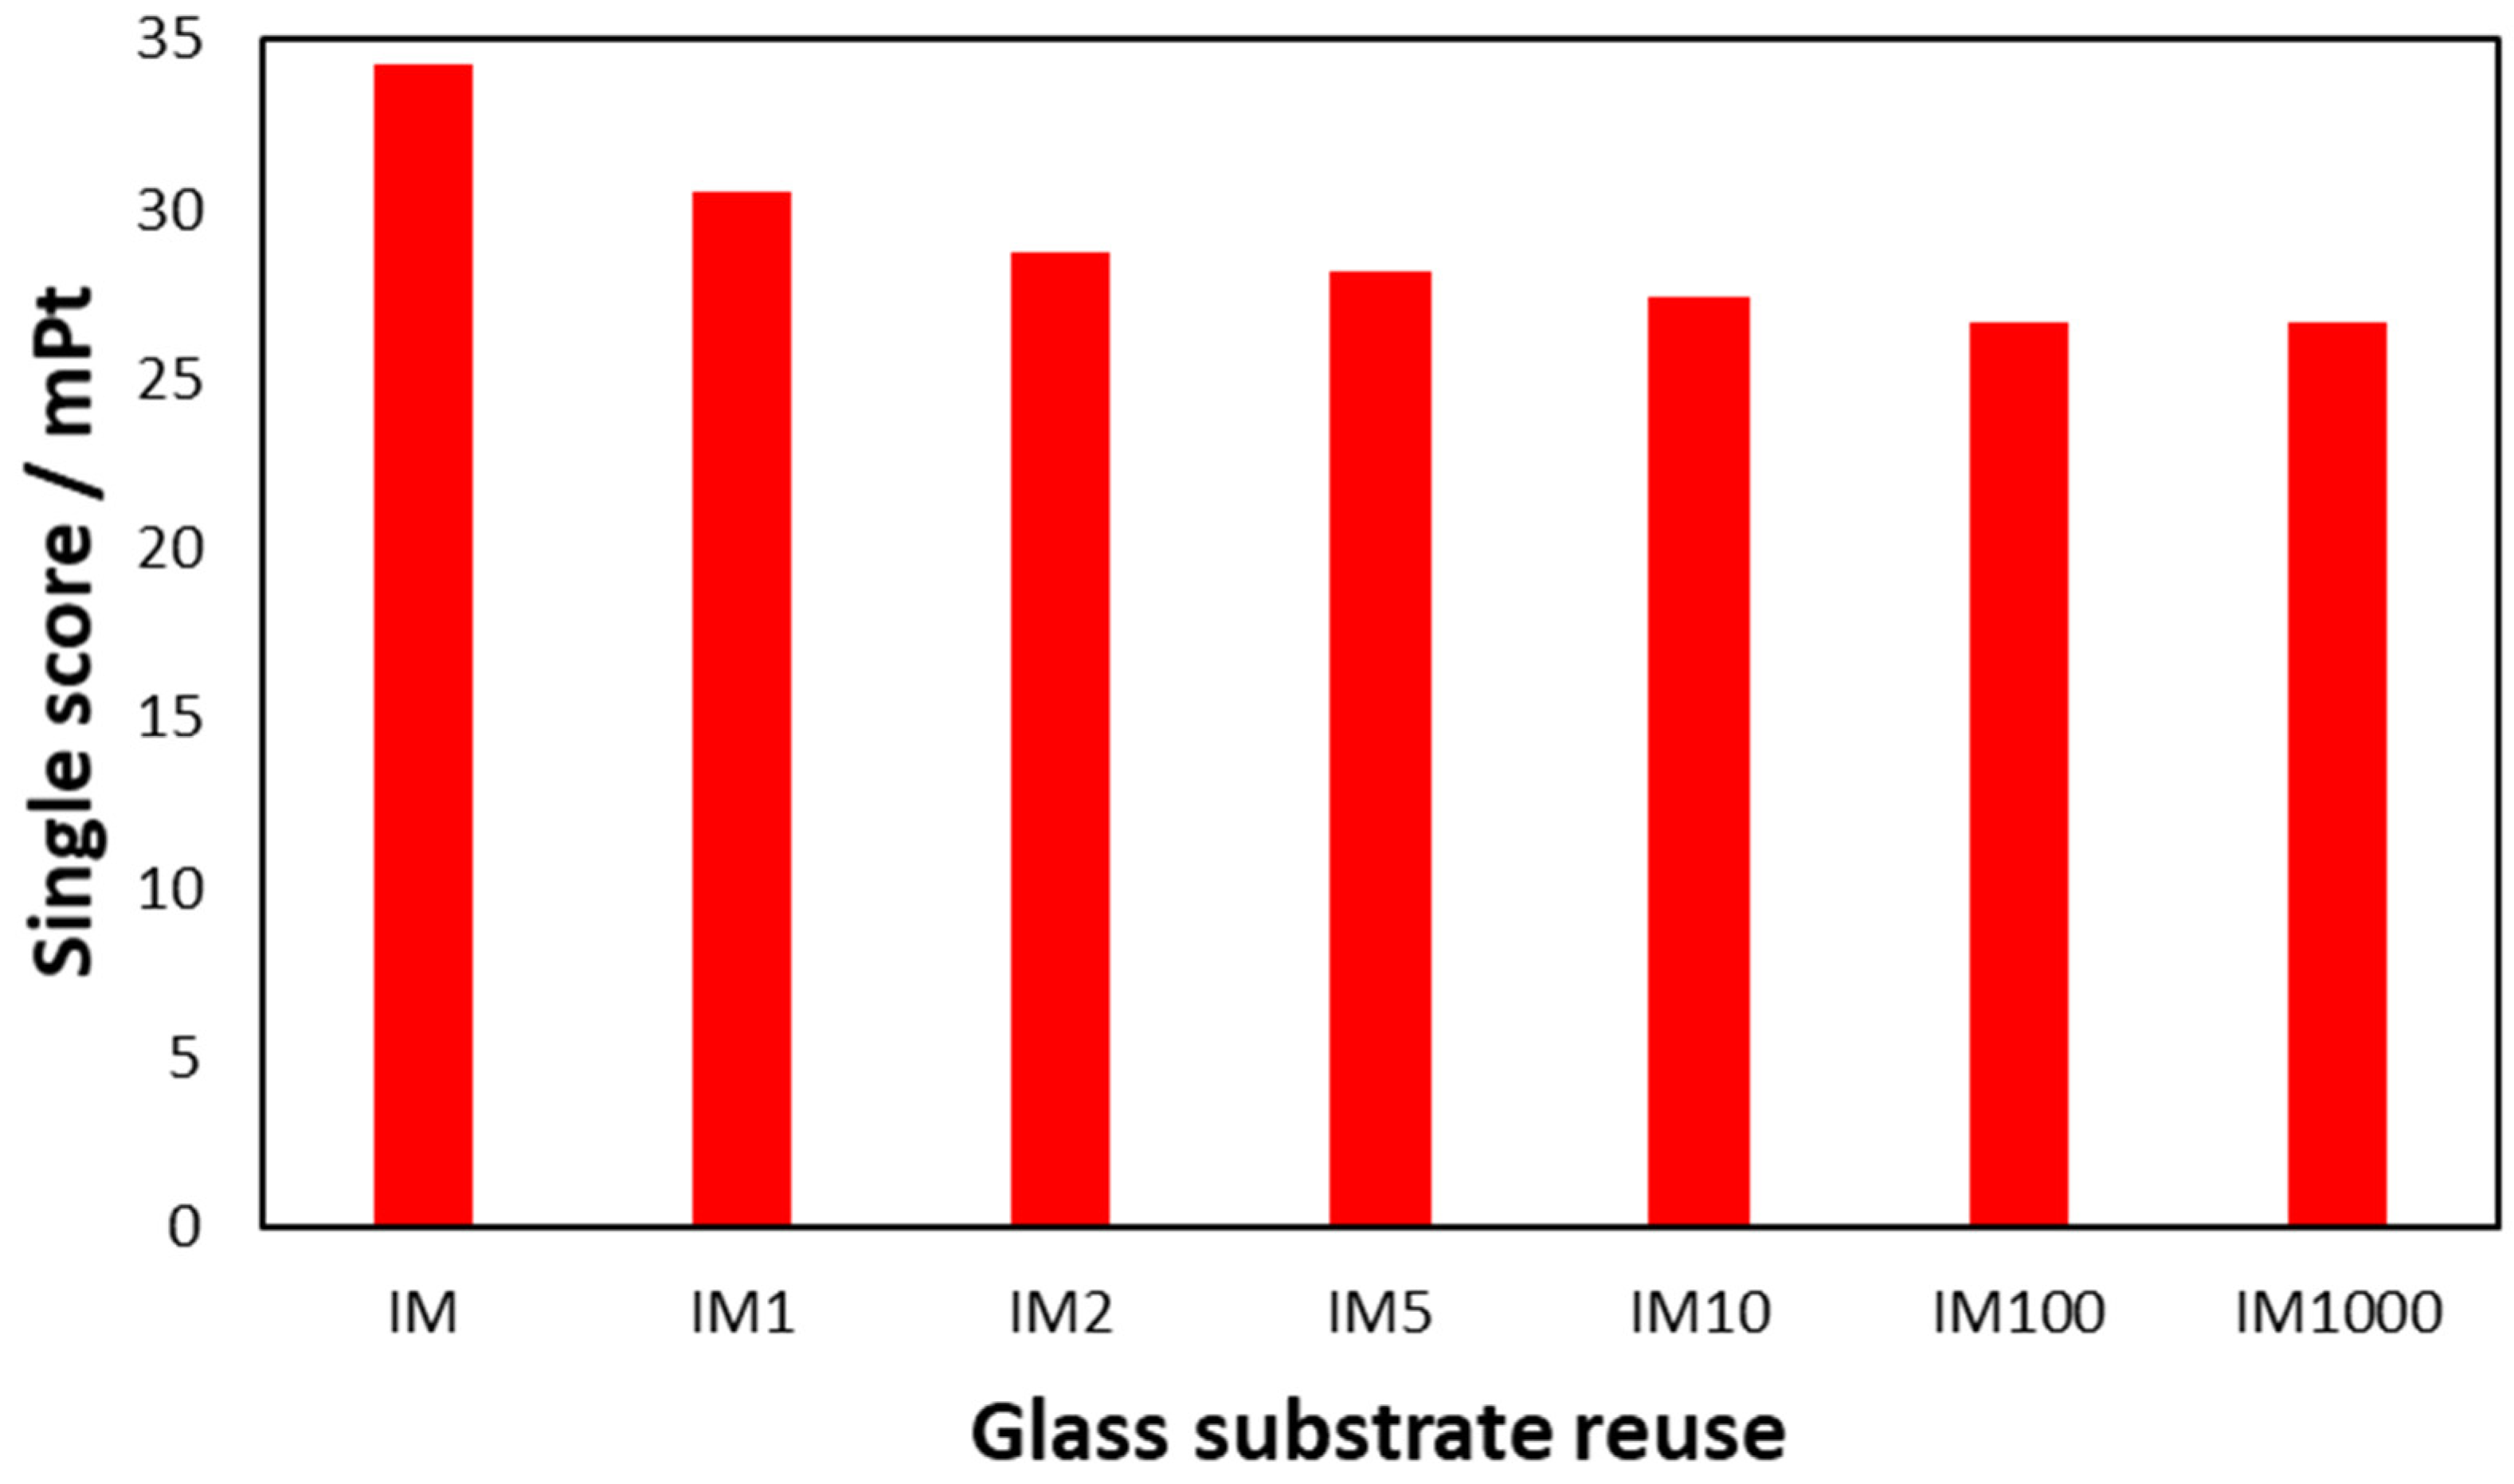
3.2.4. Alternative Scenario 2: Reuse of the Catalyst’s Glass Substrate

Upon further analysis of the differences shown in Figure 7, an alternative scenario to the main comparison was tested where the glass that the catalyst was immobilised on was reused rather than recycled after the catalyst was no longer capable of achieving the desired treatment level. This was to gauge whether significant improvements in sustainability could be achieved by creating a sufficiently robust catalyst reuse system. This scenario also tested the level of reuse and breakage that could one achieve to still negate the sustainability impact of creating the catalyst. Whilst analysing the data from the original scenario, it became apparent that the use of fresh glass each time that the catalyst was worn out contributed a significant proportion of the IM process’ impact on sustainability, with the glass providing 32% of the IPCC result. Therefore, another potentially more environmentally sustainable scenario investigated was the level of glass reuse required to reduce the level of impact that the IM process contributed through catalyst production. This required altering the mass fraction of the glass utilised per system unit and therefore altering the impacts created from producing, processing, and ultimately disposing of the glass for the catalyst used, as well as giving an insight into the required lifetime of the reused glass before significant changes in sustainability are no longer seen. The various levels of reuse are stated below in Table 4.

Scenario 2—LCIA Results Using IPCC Framework

The results in Figure 11 show the GWP as a function of the number of times that the glass substrate was reused. A significant reduction in environmental impact was observed when comparing the lack of glass reuse with IM1 and IM2, which yielded 0.136 kg CO2eq and 0.130 kg CO2eq, respectively, which represents about a 16% decrease in carbon emissions from IM after a single reuse. This significance in impact reduction quickly decreased as the reuse frequency increased, with IM10 and IM100 producing 0.115 kg CO2eq and 0.11 kg CO2eq, respectively, and IM1000 producing 0.109 kg CO2eq in carbon emissions, a 4.3% reduction from IM10 to IM100. Therefore, it can be inferred that reuse produces diminishing returns with a 0.9% reduction in carbon emissions when increasing the reuse frequency from IM100 to IM1000. It is at this point that the contribution of the glass is no longer a significant contributor to the carbon emissions produced by treating the system unit. This can be seen in Figure 11, which shows the IPCC GWP100 fossil contributions from each reuse case considered in this scenario. This figure shows that the percentage contribution of the catalyst for the IM series of processes started at 76.36% when no glass was reused in catalyst production, which then dropped to 71.94% for IM1 and finally to 64.89% for IM1000. This figure suggests that gaining at least 10 extra uses from the glass before it is broken or no longer usable would largely negate the medium’s environmental impact.

Scenario 2—LCIA Results Using ReCiPe Framework

The data were again aggregated using ReCiPe’s endpoint analysis and a single score value was produced (Figure 12). Similarly to the IPCC results, the endpoint results indicated that the diminishing returns on sustainability were yielded after reusing the glass over five times, with the IM1 process generating 30.5 mPt (11% reduction from the original scenario), 28.7 mPt for IM2 (16% reduction from original scenario), and 28.2 mPt for IM5 (17.7% reduction from original scenario). IM10 and IM100 then showed a significantly lower reduction in the single score value, with 27.4 mPt and 26.7 mPt, respectively (20% and 22% reduction from the original scenario, with only a 22% reduction seen for the presumed top-end reduction at IM1000). This suggests that the carbon impact of the use of glass is a larger contributor to the environmental impact of the treatment process than the biogenic or land transformation impact.

4. Conclusions

Increased concentrations of natural organic matter (NOM) in water treatment supply sources are a seemingly increasing threat to the environment and current water treatment infrastructure. Alternative methods for the removal of NOM from drinking water supplies are required to maintain the versatility of efficient and robust water treatment technologies. The environmental sustainability of immobilised and suspended photocatalysis to remove NOM from water was investigated. The life cycle assessment (LCA) methodology was utilised to estimate the sustainability of suspended and immobilised TiO2-based photocatalytic processes. This study explored the impact of two photocatalytic treatment configurations on key environmental categories, including human health, resources, ecosystems, and climate change. It was observed that slurry photocatalysis exhibited a substantially lower environmental footprint, with an 87% reduction compared to immobilised photocatalytic systems. In particular, human health was significantly affected due to the chemical constituents involved in the immobilisation process and the utilisation of fossil fuel-derived electricity for the reaction processes. These findings offer valuable insights into determining the most environmentally sustainable photocatalytic approach for large-scale water remediation in centralised treatment facilities, by comparing immobilised and suspended catalysis methodologies.

Author Contributions

Conceptualisation, E.C.; methodology, D.C.A.G.; software, D.C.A.G.; formal analysis, D.C.A.G.; investigation, D.C.A.G.; resources, E.C.; data curation, D.C.A.G.; writing—original draft preparation, D.C.A.G.; writing—review and editing, E.C. and N.R.; supervision, E.C. and N.R.; project administration, E.C. All authors have read and agreed to the published version of the manuscript.

Funding

This research was funded by Scottish Water, grant number EP/R513209/1.

Data Availability Statement

The original contributions presented in the study are included in the article, further inquiries can be directed to the corresponding author.

Conflicts of Interest

The authors declare no conflicts of interest.

References

  1. Zhang, S.; Zheng, H.; Tratnyek, P.G. Advanced redox processes for sustainable water treatment. Nat. Water 2023, 1, 666–681. [Google Scholar] [CrossRef]
  2. Dong, G.; Chen, B.; Liu, B.; Hounjet, L.J.; Cao, Y.; Stoyanov, S.R.; Yang, M.; Zhang, B. Advanced oxidation processes in microreactors for water and wastewater treatment: Development, challenges, and opportunities. Water Res. 2022, 211, 118047. [Google Scholar] [CrossRef] [PubMed]
  3. McKee, S.M.; Chatzisymeon, E. Assessing the environmental sustainability of light emitting diodes and conventional blacklight lamps for the treatment of bisphenol-A in water. Environ. Impact Assess. Rev. 2022, 97, 106886. [Google Scholar] [CrossRef]
  4. Sundar, K.P.; Kanmani, S. Progression of Photocatalytic reactors and it’s comparison: A Review. Chem. Eng. Res. Des. 2020, 154, 135–150. [Google Scholar] [CrossRef]
  5. Gowland, D.C.A.; Robertson, N.; Chatzisymeon, E. Photocatalytic Oxidation of Natural Organic Matter in Water. Water 2021, 13, 288. [Google Scholar] [CrossRef]
  6. Musial, J.; Mlynarczyk, D.T.; Stanisz, B.J. Photocatalytic degradation of sulfamethoxazole using TiO2-based materials—Perspectives for the development of a sustainable water treatment technology. Sci. Total Environ. 2023, 856, 159122. [Google Scholar] [CrossRef] [PubMed]
  7. Lee, D.-E.; Kim, M.-K.; Danish, M.; Jo, W.-K. State-of-the-art review on photocatalysis for efficient wastewater treatment: Attractive approach in photocatalyst design and parameters affecting the photocatalytic degradation. Catal. Commun. 2023, 183, 106764. [Google Scholar] [CrossRef]
  8. Dijkstra, M.F.J.; Michorius, A.; Buwalda, H.; Panneman, H.J.; Winkelman, J.G.M.; Beenackers, A.A.C.M. Comparison of the efficiency of immobilized and suspended systems in photocatalytic degradation. Catal. Today 2001, 66, 487–494. [Google Scholar] [CrossRef]
  9. Wei, X.; Liu, H.; Gao, S.; Jia, K.; Wang, Z.; Chen, J.J. Photocatalyst: To Be Dispersed or To Be Immobilized? The Crucial Role of Electron Transport in Photocatalytic Fixed Bed Reaction. Phys. Chem. Lett. 2022, 13, 9642–9648. [Google Scholar] [CrossRef]
  10. Chenab, K.K.; Sohrabi, B.; Jafari, A.; Ramakrishna, S. Water treatment: Functional nanomaterials and applications from adsorption to photodegradation. Mater. Today Chem. 2020, 16, 100262. [Google Scholar] [CrossRef]
  11. Manassero, A.; Satuf, M.L.; Alfano, O.M. Photocatalytic reactors with suspended and immobilized TiO2: Comparative efficiency evaluation. Chem. Eng. J. 2017, 326, 29–36. [Google Scholar] [CrossRef]
  12. Grčić, I.; Koprivanac, N.; Puma, G.L. Modeling the photocatalytic oxidation of carboxylic acids on aqueous TiO2 suspensions and on immobilized TiO2-chitosan thin films in different reactor geometries irradiated by UVA or UVC light sources. Chem. Eng. J. 2021, 422, 130104. [Google Scholar] [CrossRef]
  13. Vezzoli, M.; Farrell, T.; Baker, A.; Psaltis, S.; Martens, W.N.; Bell, J.M. Optimal catalyst thickness in titanium dioxide fixed film reactors: Mathematical modelling and experimental validation. Chem. Eng. J. 2013, 234, 57–65. [Google Scholar] [CrossRef]
  14. Binjhade, R.; Mondal, R.; Mondal, S. Continuous photocatalytic reactor: Critical review on the design and performance. J. Environ. Chem. Eng. 2022, 10, 107746. [Google Scholar] [CrossRef]
  15. Chen, D.; Li, F.; Ray, A.K. External and internal mass transfer effect on photocatalytic degradation. Catal. Today 2001, 66, 475–485. [Google Scholar] [CrossRef]
  16. Ray, A.K.; Beenackers, A.A.C.M. Novel swirl-flow reactor for kinetic studies of semiconductor photocatalysis. AIChE J. 1997, 43, 2571–2578. [Google Scholar] [CrossRef]
  17. Ballari, M.D.L.M.; Brandi, R.; Alfano, O.; Cassano, A. Mass transfer limitations in photocatalytic reactors employing titanium dioxide suspensions: II. External and internal particle constrains for the reaction. Chem. Eng. J. 2008, 136, 242–255. [Google Scholar] [CrossRef]
  18. Chen, D.; Li, F.; Ray, A.K. Effect of mass transfer and catalyst layer thickness on photocatalytic reaction. AIChE J. 2000, 46, 1034–1045. [Google Scholar] [CrossRef]
  19. Soleymani, A.R.; Tavassoli, A.M.; Rezaei-Vahidian, H. Assessment of back-side activation of titania thin film using a fixed-bed photocatalytic-reactor: Kinetic study, operating cost and ANN modeling. Chem. Eng. Res. Des. 2023, 190, 759–776. [Google Scholar] [CrossRef]
  20. van Grieken, R.; Marugán, J.; Sordo, C.; Pablos, C. Comparison of the photocatalytic disinfection of E. coli suspensions in slurry, wall and fixed-bed reactors. Catal. Today 2009, 144, 48–54. [Google Scholar] [CrossRef]
  21. Rachel, A.; Subrahmanyam, M.; Boule, P. Comparison of photocatalytic efficiencies of TiO2 in suspended and immobilised form for the photocatalytic degradation of nitrobenzenesulfonic acids. Appl. Catal. B Environ. 2002, 37, 301–308. [Google Scholar] [CrossRef]
  22. Rani, C.N.; Karthikeyan, S.; Doss, S.P.A. Photocatalytic ultrafiltration membrane reactors in water and wastewater treatment—A review. Chem. Eng. Process.-Process Intensif. 2021, 165, 108445. [Google Scholar] [CrossRef]
  23. Pesqueira, J.F.J.R.; Pereira, M.F.R.; Silva, A.M.T. A life cycle assessment of solar-based treatments (H2O2, TiO2 photocatalysis, circumneutral photo-Fenton) for the removal of organic micropollutants. Sci. Total Environ. 2021, 761, 143258. [Google Scholar] [CrossRef] [PubMed]
  24. Elhami, M.; Bahramifar, N.; Bijanzadeh, H.R.; Abyar, H. Process efficiency and life cycle assessment of novel waste-derived Chl/TiO2 photocatalyst for rhodamine B removal. J. Water Process Eng. 2023, 56, 104425. [Google Scholar] [CrossRef]
  25. Lutterbeck, C.A.; Colares, G.S.; Dell’Osbel, N.; da Silva, F.P.; Kist, L.T.; Machado, Ê.L. Hospital laundry wastewaters: A review on treatment alternatives, life cycle assessment and prognosis scenarios. J. Clean. Prod. 2020, 273, 122851. [Google Scholar] [CrossRef]
  26. Yoonus, H.; Al-Ghamdi, S.G. Environmental performance of building integrated grey water reuse systems based on Life-Cycle Assessment: A systematic and bibliographic analysis. Sci. Total Environ. 2020, 712, 136535. [Google Scholar] [CrossRef] [PubMed]
  27. Foteinis, S.; Borthwick, A.G.L.; Frontistis, Z.; Mantzavinos, D.; Chatzisymeon, E.J. Environmental sustainability of light-driven processes for wastewater treatment applications. J. Clean. Prod. 2018, 182, 8–15. [Google Scholar] [CrossRef]
  28. Costamagna, M.; Ciacci, L.; Paganini, M.C.; Calza, P.; Passarini, F.J. Combining the highest degradation efficiency with the lowest environmental impact in zinc oxide based photocatalytic systems. J. Clean. Prod. 2020, 252, 119762. [Google Scholar] [CrossRef]
  29. Juvakoski, A.; Singhal, G.; Manzano, M.A.; Moriñigo, M.Á.; Vahala, R.; Levchuk, I. Solar disinfection—An appropriate water treatment method to inactivate faecal bacteria in cold climates. Sci. Total Environ. 2022, 827, 154086. [Google Scholar] [CrossRef]
  30. Moreno-SanSegundo, J.; Giannakis, S.; Samoili, S.; Farinelli, G.; McGuigan, K.G.; Pulgarín, C.; Marugán, J. SODIS potential: A novel parameter to assess the suitability of solar water disinfection worldwide. Chem. Eng. J. 2021, 419, 129889. [Google Scholar] [CrossRef]
  31. Odling, G.; Chatzisymeon, E.; Robertson, N. Sequential ionic layer adsorption and reaction (SILAR) deposition of Bi4Ti3O12 on TiO2: An enhanced and stable photocatalytic system for water purification. Catal. Sci. Technol. 2018, 8, 829–839. [Google Scholar] [CrossRef]
  32. ISO 14040:2006; Environmental Management—Life Cycle Assessment—Principles and Framework. International Organisation for Standardisation (ISO): Geneva, Switzerland, 2006.
  33. ISO 14044:2006; Environmental Management—Life Cycle Assessment—Requirements and Guidelines. International Organisation for Standardisation (ISO): Geneva, Switzerland, 2006.
  34. Ferretto, A.; Brooker, R.; Matthews, R.; Smith, P. Climate change and drinking water from Scottish peatlands: Where increasing DOC is an issue? J. Environ. Manag. 2021, 300, 113688. [Google Scholar] [CrossRef] [PubMed]
  35. Hashempour, Y.; Nasseri, M.; Mohseni-Bandpei, A.; Motesaddi, S.; Eslamizadeh, M. Assessing vulnerability to climate change for total organic carbon in a system of drinking water supply. Sustain. Cities Soc. 2020, 53, 101904. [Google Scholar] [CrossRef]
  36. Climate & Clean Air Coaltion. METHANE The World’S Second-Largest Contributor to Global Warming after Carbon Dioxide and a Key Ingredient in Ground-Level Ozone Pollution. Available online: https://www.ccacoalition.org/short-lived-climate-pollutants/methane (accessed on 20 April 2024).
  37. Constantino, D.S.M.; Dias, M.M.; Silva, A.M.T.; Faria, J.L.; Silva, C.G. Intensification strategies for improving the performance of photocatalytic processes: A review. J. Clean. Prod. 2022, 340, 130800. [Google Scholar] [CrossRef]
  38. Sun, Y.; Bai, S.; Wang, X.; Ren, N.; You, S. Prospective Life Cycle Assessment for the Electrochemical Oxidation Wastewater Treatment Process: From Laboratory to Industrial Scale. Environ. Sci. Technol. 2023, 57, 1456–1466. [Google Scholar] [CrossRef] [PubMed]
  39. Pesqueira, J.F.J.R.; Marugán, J.; Pereira, M.F.R.; Silva, A.M.T. Selecting the most environmentally friendly oxidant for UVC degradation of micropollutants in urban wastewater by assessing life cycle impacts: Hydrogen peroxide, peroxymonosulfate or persulfate? Sci. Total Environ. 2022, 808, 152050. [Google Scholar] [CrossRef]
  40. de Simone Souza, H.H.; Falqui, L.; Xuereb, R.; Mamo, J.; Abela, S.; Grech, M.; Refalo, P. Environmental assessment of a single-family photocatalytic greywater treatment system based on the design and operating conditions. Sustain. Prod. Consum. 2023, 35, 483–494. [Google Scholar] [CrossRef]
  41. Department for Energy Security & Net Zero. Electricity Generation and Supply in Scotland, Wales, Northern Ireland and England, 2018 to 2022. Available online: https://assets.publishing.service.gov.uk/media/6581b11eed3c3400133bfbb1/Electricity_generation_and_supply_in_Scotland__Wales__Northern_Ireland__and_England__2018_to_2022.pdf (accessed on 1 February 2024).
  42. Scottish Energy Statistics Hub. Share of Renewable Electricity in Gross Final Consumption. Available online: https://scotland.shinyapps.io/sg-scottish-energy-statistics/?Section=RenLowCarbon&Subsection=RenElec&Chart=RenElecTarget (accessed on 1 February 2024).
Figure 1. Schematic of the UV-LED photocatalytic reactor.
Environments 11 00114 g001
Figure 2. System boundaries for the (a) suspended SUS and (b) immobilised IM photocatalytic processes.
Environments 11 00114 g002
Figure 3. Rate of NOM removal from raw water for immobilised (IM) and suspended (SUS) catalyst setups. Experimental conditions: raw water matrix; pH ambient; 370 nm UV-LED; water volume = 25 mL.
Environments 11 00114 g003
Figure 4. NOM removal during UV-LED photocatalysis in the presence of immobilised (IM) and suspended (SUS) catalysts and in consecutive catalyst reuse tests. The treatment time of each test was 100 min.
Environments 11 00114 g004
Figure 5. Percentage contributions of the reactor-, catalyst-, and electricity-related LCI components of the (a) suspended and (b) immobilised systems to the environmental impacts of the treatment process.
Environments 11 00114 g005
Figure 6. Characterisation output from ReCiPe 2016 impact assessment comparing immobilised (IM) and suspended (SUS) catalysts.
Environments 11 00114 g006
Figure 7. Single score output from ReCiPe 2016 impact assessment comparing suspended (SUS) and immobilised (IM) catalysts.
Environments 11 00114 g007
Figure 8. Percentage contributions of the reactor-, catalyst-, and electricity-related components of the (a) SUS and (b) IM photocatalytic processes to the environmental impacts.
Environments 11 00114 g008
Figure 9. Characterisation output from ReCiPe 2016 impact assessment comparing SUS and IM cases.
Environments 11 00114 g009
Figure 10. Single score output from ReCiPe 2016 impact assessment comparing SUS and IM cases.
Environments 11 00114 g010
Figure 11. Environmental impact contributions of immobilised photocatalytic processes with various levels of glass reuse.
Environments 11 00114 g011
Figure 12. Single score output from ReCiPe 2016 impact assessment comparing immobilised photocatalytic processes with various levels of glass reuse.
Environments 11 00114 g012
Table 1. Prepared photocatalysts and their properties.
CatalystDescriptionCatalyst Properties
Immobilised (IM)P25 TiO2 immobilised on a glass mediumBandgap = 3.18 eV; particle sizes of 20–30 nm
Suspended (SUS)P25 TiO2 suspended in the water matrix, without a support mediumBandgap = 3.18 eV; particle sizes of ~25 nm; SBET = 54–55 m2 g−1
Table 2. Life cycle inventory for immobilised and suspended UV-LED/TiO2 processes.
ProcessMaterials/AssembliesItemsSimaPro ComponentQuantity (per Functional Unit)
Suspended and immobilisedLight sourceLight-emitting diodeLight-emitting diode [GLO]|production|Cut-off, S0.200 kg
Heat sinkAluminium alloy, AlMg3 [RER]|production|Cut-off, S3.69 kg
StarboardCopper-rich materials [GLO]|market for copper-rich materials|Cut-off, S
Aluminium alloy, AlMg3 [RER]|production|Cut-off, S
0.400 kg
Reactor vesselGlass beakerGlass tube, borosilicate [GLO]|market for|Cut-off, S0.550 kg
Quartz plateSilicon, metallurgical grade [RoW]| production|Cut-off, S0.285 kg
Lab equipmentOrbital mixerPermanent magnet, for electric motor [GLO]| production|Cut-off, S0.407 kg
SuspendedCatalystTiO2 catalystTitanium dioxide [RER]| market for |Cut-off, S200 mg
Catalyst separationFilterUltrafiltration module [GLO]|ultrafiltration module production, hollow fibre|Cut-off, S1 P
PumpWater pump operation, electric [RoW]|water pump operation, electric|Cut-off, S3.6 kJ
ElectricityElectrical connectionElectricity, low voltage [GB]|market for electricity, low voltage|Cut-off, S214 kJ
ImmobilisedCatalystGlass slideFlat glass, uncoated [RoW]|market for flat glass, uncoated|Cut-off, S0.25 kg
Titanium dioxideTitanium dioxide [RER]| market for |Cut-off, S3.03 g
Titanium butoxideTitanium butoxide4.54 cm3
n-Butanol1-butanol [GLO]|market for|Cut-off, S0.077 kg
Hydrochloric acidHydrochloric acid, Mannheim process (30% HCl), at plant/RER mass1.05 g
ElectricityElectrical connectionElectricity, low voltage [GB]|market for electricity, low voltage|Cut-off, S432 kJ
Table 3. The electricity mix used in the original and alternative scenarios.
Energy SourceOriginal Scenario:
SimaPro Low-Voltage GB Electricity Mix (%)
Scenario 1:
Scottish Renewable Electricity Mix in 2020 (%)
Onshore wind14.1561.20
Offshore wind11.6910.90
Hydro1.4719.60
Bioenergy and Waste13.817.18
Solar PV2.431.02
Wave and tidal0.000.03
Nuclear17.05-
Coal7.22-
Natural gas31.29-
Oil0.89-
Table 4. The levels of glass reuse investigated in scenario 2 for immobilised catalyst glass reuse.
NameReuses of Glass Substrate before Recycling
IM11
IM22
IM55
IM10
IM100
10
100
IM10001000
Disclaimer/Publisher’s Note: The statements, opinions and data contained in all publications are solely those of the individual author(s) and contributor(s) and not of MDPI and/or the editor(s). MDPI and/or the editor(s) disclaim responsibility for any injury to people or property resulting from any ideas, methods, instructions or products referred to in the content.

