Article

Are Ecological Risk Indices for Trace Metals Relevant for Characterizing Polluted Substrates in the Katangese Copperbelt (DR Congo) and for Assessment of the Performance of Remediation Trials?

by
Serge Langunu
1,2,*,
Jacques Kilela Mwanasomwe
1,
Gilles Colinet
2,* and
Mylor Ngoy Shutcha
1,3
1
Ecology, Ecological Restoration and Landscape, Faculty of Agronomic Sciences, Université de Lubumbashi, Lubumbashi 1825, Democratic Republic of the Congo
2
Water-Soil-Plant Exchanges, TERRA, Gembloux Agro-Bio Tech, University of Liège, 5030 Gembloux, Belgium
3
Plant Ecology and Biogeochemistry, Université Libre de Bruxelles, 1050 Bruxelles, Belgium
*
Authors to whom correspondence should be addressed.
Environments 2024, 11(6), 122; https://doi.org/10.3390/environments11060122
Submission received: 3 April 2024 / Revised: 21 May 2024 / Accepted: 6 June 2024 / Published: 11 June 2024
(This article belongs to the Special Issue New Insights in Soil Quality and Management)

Abstract

:
This study aims to contribute to the characterization of Katangese Copperbelt’s (DR Congo) mining wastes and soils polluted with trace metals, using pollution indices and direct concentration measurements. This study also evaluated the use of these indices in assessing the success of remediation projects. Data from previous studies and samples collected from six types of discharge and one polluted soil were used to address the first objective. Soil and plant samples were collected at Kipushi and Penga Penga for the second objective. The results reveal very high concentrations of As, Cd, Co, Cu, Mn, Pb, and Zn in all mine tailings and polluted soils, compared with local references. The degree of contamination (DC) values (from 72 to 5440) and potential ecological risk (RI) values (from 549 to 162,091) indicate very high-risk situations associated with polluted discharges and soils. Regarding revegetation trials, the results show lower concentrations and RIs in tree rhizospheres compared with unamended areas at both sites. However, trace metal concentrations are higher in tree rhizospheres compared with local references, and RI values are in the considerable risk range for Penga Penga (RI = 533) and in the very high range (>1500) for Kipushi. Bioconcentration factor values are below 1, indicating low accumulation in roots, wood, and leaves, and low risk of contamination of the trophic chain. In this context, it seems that the pollution indices used are suitable for characterizing pollution and prioritization for remediation. However, there seems unsuitable for assessing the effectiveness of phytotechnology processes based on metal stabilization. Direct plant performance measurements combined with direct measurements of metals in substrates and plants to assess transfer and efficiency are more appropriate.

1. Introduction

Mining activities in the Katangese Copperbelt (KCB, DR Congo) for more than a century generated great quantities of mining waste. These result from ore extraction in mines and metallurgical processes for ore purification; a typology of mining waste in the KCB is provided in the literature [1,2,3]. Mining is responsible for metal dissemination and the related pollution of the environment, as reported by numerous studies. Mining wastes cover large areas and are an important component of the landscape in the KCB, leading to socio-environmental and public health issues. Several studies have demonstrated the negative impact of mining activities on soils [4,5,6], surface, and groundwater [7,8]. Human exposure occurs via consumption of contaminated agricultural products [9,10] and fish [11] as well as direct ingestion of contaminated dust and water [8]. Evidence of the impact of high exposure to trace metals in the KCB is well documented. Banza et al. [12] produced one of the first reports highlighting the high exposure of populations living close (0–3 km and 3–10 km) to a mining site or refinery in KCB, with all analyzed trace metals being above the World Health Organization’s (WHO) threshold values. Several studies have reported the link between high exposure and the occurrence of specific diseases [13,14,15,16,17]. This high human exposure is exacerbated by the proximity of mining wastes and polluted sites to densely populated cities and urban areas.
Reducing or limiting human exposure to trace metals in the KCB needs a well-conceived remediation plan at a regional scale. Results from trials of mining waste and polluted soil remediation in the KCB are reported in the literature. Remediation is mainly based on the use of metal-tolerant plant species in phytoremediation strategies [18,19,20,21] or the use of woody species to enhance or improve the production of ecosystem services from vegetation to be installed on mining wastes and contaminated soils [10,22,23]. In addition, reclaiming mining wastes based on their valorization in the industry, to extract metals of interest (Cu, Co, Zn, etc.) and reduce their concentrations in the “new” discharged wastes has been proposed [1,24,25,26]. To date, no study of the remediation trials of polluted rivers and lakes has been reported.
Up to now, most reported studies were limited to comparing metal concentrations in waste and contaminated soils to thresholds from the Democratic Republic of the Congo regulation or international standards or assessing the potential of mining waste to release metals into the environment. However, no study has evaluated the risks associated with mining waste and polluted soils based on the pollution indices, and none has used these indices to evaluate the performance of remediation trials in the KCB.
In this context, pollution indices are relevant tools for assessing the hazardousness of mining waste, sediments, and soils in the environment. Used as a means for integrating the concentrations of a certain number of metals to quantify the level of contamination and the risks associated with mining wastes and contaminated sites for humans and the environment, these indices could potentially also be used to prioritize areas for remediation [27]. Numerous indices of the hazardousness of mining waste and contaminated sediments and soils have been developed to assess the risk associated with concentrations of individual (single indices) or several metals (multiple pollution indices) [28,29,30]. Among the most widely used are the enrichment factor and the contamination factor as single indices, and the degree of contamination, the pollution index, and the potential ecological risk index as multiple pollution indices. The use of indices based on metal concentrations to assess the potential risks for humans and the environment is well documented [31,32,33,34,35]. However, their use in assessing the success of remediation trials is very poorly documented, with most of the studies limited to assessing the risks and identifying the phytoremediation potential of plant species [36,37,38,39,40,41].
Taking into account all the aspects described, the overall objective of this study was to contribute to the assessment of the ecological risks associated with high concentrations of trace metals in polluted soils and to evaluate the effectiveness of revegetation trials in reducing ecological risks in reclaimed soils. More specifically, the objectives are to (i) characterize the contamination of mining waste and polluted soils in the KCB, using pollution indices as a tool for setting remediation priorities and (ii) evaluate the potential of these indices as tools for assessing the success of remediation trials based on revegetation with woody species. The results of this study are useful for identifying priorities and improving remediation processes for sites polluted with trace metals in the KCB.

2. Materials and Methods

2.1. Study Area

This study was conducted in the KCB, in the south-east of the Democratic Republic of the Congo. This region is rich in Cu and Co ores and has localized deposits of Zn, Mn, and U, making it one of the world’s most important regions in terms of mineral supply [42,43]. KCB extends over an area more than 500 km long and 50 km wide from Kolwezi to Sakania (Figure 1 and Figure 2). Its climate is humid subtropical with a rainy season from October to April and a dry season from May to September. Average annual rainfall ranges from 1200 mm to 1400 mm, and the mean annual temperature is 20 °C [44]. The region’s dominant soil types are laterites, tropical ferruginous soils, ferralitic soils, and vertisols [45]. The dominant vegetation in the region is miombo open forest [46].

2.2. Source of Data on Metal Concentrations

Primary and secondary data sources were used for this study. Primary data came from sample collection and analysis by the research team. A total of 95 samples were collected from mining wastes and contaminated soils and sediments (from rivers) in the KCB. Secondary data were obtained from articles and grey literature (doctoral dissertations, Master’s theses) based on work carried out in the KCB, as summarized in Table 1.

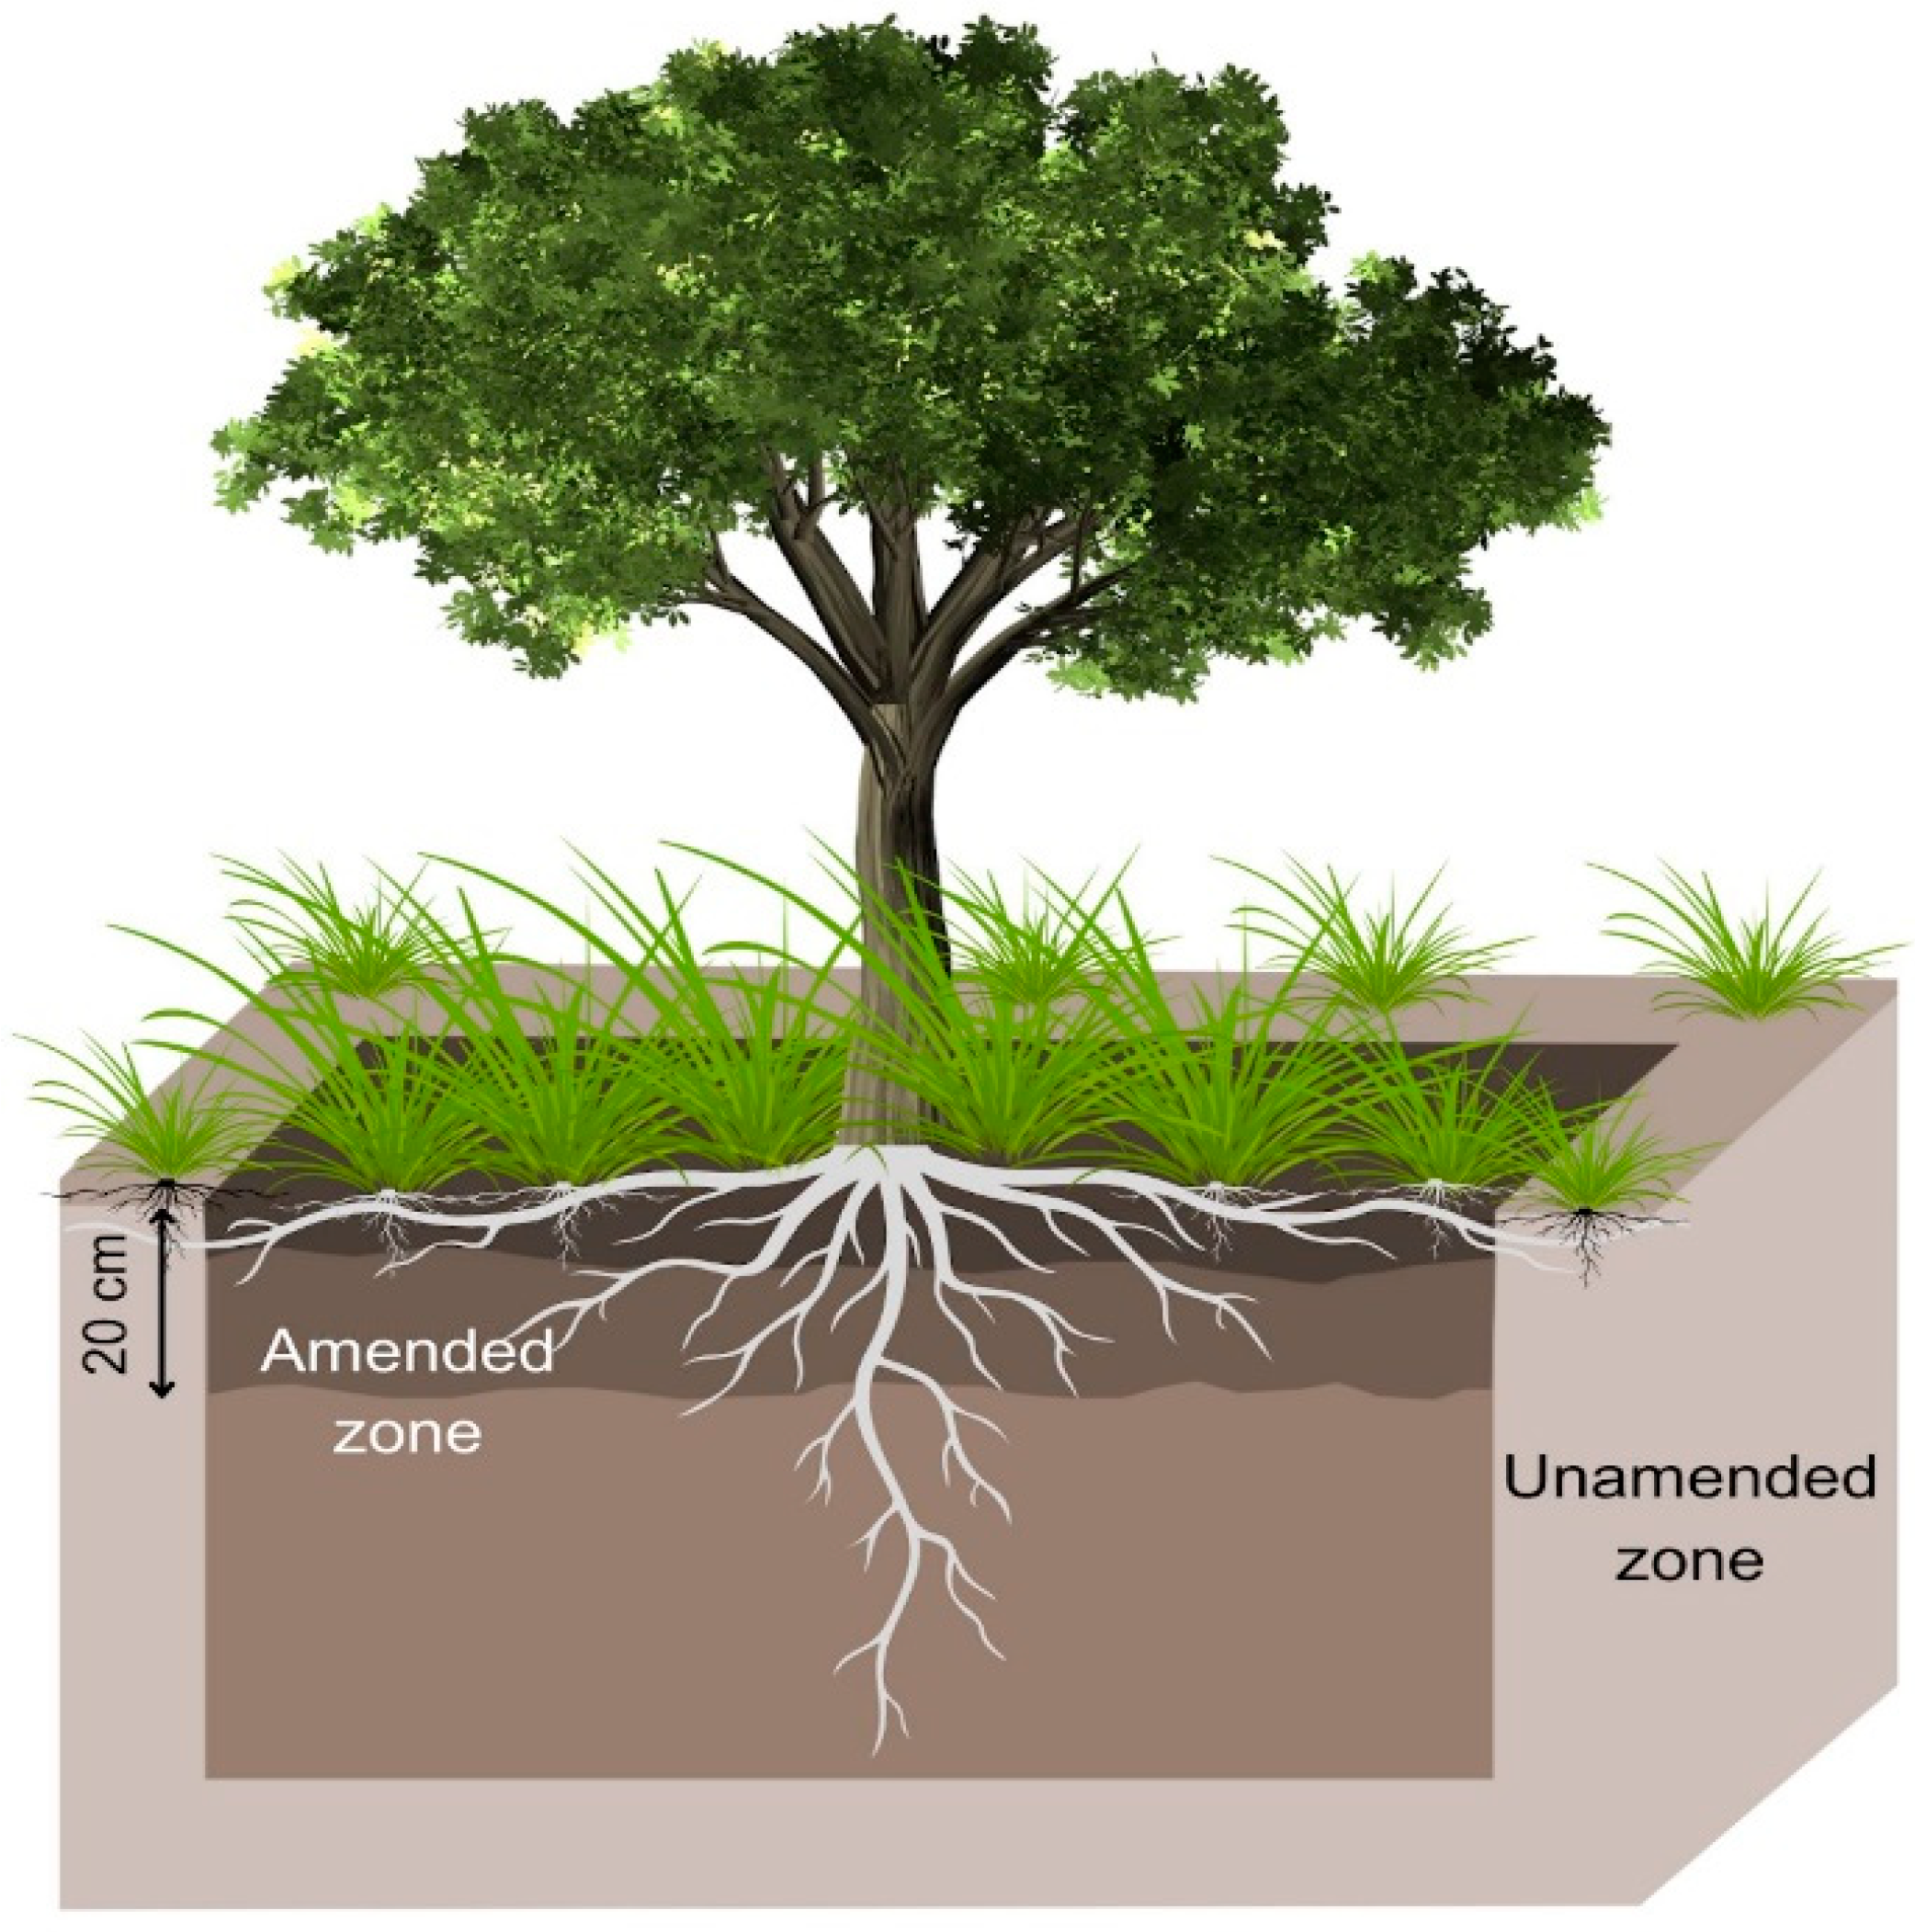
2.3. Assessment of the Potential for Reducing the Ecological Risk Indices through Revegetation with Woody Species

To assess the potential for reducing the ecological risk of mining wastes and contaminated soils by revegetating with woody species, soil samples were taken in a long-term experiment (over 15 years) in the Kipushi tailing (contamination from concentrates of Cu and Zn sulfides by flotation) and in the residential plots of the Penga Penga neighborhood (soil contaminated by deposits from the Gécamines Cu-smelter, see Shutcha et al. [19]. Details of the experiment are provided in the work by Mwanasomwe et al. [22] for Kipushi and in the work by Langunu et al. [10] for Penga Penga. The rhizosphere of the woody species considered corresponds to the layers of amendments that have been filled in the planting holes (Figure 3). In the Kipushi tailing, samples were collected from the rhizosphere surface horizons (0–20 cm) of five woody species: Acacia auriculiformis A. Cunn. ex Benth., Albizia lebbeck (L.) Benth., Cupressus lusitanica Mill., Leucaena leucocephala (Lam.) de Wit, and Syzygium guineense (Willd.). In Penga Penga, the species considered were Mangifera indica L., Persea americana Mill., and Syzigyum guineense. Leaf, wood, and root samples were collected in both sites. Ten leaf samples per individual were collected on ten trees of each species. They were then bulked for each individual for a total of ten bulked samples per species. Wood samples (diameter of 5–7 cm) were collected from two branches for each individual. Two root samples (300–500 g) with diameters ranging from 2 to 15 mm were taken from each tree individually selected. Root, wood, and leaf samples were taken from the same individuals as the soil samples from the rhizosphere.

2.4. Chemical Analysis

Air-dried samples were sieved at 2.0 mm, and a subsample was crushed to 200 µm. Methods were described in the work by Lienard and Colinet [31]. Soil pH was measured potentiometrically in a 1:2.5 (w/v) suspension in water and 1N KCl, while total organic carbon (TOC) was determined using the Springer–Klee method. Major (Ca, Mg, K, P) and trace (Fe, Mn, As, Cd, Co, Cu, Pb, Zn) element concentrations were determined after, respectively, (a) extraction with ammonium acetate-EDTA (0.02 M) at pH 4.65 (w:v 1:5 ratio) and agitation for 30 min (referred to as available metal concentration) for major elements, and (b) aqua regia digestion following ISO 11466 (referred to as total metal concentration). The concentrations in the solutions were measured using flame atomic absorption spectrometry (AAS, Varian 220, Agilent Technologies, Santa Clara, CA, USA) for major elements, except P (colorimetry), and ICP-OES for aqua regia contents.
Leaf and root samples were washed with distilled water, then rinsed with 1% alconox solution to remove soil particles and avoid contamination [49], while bark was removed from wood. All samples were oven-dried at 95 °C for 72 h for leaves and 120 h for roots and wood. Samples (root, wood, and leaf) were ground to powder before being mineralized in a mixture of 65% HNO3 and 75% HClO4. A total of 2 g of homogenized samples were weighed into a 150 mL beaker and attacked with 30 mL of mixed 65% HNO3 and 75% HClO4 on a plate for a cold reaction during 16 h; then, the solution was heated until the solid residues remained; after cooling, 5 mL of 10% HCl was added unto the residues, poured into a 25 mL volumetric flask, and diluted to the mark. Concentrations of As, Cd, Pb, Cu, Co, and Zn were determined using ICP-OES.

2.5. Calculation of Risk Indices

The enrichment factor (EF), the degree of contamination (DC), and the potential ecological risk (RI) were used as indices to assess the hazardousness of trace metal concentrations in mine tailings and affected soils in the KCB. All these indices were determined according to Håkanson’s guidelines [27].
The EF was used to determine the degree of metal enrichment in discharges and soils compared with natural levels. It was calculated using Fe as the reference element [50,51] according to Formula (1). Five enrichment levels are described as a function of EF values [29]: depletion to mineral enrichment if EF < 2, moderate enrichment if 2 ≤ EF ˂ 5, significant enrichment if 5 ≤ EF ˂ 20, very high enrichment if 20 ≤ EF ˂ 40, and extremely high enrichment if EF > 40.
EF = (Csample/Fesample)/(Cref/Feref)
where Csample = the concentration of the metal in the sample; Fesample = the concentration of iron in the soil; Cref = the concentration of the reference soil metal; and Feref = the concentration of the reference soil iron.
The DC is calculated on the basis of the sum of the contamination factor (CF) values for each trace metal analyzed (Formula (2)). The CF is calculated on the basis of the trace metal concentration values in the waste/soil samples and those of the reference geochemical background (3). Following the DC, four categories of contamination were used: low degree of contamination if DC < 8, moderate degree of contamination if 8 ≤ DC < 16, considerable degree of contamination if 16 ≤ DC < 32, very high degree of contamination if DC > 32.
DC = ∑CF
CF = Csample/Cref
where DC is the degree of contamination of a given release/soil, CF is the contamination factor for a particular metal, Csample = the concentration of the metal in the release/soil analyzed, and Cref = the concentration of metal in the reference soil from the region.
The RI is the sum of the ecological risk factor (Er) values for each metal (Formula (4)). The Er is used to determine the potential risk that each metal in the substrate presents to the environment and human health. The Er calculation involves the contamination factor (CF) and the toxicological response factor (Tr) values for each metal (Formula (5)). Er values were calculated using empirical values for the Tr of each metal (Table 2) [30,51].
RI = ∑Er
Er = CF × Tr
where RI = potential ecological risk index; Er = ecological risk factors (for each metal); Tr = the toxicological response factor for a given substance; and Cf is the contamination factor. The Tr values for heavy metals found by Hamid et al. [52] are given in Table 2. Based on the Er values, the categories of ecological risk related to a single metal are as follows: Er < 40, low ecological risk; 40 ≤ Er < 80, moderate ecological risk; 80 ≤ Er < 160, considerable ecological risk; 160 ≤ Er < 320, high ecological risk; and Er ≥ 320, very high ecological risk. With regard to RI, the categories are as follows: RI < 150 = low risk; 150 ≤ RI < 300 = moderate risk; 300 ≤ RI < 600 = considerable risk; RI ≥ 600 = very high risk.
In addition to the RI, the bioconcentration factor (BCF) was calculated to assess the amount of trace metals taken up in roots, wood, and leaves of woody species planted at Kipushi. BCF is the ratio of metal concentration in organs to that in soil/substrate (Formula (6)) [53,54].
BCF = Ctree tissue/Csoil
where Ctree tissue is the metal concentration in a given tissue and Csoil is the pseudo-total metal concentration in the soil.

2.6. Statistical Analyses

Descriptive statistical tests were applied to the mineral concentration data from the KCB mining wastes and polluted soils considered in this study. Detection Limit (DL)/2 imputation methods were used to integrate all data < DL in all analyses [55]. The Shapiro–Wilk normality test was applied to assess the distribution of data. As the data were not normally distributed, even after logarithmic transformation (no transformation for pH), the non-parametric Kruskal–Wallis test was applied to compare the concentration values of each parameter analyzed among the sites. Principal component analysis (PCA) was applied as a multivariate model to compare sites by integrating all the parameters analyzed.
Data from woody species revegetation trials and tree plantations at Penga Penga were also subjected to a Shapiro–Wilk normality test. The logarithmic transformation having corrected the data distribution, Student’s t-test was applied to compare the mineral conditions and RI of the surface horizons of the rhizospheres of woody species and those of the surrounding unamended areas. The t-test was applied separately for each of the two sites (Kipushi and Penga Penga). A two-factor ANOVA was applied to compare metal concentrations in roots, wood, and leaves at Kipushi. The factors considered were species and organ. All analyses were performed using R Studio (4.0.1).

3. Results

3.1. Concentration of Trace Metals in Mining Wastes and Contaminated Soils

Table 3 shows the descriptive statistics applied to parameters analyzed on KCB’s mining wastes and polluted soils. The range of pH values (water and KCl) observed for polluted sites (pHwater: 4.0–10.6; pHKCl: 3.5–11.7) entirely covered that observed in unpolluted forest soils (pHwater: 4.0–7.3; pHKCl: 3.8–5.8). Table 3 also highlights the high concentrations of metals in the mining wastes and contaminated soils considered in this study, compared with the forest soils taken as reference, and also shows very high average concentrations compared with the international thresholds. Similarly to Fe, which is a major element (9890–320,000 mg kg−1), all the measured trace elements showed high levels of variability. Cu and Zn were the trace metals with the highest average and ranges of concentrations; respectively, 12,657 mg kg−1 (116–75,000 mg kg−1) for Cu and 13,250 mg kg−1 (0.02–200,000 mg kg−1) for Zn. The range of concentrations for the other elements was <0.003–12,159 mg kg−1 for As, <0.001–17,414 mg kg−1 for Cd, 2.52–2300 mg kg−1 for Co, 15–9600 mg kg−1 for Mn, and <0.003–58,000 mg kg−1 for Pb.
The Kruskal–Wallis test applied to all of the analyzed parameters showed strong variations between sites (Appendix A Figure A1). Slag (Sc) had the highest pH values (p < 0.05) (pHwater slag = 5.6–10.6 vs. 4.0–8.7 for other substrates). It is noted that classes cover ranges from acidic to strongly basic conditions and therefore pH should seldom be considered as an indicator of waste nature. Wastes resulting from Cu-Zn sulfide concentration by flotation (CFSCuZn) showed higher concentrations (p < 0.05) of As, Pb, and Zn, with values ranging from 7.8 to 12.2 mg kg−1 for As (vs. <LOQ-2395 for others), 498 to 58,000 mg kg−1 for Pb (vs. <LOQ-8000 for others), and 10 182 to 200,000 mg kg−1 for Zn (vs. 0.02–65,000 for others). Cd concentrations were higher (p < 0.05) in river sediments, with values of 24–17,414 mg kg−1 (vs. 0.003–2395 for others). Co concentrations were higher in wastes from Cu-Co oxide concentration and in slag, with respective values of 4310–26,700 mg kg−1 and 910–23,000 mg kg−1 vs. <LOQ-4900 mg kg−1 and 11–3839 mg kg−1 for the other substrates. For Cu, the Kruskal–Wallis test shows similar concentrations in all wastes and soils, except for river sediments. The latter showed lower concentrations (p < 0.05) compared with all other discharges (116–12,113 mg kg−1 for river sediments vs. 313–75,000 mg kg−1 for other discharges). The remarks made about pH can also be made about the metal content; even if there are significant differences between groups of wastes, the frequency distributions usually overlap each other.
Projection of the variables in the CP1 × CP2 plane (59.1% total variation) of the PCA shows trends observed with the KW test (Figure 4). CFSCuZn are associated with the highest concentrations of As, Pb, and Zn, while SR is associated with the highest Cd concentrations but the lowest Cu concentrations. Slag and COCoCu are associated with the highest Co and pH values. Other wastes occupy intermediate positions.

3.2. Ecological Risk Associated with Trace Metal Concentrations

The values for EF and CF were generally above 1, indicating enrichment and trace metal contamination. Only seven values (out of 42) for each index were less than or equal to 1. The DC values of all mining wastes and contaminated soil show very high levels of contamination as they exceeded 32 (Table 4). The decreasing order of DC values can be classified as follows: SR (5440) > CFSCuZn (2027) > Slag (338) > COCoCu (180) > DP (155) > CFSCu (72). The high DC values are mainly due to Cd for SR; Zn, Cd, and Pb for CFSCuZn; Zn and Co for slag; and COCoCu and Cu for DP.
RI values indicate high potential ecological risks associated with trace metal concentrations in all study sites. The decreasing order of RI values is as follows: SR (162091) > CFSCuZn (21959) > DP (1219) > slag (1109) > COCoCu (905) > CFSCu (549) (Table 5). The trends in the metals influencing RI values are the same as those observed for DC values. It should be noted, however, that DP presents a higher potential ecological risk index compared to slag, contrary to the trends observed with DC values.

3.3. Impact on RI and BCF Values of the Localized Excavation and Replacement Approach for Revegetation

3.3.1. Profile of Edaphic Conditions and RI Values

The results show a better fertility status in rhizospheres of trees at both sites with higher concentrations (p < 0.05) of P, K, and TOC compared with unamended areas (Table 6). In contrast, total trace metal concentrations were lower in the rhizospheres compared to the unamended areas at both Kipushi and Penga Penga. Co was the only exception to the general trend with higher concentrations in the rhizosphere of trees (932 ± 407 mg kg−1) compared to unamended areas (102 at ± 57 mg kg−1) in Kipushi.
The results show lower RI values in the rhizospheres of trees planted at Kipushi and Penga Penga. At Kipushi, the averaged RI value was 5704 ± 3222 in the unamended areas while it was 1522 ± 400 in the rhizosphere of the trees. At Penga Penga, the RI value was 1532 ± 503 in the unamended areas while it was 533 ± 493 in the tree rhizospheres.

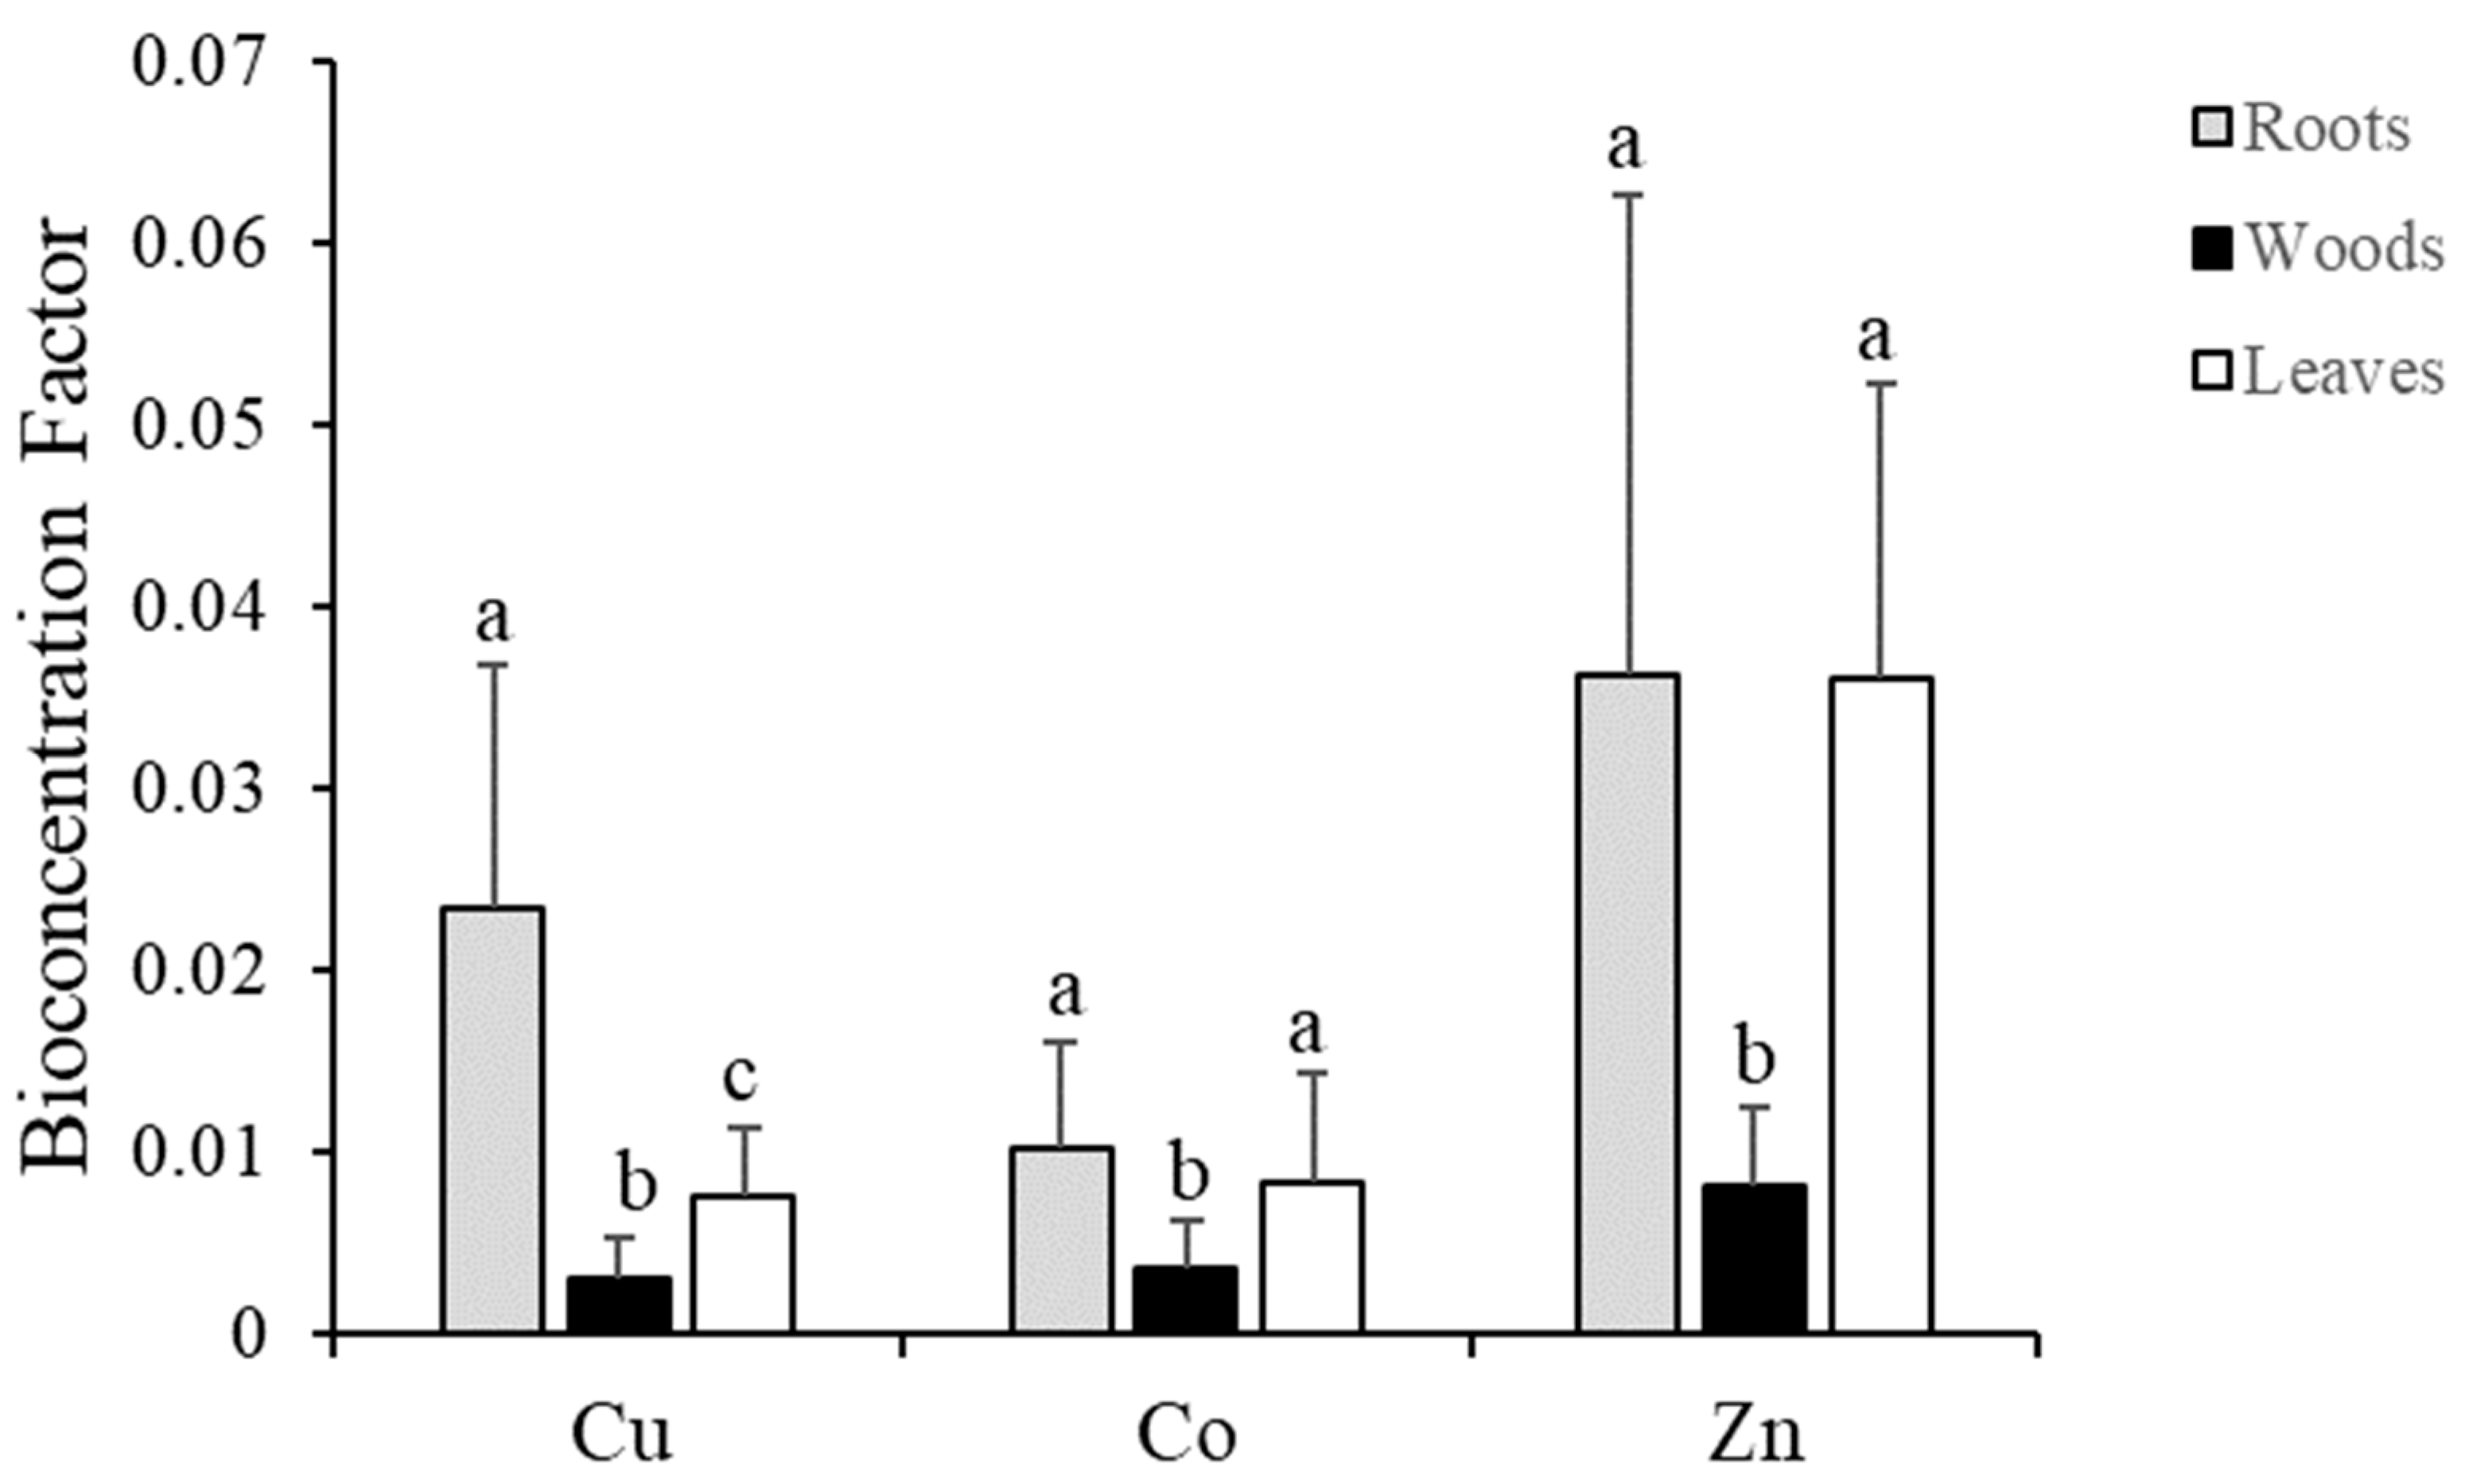
3.3.2. Accumulation in Plant Tissues and Bioconcentration Factor Values at Kipushi

Co, Cu, and Zn concentrations were lower (p < 0.05) in wood compared with roots and leaves. Cu concentrations were higher in roots (57.3 ± 22.5 mg kg−1) than in leaves (17.8 ± 4.2 mg kg−1). Co and Zn concentrations were similar in roots (Co = 3.8 ± 2.2, Zn = 289 ± 195 mg kg−1) and leaves (Co = 2.7 ± 1.3, Zn = 293 ± 126 mg kg−1) but lower in wood (Co = 1.2 ± 0.8, Zn = 67 ± 37 mg kg−1). All BCF values were below 1, including all tissues (roots, wood, and leaves) of all species and all three metals analyzed, ranging between 0.0004 and 0.09 (Figure 5). For all metals, BCF values were lower in wood compared to roots and leaves.

4. Discussion

4.1. Metal Concentrations and Ecological Risks Associated with Polluted Soil and Wastes in KCB

The wide variability in the values between mining wastes (for all parameters considered) in this study reflects the heterogeneity of the mineralogical composition of ores extracted from the KCB’s metalliferous deposits, as well as the metallurgical processes and other treatments after their release from the plants. The variability in the chemical and mineralogical composition of the deposits in the KCB is well documented and can be explained by the history of their emergence during geological eras [59,60,61]. Furthermore, the nature of ores (and therefore their chemical composition) leads to the application of different metallurgical schemes and the use of different inputs [62,63,64]. For example, oxide ores are subjected to hydrometallurgical processes, while sulfide ores are subjected to smelting processes [24,60]. The influence of ore origin is illustrated by the higher Zn concentration values in the tailing ponds from the concentration of Cu and Zn sulfide ores, while Co concentration is higher in discharges from Cu and Co oxide ores. In contrast, high pH values in wastes from ore concentrations (Cu and Zn sulfide ores, Cu sulfide ores, etc.) stored in sedimentation ponds most often illustrate the influence of treatments applied to the discharges, notably the application of lime for pH neutralization [2,3,65]. The high Ca and Mg values support this explanation.
Unsurprisingly, trace metal concentrations are much higher in mining wastes and contaminated soils compared to those reported from the reference geochemical background of non-metalliferous soils [56,57] as well as those reported from non-anthropized metalliferous soils [66]. This result explains the high values of DC (Table 4) and RI (Table 5). For example, the DC and RI values of mining wastes were 2 to 170 times (DC: 72–5440) the threshold of “high contamination” (DC > 32) and 1 to 270 times the threshold for “very high risk” (RI = 549–162,091). Such high levels of DC and RI are rarely reported in the literature [67,68,69,70,71,72,73] and would place KCB among the most trace-metal-polluted regions in the world. In line with the high DC and RI, all the studied soils and discharges show very high average concentrations when compared with international reference threshold values [54,58]. These results support the exceptionally high levels of trace metal exposure in KCB populations as reported by several authors over the past 15 years, indicating concentrations of Cd, Co, U, Cu, and Zn above the threshold in the urine, blood, and semen, leading to oxidative DNA disorders, infertility, malformation in newborn babies, and cancer in people living near mining activities [12,13,15,16].
The results emphasize the contribution of certain trace metals, such as Cd and Pb, in the high ecological risk related to mining waste due to their toxicological characteristics despite relatively lower concentration levels compared to metals such as Cu and Zn (Table 5). They underline the need to analyze an extended set of trace metals for a better ecological risk assessment. For example, including all potentially harmful metals would help to refine the risk assessment associated with mining waste. In addition, given that the contamination classification usually used is not relevant for the sites studied, as we found DC values well over 32, we suggest that DC news and the use of other pollution indices be developed.

4.2. Revegetation on the Basis of Excavation and Replacement and Ecological Risk Index

Revegetation trials with woody species installed since 2005 were based on the localized excavation of planting sites followed by the replacement of polluted sediments and soils with organic matter [10,23]. The present study represents a first assessment of the ability of this approach to reduce ecological risks using indices, the previous ones being based mainly on edaphic conditions (based on AA-EDTA extractable Co, Cu, and Zn concentrations) and metal concentrations in aboveground organs without subtracting the influence of dust. The results of this study confirm an improvement in conditions in the rhizosphere surface horizons of the evaluated woody species (Table 6), thanks to better organic matter, P and K values, and generally lower trace metal concentrations compared with the surface horizons of the surrounding unamended substrates. Nevertheless, trace metal concentrations remain high (compared with regional references), probably due to the metal release from surrounding substrates, as argued by Langunu et al. [10] for the case of Penga Penga but also demonstrated for other regions [74]. Kaniki’s [1] leaching test results also support the mobility of metals in the discharge of Cu and Zn sulfide concentrates at Kipushi.
The potential ecological risk index was lower in the amended and planted areas thanks to lower concentration levels, particularly of the most hazardous metals such as Cd and Pb (Table 6). Nevertheless, the RI values correspond to considerable (300 ≤ RI < 600) to high (RI ≥ 600) risks. In other words, based on trace metal concentrations, the rhizospheres of trees planted in the Kipushi tailing disposal and the Penga Penga polluted soil, made up of organic matter and other inorganic amendments (in the case of Penga Penga, e.g., termite mound soil, etc.), have been progressively enriched in trace metals to (total) concentrations that present significant ecotoxicological risks for the environment and human health. Although current results do not allow us to estimate trends with any certainty, concentrations in the rhizosphere may increase if metal release continues. This phenomenon of metal migration from contaminated substrates to rhizospheres made up of uncontaminated soil improvers should be further investigated in future studies. Such investigations will provide a better understanding of the success of revegetation methods for polluted sediments and soils based on localized excavation and replacement with unpolluted soil and soil improvers.
Nevertheless, the survival and performance of species over the last 15 years [22] combined with low accumulation levels and low BCF values (<0.2 for all species and the three metals analyzed, Figure 5) demonstrate a reduction in metal mobility and bioavailability. In this context, measurement of the ability of amendments to reduce metal mobility and prevent their transfer to other environment components seems to be key for the assessment of the success of such remediation approaches.

4.3. Implications for Remediation of Polluted Soil

The results of this study reveal the extremely high levels of contamination and significant ecological risks associated with high concentrations of trace metals in mine tailings and polluted soils and sediments in the KCB. These observations justify the ongoing search for advanced remediation and risk reduction techniques, which have been examined by several studies over the last two decades [1,2,24,25]. The approaches suggested by these studies include physico-chemical processes aimed at reducing the high concentrations of trace metals in the soil. In particular, the recovery of mining waste by metallurgical processes, as proposed by Kaniki and Tumba [2] and Mambwe et al. [3], is essential for reducing trace metal concentrations. This should be considered before revegetating certain polluted sites with metal-tolerant plant species [10,18,19,21,23], which can contribute to limit the spread of contaminants in the environment and reduce human exposure. Furthermore, for the urban and densely populated areas established on the polluted soils of Penga Penga, a more participatory approach, as recommended by Mwanasomwe [74], should be envisaged to take better account of the needs of the populations and the best technical itineraries for the remediation of polluted urban areas with trees and herbaceous species [19]. However, it appears that there is currently no coordinated strategy to address the issue of contamination on a regional scale in the KCB, nor are there systematic methods for assessing the effectiveness of different rehabilitation techniques. The results of this study highlight the need to develop an integrated approach to environmental remediation, considering the different characteristics of mining waste and polluted soils, as well as their proximity to residential areas and sensitive ecosystems. In addition, our results highlight the importance of extending remediation efforts to all types of mining waste, including river sediments and copper and zinc sulfide flotation residues.
The results of the assessment of the remediation tests on mine tailings and polluted soils show that the ecological risk values remain high in the amended areas vegetated with woody plants, although they are lower than in the non-vegetated areas. These results suggest that the ecological risk associated with trace metal concentrations in amended areas of KCB mine tailings and polluted soils potentially increases over time due to the release of metals from unamended matrices by a lateral transfer [10,22].
In this case, the use of pollution indices to assess the effectiveness of remediation seems inadequate as these indices mainly focus on the concentrations and toxicological characteristics of trace metals [51,75], without taking into account the ability of remediation techniques to prevent the dissemination of metals in the environment. It is important to note that not all phytotechnology methods aim to reduce trace metal concentrations in the polluted soil medium. Phytostabilisation, for instance, being a strategy that aims to contain metals on site and prevent their dispersion, may be more effective in areas with high polymetallic contamination [76,77,78]. It would be useful to associate indicators of trace metal stability in these matrices, by describing their physical characteristics and using appropriate extraction techniques to assess their mobility. In addition, the bioconcentration factor (BCF) and direct measurement of concentrations in the aboveground tissues of plants are more relevant indicators for assessing the success of techniques based on metal stabilization. These measurements make it possible to assess the success of the method in preventing the spread of metals in the trophic chain. The results of this study and those of Langunu et al. [10] support this approach. On the other hand, the use of the potential ecological risk index may be more appropriate for assessing phytotechnology methods aiming to extract and reduce the level of trace metal concentrations in soil and sediment, such as phytoextraction [78].

5. Conclusions

This study used pollution indices to assess the ecological risks associated with KCB mining waste and soils polluted by trace metals and to evaluate the effectiveness of revegetation trials in reducing potential ecological risks in remediated soils. The results confirm the high ecological risks related to the high concentrations of trace metals and the high values of the RI for the mining waste and contaminated soils examined in this study. They also provide information on the variability of the risks associated to the various types of mining wastes and contaminated soils with potential implication on the prioritization and selection of the most suitable strategies of remediation.
The evaluated remediation strategy shows the effectiveness of amendment in reducing the mobility and bioavailability of metals through the observation of low BCF values. It also led to a reduction in IR in the rhizospheres of the trees, even though their values still represent a considerable ecological risk. Thus, the pollution indices used in this study are not suitable for assessing the effectiveness of phytotechnology methods based on stabilization, suggesting the development or use of other pollution indices that take into account the reduction in trace metals mobility and bioaccessibility, such as the BCF.
Future studies should better assess the dynamics of metal enrichment in rhizospheres after filling planting holes with unpolluted soil improvers and the implications for long-term human exposure risks. They should also focus on developing indices that take into account the reduced mobility of elements in substrates subject to remediation.

Author Contributions

Conceptualization, S.L., G.C. and M.N.S.; methodology, S.L., J.K.M., M.N.S. and G.C.; software, S.L. and J.K.M.; validation, S.L., J.K.M. and M.N.S.; formal analysis, S.L., M.N.S. and G.C.; investigation, S.L. and J.K.M.; resources, G.C. and M.N.S.; data curation, S.L. and M.N.S.; writing—original draft preparation, S.L.; writing—review and editing, G.C. and M.N.S.; visualization, G.C. and M.N.S.; supervision, G.C. and M.N.S.; project administration, G.C.; funding acquisition, G.C. All authors have read and agreed to the published version of the manuscript.

Funding

This research received no external funding.

Data Availability Statement

No new data were created or analyzed in this study. Data sharing is not applicable to this article.

Acknowledgments

The authors are grateful to the Academy of Research and Higher Education (ARES) through the Zorglub Project for the financial means made available. Serge L. is a research fellow in the Zorglub project. We also thank Ckeface Kamwenga Kissi and Thierry Baya Kalala for their invaluable assistance in data collection.

Conflicts of Interest

The authors declare no conflict of interest.

Appendix A

Figure A1. Comparison of metal concentrations in different types of discharge. CFSCu = wastes from concentrates of Cu sulfides by flotation, CFSCuZn = wastes from concentrates of Cu and Zn sulfides by flotation, COCuCo = wastes from concentrates of Cu and Co oxides, DP = deposit from smelting emissions, Sc = slag, SR = river sediments from mining plants. Values are represented by the mean ± standard deviation; min, means, and max. Means with the same letter (a, b, c) are not significantly different (p < 0.05).
Environments 11 00122 g0a1

References

  1. Kaniki, A.T. Caractérisation Environnementale des Rejets Minero-Metallurgiques du Copperbelt Congolais. Ph.D. Thesis, University of Liège, Liège, Belgium, 2008; p. 284. [Google Scholar]
  2. Kaniki, A.T.; Tumba, K. Management of mineral processing tailings and metallurgical slags of the Congolese copperbelt: Environmental stakes and perspectives. J. Clean. Prod. 2019, 210, 1406–1413. [Google Scholar] [CrossRef]
  3. Mambwe, P.; Shengo, M.; Kidyanyama, T.; Muchez, P.; Chabu, M. Geometallurgy of Cobalt Black Ores in the Katanga Copperbelt (Ruashi Cu-Co Deposit): A New Proposal for Enhancing Cobalt Recovery. Minerals 2022, 12, 295. [Google Scholar] [CrossRef]
  4. Narendrula, R.; Nkongolo, K.K.; Beckett, P. Comparative Soil Metal Analyses in Sudbury (Ontario, Canada) and Lubumbashi (Katanga, DR-Congo). Bull. Environ. Contam. Toxicol. 2012, 88, 187–192. [Google Scholar] [CrossRef]
  5. Pourret, O.; Lange, B.; Bonhoure, J.; Colinet, G.; Decrée, S.; Mahy, G.; Séleck, M.; Shutcha, M.; Faucon, M.-P. Assessment of soil metal distribution and environmental impact of mining in Katanga (Democratic Republic of Congo). Appl. Geochem. 2016, 64, 43–55. [Google Scholar] [CrossRef]
  6. Mpinda, M.T.; Mujinya, B.B.; Mees, F.; Kasangij, P.K.; Van Ranst, E. Patterns and forms of copper and cobalt in Macrotermes falciger mounds of the Lubumbashi area, DR Congo. J. Geochem. Explor. 2022, 238, 107002. [Google Scholar] [CrossRef]
  7. Atibu, E.K.; Devarajan, N.; Thevenon, F.; Mwanamoki, P.M.; Tshibanda, J.B.; Mpiana, P.T.; Prabakar, K.; Mubedi, J.I.; Wildi, W.; Poté, J. Concentration of metals in surface water and sediment of Luilu and Musonoie Rivers, Kolwezi-Katanga, Democratic Republic of Congo. Appl. Geochem. 2013, 39, 26–32. [Google Scholar] [CrossRef]
  8. Mudimbi, K.D.; Kabamba, T.A.; Kodondi, K.-k.F.; Luboya, O.; Christian Kasongo, B.C.; Kabundi, K.D.; Kisunka, B.Y.; Musola, C.H.; Longanga, O.A.; Lukumwena, K. Impact of mining on water of the rivers Shinkolobwe, Lwisha in the province of Katanga (DRC). J. Med. Res. 2017, 3, 71–73. [Google Scholar]
  9. Muimba-Kankolongo, A.; Banza Lubaba Nkulu, C.; Mwitwa, J.; Kampemba, F.M.; Mulele Nabuyanda, M.; Haufroid, V.; Smolders, E.; Nemery, B. Contamination of water and food crops by trace elements in the African Copperbelt: A collaborative cross-border study in Zambia and the Democratic Republic of Congo. Environ. Adv. 2021, 16, 100103. [Google Scholar] [CrossRef]
  10. Langunu, S.; Imabo, P.M.I.; Bibi Fwanda, B.; Kilela Mwanasomwe, J.; Colinet, G.; Ngoy Shutcha, M. Accumulation of Trace Metals in Fruits from Mango and Syzygium guineense Growing in Residential Households from a Contaminated District of Lubumbashi (DR Congo): Is Fruit Consumption at Risk? Toxics 2023, 11, 620. [Google Scholar] [CrossRef] [PubMed]
  11. Manda, K.B.; Colinet, G.; André, L. Evaluation of trophic chain contamination by trace elements (Cu, Co, Zn, Pb, Cd, U, V and As) in the Upper Lufira basin (Katanga/D.R. Congo). Tropicultura 2010, 28, 246–252. [Google Scholar]
  12. Banza, C.L.N.; Nawrot, T.S.; Haufroid, V.; Decrée, S.; De Putter, T.; Smolders, E.; Kabyla, B.I.; Luboya, O.N.; Ilunga, A.N.; Mutombo, A.M.; et al. High human exposure to cobalt and other metals in Katanga, a mining area of the Democratic Republic of Congo. Environ. Res. 2009, 109, 745–752. [Google Scholar] [CrossRef] [PubMed]
  13. Cheyns, K.; Banza Lubaba Nkulu, C.; Ngombe, L.K.; Asosa, J.N.; Haufroid, V.; De Putter, T.; Nawrot, T.; Kimpanga, C.M.; Numbi, O.L.; Ilunga, B.K.; et al. Pathways of human exposure to cobalt in Katanga a mining area of the D.R. Congo. Sci. Total Environ. 2014, 490, 313–321. [Google Scholar] [CrossRef] [PubMed]
  14. Squadrone, S.; Burioli, E.; Monaco, G.; Koya, M.K.; Prearo, M.; Gennero, S.; Dominici, A.; Abete, M.C. Human exposure to metals due to consumption of fish from an artificial lake basin close to an active mining area in Katanga (D.R. Congo). Sci. Total Environ. 2016, 568, 679–684. [Google Scholar] [CrossRef] [PubMed]
  15. Mukendi, R.-A.-M.; Banza, C.L.N.; Mukeng, C.-A.-K.; Ngwe, J.T.M.; Mwembo, A.N.-A.-N.; Kalenga, P.M.K. Human exposure to metallic traced elements and sperm alteration: A study conducted in the mining areas of Haut-Katanga in the Democratic Republic of Congo. Pan Afr. Med. J. 2018, 30, 35. [Google Scholar] [CrossRef] [PubMed]
  16. Van Brusselen, D.; Kayembe-Kitenge, T.; Mbuyi-Musanzayi, S.; Lubala Kasole, T.; Kabamba Ngombe, L.; Musa Obadia, P.; Kyanika Wa Mukoma, D.; Van Herck, K.; Avonts, D.; Devriendt, K.; et al. Metal mining and birth defects: A case-control study in Lubumbashi, Democratic Republic of the Congo. Lancet Planet. Health 2020, 4, e158–e167. [Google Scholar] [CrossRef] [PubMed]
  17. Banza, L.C.N.; Haufroid, L.; De Putter, V.; Saenen, T.; Kayembe-Kitenge, N.D.; Musa Obadia, T.; Kyanika Wa Mukoma, P.; Lunda Ilunga, J.-M.; Nawrot, D.; Luboya Numbi, T.S.; et al. Sustainability of artisanal mining of cobalt in DR Congo. Nat. Sustain. 2018, 9, 495–504. [Google Scholar] [CrossRef] [PubMed]
  18. Shutcha, M.N.; Mubemba, M.M.; Faucon, M.-P.; Luhembwe, M.N.; Visser, M.; Colinet, G.; Meerts, P. Phytostabilisation of Copper-Contaminated Soil in Katanga: An Experiment with Three Native Grasses and Two Amendments. Int. J. Phytoremediat. 2010, 12, 616–632. [Google Scholar] [CrossRef] [PubMed]
  19. Shutcha, M.N.; Faucon, M.-P.; Kamengwa Kissi, C.; Colinet, G.; Mahy, G.; Ngongo Luhembwe, M.; Visser, M.; Meerts, P. Three years of phytostabilisation experiment of bare acidic soil extremely contaminated by copper smelting using plant biodiversity of metal-rich soils in tropical Africa (Katanga, DR Congo). Ecol. Eng. 2015, 82, 81–90. [Google Scholar] [CrossRef]
  20. Boisson, S.; Collignon, J.; Langunu, S.; Lebrun, J.; Shutcha, M.N.; Mahy, G. Concilier la phytostabilisation des sols pollués avec la conservation de la flore cupro-cobalticole avec une stratégie nouvelle pour valoriser les écosystèmes extrêmes? In Territoires Périurbains: Développement, Enjeux et Perspectives Dans les Pays du Sud; Bogaert, J., Halleux, J.-M., Eds.; Les Presses Agronomiques de Gembloux: Gembloux, Belgium, 2015; pp. 127–138. [Google Scholar]
  21. Boisson, S.; Le Stradic, S.; Collignon, J.; Séleck, M.; Malaisse, F.; Ngoy Shutcha, M.; Faucon, M.-P.; Mahy, G. Potential of copper-tolerant grasses to implement phytostabilisation strategies on polluted soils in South D. R. Congo: Poaceae candidates for phytostabilisation. Environ. Sci. Pollut. Res. 2016, 23, 13693–13705. [Google Scholar] [CrossRef]
  22. Mwanasomwe, J.K.; Langunu, S.; Shutcha, M.N.; Colinet, G. Effects of 15-Year-Old Plantation on Soil Conditions, Spontaneous Vegetation, and the Trace Metal Content in Wood Products at Kipushi Tailings Dam. Front. Soil Sci. 2022, 2, 934491. [Google Scholar] [CrossRef]
  23. Mwanasomwe, J.K.; Langunu, S.; Nkulu, S.N.; Shutcha, M.N.; Colinet, G. Effect of Organic Amendment on the Physicochemical Characteristics of Tailings Dam Soil and Root Development of Tree Species, Fifteen Years After Planting. Front. Soil Sci. 2022, 2, 934999. [Google Scholar] [CrossRef]
  24. Kitobo, W. Dépollution et Valorisation des Rejets Miniers Sulfurés du Katanga: Cas des Tailings de l’Ancien Concentrateur de Kipushi. Ph.D. Thesis, Université de Liège, Liège, Belgium, 2009; p. 276. [Google Scholar]
  25. Ngenda, B.R. Study on the Valorization of Waste from the Usines à Zinc de Kolwezi, Democratic Republic of Congo. Ph.D. Thesis, Université Libre de Bruxelles, Brussels, Belgium, 2010. [Google Scholar]
  26. Tshibanda, K.D. Contribution à la Recherche d’un Modèle de Gestion d’un Passif Environnemental Issu d’un Traitement Métallurgique des Minerais Sulfurés Cuivre—Zinc en République Démocratique du Congo. Ph.D. Thesis, Université Libre de Bruxelles, Brussels, Belgium, 2012; p. 212. [Google Scholar]
  27. Håkanson, L. An ecological risk index for aquatic. Pollution control: A sedimentological approach. Water Res. 1980, 14, 975–1001. [Google Scholar]
  28. Duodu, G.O.; Goonetilleke, A.; Ayoko, G.A. Comparison of pollution indexes for the assessment of heavy metal in Brisbane River sediment. Environ. Pollut. 2016, 219, 1077–1091. [Google Scholar] [CrossRef]
  29. Che Abdullah, M.I.; Md Sah AS, R.; Haris, H. Geoaccumulation Index and Enrichment Factor of Arsenic in Surface Sediment of Bukit Merah Reservoir, Malaysia. Trop. Life Sci. Res. 2020, 31, 109–125. [Google Scholar] [CrossRef]
  30. Zeng, X.; Deng, C.; Liang, Y.; Fu, J.; Zhang, S.; Ni, T. Ecological risk evaluation and sensitivity analysis of heavy metals on soil organisms under human activities in the Tibet Plateau, China. PLoS ONE 2023, 18, 0285116. [Google Scholar] [CrossRef]
  31. Liénard, A.; Colinet, G. Assessment of vertical contamination of Cd, Pb and Zn in soils around a former ore smelter in Wallonia, Belgium. Environ. Earth Sci. 2016, 75, 1322. [Google Scholar] [CrossRef]
  32. Karimi, A.; Naghizadeh, A.; Biglari, H.; Peirovi, R.; Ghasemi, A.; Zarei, A. Assessment of human health risks and pollution index for heavy metals in farmlands irrigated by effluents of stabilization ponds. Environ. Sci. Pollut. Res. 2020, 27, 10317–10327. [Google Scholar] [CrossRef]
  33. Nag, R.; O’Rourke, S.M.; Cummins, E. Risk factors and assessment strategies for the evaluation of human or environmental risk from metal(loid)s—A focus on Ireland. Sci. Total Environ. 2022, 802, 149839. [Google Scholar] [CrossRef] [PubMed]
  34. Ogarekpe, N.M.; Nnaji, C.C.; Oyebode, O.J.; Ekpenyong, M.G.; Ofem, O.I.; Tenebe, I.T.; Asitok, A.D. Groundwater quality index and potential human health risk assessment of heavy metals in water: A case study of Calabar metropolis, Nigeria. Environ. Nanotechnol. Monit. Manag. 2023, 19, 100780. [Google Scholar] [CrossRef]
  35. Vesković, J.; Bulatović, S.; Miletić, A.; Tadić, T.; Marković, B.; Nastasović, A.; Onjia, A. Source-specific probabilistic health risk assessment of potentially toxic elements in groundwater of a copper mining and smelter area. Stoch. Environ. Res. Risk Assess. 2024, 38, 1597–1612. [Google Scholar] [CrossRef]
  36. Li, R.; Dong, F.; Yang, G.; Zhang, W.; Zong, M.; Nie, X.; Zhou, L.; Babar, A.; Liu, J.; Ram, B.; et al. Characterization of Arsenic and Uranium PollutionSurrounding a Uranium Mine in Southwestern China and Phytoremediation Potential. Pol. J. Environ. Stud. 2019, 29, 173–185. [Google Scholar] [CrossRef] [PubMed]
  37. El-Amier, Y.A.; Bonanomi, G.; Al-Rowaily, S.L.; Abd-El Gawad, A.M. Ecological risk assessment of heavy metals along three main drains of the Nile Delta and potential phytoremediation by macrophytic plants. Plants 2020, 9, 910. [Google Scholar] [CrossRef] [PubMed]
  38. El-Amier, Y.A.; Bessa, A.Z.E.; Elsayed, A.; El-Esawi, M.A.; AL-Harbi, M.S.; Samra, B.N.; Kotb, W.K. Assessment of the Heavy Metals Pollution and Ecological Risk in Sediments of Mediterranean Sea Drain Estuaries in Egypt and Phytoremediation Potential of Two Emergent Plants. Sustainability 2021, 13, 12244. [Google Scholar] [CrossRef]
  39. Mazumder, P.; Das, A.; Khwairakpam, M.; Kalamdhad, A.S. A comprehensive insight into ecological risk assessment and remediation of metal contaminated coal mine soil: Towards a cleaner and sustainable environment. J. Clean. Prod. 2021, 324, 129185. [Google Scholar] [CrossRef]
  40. Ibrahim, M.; Young, A.C.; Chen, D.; Mughal, N. Potential ecological risk, in-situ phytoextraction potential of Lycopersicon esculentum, and pollution indexes of selected toxic metals in Hausawan—Kaba, Kano State, Nigeria. Environ. Chall. 2021, 4, 100113. [Google Scholar] [CrossRef]
  41. Shi, J.; Qian, W.; Jin, Z.; Zhou, Z.; Wang, X.; Yang, X. Evaluation of soil heavy metals pollution and the phytoremediation potential of copper-nickel mine tailings ponds. PLoS ONE 2023, 18, e0277159. [Google Scholar] [CrossRef] [PubMed]
  42. Cailteux, J.L.H.; Muchez, P.; De Cuyper, J.; Dewaele, S.; De Putter, T. Origin of the megabreccias in the Katanga Copperbelt (D.R.Congo). J. Afr. Earth Sci. 2018, 140, 76–93. [Google Scholar] [CrossRef]
  43. Mambwe, P.; Wennen, R.S.; Cailteux, J.; Mumba, C.; Dewaele, S.; Muchez, P. Review of the origin of breccias and their resource potential in the central Africa Copperbelt. Ore Geol. Rev. 2023, 156, 105389. [Google Scholar] [CrossRef]
  44. Saad, L.; Parmentier, I.; Colinet, G.; Malaisse, F.; Faucon, M.P.; Meerts, P.; Mahy, G. Investigating the vegetation-soil relationships on the copper-cobalt rock outcrops of Katanga (DR Congo), an essential step in a biodiversity conservation plan. Restor. Ecol. 2012, 20, 405–415. [Google Scholar] [CrossRef]
  45. Ngongo, M.L.; Van Ranst, E.; Baert, G.; Kasongo, E.L.; Verdoodt, A.; Mujinya, B.B.; Mukalay, J.M. Guide des Sols en R.D. Congo, Tome I: Etude et Gestion; UGent: Lubumbashi, Democratic Republic of the Congo; HoGent: Lubumbashi, Democratic Republic of the Congo; UNILU: Lubumbashi, Democratic Republic of the Congo, 2009; p. 262. [Google Scholar]
  46. Malaisse, F. How to Live and Survive in Zambezian Open Forest: Miombo Ecoregion; Presses Agronomiques de Gembloux: Gembloux, Belgium, 2010; p. 422. [Google Scholar]
  47. Mees, F.; Masalehdani, M.N.N.; De Putter, T.; D’Hollander, C.; Van Biezen, E.; Mujinya, B.B.; Potdevin, J.L.; Van Ranst, E. Concentrations and forms of heavy metals around two ore processing sites in Katanga, Democratic Republic of Congo. J. Afr. Earth Sci. 2013, 77, 22–30. [Google Scholar] [CrossRef]
  48. Pourret, O.; Lange, B.; Houben, D.; Colinet, G.; Shutcha, M.; Faucon, M.-P. Modeling of cobalt and copper speciation in metalliferous soils from Katanga (Democratic Republic of Congo). J. Geochem. Explor. 2015, 149, 87–96. [Google Scholar] [CrossRef]
  49. Faucon, M.P.; Shutcha, M.N.; Meerts, P. Revisiting copper and cobalt concentrations in supposed hyperaccumulators from SC Africa: Influence of washing and metal concentrations in soil. Plant Soil 2007, 301, 29–36. [Google Scholar] [CrossRef]
  50. Liu, M.; Yang, Y.; Yun, X.; Zhang, M.; Wang, J. Concentrations, distribution, sources, and ecological risk assessment of heavy metals in agricultural topsoil of the Three Gorges Dam region, China. Environ. Monit. Assess. 2015, 187, 147. [Google Scholar] [CrossRef]
  51. Kumar, V.; Sharma, A.; Kaur, P.; Singh Sidhu, G.P.; Bali, A.S.; Bhardwaj, R.; Thukral, A.K.; Cerda, A. Pollution assessment of heavy metals in soils of India and ecological risk assessment: A state-of-the-art. Chemosphere 2019, 216, 449–462. [Google Scholar] [CrossRef]
  52. Hamid, E.; Payandeh, K.; Karimi Nezhad, M.T.; Saadati, N. Potential ecological risk assessment of heavy metals (trace elements) in coastal soils of southwest Iran. Front. Public Health 2022, 10, 889130. [Google Scholar] [CrossRef]
  53. Yang, Y.; Liang, Y.; Ghosh, A.; Song, Y.; Chen, H.; Tang, M. Assessment of arbuscular mycorrhizal fungi status and heavy metal accumulation characteristics of tree species in a lead-zinc mine area: Potential applications for phytoremediation. Environ. Sci. Pollut. Res. 2015, 22, 13179–13193. [Google Scholar] [CrossRef]
  54. Zheng, S.; Wang, Q.; Yu, H.; Huang, X.; Li, F. Interactive effects of multiple heavy metal(loid)s on their bioavailability in contaminated paddy soils in a large region. Sci. Total Environ. 2020, 708, 135126. [Google Scholar] [CrossRef]
  55. Hargarten, P.M.; Wheeler, D.C. Accounting for the uncertainty due to chemicals below the detection limit in mixture analysis. Environ. Res. 2020, 186, 109466. [Google Scholar] [CrossRef] [PubMed]
  56. Shutcha, M.N.; Mukobo, R.P.; Muyumba, K.D.; Mpundu, M.M.; Faucon, M.P.; Lubalega, K.T.; Ludovic, A.; Annabelle, J.; Vandenheede, N.; Pourret, O.; et al. Pedogeochemical background and mapping of soil pollution in Lubumbashi. In Anthropisation des paysages Katangais; Bogaert, J., Gilles, C., Gregory, M., Eds.; Les Presses Agronomiques de Gembloux: Gembloux, Belgium, 2018; pp. 215–228. [Google Scholar]
  57. Mpinda, M.T.; Kisimba, T.N.; Mwamba, T.M.; Kasongo, E.L.M.; Kaniki, A.T.; Mujinya, B.B. Baseline Concentrations of 11 Elements as a Function of Land uses in Surface Soils of the Katangese Copperbelt Area (D.R. Congo). Am. J. Environ. Sci. 2021, 17, 125–135. [Google Scholar] [CrossRef]
  58. Kabata-Pendias, A.; Pendias, H. Trace Elements in Soils and Plants; CRC Press: Boca Raton, FL, USA, 2001; p. 403. [Google Scholar]
  59. Kampunzu, A.B.; Cailteux, J.L.H.; Moine, B.; Loris, H.N.B.T. Geochemical characterization, provenance, source, and depositional environment of “Roches Argilo-Talqueuses” (RAT) and Mines Subgroups sedimentary rocks in the Neoproterozoic Katangan Belt (Congo): Lithostratigraphic implications”. J. Afr. Earth Sci. 2005, 42, 119–133. [Google Scholar] [CrossRef]
  60. Cailteux, J.L.H.; Kampunzu, A.B.; Lerouge, C.; Kaputo, A.K.; Milesi, J.P. Genesis of sediment-hosted stratiform copper-cobalt deposits, central African Copperbelt. J. Afr. Earth Sci. 2005, 42, 134–158. [Google Scholar] [CrossRef]
  61. Muchez, P.; André-Mayer, A.-S.; El Desouky, H.A.; Reisberg, L. Diagenetic origin of the stratiform Cu–Co deposit at Kamoto in the Central African Copperbelt. Miner. Deposita 2015, 50, 437–447. [Google Scholar] [CrossRef]
  62. Crundwell, F.; Moats, M.; Ramachandran, V. Extractive Metallurgy of Nickel, Cobalt and Platinum Metals; Elsevier: Oxford, UK, 2011; 610p. [Google Scholar]
  63. Bautista, R.G. Fundamentals of Hydrometallurgical Processes; Springer: Berlin/Heidelberg, Germany, 2013; p. 665. [Google Scholar]
  64. Bourgarit, D. Mineralogy of slags: A key approach for our understanding of ancient copper smelting processes. In The Contribution of Mineralogy to Cultural Heritage; Mineralogical Society of Great Britain and Ireland: London, UK, 2019; pp. 203–232. [Google Scholar] [CrossRef]
  65. Kitobo, W.; Kalenga, P.; Ilunga, N.A.; Luboya, O.; Frenay, J. Caractérisation de la mobilité des éléments traces métalliques contenus dans les rejets de l’Ancien Concentrateur de Kipushi en R.D. Congo. In Annales du Pôle Mines-Géologie; Université de Lubumbashi: Lubumbashi, Democratic Republic of the Congo, 2007; Volume 1, pp. 133–142. [Google Scholar]
  66. Muyumba, D.; Pourret, O.; Lienard, A.; Faucon, M.-P.; Mahy, G.; Ngong, N.M.; Colinet, G.C. Experimental evaluation of copper and cobalt phytoavailability in soils of metal-bearing ecosystems of the Katangan Copper Arc. In Anthropisation des Paysages Katangais; Bogaert, J., Gilles, C., Gregory, M., Eds.; Les Presses Agronomiques de Gembloux: Gembloux, Belgium, 2018; pp. 192–214. [Google Scholar]
  67. Mugoša, B.; Đurović, D.; Nedović-Vuković, M.; Barjaktarović-Labović, S.; Vrvić, M. Assessment of Ecological Risk of Heavy Metal Contamination in Coastal Municipalities of Montenegro. Int. J. Environ. Res. Public Health 2016, 13, 393. [Google Scholar] [CrossRef] [PubMed]
  68. Kowalska, J.B.; Mazurek, R.; Gąsiorek, M.; Zaleski, T. Pollution indexes as useful tools for the comprehensive evaluation of the degree of soil contamination-A review. Environ. Geochem. Health 2018, 40, 2395–2420. [Google Scholar] [CrossRef] [PubMed]
  69. Jiang, F.; Ren, B.; Hursthouse, A.; Zhou, Y. Trace Metal Pollution in Topsoil Surrounding the Xiangtan Manganese Mine Area (South-Central China): Source Identification, Spatial Distribution and Assessment of Potential Ecological Risks. Int. J. Environ. Res. Public Health 2018, 15, 2412. [Google Scholar] [CrossRef] [PubMed]
  70. Al-Robai, S.A. Ecological risk assessment of heavy metals in soils near a water dam in Baljurashi, Saudi Arabia, and their accumulation in Dodonaea viscosa. Sustainability 2023, 15, 15646. [Google Scholar] [CrossRef]
  71. Hoque, M.M.; Islam, A.; Islam, A.R.M.T.; Pal, S.C.; Mahammad, S.; Alam, E. Assessment of soil heavy metal pollution and associated ecological risk of agriculture dominated mid-channel bars in a subtropical river basin. Sci. Rep. 2023, 13, 11104. [Google Scholar] [CrossRef]
  72. Simon, L. Potentially harmful elements in agricultural soils. In PHE, the Environment and Human Health; Bini, C., Bech, J., Eds.; Springer: Dordrecht, The Netherlands, 2014; pp. 85–150. [Google Scholar]
  73. Oliva, S.R.; Mingorance, M.D. Assessment of Airborne Heavy Metal Pollution by Aboveground Plant Parts. Chemosphere 2006, 65, 177–182. [Google Scholar] [CrossRef] [PubMed]
  74. Mwanasomwe, K.L. Amélioration du Procédé de Phytostabilisation Avec les Espèces Ligneuses Pour la Production des Services Écosystémiques en Milieux Pollués Urbains et Périurbains de L’arc Cuprifère Katangais. Ph.D. Thesis, Université de Liège, Liege, Belgium, 2022; p. 217. [Google Scholar]
  75. Kowalska, J.; Mazurek, R.; Gąsiorek, M.; Setlak, M.; Zaleski, T.; Waroszewski, J. Soil pollution indexes conditioned by medieval metallurgical activity—A case study from Krakow (Poland). Environ. Pollut. 2016, 218, 1023–1036. [Google Scholar] [CrossRef]
  76. Ali, H.; Khan, E.; Sajad, M.A. Phytoremediation of heavy metals-Concepts and applications. Chemosphere 2013, 91, 869–881. [Google Scholar] [CrossRef]
  77. Yan, A.; Wang, Y.; Tan, S.N.; Mohd Yusof, M.L.; Ghosh, S.; Chen, Z. Phytoremediation: A Promising Approach for Revegetation of Heavy Metal-Polluted Land. Front. Plant Sci. 2020, 11, 359. [Google Scholar] [CrossRef] [PubMed]
  78. Naveed, S.; Oladoye, P.O.; Alli, Y.A. Toxic heavy metals: A bibliographic review of risk assessment, toxicity, and phytoremediation technology. Sustain. Chem. Environ. 2023, 2, 100018. [Google Scholar] [CrossRef]
Figure 1. Spatial distribution of various mining discharges and polluted soil around the main towns in the Katangese Copperbelt. CFSCu = wastes from concentrates of Cu sulfides by flotation, CFSCuZn = wastes from concentrates of Cu and Zn sulfides by flotation, COCuCo = wastes from concentrates of Cu and Co oxides, DP = deposit from smelting emissions, Sc = slag, SR = river sediments from mining plants.
Environments 11 00122 g001
Figure 2. Main types of mine tailings, and contaminated soils and sediments in the KCB. (A) Soil contaminated by emissions from the smelter, (B) wastes from concentrates of Cu and Zn sulfides by flotation, (C) river sediments contaminated by wastes released by mining plants, (D) wastes from concentrates of Cu and Co oxides, (E) slag from the smelting process of copper.
Environments 11 00122 g002
Figure 3. Cross-section of a profile of edaphic conditions in the vegetated area of the Kipushi mine tailings.
Environments 11 00122 g003
Figure 4. Principal component analysis showing the variability in the studied elements across mining wastes and contaminated soils and sediments from the Katangese Copperbelt. CFSCu = wastes from concentrates of Cu sulfides by flotation, CFSCuZn = wastes from concentrates of Cu and Zn sulfides by flotation, COCuCo = wastes from concentrates of Cu and Co oxides, DP = deposit from smelting emissions, Sc = slag, SR = river sediments from mining plants.
Environments 11 00122 g004
Figure 5. Bioconcentration factors for Cu, Co, and Zn in the tissues of five woody species grown for 15 years in the Kipushi tailing pond from the concentration of Cu-Zn sulfide by flotation. Values are represented by the mean ± standard deviation; means with the same letter (a, b, c) are not significantly different (p < 0.05).
Environments 11 00122 g005
Table 1. Studies characterizing metal concentrations in different types of polluted soils within the KCB.
ReferenceAim of the StudyAnalyses
Kaniki [1] Environmental characterization of mining and metallurgical wastes pH, As, Cd, Cu, Co, Fe, Pb, Mn, and Zn. Extraction with aqua regia
Kitobo [24]Remediation and reclamation of sulfide mine tailings pH, As, Cu, Co, Pb, and Zn. Leaching test and extraction with HCl and NaOH
Ngenda [25]Feasibility of the valorization of wastes from the Kolwezi zinc plantspH, As, Cu, Co, Pb, and Zn. Leaching test and with HCl and NaOH
Tshibanda [26]Improving the metallurgical treatment of Cu-Zn sulfides from mining wastes in Kolwezi.As, Al, Cd, Co, Cu, Hg, Pb, Zn, Mn, Fe, Ti, S, and Ni. Leaching test and X-ray fluorescence analysis
Narendrula et al. [4] Assessing trace metal concentrations in polluted soils from smelting activitiespH, As, Al, Cd, Cu, Fe, Co, Pb, Zn, Mn, Mg, and Ni. Extraction with aqua regia
Mees et al. [47] Concentrations and forms of heavy metals around two ore processing sitespH, As, Cr, Cd, Cu, Fe, Co, Pb, Zn, Mn, and Ni. Extraction with aqua regia
Pourret et al. [48]Modeling of cobalt and copper speciation in metalliferous soils Co, Cu, Fe, Mn, Mg, and Ca. Extraction with HF + HClO4 + HCl
Table 2. Toxicological response factor (Tr) by Hamid et al. [52].
ElementsToxicological Response Factor
As10
Cd30
Co5
Cu5
Mn1
Pb5
Zn1
Table 3. Descriptive statistics for concentrations of pH, Fe, and trace metals (mg kg−1) in mining wastes and contaminated soils and sediments from the Katangese Copperbelt. n = number of samples, SD = standard deviation, CV = coefficient of variation, Min = minimum, Max = maximum, Q1 and Q3 = first and third quartile, LOQ = Limit of Quantification, Reference = reference soil in the region [56,57], IT = international thresholds [30,58].
pHwaterpHKClFeAsCdCoCuMnPbZn
n7888756612412212569125122
Mean6.25.864,7641578175182612,657939209613,250
SD1.481.7876,70726954225267314,0481909761341,111
Min43.59890<LOQ<LOQ2.5211615<LOQ0.02
Q15.134.821,80030.6<LOQ29.551317.5109.53115
Median5.875.437,8503142894.1379771745241
Q37.025.857,150142024535119,513750712694
Max10.611.7320,00012,15917,41423,00075,000960058,000200,000
CV2430119178243315149198370317
Skewness1.131.982.192.592.524.795.182.895.463.69
Kurtosis1.103.723.526.375.0624.6639.428.3832.712.82
Reference
Mean5.64.462,954-1.3201871194069
Min3.9 3.88971-0.1 0.13.14.30.32.0
Max7.35.8112,000-1.93845637082180
IT----540200-100300
Table 4. Contamination factor (CF) and degree of contamination (DC) values for samples collected from mining wastes and contaminated soils and sediments from the Katangese Copperbelt. CFSCu = wastes from concentrates of Cu sulfides by flotation, CFSCuZn = wastes from concentrates of Cu and Zn sulfides by flotation, COCuCo = wastes from concentrates of Cu and Co oxides, DP = soil contaminated by deposit from smelting emissions, Sc = Slag, SR = river sediments from mining plants.
SubstratesCFDC
AsCdCoCuMnPbZn
CFSCu0.0017.72.959.21.10.50.472
CFSCuZn1765933.7613.42229682027
COCoCu2.40.00114727.40.811.1180
DP6.320.89.471.80.118.328.6155
Sc0.10.00113139.67.621.3138338
SR36.553882.93.80.27.20.95440
Table 5. Ecological risk factor (Er) and potential ecological risk index (RI) values for soil samples in mining wastes and contaminated soils and sediments from the Katangese Copperbelt. CFSCu = wastes from concentrates of Cu sulfides by flotation, CFSCuZn = wastes from concentrates of Cu and Zn sulfides by flotation, COCuCo = wastes from concentrates of Cu and Co oxides, DP = soil contaminated by deposit from smelting emissions, Sc = Slag, SR = river sediments from mining plants.
SubstratesErRI
AsCdCoCuMnPbZn
CFSCu0.001233152961.12.90.4549
CFSCuZn176017,79218.83053.4111196821,959
COCoCu240.047361370.85.21.1905
DP63.662547.43590.194.428.61219
Sc1.60.046571987.61071381109
SR366161,65314.719.40.236.10.98162,091
Table 6. pH, total organic carbon (TOC), bioavailable major elements (extraction with CH3COONH4 + EDTA), pseudo-total trace metal concentrations, and potential ecological risk index (RI) values in surface horizons (0–20 cm) of unamended areas and tree rhizospheres in the Kipushi tailings pond from copper–zinc sulfide concentration by flotation and in polluted soil at Penga Penga. Mean ± standard deviation. Comparisons between unamended areas and rhizosphere conducted separately at Kipushi and Penga Penga. Values with the same letter (a,b) are not different after the Student’s t-test (p < 0.05).
KipushiPenga PengaReference
(Forest Soil)
UnamendedRhizosphereUnamendedRhizosphere
pHKCl7.9 ± 0.2 a7.0 ± 0.2 b5.8 ± 1.7 b7.7 ± 0.3 a4.4 (3.8–5.8)
TOC (%)2.2 ± 0.3 b4.5 ± 1.9 a1.4 ± 0.5-2.3 (1–5)
Ca (mg kg−1)10,060 ± 4002 a4098 ± 425 b11 ± 5.2 b75 ± 43.7 a-
Mg (mg kg−1)2790 ±1824 a2242 ± 352 b1.7 ± 0.5--
P (mg kg−1)40 ± 14.1 b148 ± 79 a1.4 ± 0.5--
K (mg kg−1)20 ± 1.4 b144 ± 49 a1.2 ± 1.1 b99 ± 36 a-
As (mg kg−1)2934 ± 2141 a314 ± 155 b1578 ± 2695 a 12.8 ± 14.2 b-
Cd (mg kg−1)159 ± 77.4 a48 ± 16 b1751 ± 4225 a8.7 ± 12 b-
Cu (mg kg−1)9269 ± 1825 a3533 ± 814 b12,657 ± 14,048 a1379 ± 1371 b187 (20–456)
Co (mg kg−1)102 ± 57.1 b932 ± 407 a826 ± 2673 a182 ± 113 b 20 (7.1–38)
Pb (mg kg−1)4291± 1113 a557 ± 230 b2096 ± 7613 a142 ± 131 b40 (7.0–82)
Zn (mg kg−1)22,723 ± 11,670 a6725 ± 2650 b13,250 ± 4111 a467 ± 312 b69 (26–180)
RI5704 ± 3222 a1522 ± 400 b1532 ± 503 a533 ± 493 b
Disclaimer/Publisher’s Note: The statements, opinions and data contained in all publications are solely those of the individual author(s) and contributor(s) and not of MDPI and/or the editor(s). MDPI and/or the editor(s) disclaim responsibility for any injury to people or property resulting from any ideas, methods, instructions or products referred to in the content.

