Abstract
The stability of soil organic matter (SOM) depends on its degree of physical protection, biochemical quality (q), and mineralogical features such as the abundance of iron or aluminum oxyhydroxides: All constraints stabilize SOM, but the relevance of each is herein discussed. We studied from this point of view the stability of SOM in four grassland soils. The SOM in these profiles was characterized for its physical protection (ultrasonic dispersion + size fractionation) and its q (acid hydrolysis, carbohydrates, phenolics, and unhydrolyzable carbon). The profiles were also analyzed for free iron forms extracted with several chemicals: dithionite-citrate-bicarbonate, citric acid, oxalic-oxalate (Tamm’s solution), and DTPA. Soil horizons were incubated under optimal conditions to obtain the C lost after 33 days (Cresp33) and basal respiration rate (BRR). The microbial C was obtained at the end of the incubation. The microbial activity rate (MAR: mg C respired per g microbial C per day) was obtained from these measures. The sum soluble + microbial C was taken as the active C pool. As expected, the stability of SOM depends on its distribution between the size fractions: The higher the proportion of particulate organic matter (POM: >20 µm size), the higher the soil respiration rate. In contrast, q barely affects SOM decomposition. Both physical availability (size fractionation) and q (acid hydrolysis) affect the size of the microbial C pool, but they barely affect MAR. The effects of free iron on SOM stability are complex: While dithionite-extracted Fe negatively affected Cresp33, BRR, and MAR, the Fe extracted by smoother methods (Tamm’s reagent and DTPA) positively relates to Cresp33, BRR, and MAR. Free iron apparently modulates soil microbial metabolism because it is the only studied parameter that significantly affected MAR; however, the precise effect depends on the precise free Fe fraction. From our data, SOM stability relies on a net of constraints, including physical availability and free Fe forms, with q being of minor relevance. Our dataset suggests a role for free iron as a modulator of microbial activity, deserving future research.
1. Introduction
The decomposition of soil organic matter (SOM) is driven by a complex set of physical, chemical, and biochemical factors. These overall determine how stable SOM is against the microbial attack, which ultimately results in soil C losses. There is a general agreement about these factors, which may be split in several groups of constraints [1]: (i) those derived from the composition of SOM itself, a property often known as biochemical quality (henceforth q, following the nomenclature of Bosatta and Ågren [2]); (ii) those derived from the physical position of the organic matter within the soil matrix, which determines its physical availability to the soil microflora; and (iii) those derived from the presence of inorganic components in the soil, capable of interacting with SOM and stabilizing it against the microbial attack. The groups (ii) and (iii) are often pooled into one, namely the interaction between SOM and the active components of the soil mineral matrix [3]. In this scenario, specifically in the group (iii), the free forms of iron (and, to a lesser extent, aluminum) are assumed to play a relevant role.
The relative relevance of each constraint has been widely discussed. Some reviews [4] consider q as the ultimate one responsible for the long-term stabilization of SOM, as the interaction with the mineral matrix is a secondary, temporal stabilization path. However, most researchers rather consider the opposite view: q is seen as a constraint of lesser importance relative to the others [5,6,7]. The physical accessibility of the substrates to the soil microflora is seen as the main constraint for SOM decomposition, with the association of SOM to active mineral surfaces being the main way to achieve stabilization in the very long term [8]. Consistent with this trend, recent SOM fractionation methods have searched for an understanding of the relative relevance of each method of stabilization by the mineral matrix [9,10] rather than on SOM q. A recent review [11] pointed out that the mineral matrix is not a mere physical structure in which organic matter becomes protected and retained but an active partner in the stabilization of organic matter (and its destabilization, too) since it actively interacts with organic compounds as an electron donor/captor and also through a variety of physical and chemical interactions that may change the chemical structure of organic compounds, their release from the organo–mineral complex, and ultimately their cycling in soil. The future development of these viewpoints should result in a substantial improvement of our understanding of carbon cycling through the soil system.
The importance of free forms of iron and aluminum for SOM stabilization has been recognized for many years, being extensively treated in the classical literature [12,13,14] and in the recent literature, too [3,5,15], in which a pivotal role of free Fe forms in SOM stabilization is assumed. The rationale for such a pivotal role relies often upon statistics: Soil C stocks correlate with the abundance of free Fe and Al oxyhydroxides [5], but we must note that this is indirect evidence. Several precise mechanisms through which Fe and Al forms would stabilize SOM have been described [3]: sorptive processes, including preferential sorption in micropores of Fe oxides, or the precipitation of organic compounds via formation of complexes, often with Ca2+ [16]. The stability of the organo–Fe complexes seems to depend strongly on the specific type of the organic moiety (humic substances, proteins, and carbohydrates) [17].
The specific quantification of the amount of SOM stabilized by Fe/Al oxyhydroxides is rarely undertaken: It requires the previous extraction of the organic matter associated with the mineral matrix by bonds not (or not clearly) and related to Fe or Al oxyhydroxides, by alkaline extractions (Na-tetraborate, Na-pyrophosphate, and NaOH); after this, the organo–mineral complex is treated with reductive agents such as sodium dithionite to reduce the insoluble Fe(III) to soluble Fe(II) forms, thus releasing the organic matter associated with these oxyhydroxides. The so-released organic matter may be recovered quantitatively by extraction with NaOH. Because this approach is time-consuming, it has been applied on few occasions [10,18,19]. It is noteworthy that the amounts of organic matter associated with these Fe and Al oxyhydroxides may be low: less than 5% of the total SOM in the organo–mineral complex, in a variety of Mediterranean environments [19]. Higher values were found in acidic soils from an estuarine sequence in Galicia, NW Spain [18]: up to 30% of total SOC in an extreme case and 10–20% in most cases, but these values may be an overestimation since they also included the organic matter released by HF treatment. In other soils [10], the organic matter associated with Fe or Al oxyhydroxides was found to always comprise a minor part of the total organo–mineral complex.
These low values make sense considering that Fe oxyhydroxides usually account for less than 3% of soil dry weight and often for less than 1%. Even assuming for them a high capacity for retaining organic matter, due to their very high active surface [11], the organic matter truly associated with these oxyhydroxides is expected to account for a minor fraction of the total SOM. Thus, additional reasons must be found to explain the good relationships often found between the abundance of free Fe and Al forms and the total SOC stocks.
Here, we present a new dataset to contribute to this discussion. We focused on four selected profiles under mountain grasslands in the Pyrenees (Northern Iberian Peninsula). Our goal was to detect the limiting constraints to decomposition and to establish which of these would be the most relevant for determining soil microbial activity and its main consequence, SOM turnover. The approach was to characterize SOM both by its physical protection and its biochemical quality (q) and to relate them to decomposition rates obtained under standard laboratory conditions. The role of the free forms of Fe was pivotal in the study: We aimed to determine how they relate to the other constraints (SOM physical protection and SOM q) and to the components of the microbial activity (microbial biomass and specific microbial activity) in order to attain an overall view about how the several physical and chemical soil properties together determine SOM turnover.
2. Materials and Methods
2.1. Sites and Soils
Four profiles were selected from the dataset of soils of La Cerdanya, a valley in the Pyrenees Range (N Spain) (Figure 1). Their parent materials are calcareous rocks and their colluvia, they have similar loamy textures, and they are all classified as Eutric Cambisols (IUSS Working Group WRB, 2022) [20]. They are representative of wide areas in these mountains with a udic moisture regime and cryic temperature regimes (SSS, 2022) [21,22]. The profiles correspond to a toposequence from 1694 to 1940 m along a large, north-facing slope.
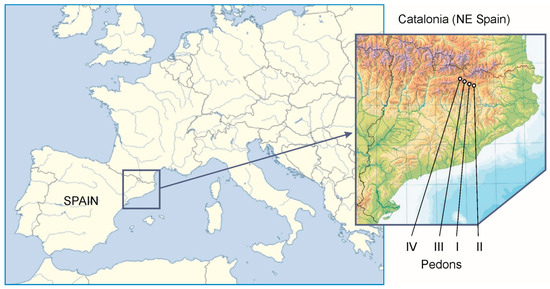
Figure 1.
Geographical situation of the four pedons studied in this paper.
Owing to the need of working with fresh soil samples for this study, profiles were re-sampled. While in the original profiles, the horizons were sampled according to morphological traits, for this work, we re-sampled the profiles with more detail, in layers of 5–10 cm thick, to attain a detailed description of the changes of SOM amounts and features with depth. Table 1 shows the main features of the original profiles; additional data are given in Appendix A, Table A1.

Table 1.
Geographical and geomorphological features of the studied profiles. Parent material, topographic constraints, and vegetation type. Longitude and latitude are given as UTM coordinates. Altitude as m a.s.l.
2.2. Standard Soil Analyses
The soil samples were air-dried and sieved at 2 mm to discard big roots and gravel. A subsample of the sieved soil was finely ground for chemical analyses. In the sieved soil, pH in water was obtained at a soil/water proportion of 1:2.5 and texture by the pipette method. In the finely ground soil, total carbon (C) and nitrogen (N) were analyzed by dry combustion in a Thermo Scientific Flash 2000 CHN analyzer. Because all studied horizons were carbonate-free, the total C equals to organic carbon, and henceforth, we refer to it just as “OC”.
2.3. Soil Incubation and Microbial C Measurements
The soil horizons were incubated in triplicate by the standard method of NaOH trap [23], in which the respired CO2 is trapped as Na2CO3. Samples of 2 mm sieved soil (from 5 to 15 g, depending on C content) were weighed in polypropylene 100 mL containers, wetted to 60% of field capacity (obtained by wetting a soil subsample to saturation and removing excess water in a Buchner vacuum device), and incubated in sealed 1 L glass jars previously filled with a bed of deionized water to maintain the humidity inside, together with another polypropylene container with 10 mL of 0.2 M NaOH. Incubation lasted for 33 days in a dark chamber at 25 °C. At intervals, jars were open to renew the air inside, and the container with NaOH was replaced by a fresh one. The NaOH remaining in the container was titrated with HCl after precipitation of carbonate as BaCO3; the comparison with blanks allowed the calculation of trapped CO2.
The cumulative respired C (as CO2) was fitted to double-exponential curves:
where Cresp is the total amount of C respired in time t, C1 and C2 are the two pools of C affected by respiration, and k1 and k2 are the decomposition constants of C1 and C2, respectively.
Cresp = C1 (1 − exp (−k1t)) + C2 (1 − exp (−k2t))
The proportion of total C respired after 33 days (Cresp33) was used as an indicator of SOM stability at each horizon. By applying Equation (1), we calculate Cresp33 and Cresp34, i.e., the amounts of C respired after 33 and 34 days, and Crem33, i.e., the amount of C remaining in the sample after 33 days. From these values, the basal respiration rate (BRR) is obtained:
given in mg C respired as CO2 in one day (day 34) per g of remaining C at day 33.
BRR = (Cresp34 − Cresp33)/Crem33
At day 33, we quantified microbial C by the fumigation-extraction method [24]. One portion of the incubated soil was extracted immediately with 0.5 M K2SO4 to obtain the soluble C; a second portion was also extracted with 0.5 M K2SO4 after fumigation for 24 h in a Cl3CH atmosphere. All extracts were analyzed for C by dichromate oxidation (Mebius method and spectrophotometric method adapted to liquid samples [25]). The difference in C content between both extracts was taken as the uncorrected microbial C (MCUC). The corrected (true) microbial C (MC) was obtained dividing MCUC by 0.45, by the assumption that extraction recovers only 45% of the total microbial C.
Combining respired C with microbial C, we obtain the microbial activity rate (MAR):
given in mg C respired per day per g microbial C at day 33.
MAR = (Cresp34 − Cresp33)/Microbial C
2.4. Evaluation of SOM Biochemical Quality
The resistance to acid hydrolysis [26,27] was taken as an indicator of SOM recalcitrance (i.e., the opposite of q). Ground soil (500 mg) was hydrolyzed with 20 mL of 2.5 M H2SO4 for 30 min, at 105 °C in an aluminum block digester, in sealed Pyrex tubes. The hydrolysate (labile pool I: LP I) was recovered by centrifugation. The solid residue was subjected to a new hydrolysis with 2 mL of 13 M H2SO4, overnight at room temperature, under smooth end-over-end agitation. The next morning, water was added to bring the acid concentration down to 1 M, and the hydrolysis was continued for 3 h at 105 °C in a block digester, in sealed Pyrex tubes. This second hydrolysate (Labile Pool II: LP II) was also recovered by centrifugation.
The unhydrolyzed residue (recalcitrant pool) was dried at 60 °C, weighed, and analyzed for total C in a ThermoQuest CN analyzer. From these data, the recalcitrance index arises:
RIC = (recalcitrant C/total organic C) × 100
The labile pools I and II were analyzed (i) for C by the Mebius method [25], adapted to the analysis of liquid samples; (ii) for carbohydrates, by the colorimetric phenol-sulfuric acid method [28], using glucose as standard; (iii) for polyphenolics, by the Folin–Denis method [29], using tannic acid as standard; and (iv) for non-polar C compounds, by adsorption of an aliquot to a column of Amberlite XAD-7. The fraction adsorbed by the resin was analyzed for C by the Mebius method, adapted to the analysis of liquid samples, and taken as the “XAD+” fraction.
These analyses were carried out in each hydrolysate. From these, we obtained the sum of both hydrolysates for each parameter (carbohydrates, polyphenolics, etc.) and the ratio II/total, i.e., the proportion of each hydrolysable component found in the second hydrolysate.
The analyses of carbohydrates, polyphenolics, and aromatic carbon are approximative because all absorptions depend on the exact composition of the components analyzed, and therefore, the conversion of these absorptions to concentrations depends on the chosen standard. Thus, we use the terms “glucose equivalents” to discuss carbohydrates and “tannic acid equivalents” for polyphenolics.
From these analyses, several additional indicators were obtained: the carbohydrate C/polyphenolic C ratio, the carbohydrate C/aromatic C ratio, or the carbohydrate C/XAD+ C ratio. These ratios try to reflect, within the obtained hydrolysates, the proportion between easily metabolizable compounds and compounds more resistant to biodegradation.
In addition to the above method with sulfuric acid, we also performed hydrolysis with HCl, an acid more widely used for these purposes. Briefly, 500 mg of ground soil was hydrolyzed first with 20 mL of 1 M HCl for 1 h at 105 °C and next with 20 mL of 6 M HCl for 3 h. Both hydrolysates were separated from the residue by centrifugation and discarded. The residue was washed with water, dried at 60 ºC, weighted, and analyzed for C. The recalcitrance of carbon (RIC) was also obtained as mentioned above.
2.5. Size Fractionation of SOM
Air-dried and 2 mm sieved soil (between 5 g for H horizons to 15 g for the C-poorest, deepest horizons) was placed in a polypropylene bottle with 50 mL of water and two glass beads and shaken in a rotatory agitator for 2 h at low speed. After removing the glass beads, another 50 mL of water was added, and the soil–water mixture was submitted for 10 min to ultrasonic dispersion in a Branson 250 probe-type sonicator, at a nominal output of 100 W. The dispersed mixture was immediately fractionated through a column of sieves (200 µm, 50 µm, and 20 µm) under a flux of distilled water and magnetic stirring. The following size fractions were obtained: 2000–200 µm (cSa: coarse sand size); 200–50 µm (fSa: fine sand size); 50–20 µm (cSi: coarse silt size); and <20 µm (fine silt + clay size). The first three, collected directly in vessels, were dried at 60 °C to constant weight. The smallest one (<20 µm) was collected in 1 L jars together with all the water used in the sieving treatment, flocculated with potassium alum, recovered by centrifugation, dried at 60 °C, and weighed. The four size fractions were finely ground for chemical analyses.
All fractions involved both organic and mineral matter. The organic matter of >20 µm fractions (POM: particulate organic matter) was made of clearly distinguishable particles that were very dark and separated from the mineral particles. The <20 µm fraction was taken as the organo–mineral complex (OMC) because in this fraction, organic matter and mineral matter are associated, and they are not distinguishable.
2.6. Extraction of Forms of Free Fe
As iron is a central point in this paper, its forms were studied in detail. Four extraction methods were applied:
- Extraction by DCB (dithionite + citrate + bicarbonate mixture) [30];
- Extraction by Tamm’s reagent (oxalic-oxalate, pH 3.0) [31];
- Extraction by 1% citric acid [32];
- Extraction with DTPA (diethylene triamine penta-acetic acid) [33].
Extractions were performed following the indications of Pansu and Gautheyrou [31]. All extracts were analyzed for Fe by ICP in a Perkin Elmer Optima 8300 apparatus. Each of the extracts is assumed to reflect a specific pool. Whereas DCB removes all free forms of Fe, either crystalline or amorphous, Tamm’s reagent extracts only non-crystalline forms. Citric acid is seen as a generic extractant to test the availability of a variety of nutrients [34]. DTPA is assumed to give a smaller, more precise estimation of Fe forms immediately available for plants and/or the soil microbiota.
2.7. Statistical Analyses
The relationships between numeric variables were studied by standard Pearson’s correlation. For linear correlations, and particularly in tables, the simple correlation index (r) was used instead of the more usual R2 because the former involves a sign (+ or −) and gives more information than R2, which is always positive. All correlations were obtained using the original data; no transformation was applied.
In addition to correlation analysis, principal component analysis (PCA) was applied to our dataset to summarize the relationship of the several variables among them and relative to the indicators of C stability (Cresp33, BRR, and MAR) and the active C pool (soluble C, microbial C, and the sum of both). Because the several studied variables (POM abundance, Fe forms, recalcitrance, etc.) had a wide variety of scales, we previously normalized these scales by dividing all values by the highest one obtained, for all studied variables. In this way, for any studied variable, all values are between 0 and 1. The aim of this normalization is to give the same weight to all variables irrespective of their numerical values (which can be low or high depending on the chosen units).
All analyses were performed with SPSS 19.0, except data fitting to curves, which was performed using the facilities of SigmaPlot 10 (Jandel Scientific).
3. Results
An exhaustive view of the obtained dataset is given in Appendix B, Table A2, Table A3, Table A4, Table A5 and Table A6. This Appendix lists the overall data about OC, N, and Fe forms (Table A2); the soil respiration study and microbial data (Table A3); SOM fractionation by particle size (POM and OMC) (Table A4); and SOM fractionation by acid hydrolysis (Table A5 and Table A6). In the following sections, we focus on the relationships of these variables, their distribution along the soil profiles, and how they explain the stability of SOM overall.
3.1. Changes in C Stability with Depth
Both Cresp33 and BRR are indicators of C stability since they measure the fraction of C lost in a time unit. Figure 2 shows how these parameters change with depth for each pedon. As usual, organic matter tends to be more stable at deep layers. The loss of C upon incubation (Cresp33) decreases from a bit less than 80 mg per g C (top layer of pedons I and IV) to about 11 in the deepest layer of pedon III. Also, BRR decreases from about 1.5 mg C per g C per day (in pedon IV) to 0.2 in the deepest layer of pedon III. The evolution of Cresp33 and BRR with depth is remarkably similar, and there is a very good correlation between them (r = 0.938 ***).

Figure 2.
Distribution with depth of the proportion of respired C (Cresp33), basal respiration rate (BRR), and microbial activity rate (MAR). All points are the mean of three replicates; horizontal bars are standard deviations. Horizontal grey lines give the limits of the sampled layers.
In contrast with Cresp33 and BRR, the relationship of MAR with the position within the soil profile is not clear. In most cases, MAR decreases with depth overall (pedons I, II, and IV) but in a highly erratic way. Peaks of abnormally high MAR values appear in the middle of profiles, and in pedon III, MAR values were highest precisely at the very bottom of the profile.
3.2. Microbial Parameters
At the end of incubation, soluble C (extracted with dilute K2SO4) and the basal respiration rate (BRR) did not correlate. In contrast, microbial C (extracted after chloroform fumigation) was clearly related to the microbial activity (Figure 3). A single exponential curve fitted better than a straight line. However, the best relationship was observed with the sum soluble + microbial C (R2 = 0.772 ***). We suggested this sum as a measure of the active C pool in soils [35], and the current results sustain our proposal.
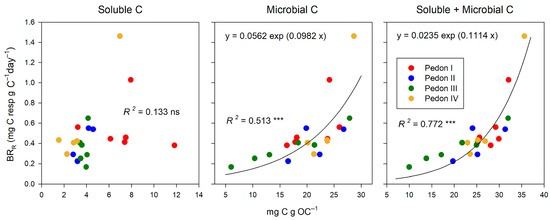
Figure 3.
Relationships between soluble, microbial, and their sum (active C) at the end of incubation (day 33) and the basal respiration rate (BRR). Significance of correlations: ‘ns’ non-significant p > 0.100; p ≤ 0.100; *** p ≤ 0.001.
The active C (sum soluble + microbial) never reaches 40 mg per g total OC (i.e., 4% of total OC). Overall, active C tends to decrease with depth (Figure 4), both in absolute terms (per soil weight) and in relative terms (per total C), but such a decrease is not always consistent: It is clear for pedons III and IV and somewhat less for pedon II (where in the first horizon MC is smaller than in the underlying horizon), and it is not observed for pedon I, where the behavior with depth of soluble C, MC, and the sum of both is erratic.
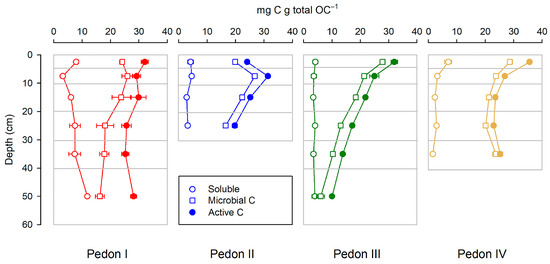
Figure 4.
Distribution of active C and its components (soluble and microbial C) along the studied profiles. All points are the mean of three replicates; horizontal bars are standard deviations.
3.3. Effects of SOM Biochemical Quality (q) on the Size of the Active Pool
A detailed summary of the results obtained in the acid hydrolysis study is given in Appendix B, Table A5 and Table A6. Here, we focus on how the information obtained from acid hydrolysis relates to microbial activity and SOM decomposition.
Table 2 summarizes the correlations between several indicators of SOM q and those related to the active C pool (soluble + microbial C). Only those variables that show a relationship are given; for more exhaustive information, see Appendix B, Table A7. Table 2 suggests overall a poor effect of q on the size of the active C pool. Few studied parameters had a significant relationship with either soluble C or microbial C. Some correlations (labelled “†” in the table) were within the limit of significance.
Table 2.
Correlations (r values) between parameters related to the biochemical quality of soil organic matter (obtained by acid hydrolysis) and those related to the active C pool: soluble C, microbial C, and the sum of both (active C). Significance of correlations: †, within the limit of significance, p ≤ 0.100; * p ≤ 0.050; ** p ≤ 0.010; *** p ≤ 0.001. The table shows only parameters that correlate to some significance with at least one of the components of the active C pool. More exhaustive information is given in Appendix B, Table A7.
Neither carbohydrates alone nor XAD+ C seem useful predictors of soluble C, microbial C, or their sum. The indicators that significantly relate to the size of the active SOM pool are those dealing with the abundance of polyphenolic compounds. Overall, these parameters affect more the soluble than the microbial C. The extent of the correlations depends on the indicator, but the overall picture is consistent. While polyphenolics in the first hydrolysate (LP I) strongly affect the size of the soluble C but not the size of the microbial C pool, polyphenolics in the second hydrolysate affect both of them negatively and significantly. The opposite behavior of the two hydrolysates suggests that they represent truly distinct SOM compartments. Interestingly, the ratio II/total for phenolics (measured by the Folin–Denis reaction) is the best predictor of the size of the active pool observed in our work (r = −0.848 ***); i.e., the higher the proportion of phenolic compounds found in the second hydrolysate, the lower the proportion of the active pool (soluble + microbial) relative to total organic matter.
3.4. Effects of SOM Biochemical Quality on C Stability
Table 3 summarizes the variables related to SOM q, for which we observed some relationship with C stability. Overall, the effect is poor: Few parameters had a significant relationship with the C lost upon incubation (Cresp33). The results are even poorer for the basal respiration rate (BRR) and the microbial activity rate (MAR). We note that all significant correlations in Table 3 refer to the abundance of phenolic compounds in the second hydrolysate, estimated by the Folin–Denis reaction.
Table 3.
Correlations (r values) between several parameters related to the biochemical quality of soil organic matter (obtained by acid hydrolysis) and those related to its stability: carbon respired in 33 days (Cresp33), basal respiration rate (BRR), and microbial activity rate (MAR). Significance of correlations: †, within the limit of significance, p ≤ 0.100; * p ≤ 0.050.
3.5. Relationships between Size Fractions and C Stability
The C associated with fractions > 20 µm (POM) relates positively with Cresp33 and BRR (Figure 5). The best correlations were found with the smallest of the POM fractions, 50–20 µm, whereas the poorest correlations were those found with the coarsest fraction, 2000–200 µm. The organo–mineral fraction (<20 µm) correlated negatively with both Cresp33 and BRR: The higher the proportion of total C in this fraction, the more stable SOM is against the microbial attack.
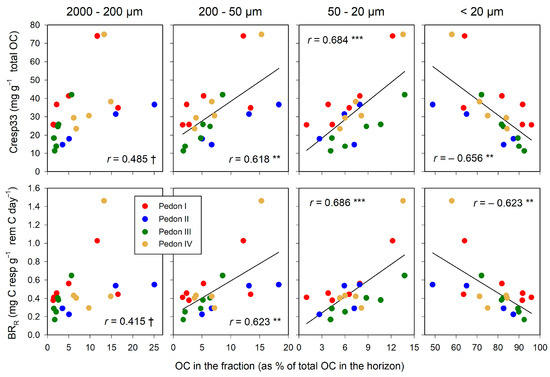
Figure 5.
Relationships between the distribution of total OC in size fractions and indicators of soil microbial activity: proportion of total C lost by respiration, Cresp33 (upper graphs), and the basal respiration rate, BRR (lower graphs). Significance of correlations: †, within the limit of significance, p ≤ 0.100; ** p ≤ 0.010; *** p ≤ 0.001. Regression lines are drawn only when significant.
This pattern is repeated for the relationship between C in size fractions and the size of the microbial pool (Figure 6). Microbial C relates positively with the fraction of total C in POM (>20 µm), and negatively with the organo–mineral complexes (<20 µm). In contrast, the amount of C in the size fractions does not seem related to the specific microbial activity (MAR): Only for the 50–20 µm fraction was the correlation significant, suggesting a spurious relationship.
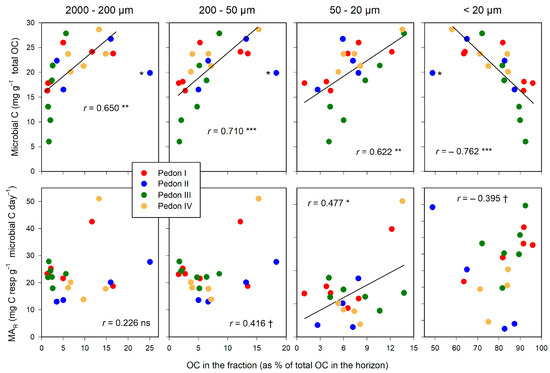
Figure 6.
Relationships between the distribution of total OC in size fractions and microbial biomass (upper graphs) and the microbial activity rate, MAR (lower graphs). Significance of correlations: †, within the limit of significance, p ≤ 0.100; * p ≤ 0.050; ** p ≤ 0.010; *** p ≤ 0.001. Aberrant points, labelled with asterisk (*), were not included in the regression. Regression lines are drawn only when significant.
3.6. Iron Forms: Distribution in the Soil Profiles and Effect on Microbial Activity
The several free Fe forms were found in highly different amounts. While dithionite extraction yielded between 25 and 80 mg Fe per g soil, both oxalic-oxalate buffer (Tamm’s reagent) and citric acid yielded much lower amounts (<1.2 mg Fe per g soil, in most cases). Particularly low amounts of Fe were obtained through DTPA extraction: less than 60 mg per kg soil.
The distribution of Fe forms along the soil profiles differs for each specific form (Figure 7). Dithionite-extracted Fe (involving all free forms, either crystalline or amorphous) consistently increased with depth, at least down to 25 cm. In contrast, the Fe extracted with the Tamm’s reagent (amorphous forms) had an irregular behavior with depth. The Fe extracted with citric acid decreased with depth below the 5 cm threshold, being less predictable in the upper 5 cm. Finally, the amounts of Fe gathered by DTPA consistently decreased with depth.
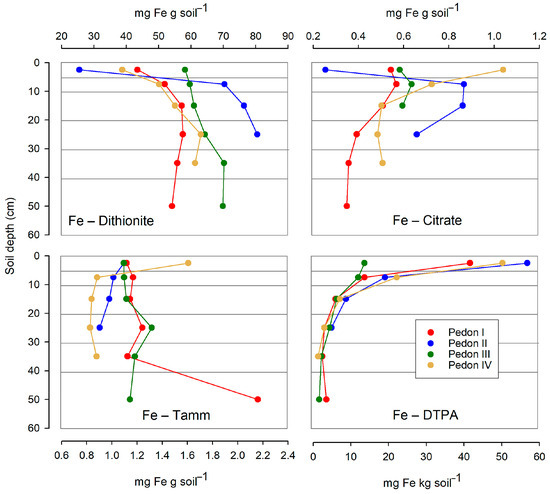
Figure 7.
Distribution with depth of the several free Fe forms (extracted by dithionite, citric acid, Tamm’s reagent, or DTPA) in the studied profiles. Horizontal lines are the limits of the sampled layers. Note that for Fe–DTPA, the abscissa is on a different, smaller scale than for other Fe forms.
Table 4 gives the relationships between the several Fe forms with indicators of SOM decomposition, microbial activity, and active C. Each Fe form has its own behavior. Dithionite-extracted Fe was negatively related to all indicators of SOM decomposition or microbial activity, even though the obtained r values were not always significant. In contrast, r values were always positive for DTPA-extracted Fe and almost always for Tamm’s-extracted Fe. The Fe extracted with citrate showed a notorious lack of consistence and was, overall, the least useful Fe form in predicting soil microbial activity.
Table 4.
Correlations (r values) between the several free Fe fractions and indicators of soil microbial activity and/or C stability. Significance of correlations: †, within the limit of significance, p ≤ 0.100; * p ≤ 0.050; *** p ≤ 0.001.
The several Fe forms are, of all variables studied in our experiment, the only ones that significantly relate to the microbial activity rate (MAR). The observed relationships (Figure 8) essentially follow the trends given in Table 4: a negative relationship for dithionite- and citrate-extracted Fe and a positive one for the Fe extracted with Tamm’s reagent or DTPA. The extraction with citrate does not reach significance, even when an aberrant point is ignored. For the relationship between Tamm’s-extracted Fe and MAR, an aberrant point appeared, too; removing this point from the regression study improved the r value but without changing its sense, which was positive in both cases.
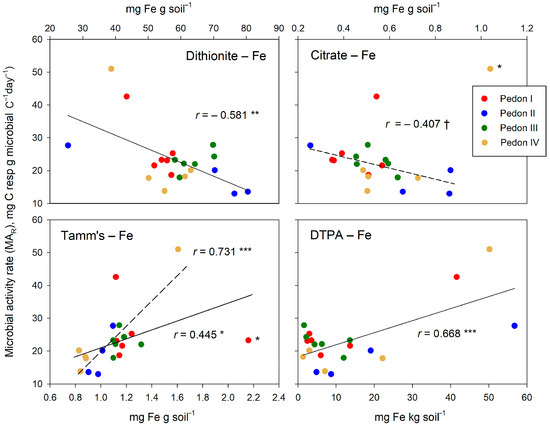
Figure 8.
Relationships between the several free Fe forms (extracted by dithionite, citric acid, Tamm’s reagent, and DTPA) and the microbial activity rate (MAR). Significance of correlations: †, within the limit of significance, p ≤ 0.100; * p ≤ 0.050; ** p ≤ 0.010; *** p ≤ 0.001. Points that are possibly aberrant are labeled with an asterisk (*). The regression lines obtained by ignoring these points are given as broken lines.
The diversity of relationships between the several free Fe forms and the indicators of soil microbial activity likely reflects the complex role of iron in regulating SOM decomposition. The single-sided, usual view of free Fe oxyhydroxides as SOM stabilizers may be too simple, as further discussed below.
3.7. Principal Component Analysis (PCA)
As shown previously (3.3 and 3.4), the indicators of SOM q (acid hydrolysis) correlated poorly with those of microbial activity (Cresp33, BRR, microbial C, and MAR). Therefore, we discarded most of the former, leaving only the two main ones (carbon recalcitrance and RIC, by either HCl or H2SO4 hydrolysis). For our analysis, we separately considered two groups of target variables: on one hand the variables related to soil microbial activity and activity rates (Cresp33, BRR and MAR) and, on the other hand, those related to the soil active C pool (soluble C, microbial C, and the sum of both). We carried out a separate PCA for each case.
Figure 9 summarizes the results of PCA. Both Figure 9A,B look similar, which is logical since the decomposition activity is the direct consequence of the amount and activity of microbial C, the main component of the active C. However, some relevant differences appear.
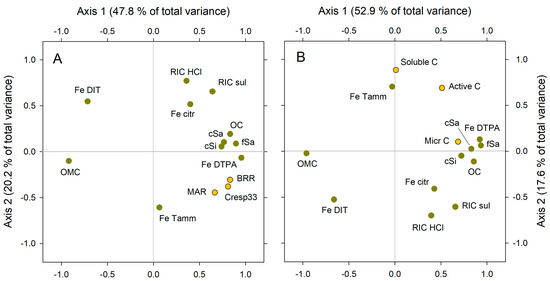
Figure 9.
Results of PCA analysis. The explicative variables (green dots) are the same in both analyses: recalcitrance index for carbon, HCl method (RIC HCl), recalcitrance index for carbon, H2SO4 method (RIC sul), POM coarse sand size (cSa), POM fine sand size (fSa), POM coarse silt size (cSi), C in organo–mineral complex, <20 µm size (OMC), dithionite-extracted Fe (Fe DIT), Tamm’s reagent-extracted Fe (Fe Tamm), citric acid-extracted Fe (Fe citr), and DTPA-extracted Fe (Fe DTPA). The target variables (yellow dots) are different in (A,B). (A) C respired after 33 days, relative to total initial C (Cresp33), basal respiration rate (BRR), and microbial activity rate (MAR). (B) Soluble C, microbial C (Micr C), and sum of soluble + microbial C (active C).
In Figure 9A, the target variables (BRR, Cresp33, and MAR, in yellow color) are closely placed (meaning closely related) at the right extreme of axis 1 and are at slightly negative values for axis 2. The explaining variables become, in some cases, quite close to the target variables: namely, the variables that most positively relate to microbial activity, i.e., total OC, the three POM fractions (coarse sand, fine sand, and coarse silt sized), and DTPA-extracted Fe. The later variable is, in Figure 9A, the closest one to the three target variables (BRR, Cresp33, and MAR), meaning that PCA places DTPA-Fe as the main predictor for soil microbial activity. In contrast, the dithionite-extracted Fe is placed exactly at the opposite site, relative to the (0,0) center: PCA places dithionite-extracted Fe as the variable most clearly opposite to soil microbial activity, close to the C in the organo–mineral complex (OMC). Other considered variables (recalcitrance, citrate-extracted Fe, and Tamm’s extracted Fe) become dispersed in the graph, suggesting that their relationship with the three target variables (BRR, Cresp33, and MAR) is indirect.
In Figure 9B, the target variables, in yellow color, are active C and its two components: microbial C and soluble C. They are placed all at the upper right quarter of the graph (i.e., at the positive half of both axes), but we must notice that soluble C and microbial C become very separated from each another, reflecting their low relationship. The active C is in the middle of both, far from any explaining variable. The explaining variables most closely related to microbial activity in Figure 9A are also those most closely related to microbial C in Figure 9B: total OC, the three POM fractions (coarse sand, fine sand, and coarse silt sized), and DTPA-extracted Fe. Again, dithionite-extracted Fe and the C in the organo–mineral complex (OMC) are placed at the very opposite side in the graph.
From PCA, a consistent picture arises. Apparently, POM fractions, total OC, and DTPA-extracted Fe are the best predictors of soil microbial activity and their indicators. Dithionite-extracted Fe and C in the organo–mineral complex, in contrast, seem the clearest drivers for SOM stability since they are the explaining variables most negatively correlated to soil microbial activity. The role of other variables would be either null or almost null (recalcitrance indices) or indirect: This would be the case of Tamm’s-extracted Fe (amorphous free Fe forms), which is less closely related to microbial activity than DTPA-extracted Fe, according to this analysis.
4. Discussion
4.1. Position within the Soil Profile
Leaving aside some small irregularities, in the studied profiles, SOM stability increases with depth overall. This result may seem trivial, but we must stress that the pattern “the deeper the more stable” is less universal than often thought. It has been found often [36,37,38,39], but exceptions to the rule have been observed [35,40]. Complex patterns appear sometimes; thus, the turnover of SOM, in a context of land-use change and a shift from C3 to C4 vegetation (or vice versa), has been shown to decrease with depth down to about 40 cm but to increase again beyond this threshold [41].
4.2. Insight about the Role of Free Fe Forms
The relevance of iron for SOM stabilization, known for many years [12,14], has been stressed in the last decades [42,43,44]. The precise ways Fe (and, to a lesser extent, Al and Mn) oxyhydroxides stabilize SOM involve a variety of mechanisms, including ligand exchanges and polyvalent cation bridges [45]. A main role is assumed for Fe oxyhydroxides in establishing complexes with organic compounds that are stable for centuries or millennia [46]. A reason for the powerful stabilization of organic compounds by Fe forms may be their poor ability to become desorbed [47]. Also, it has been noted that the ratio of free Fe forms to aluminous clays seems more relevant for SOM stabilization than Fe forms alone [44].
It is important to note that the high relevance of free Fe forms arises from correlation studies: The total SOM correlates well with either free Fe forms or with a combination of free Fe forms plus clay content or in a similar manner [5,44]. Fractionation protocols involving the specific quantification of SOM stabilized by free Fe forms [10,18,19] rather show that the SOM associated with free Fe forms is a minor fraction of the total.
Our results add uncomfortable data to the whole picture, for we observed that not all free Fe forms seem to act as SOM stabilizers. Thus, the amount of Fe extracted by DCB (dithionite-citrate-bicarbonate) seems a clear inhibitor of soil microbial activity and thus an SOM stabilizer. The Fe extracted by citrate has a negative effect on soil microbial activity, too, but this is less clear due to outlier values that may distort the main trend: This may be due to the intrinsic non-specific character of this extraction, designed for available micronutrients [34], but not clearly matching any specific free Fe form. Well in contrast, the Fe extracted with either Tamm’s reagent (oxalic-oxalate) or DTPA correlates positively with soil microbial activity, creating doubts about the precise role of iron forms on SOM stabilization. Since Tamm’s reagent extracts amorphous free Fe forms, whereas dithionite extracts all free forms, both crystalline and amorphous, our results suggest that the inhibitory effect of free Fe forms is largely due to the crystalline forms. Thus, the stabilizing effect of free amorphous Fe forms seems unclear.
At least partly, our mixed results about the effect of free Fe (as either an SOM stabilizer or enhancer of soil microbial activity) relate to the role of iron as a micronutrient for the soil microflora. The Fe gathered with smooth solvents (particularly DTPA) likely matches the fraction easily available for both plant roots and the soil microbiota. The larger the amount of Fe in this fraction, the more active the soil microbial biomass can be. Conversely, the larger the amount of free crystalline Fe forms (extracted with dithionite but not with Tamm’s reagent), the smaller the microbial activity: A reduced microbial activity results necessarily in a higher SOM stabilization.
However, in addition to this problem, we must mention that in most studies relating Fe oxyhydroxides with SOM storage, dithionite is the main extractor [17,44], either alone or combined with other chemicals. Dithionite, through the reduction of Fe(III) to Fe(II), solubilizes massively all free iron forms, either amorphous or crystalline, being therefore quite unspecific. The positive effect on the microbial activity of amorphous forms of Fe, i.e., extracted with Tamm’s reagent, suggests that in our profiles, the stabilization of SOM by free Fe is largely due to the crystalline forms extracted by dithionite but not with Tamm’s reagent. To some extent, this disagrees with previous reports [46] about a strong stabilization of SOM in soils rich in oxalate-extractable Fe; thus, the matter remains debatable.
A relevant result of our analyses is that the several Fe forms are the only studied parameters that specifically affect microbial activity rate (MAR), i.e., the amount of respired C per unit microbial C per unit time. Parameters such as the proportion of POM clearly affect soil microbial biomass but not its specific activity. The several Fe forms affect the amount of soil microbial biomass, too, but in addition, they significantly affect the microbial activity rate (MAR). Thus, besides helping the presence of an abundant microbial community, free iron forms seem to have a modulator effect on soil microbial metabolism, a possibility—one never considered so far, to the best of our knowledge—deserving further research.
4.3. Drivers of SOM Stability: Physical Protection versus Biochemical Quality
The positive and significant relationship between the POM fractions and the decomposition rates (Figure 5) is consistent with the current paradigm established in the decades from 1990 to 2010, which assumes that decomposition relies upon the physical accessibility of the organic substrates, and those most accessible are precisely the coarse organic fragments [47,48,49,50]. While the lower limit for POM is usually set at 50 or 53 µm [50,51,52,53,54], our results suggest 20 µm as a better option, in agreement with previous data [55]. The smallest POM fraction (50–20 µm) was the best related to SOM decomposition (Figure 4), in contrast with our results with pine soils [35], in which this fraction did not correlate at all with the C losses upon incubation. Thus, the consistency of the current paradigm does not hamper the existence of peculiarities in specific situations.
In comparison with physical protection, q seems much less relevant at first glance. It is hard to detect significant relationships between decomposition rates and q indicators: Only the amount of aromatic compounds (by Folin–Denis reaction) showed a significant relationship with Cresp33 and/or BRR (Table 4). The interpretation of this result is not trivial because these correlations have been observed for the second hydrolysate (LP II) but not for the first one (LP I), which likely reflects a pool more available as a substrate for the microbial community. The second hydrolysis destroys cellulose, which is scarcely affected by the first acid attack [56]. But, as decomposition proceeds, the proportion of polyphenolic compounds found in LP II increases [26]. The abundance of aromatic compounds in LP II thus indirectly reflects a more advanced SOM humification rather than a true deleterious effect of the aromatic compounds of LP II for the microbial activity.
Biochemical quality, q, is a complex concept. It involves (a) the abundance of easily metabolizable compounds, (b) the scarcity of compounds deleterious for microbial activity, and (c) the abundance of nutrients associated to organic matter, in particular N. Which of these constraints is limiting for microbial activity may be site-dependent. It is compulsory to characterize SOM through a variety of parameters because it is not obvious a priori which of them may be the most decisive one. In addition, it is crucial to remember that (i) microbial biomass accounts for a small fraction of total SOM [57]: As shown in Figure 3, in the grassland soils studied here, microbial C is less than 30 mg per g of total OC (i.e., 3% of total C); (ii) virtually all components of SOM may be used as substrate by at least part of the microbial community, even coal [58]; therefore, (iii) most substrates (carbohydrates, proteins, polyphenolics, and so on) will be found in the soil in an available form and at amounts one or two orders of magnitude higher than soil microbial carbon. The total amount of a given substrate is unlikely to be limiting for decomposition. Thus, the relationship of decomposition rates with the proportion at which substrates become available to the soil microflora (e.g., carbohydrate/phenolic C ratios) rather than to the total amount of each substrate (total carbohydrates and total polyphenolics) is not surprising.
Even so, the choice of the appropriate indicator is crucial. Thus, whereas in waste waters, the proportion of dissolved C retained by XAD® resins has been shown to correlate negatively with its biodegradability [59], in our work, the proportion of XAD + C seems irrelevant. The carbohydrate/polyphenolic C ratio, a good predictor of decomposition in pine stands on marls [35], was not useful in the grasslands studied here.
4.4. An Overall View
As pointed out in the introduction, leaving aside the pedoclimate as the main constraint, SOM turnover results from the combined (and complex) effect of (a) its degree of physical protection, (b) its biochemical quality (q), and also (c) inorganic agents—e.g., free forms of iron—capable of becoming associated with SOM and/or specifically inhibiting the microbial metabolism. Our results stress several points worthy of inclusion in any analysis about how the several constraints affect SOM turnover.
(i) First, there is a hierarchy of constraints, and in such a hierarchy, q goes below physical protection. It is easy to propose predictors of SOM decomposition based on its physical availability alone, e.g., the abundance of POM fractions, but to predict SOM decomposition from q alone is not easy. This widely accepted fact may be considered a main component of the current paradigm about SOM stabilization/decomposition;
(ii) Second is the role of iron. A relevant role for free Fe forms on SOM stabilization is also part of the current paradigm. Nevertheless, our results suggest that the precise role of free Fe forms is not a completely solved problem. The free Fe pool involves several forms (crystalline and amorphous; easily available): Some have a clear stabilizing effect, while others do not. Amorphous free Fe forms seem to not be SOM stabilizers: They enhance soil microbial activity and therefore SOM decomposition. The very clear positive effect of DTPA-extracted Fe on microbial activity suggests that Fe availability may be a limiting factor for SOM decomposition, likely due to the obvious fact that iron is a nutrient needed for microbial metabolism;
(iii) Third is the specific method by which constraints act: The above-mentioned constraints do not determine SOM decomposition directly; they do it through their effect on the size of the microbial pool (MC: microbial carbon) and/or the microbial activity rate (MAR). Thus, POM abundance clearly affects microbial biomass, but its effect on MAR is doubtful. Free iron forms, in contrast, clearly affect MAR, but not all forms affect MC: Amorphous Fe forms, for instance, do not apparently affect it. Whereas all constraints eventually determine SOM decomposition, each constraint has its own specific effect and also its own specific target.
Our findings have obvious implications for future research. Most indicators of SOM physical protection (POM and MAOM) and free Fe forms affect soil microbial biomass, either enhancing or decreasing it. But, of all studied soil features, only free Fe forms significantly relate to MAR (C respired per g microbial C per day), which suggest for them a role as regulators of microbial metabolism. The precise role is not trivial, though: It may be either to enhance microbial activity (free amorphous Fe) or to inhibit it (free crystalline Fe), a dichotomy deserving further research. Further research is needed also to determine how limiting the available Fe is for soil microbial activity: Perhaps a generic lack of available Fe could be a factor in Fe-driven effect on soil organic matter stabilization. Future research should also consider other possible limiting factors for soil microbial activity (phosphorus and calcium availability, for instance).
Finally, we stress the need for more similar research to verify to what extent our results remain valid for other plant communities (forests and shrublands), other climates (dry areas, particularly), and also over different parent materials (more acidic substrates or more strongly calcareous ones).
Author Contributions
P.R., conceptualization, field work, analytical work, data analysis, writing of the paper, revision of the text, and submission; T.S.-Y., conceptualization, analytical work, and revision of the text; R.M.P., preliminary field work (pedological exploration of the area), conceptualization, field work, and revision of the text. All authors have read and agreed to the published version of the manuscript.
Funding
This research was funded by Spanish Ministry of Science and Economy (MINECO), project CRONOCARB, code GL2009-13400-C05-01.
Data Availability Statement
The complete original dataset is given below (Appendix A and Appendix B).
Acknowledgments
We acknowledge all the support obtained from Serveis Científico-Tècnics de la Universitat de Barcelona (CCiT, UB).
Conflicts of Interest
The authors declare no conflicts of interest.
Appendix A
This appendix includes additional information about the original soil profiles and is thus a complement of Table 1.
Table A1.
Main macromorphological features of the studied profiles. The limits of the horizons follow the original sampling for the soil survey [22,23]. For this paper, profiles were re-sampled (see 2.1). Color (wet conditions) is according to Munsell’s color chart.
Table A1.
Main macromorphological features of the studied profiles. The limits of the horizons follow the original sampling for the soil survey [22,23]. For this paper, profiles were re-sampled (see 2.1). Color (wet conditions) is according to Munsell’s color chart.
| Pedon | Horizon | Depth | Color | Structure | pH a | Texture b |
|---|---|---|---|---|---|---|
| I | Oi | 0–2 | 10YR 3/4 | – | 6.5 | |
| A1 | 2–9 | 10YR 3/3 | Strong, crumb, fine | 6.1 | CL | |
| A2 | 9–24 | 10YR 3/4 | Strong, crumb, medium | 6.1 | CL | |
| Bw | 24–69 | 10YR 4/4 | Very weak, subangular blocky, medium | 8.4 | SL | |
| 2C | >69 | – | – | – | ||
| II | Oi | 0–2 | – | – | – | |
| A1 | 2–22 | 5YR 4/5 | Very strong, crumb, fine | 6.1 | C | |
| A2 | 22–44 | 10YR 4/5 | Very strong, crumb, medium | 6.8 | SL | |
| Bw | 44–77 | 10YR 5/6 | Strong, subangular blocky, medium | 7.4 | L | |
| 2C | >77 | – | – | – | ||
| III | O | 0–5 | 7.5YR 2/2.5 | – | 6.3 | |
| A | 5–10 | 7.5YR 4/3 | Strong, crumb, fine | 6.6 | CL | |
| Bw1 | 10–40 | 7.5YR 3/4 | Moderate, crumb, medium | 6.6 | CL | |
| Bw2 | >40 | 7.5YR 3/4 | Moderate, crumb, medium | 6.7 | CL | |
| IV | O | 0–5 | 7.5YR 3/2 | – | ||
| A1 | 5–10 | 7.5YR3/4 | Strong, crumb, medium | 7.4 | CL | |
| A2 | 10–20 | 7.5YR 4/2 | Strong, crumb, medium | 7.5 | CL | |
| A3 | 20–30 | 7.5YR 3/3 | Strong, crumb, medium | 7.8 | CL | |
| Bw | >30 | 7.5YR 3/3 | Strong, crumb, medium | 7.8 | CL |
a pH in water, proportion 1:2.5 (soil/water); b texture according to USDA categories [60].
Appendix B
This appendix includes the following set of tables:
- The complete table (Table A7), with the correlations between the indicators of biochemical quality q (obtained through the acid hydrolysis procedures) and the indicators of decomposition, i.e., microbial activity.
Table A2.
Organic carbon, total nitrogen, and Fe forms: dithionite-extracted Fe (FeDIT), Tamm’s-extracted Fe (FeTMM), citrate-extracted Fe (FeCIT), and DTPA-extracted Fe (FeDTPA). All data are given as mg g−1, except FeDTPA (in mg kg−1).
Table A2.
Organic carbon, total nitrogen, and Fe forms: dithionite-extracted Fe (FeDIT), Tamm’s-extracted Fe (FeTMM), citrate-extracted Fe (FeCIT), and DTPA-extracted Fe (FeDTPA). All data are given as mg g−1, except FeDTPA (in mg kg−1).
| Pedon | Depth (cm) | OC | Total N | FeDIT | FeTMM | FeCIT | FeDTPA |
|---|---|---|---|---|---|---|---|
| I | 0–5 | 114.8 | 8.64 | 43.5 | 1.12 | 0.543 | 41.6 |
| 5–10 | 68.0 | 4.22 | 51.9 | 1.17 | 0.568 | 13.6 | |
| 10–20 | 38.0 | 3.21 | 57.1 | 1.15 | 0.508 | 6.0 | |
| 20–30 | 25.4 | 1.23 | 57.5 | 1.24 | 0.392 | 3.0 | |
| 30–40 | 19.4 | 1.04 | 55.8 | 1.12 | 0.357 | 2.4 | |
| 40–60 | 14.0 | 0.91 | 54.1 | 2.16 | 0.349 | 3.5 | |
| II | 0–5 | 345.1 | 21.50 | 25.5 | 1.10 | 0.254 | 56.8 |
| 5–10 | 125.9 | 9.46 | 70.4 | 1.01 | 0.866 | 19.1 | |
| 10–20 | 96.1 | 4.26 | 76.4 | 0.98 | 0.861 | 8.7 | |
| 20–30 | 83.6 | 3.05 | 80.5 | 0.90 | 0.658 | 4.9 | |
| III | 0–5 | 109.4 | 6.10 | 58.2 | 1.10 | 0.583 | 13.6 |
| 5–10 | 86.4 | 2.61 | 59.6 | 1.10 | 0.636 | 12.0 | |
| 10–20 | 87.3 | 3.08 | 60.9 | 1.12 | 0.594 | 6.3 | |
| 20–30 | 49.9 | 1.81 | 64.3 | 1.32 | 0.457 | 4.3 | |
| 30–40 | 42.7 | 1.30 | 70.2 | 1.18 | 0.454 | 2.2 | |
| 40–60 | 40.5 | 1.05 | 69.8 | 1.14 | 0.505 | 1.6 | |
| IV | 0–5 | 199.9 | 6.37 | 38.8 | 1.61 | 1.040 | 50.2 |
| 5–10 | 90.3 | 1.44 | 50.2 | 0.88 | 0.724 | 22.2 | |
| 10–20 | 71.9 | 1.00 | 55.0 | 0.84 | 0.503 | 7.1 | |
| 20–30 | 42.1 | 0.66 | 63.1 | 0.83 | 0.485 | 3.0 | |
| 30–40 | 34.2 | 0.54 | 61.3 | 0.88 | 0.507 | 1.3 |
Table A3.
Left: results of the incubation experiment: carbon respired in 33 days (Cresp33), basal respiration rate (BRR), and microbial activity rate (MAR). Right: active C at the end of incubation (33 days) and its components, microbial C and soluble C. Cresp33 in mg C respired per g initial OC; BRR in mg respired C per g OC per day, at the end of incubation (day 33); MAR in mg respired C per g microbial C per day, at the end of incubation (day 33). Microbial, soluble, and active C in mg C per g total OC at the end of incubation (day 33).
| Incubation Experiment | Active C | ||||||
|---|---|---|---|---|---|---|---|
| Pedon | Depth (cm) | Cresp33 | BRR | MAR | Microbial C | Soluble C | Active C |
| I | 0–5 | 74.01 | 1.028 | 42.57 | 24.14 | 7.94 | 32.08 |
| 5–10 | 41.36 | 0.561 | 21.58 | 25.99 | 3.22 | 29.21 | |
| 10–20 | 34.89 | 0.445 | 18.69 | 23.79 | 6.13 | 29.92 | |
| 20–30 | 36.68 | 0.458 | 25.25 | 18.13 | 7.49 | 25.62 | |
| 30–40 | 25.63 | 0.412 | 23.09 | 17.84 | 7.40 | 25.23 | |
| 40–60 | 25.75 | 0.379 | 23.27 | 16.30 | 11.83 | 28.13 | |
| II | 0–5 | 36.65 | 0.550 | 27.68 | 19.88 | 4.19 | 24.07 |
| 5–10 | 31.45 | 0.539 | 20.14 | 26.74 | 4.59 | 31.33 | |
| 10–20 | 14.83 | 0.290 | 12.98 | 22.35 | 2.81 | 25.17 | |
| 20–30 | 18.03 | 0.224 | 13.58 | 16.53 | 3.20 | 19.73 | |
| III | 0–5 | 42.03 | 0.648 | 23.29 | 27.84 | 4.14 | 31.99 |
| 5–10 | 25.87 | 0.383 | 17.90 | 21.38 | 3.59 | 24.97 | |
| 10–20 | 24.73 | 0.406 | 22.12 | 18.37 | 3.41 | 21.78 | |
| 20–30 | 18.40 | 0.288 | 21.99 | 13.08 | 4.05 | 17.13 | |
| 30–40 | 13.93 | 0.252 | 24.31 | 10.35 | 3.47 | 13.82 | |
| 40–60 | 11.33 | 0.168 | 27.85 | 6.03 | 3.97 | 10.00 | |
| IV | 0–5 | 74.82 | 1.461 | 51.03 | 28.64 | 6.97 | 35.61 |
| 5–10 | 38.26 | 0.422 | 17.77 | 23.73 | 3.16 | 26.90 | |
| 10–20 | 30.62 | 0.294 | 13.81 | 21.27 | 2.26 | 23.53 | |
| 20–30 | 23.49 | 0.406 | 20.16 | 20.12 | 2.85 | 22.98 | |
| 30–40 | 29.41 | 0.432 | 18.21 | 23.71 | 1.54 | 25.25 | |
Table A4.
Fractionation of soil organic matter by size: particulate organic matter (POM: >20 μm) and organo–mineral complex (OMC: <20 μm). Data are the percentage of the total OC.
Table A4.
Fractionation of soil organic matter by size: particulate organic matter (POM: >20 μm) and organo–mineral complex (OMC: <20 μm). Data are the percentage of the total OC.
| POM | OMC | ||||
|---|---|---|---|---|---|
| Pedon | Depth (cm) | cSa | fSa | cSi | fSi + Cl |
| I | 0–5 | 11.66 | 12.17 | 12.18 | 63.99 |
| 5–10 | 5.00 | 5.26 | 7.92 | 81.82 | |
| 10–20 | 16.52 | 13.43 | 6.54 | 63.51 | |
| 20–30 | 2.15 | 2.32 | 3.80 | 91.72 | |
| 30–40 | 1.50 | 1.63 | 0.98 | 95.89 | |
| 40–60 | 1.34 | 2.74 | 4.33 | 91.59 | |
| II | 0–5 | 25.04 | 18.31 | 7.90 | 48.76 |
| 5–10 | 15.99 | 13.16 | 5.90 | 64.96 | |
| 10–20 | 3.51 | 6.66 | 7.20 | 82.63 | |
| 20–30 | 5.04 | 5.00 | 2.67 | 87.29 | |
| III | 0–5 | 5.63 | 8.56 | 13.75 | 72.06 |
| 5–10 | 2.58 | 5.16 | 10.64 | 81.63 | |
| 10–20 | 2.42 | 6.39 | 8.78 | 82.42 | |
| 20–30 | 1.50 | 4.77 | 4.28 | 89.45 | |
| 30–40 | 2.04 | 2.06 | 6.00 | 89.90 | |
| 40–60 | 1.69 | 1.75 | 4.12 | 92.44 | |
| IV | 0–5 | 13.26 | 15.31 | 13.54 | 57.89 |
| 5–10 | 14.80 | 6.69 | 7.38 | 71.12 | |
| 10–20 | 9.70 | 7.16 | 8.12 | 75.02 | |
| 20–30 | 6.72 | 3.70 | 5.33 | 84.26 | |
| 30–40 | 6.15 | 3.95 | 6.00 | 83.91 | |
Table A5.
Fractionation of soil organic matter by acid hydrolysis. Distribution of total C and N between the pools: resistant to acid hydrolysis (RIC: recalcitrance index for carbon) or hydrolysates (labile pool I and II). LP I and II were analyzed only for those obtained by the H2SO4 method. Numbers are the proportion (%) of the total OC in each fraction.
| HCl | H2SO4 | ||||
|---|---|---|---|---|---|
| Pedon | Depth (cm) | RIC | LP I | LP II | RIC |
| I | 0–5 | 34.20 | 45.08 | 10.72 | 44.21 |
| 5–10 | 30.53 | 46.37 | 13.25 | 40.38 | |
| 10–20 | 30.51 | 49.93 | 12.58 | 37.49 | |
| 20–30 | 28.38 | 52.27 | 12.06 | 35.67 | |
| 30–40 | 22.15 | 42.26 | 21.77 | 35.96 | |
| 40–60 | 30.63 | 52.07 | 11.38 | 36.55 | |
| II | 0–5 | 37.41 | 40.26 | 13.42 | 46.32 |
| 5–10 | 35.73 | 41.98 | 12.82 | 45.20 | |
| 10–20 | 39.07 | 43.10 | 12.06 | 44.84 | |
| 20–30 | 40.39 | 41.78 | 12.28 | 45.94 | |
| III | 0–5 | 35.20 | 45.94 | 10.14 | 43.92 |
| 5–10 | 35.40 | 42.87 | 11.46 | 45.68 | |
| 10–20 | 34.79 | 46.58 | 11.66 | 41.76 | |
| 20–30 | 34.13 | 46.09 | 13.51 | 40.40 | |
| 30–40 | 32.69 | 45.59 | 12.59 | 41.81 | |
| 40–60 | 38.08 | 44.26 | 12.45 | 43.30 | |
| IV | 0–5 | 37.42 | 39.39 | 11.23 | 49.38 |
| 5–10 | 33.86 | 44.32 | 10.27 | 45.42 | |
| 10–20 | 29.55 | 49.15 | 12.86 | 37.99 | |
| 20–30 | 32.51 | 46.53 | 11.72 | 41.75 | |
| 30–40 | 37.52 | 47.22 | 9.17 | 43.61 | |
Table A6.
Fractionation of soil organic matter by acid hydrolysis (continuation). Indicators of abundance of labile and recalcitrant compounds in the hydrolysates obtained with sulfuric acid. Carbohydrates (glucose equivalents), polyphenolics (tannic acid equivalents), and XAD+ organic matter. All data are given as % of the total OC in the soil horizon.
| First Hydrolysate (LP I) | Second Hydrolysate (LP II) | ||||||
|---|---|---|---|---|---|---|---|
| Pedon | Depth (cm) | Glu | Tan | XAD+ | Glu | Tan | XAD+ |
| I | 0–5 | 23.29 | 6.85 | 11.36 | 2.53 | 1.26 | 3.88 |
| 5–10 | 29.68 | 8.00 | 9.26 | 2.41 | 1.81 | 3.91 | |
| 10–20 | 39.80 | 12.00 | 14.14 | 2.39 | 1.58 | 4.85 | |
| 20–30 | 39.06 | 13.26 | 12.08 | 2.26 | 2.00 | 4.51 | |
| 30–40 | 35.36 | 16.59 | 13.84 | 3.21 | 2.62 | 6.92 | |
| 40–60 | 37.28 | 21.15 | 14.21 | 2.27 | 1.73 | 6.25 | |
| II | 0–5 | 12.73 | 2.48 | 7.56 | 2.14 | 0.89 | 3.15 |
| 5–10 | 21.41 | 6.33 | 13.76 | 5.50 | 1.46 | 6.93 | |
| 10–20 | 24.21 | 6.60 | 11.09 | 1.58 | 1.85 | 4.14 | |
| 20–30 | 22.50 | 5.44 | 10.01 | 1.57 | 1.88 | 3.57 | |
| III | 0–5 | 20.36 | 6.07 | 9.55 | 1.95 | 2.57 | 4.68 |
| 5–10 | 23.64 | 5.70 | 13.47 | 2.03 | 2.63 | 4.01 | |
| 10–20 | 20.94 | 6.09 | 12.39 | 1.31 | 3.23 | 0.53 | |
| 20–30 | 29.54 | 6.17 | 13.31 | 3.23 | 3.73 | 0.80 | |
| 30–40 | 30.11 | 4.38 | 13.17 | 3.57 | 3.42 | 3.98 | |
| 40–60 | 29.47 | 4.09 | 13.67 | 3.21 | 3.78 | 4.81 | |
| IV | 0–5 | 18.56 | 5.63 | 10.91 | 2.85 | 1.42 | 2.44 |
| 5–10 | 19.76 | 7.51 | 11.05 | 1.81 | 2.59 | 4.38 | |
| 10–20 | 21.55 | 7.15 | 9.70 | 1.18 | 2.95 | 3.81 | |
| 20–30 | 30.42 | 8.01 | 12.35 | 2.38 | 3.58 | 4.77 | |
| 30–40 | 29.57 | 7.40 | 13.60 | 2.04 | 4.26 | 7.17 | |
Table A7.
Linear regression (r values) between indicators of biochemical quality q (obtained in the hydrolysis with sulfuric acid) and indicators of decomposition, i.e., microbial activity, and components of the active C (microbial and soluble C and the sum of both). Significance of correlations: †, within the limit of significance, p ≤ 0.100; * p ≤ 0.050; ** p ≤ 0.010; *** p ≤ 0.001.
| Incubation Experiment | Active C | |||||
|---|---|---|---|---|---|---|
| Parameter | Cresp33 | BRR | MAR | Microbial C | Soluble C | Active C |
| Total OC | 0.422 † | 0.476 † | 0.384 † | 0.343 | −0.093 | 0.281 |
| Total N | 0.383 † | 0.393 † | 0.333 | 0.313 | 0.041 | 0.306 |
| N:OC | 0.313 | 0.259 | 0.201 | 0.281 | 0.575 ** | 0.487 * |
| RIC | 0.283 | 0.406 † | 0.294 | 0.303 | −0.383 † | 0.130 |
| C in LP I | −0.148 | −0.313 | −0.271 | −0.151 | 0.276 | −0.031 |
| C in LP II | −0.229 | −0.185 | −0.071 | −0.258 | 0.203 | −0.159 |
| C II/total hydrolysate | −0.153 | −0.053 | 0.037 | −0.183 | 0.088 | −0.135 |
| Carbohydrates in LP I | −0.284 | −0.318 | −0.166 | −0.337 | 0.424 † | −0.145 |
| Carbohydrates in LP II | −0.006 | 0.118 | 0.258 | −0.098 | 0.203 | −0.011 |
| Total carbohydrates | −0.277 | −0.295 | −0.129 | −0.340 | 0.439 * | −0.142 |
| Carbohydrates: II/tot | 0.243 | 0.369 † | 0.394 † | 0.169 | 0.019 | 0.165 |
| Phenolics in LP I | −0.025 | −0.081 | −0.087 | −0.020 | 0.733 *** | 0.271 |
| Phenolics in LP II | −0.539 * | −0.493 * | −0.315 | −0.478 * | −0.493 * | −0.635 ** |
| Total phenolics | −0.143 | −0.190 | −0.157 | −0.125 | 0.630 ** | 0.133 |
| Phenolics: II/tot | −0.460 * | −0.373 † | −0.140 | −0.505 * | −0.688 *** | −0.739 *** |
| XAD+ in LP I | −0.340 | −0.258 | −0.081 | −0.354 | 0.294 | −0.212 |
| XAD+ in LP II | −0.097 | −0.133 | −0.212 | 0.143 | 0.206 | 0.214 |
| XAD+ total | −0.272 | −0.240 | −0.174 | −0.142 | 0.306 | −0.011 |
| XAD+ II/tot | −0.055 | −0.036 | −0.189 | 0.293 | 0.076 | 0.302 |
| Carbohydrate/Phenolic C | −0.117 | −0.033 | 0.196 | −0.316 | −0.308 | −0.415 † |
| Carbohydrate/XAD+ C | −0.132 | −0.183 | −0.041 | −0.300 | 0.245 | −0.181 |
References
- Kögel Knabner, I.; Ekschmitt, K.; Flessa, H.; Guggenberger, G.; Matzner, E.; Marschner, B.; von Lützow, M. An integrative approach of organic matter stabilization in temperate soils: Linking chemistry, physics, and biology. J. Plant Nutr. Soil Sci. 2008, 171, 5–13. [Google Scholar] [CrossRef]
- Bosatta, E.; Agren, G. Theoretical analysis of decomposition of heterogeneous substrates. Soil Biol. Biochem. 1985, 17, 601–610. [Google Scholar] [CrossRef]
- Kögel Knabner, I.; Guggenberger, G.; Kleber, M.; Kandeler, E.; Kalbitz, K.; Scheu, S.; Eusterhues, K.; Leifeld, J. Organo mineral associations in temperate soils: Integrating biology, mineralogy, and organic matter chemistry. J. Plant Nutr. Soil Sci. 2008, 171, 61–82. [Google Scholar] [CrossRef]
- Krull, E.S.; Baldock, J.A.; Skjemstad, J.O. Importance of mechanisms and processes of the stabilisation of soil organic matter for modelling carbon turnover. Funct. Plant Biol. 2003, 30, 207–222. [Google Scholar] [CrossRef]
- Mikutta, R.; Kleber, M.; Torn, M.S.; Jahn, R. Stabilization of soil organic matter: Association with minerals or chemical recalcitrance? Biogeochemistry 2006, 77, 25–56. [Google Scholar] [CrossRef]
- Marschner, B.; Brodowski, S.; Dreves, A.; Gleixner, G.; Gude, A.; Grootes, P.M.; Hamer, U.; Heim, A.; Jandl, G.; Ji, R.; et al. How relevant is recalcitrance for the stabilization of organic matter in soils? J. Plant Nutr. Soil Sci. 2008, 171, 91–110. [Google Scholar] [CrossRef]
- Dungait, J.A.J.; Hopkins, D.W.; Gregory, A.S.; Whitmore, A.P. Soil organic matter turnover is governed by accessibility not recalcitrance. Glob. Change Biol. 2012, 18, 1781–1796. [Google Scholar] [CrossRef]
- Schmidt, M.W.I.; Torn, M.S.; Abiven, S.; Dittmar, T.; Guggenberger, G.; Janssens, I.A.; Kleber, M.; Kögel-Knabner, I.; Lehmann, J.; Manning, D.A.C.; et al. Persistence of soil organic matter as an ecosystem property. Nature 2011, 478, 49–56. [Google Scholar] [CrossRef]
- Von Lützow, M.; Kögel Knabner, I.; Ekschmitt, K.; Flessa, H.; Guggenberger, G.; Matzner, E.; Marschner, B. SOM fractionation methods: Relevance to functional pools and to stabilization mechanisms. Soil Biol. Biochem. 2007, 39, 2183–2207. [Google Scholar] [CrossRef]
- Lopez-Sangil, L.; Rovira, P. Sequential chemical extractions of the mineral-associated soil organic matter: An integrated approach for the fractionation of organo-mineral complexes. Soil Biol. Biochem. 2013, 62, 57–67. [Google Scholar] [CrossRef]
- Kleber, M.; Bourg, I.C.; Coward, E.K.; Hansel, C.M.; Myneni, S.C.B.; Nunan, N. Dynamic interactions at the mineral-organic matter interface. Nat. Rev. Earth Environ. 2021, 2, 402–421. [Google Scholar] [CrossRef]
- Duchaufour, P. Pédologie, Vol. I: Pédogénèse et Classification; Masson: Paris, France, 1979. [Google Scholar]
- Stevenson, F.J. Humus Chemistry; Wiley & Sons: New York, NY, USA, 1982. [Google Scholar]
- Sollins, P.; Homann, P.; Caldwell, B.A. Stabilization and destabilization of soil organic matter: Mechanisms and controls. Geoderma 1996, 74, 65–105. [Google Scholar] [CrossRef]
- Gartzia-Bengoetxea, N.; Virto, I.; Arias-González, A.; Enrique, A.; Fernández-Ugalde, D.; Barré, P. Mineral control of organic carbon storage in acid temperate forest soils in the Basque Country. Geoderma 2020, 358, 113998. [Google Scholar] [CrossRef]
- Adhikari, D.; Sowers, T.; Stuckey, J.W.; Wang, X.; Sparks, D.L.; Yang, Y. Formation and redox reactivity of ferrihydrite-organic carbon-calcium co-precipitates. Geochim. Cosmochim. Acta 2019, 244, 86–98. [Google Scholar] [CrossRef]
- Osafo, N.O.A.; Jan, J.; Valero, A.; Porcal, P.; Petrash, D.A.; Borovec, J. Organic matter character as a critical factor determining the fate and stability of its association with iron in sediments. J. Soils Sediments 2022, 22, 1865–1875. [Google Scholar] [CrossRef]
- Gonzalez-Prieto, S.J.; Lista, M.A.; Carballas, M.; Carballas, T. Humic substances in a catena of estuarine soils: Distribution of organic nitrogen and carbon. Sci. Total Environ. 1989, 81, 363–372. [Google Scholar] [CrossRef]
- Giannetta, B.; Plaza, C.; Zaccone, C.; Vischetti, C.; Rovira, P. Ecosystem type effects on the stabilization of organic matter in soils: Combining size fractionation with sequential chemical extractions. Geoderma 2019, 353, 423–434. [Google Scholar] [CrossRef]
- IUSS Working Group WRB. World Reference Base for Soil Resources 2006; World Soil Resources Reports No. 103; FAO: Rome, Italy, 2006. [Google Scholar]
- Poch, R.M.; Boixadera, J. Sòls de la Cerdanya. Guia de Camp; Departament de Medi Ambient i Ciències del Sòl, Universitat de Lleida: Lleida, Spain, 2008. [Google Scholar]
- Poch, R.M.; Simó, I.; Boixadera, J. Itinerario por la comarca de La Cerdanya. In Itinerarios Edáficos por Cataluña: El Priorat, la Cerdanya y el Penedès; Alcañiz, J.M., Ed.; Institut Geològic de Catalunya, Dept de Territori i Sostenibilitat. Generalitat de Catalunya: Barcelona, Spain, 2011; pp. 124–158. [Google Scholar]
- Berg, B.; Laskowski, R. Litter Decomposition: A Guide to Carbon and Nutrient Turnover; Advances in Ecological Research; Elsevier: Amsterdam, The Netherlands, 2006; Volume 36. [Google Scholar] [CrossRef]
- Vance, E.D.; Brookes, P.C.; Jenkinson, D.S. An extraction method for measuring soil microbial biomass C. Soil Biol. Biochem. 1987, 19, 703–707. [Google Scholar] [CrossRef]
- Rovira, P.; Vallejo, V.R. Labile and recalcitrant pools of carbon and nitrogen in organic matter decomposing at different depths in soil: An acid hydrolysis approach. Geoderma 2002, 107, 109–141. [Google Scholar] [CrossRef]
- Rovira, P.; Vallejo, V.R. Labile, recalcitrant, and inert organic matter in mediterranean forest soils. Soil Biol. Biochem. 2007, 39, 202–215. [Google Scholar] [CrossRef]
- Dubois, M.; Giles, K.A.; Hamilton, J.K.; Rebers, P.A.; Smith, F. Colorimetric method for the determination of sugars and related substances. Anal. Chem. 1956, 28, 350–356. [Google Scholar] [CrossRef]
- Soon, Y.K.; Abboud, S. A comparison of some methods for soil organic carbon determination. Commun. Soil Sci. Plant. Anal. 1991, 22, 943–954. [Google Scholar] [CrossRef]
- Ribéreau-Gayon, P. Les Composés Phénoliques des Végétaux; Dunod: Paris, France, 1968. [Google Scholar]
- Mehra, O.P.; Jackson, M.L. Iron oxide removal from soils and clays by a dithionite citrate system buffered with sodium bicarbonate. Clays Clay Min. 1960, 7, 317–327. [Google Scholar] [CrossRef]
- Pansu, M.; Gautheyrou, J. Handbook of Soil Analysis: Mineralogical, Organic and Inorganic Methods; Springer: Berlin/Heidelberg, Germany, 2006. [Google Scholar]
- Fäth, J.; Kohlpainter, M.; Blum, U.; Göttlein, A.; Mellert, K.H. Assessing phosphorus nutrition of the main European tree species by simple soil extraction methods. For. Ecol. Manag. 2019, 432, 895–901. [Google Scholar] [CrossRef]
- Lindsay, W.L.; Norvell, W.A. Development of a DTPA test for zinc, iron, manganese, and copper. Soil Sci. Soc. Am. J. 1978, 42, 421–428. [Google Scholar] [CrossRef]
- Fäth, J.; Mellert, K.; Blum, U.; Göttlein, A. Citric acid extraction—An underestimated method in forest nutrition? J. Plant Nutr. Soil Sci. 2019, 182, 691–693. [Google Scholar] [CrossRef]
- Rovira, P.; Jorba, M.; Romanyà, J. Active and passive organic matter fractions in mediterranean forest soils. Biol. Fertil. Soils 2010, 46, 355–369. [Google Scholar] [CrossRef]
- Wood, C.W.; Mitchell, R.J.; Zutter, B.R.; Lin, C.L. Loblolly pine plant community effects on soil carbon and nitrogen. Soil Sci. 1992, 154, 410–419. [Google Scholar]
- Álvarez, R.; Daniel, P.E.; Santanatoglia, O.J.; García, R. Mineralización de carbono en un suelo agrícola: Relación entre la disponibilidad del substrato y la biomasa microbiana. Agrochimica 1993, 37, 55–62. [Google Scholar]
- Cadisch, G.; Imhof, H.; Urquiaga, S.; Boddey, R.M.; Giller, K. Carbon turnover (δ13C) and nitrogen mineralization potential of particulate light soil organic matter after rainforest clearing. Soil Biol. Biochem. 1996, 28, 1555–1567. [Google Scholar] [CrossRef]
- Garcia-Pausas, J.; Casals, P.; Camarero, L.; Huguet, C.; Thompson, R.; Sebastià, M.T.; Romanyà, J. Factors regulating carbon mineralization in the surface and subsurface soils of Pyrenean Mountain grasslands. Soil Biol. Biochem. 2008, 40, 2803–2810. [Google Scholar] [CrossRef]
- Llorente, M.; Turrión, M.B. Microbiological parameters as indicators of soil organic carbon dynamics in relation to different land use management. Eur. J. For. Res. 2009, 129, 73–81. [Google Scholar] [CrossRef]
- Boutton, T.W.; Archer, S.R.; Midwood, A.J.; Zitzer, S.F.; Bol, R. d13C values of soil organic carbon and their use in documenting vegetation change in a subtropical savanna ecosystem. Geoderma 1998, 82, 5–41. [Google Scholar] [CrossRef]
- Rasmussen, C.; Heckman, K.; Wieder, W.R.; Keiluweit, M.; Lawrence, C.R.; Berhe, A.A.; Blankinship, J.C.; Crow, S.E.; Druhan, J.L.; Hicks Pies, C.E.; et al. Beyond clay: Towards an improved set of variables for predicting soil organic matter content. Biogeochemistry 2018, 137, 297–306. [Google Scholar] [CrossRef]
- Wiesmeier, M.; Urbanski, L.; Hobley, E.; Lang, B.; von Lützow, M.; Marin-Spiotta, E.; van Wesemael, B.; Rabot, E.; Liess, M.; Garcia-Franco, N.; et al. Soil organic carbon storage as a key function of soils—A review of drivers and indicators at various scales. Geoderma 2019, 333, 149–162. [Google Scholar] [CrossRef]
- Kirsten, M.; Mikutta, R.; Vogel, C.; Thompson, A.; Mueller, C.W.; Kimaro, D.N.; Bergsma, H.L.T.; Feger, K.H.; Kalbitz, K. Iron oxides and aluminous clays selectively control soil carbon storage and stability in the humid tropics. Nat. Sci. Rep. 2021, 11, 5076. [Google Scholar] [CrossRef] [PubMed]
- Von Lützow, M.; Kögel-Knabner, I.; Ekschmitt, K.; Matzner, E.; Guggenberger, G.; Marschner, B.; Flessa, H. Stabilization of organic matter in temperate soils: Mechanisms and their relevance under different soil conditions—A review. Eur. J. Soil Sci. 2006, 57, 426–445. [Google Scholar] [CrossRef]
- Spielvogel, S.; Prietzel, J.; Kögel-Knabner, I. Soil organic matter stabilization in acidic forest soils is preferential and soil-type specific. Eur. J. Soil Sci. 2008, 59, 674–692. [Google Scholar] [CrossRef]
- Giannetta, B.; Zaccone, C.; Plaza, C.; Siebecker, M.G.; Rovira, P.; Vischetti, C.; Sparks, D.L. The role of Fe(III) in soil organic matter stabilization in two size fractions having opposite features. Sci. Total Environ. 2019, 653, 667–674. [Google Scholar] [CrossRef]
- Bonde, T.A.; Christensen, B.T.; Cerri, C.C. Dynamics of soil organic matter as reflected by natural C13 abundance in particle size fractions of forested and cultivated oxisols. Soil Biol. Biochem. 1992, 24, 275–277. [Google Scholar] [CrossRef]
- Skjemstad, J.; Catchpoole, V.R.; Le Feuvre, R.P. Carbon dynamics in vertisols under several crops as assessed by natural abundance 13C. Aust. J. Soil Res. 1994, 32, 311–321. [Google Scholar] [CrossRef]
- Balesdent, J. The significance of organic separates to carbon dynamics and its modelling in some cultivated soils. Eur. J. Soil Sci. 1996, 47, 485–493. [Google Scholar] [CrossRef]
- Koutika, L.S.; Dassonville, N.; Vanderhoeven, S.; Chapuis-Lardy, L.; Meerts, P. Relationships between C respiration and fine particulate organic matter (250–50 µm) weight. Eur. J. Soil Biol. 2008, 44, 18–21. [Google Scholar] [CrossRef]
- Wander, M.M.; Yun, W.; Goldstein, W.A.; Aref, S.; Khan, S.A. Organic N and particulate organic matter fractions in organic and conventional farming systems with a history of manure application. Plant Soil 2007, 291, 311–321. [Google Scholar] [CrossRef]
- Díaz-Pinés, E.; Rubio, A.; Van Miegroet, H.; Montes, F.; Benito, M. Does tree species composition control soil organic carbon pools in Mediterranean mountain forests? For. Ecol. Manag. 2011, 262, 1895–1904. [Google Scholar] [CrossRef]
- Duval, M.E.; Galantini, J.A.; Iglesias, J.O.; Canelo, S.; Martínez, J.M.; Vall, L. Analysis of organic fractions as indicators of soil quality under natural and cultivated systems. Soil Tillage Res. 2013, 131, 11–19. [Google Scholar] [CrossRef]
- Just, C.; Poeplau, C.; Don, A.; van Wesemael, B.; Kögel-Knabner, I.; Wiesmeier, M. A simple approach to isolate slow and fast cycling organic carbon fractions in Central European soils—Importance of dispersion method. Front. Soil Sci. 2021, 1, 692583. [Google Scholar] [CrossRef]
- Oades, J.M.; Kirkman, M.A.; Wagner, G.H. The use of gas-liquid chromatography for the determination of sugars extracted from soils with sulfuric acid. Soil Sci. Soc. Am. Proc. 1970, 34, 230–235. [Google Scholar] [CrossRef]
- Wardle, D.A. A comparative assessment of factors which influence microbial biomass carbon and nitrogen levels in soil. Biol. Rev. 1992, 67, 321–358. [Google Scholar] [CrossRef]
- Rumpel, C.; Kögel-Knabner, I. Microbial use of lignite compared to recent plant litter as substrates in reclaimed coal mine soils. Soil Biol. Biochem. 2004, 36, 67–75. [Google Scholar] [CrossRef]
- Namour, P.; Müller, M.C. Fractionation of organic matter from wastewater treatment plants before and after a 21-day biodegradability test: A physical-chemical method for measurement of the refractory part of effluents. Water Res. 1998, 32, 2224–2231. [Google Scholar] [CrossRef]
- Soil Survey Staff. Keys to Soil Taxonomy, 11th ed.; USDA-NRCS: Washington, DC, USA, 2010.
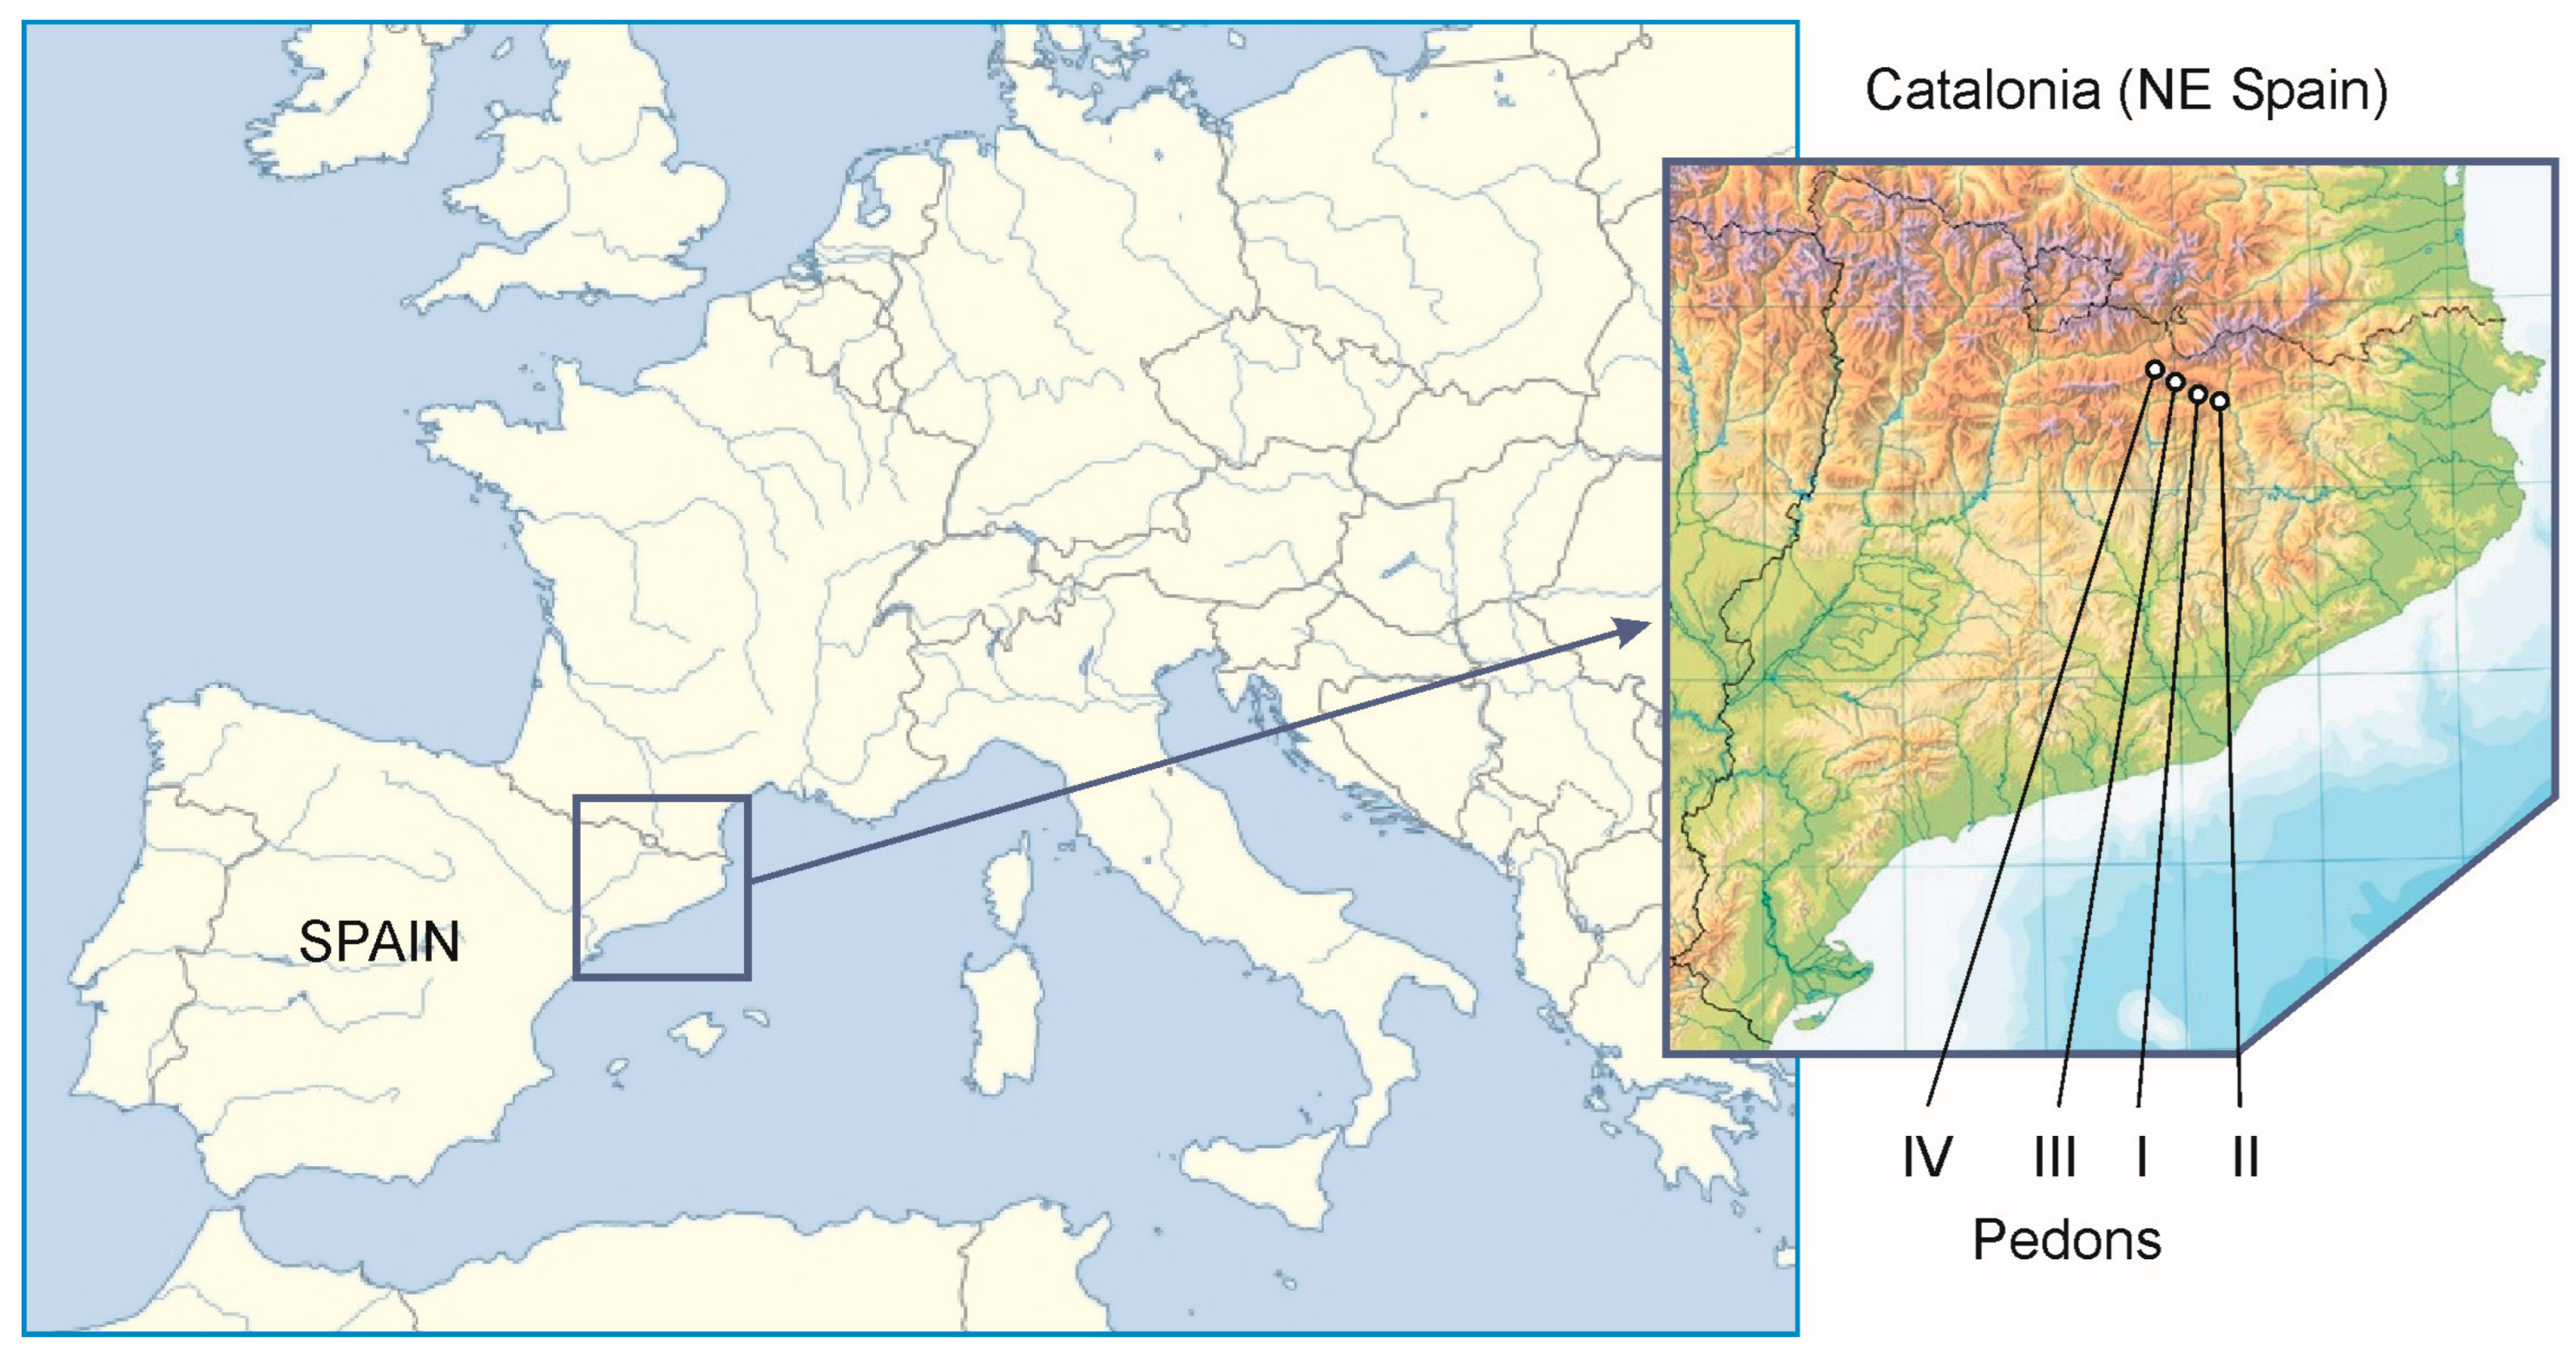
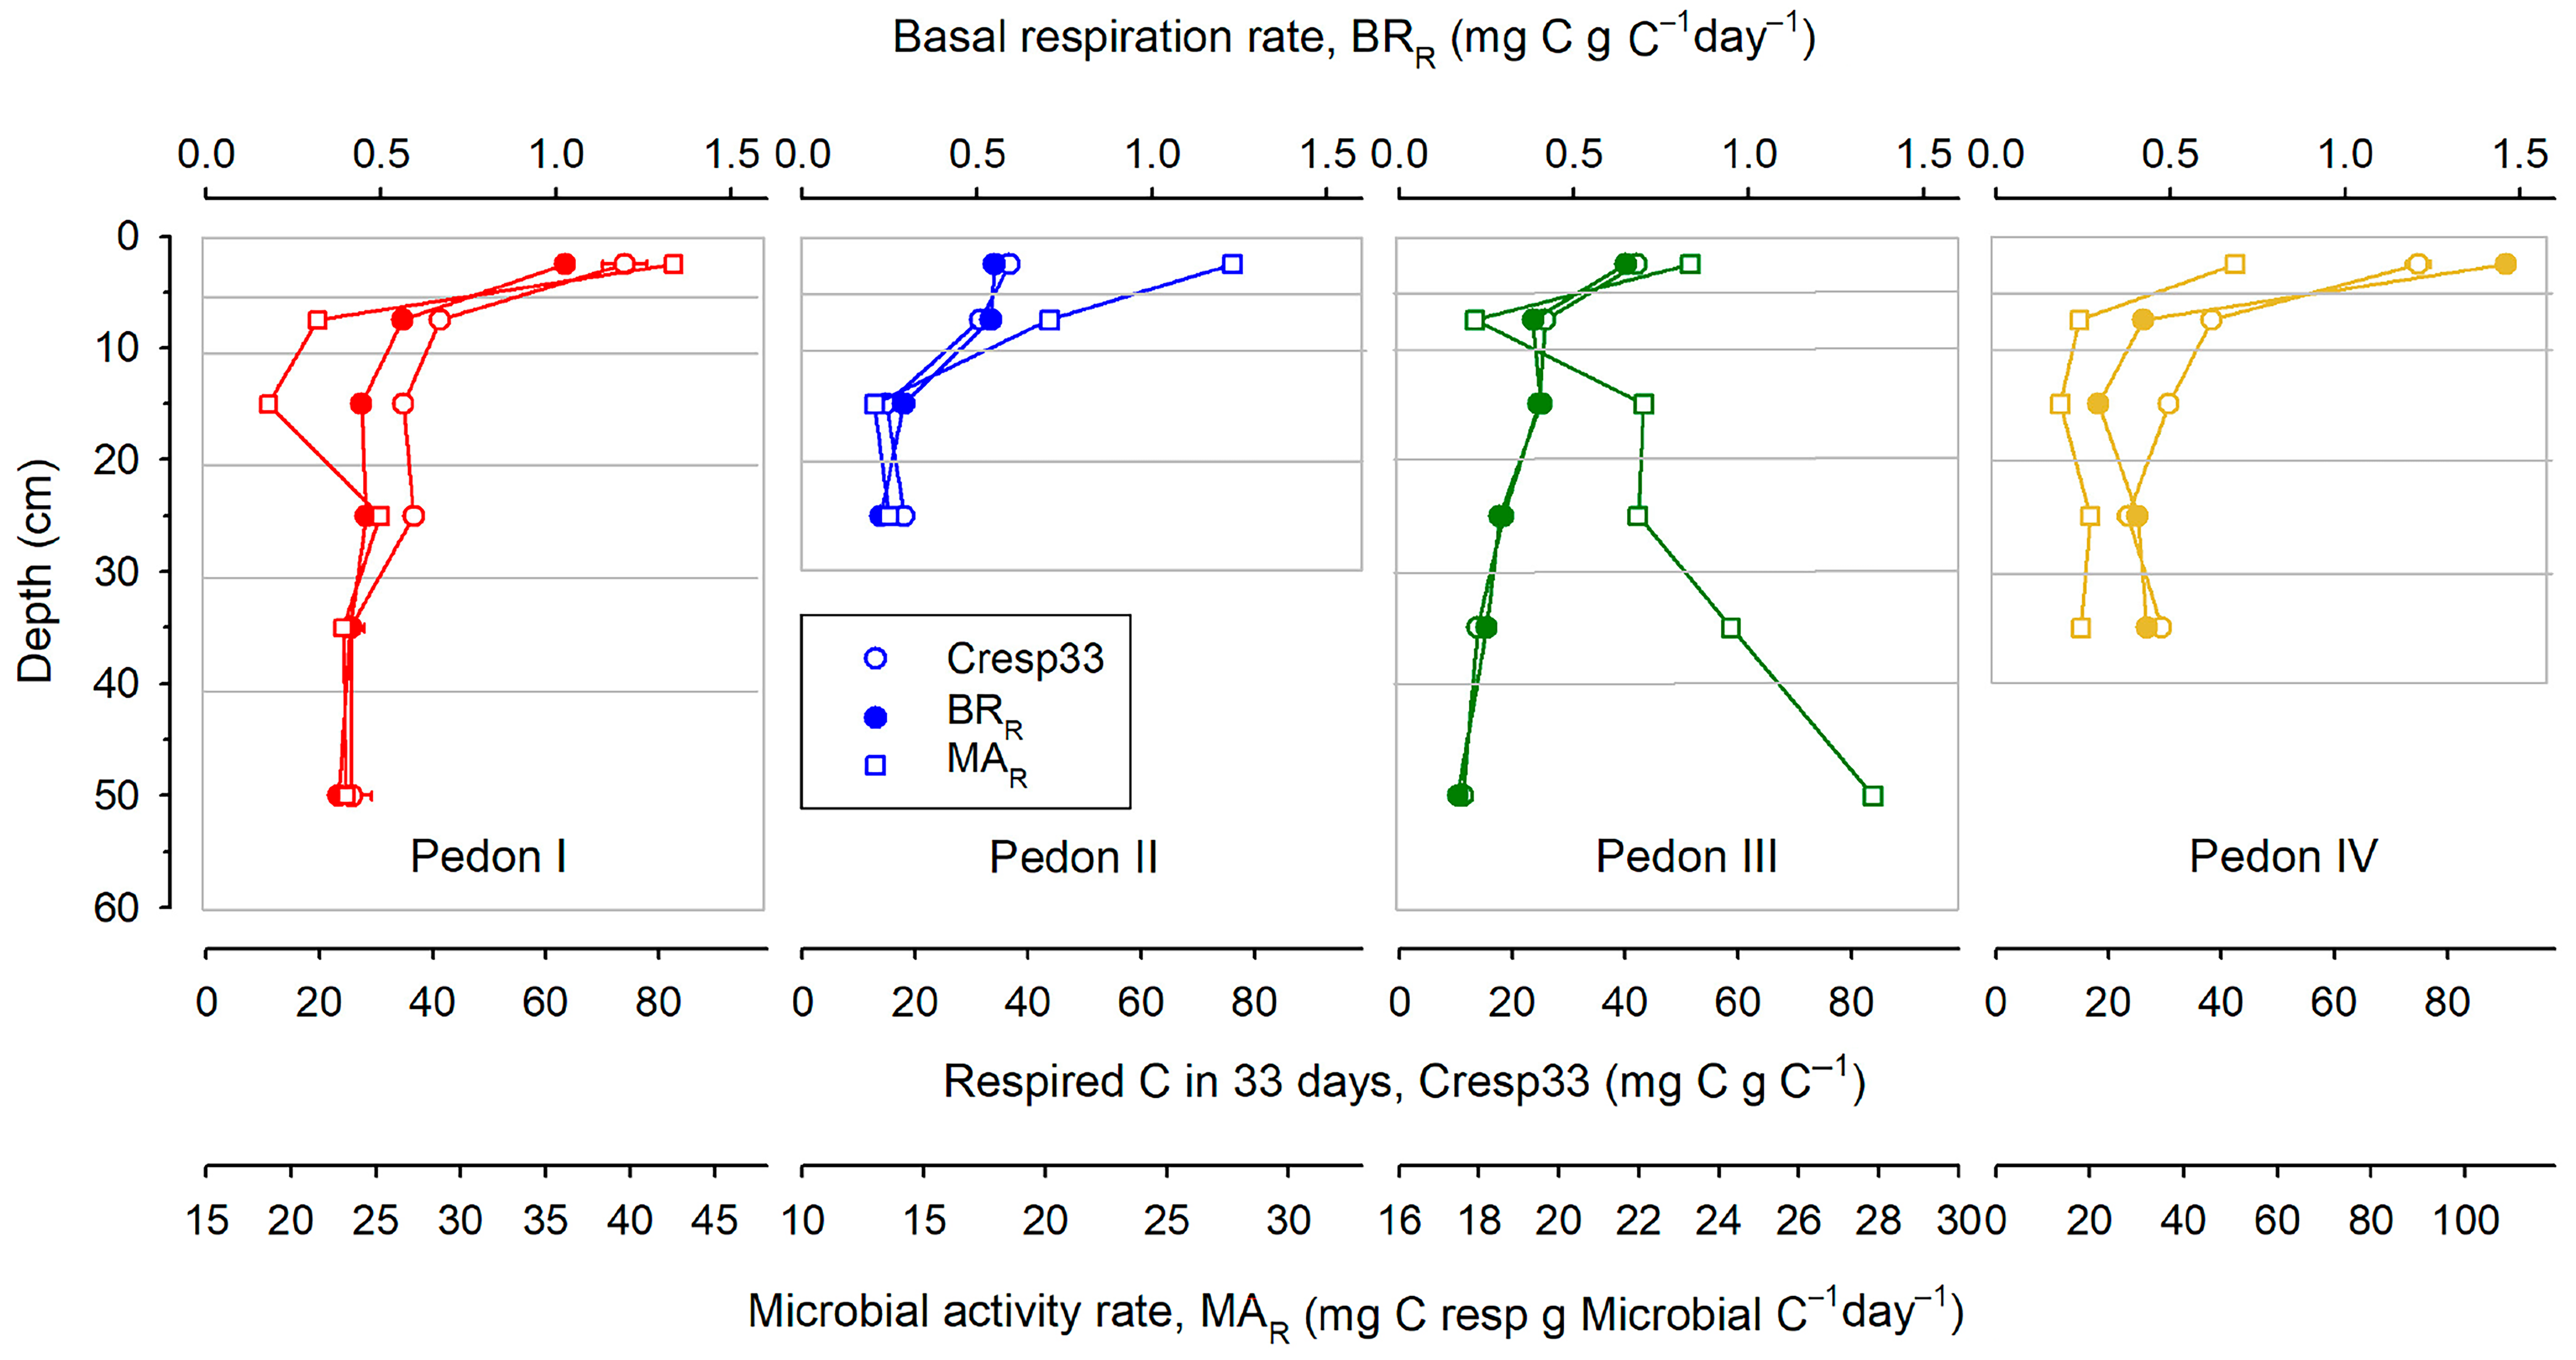
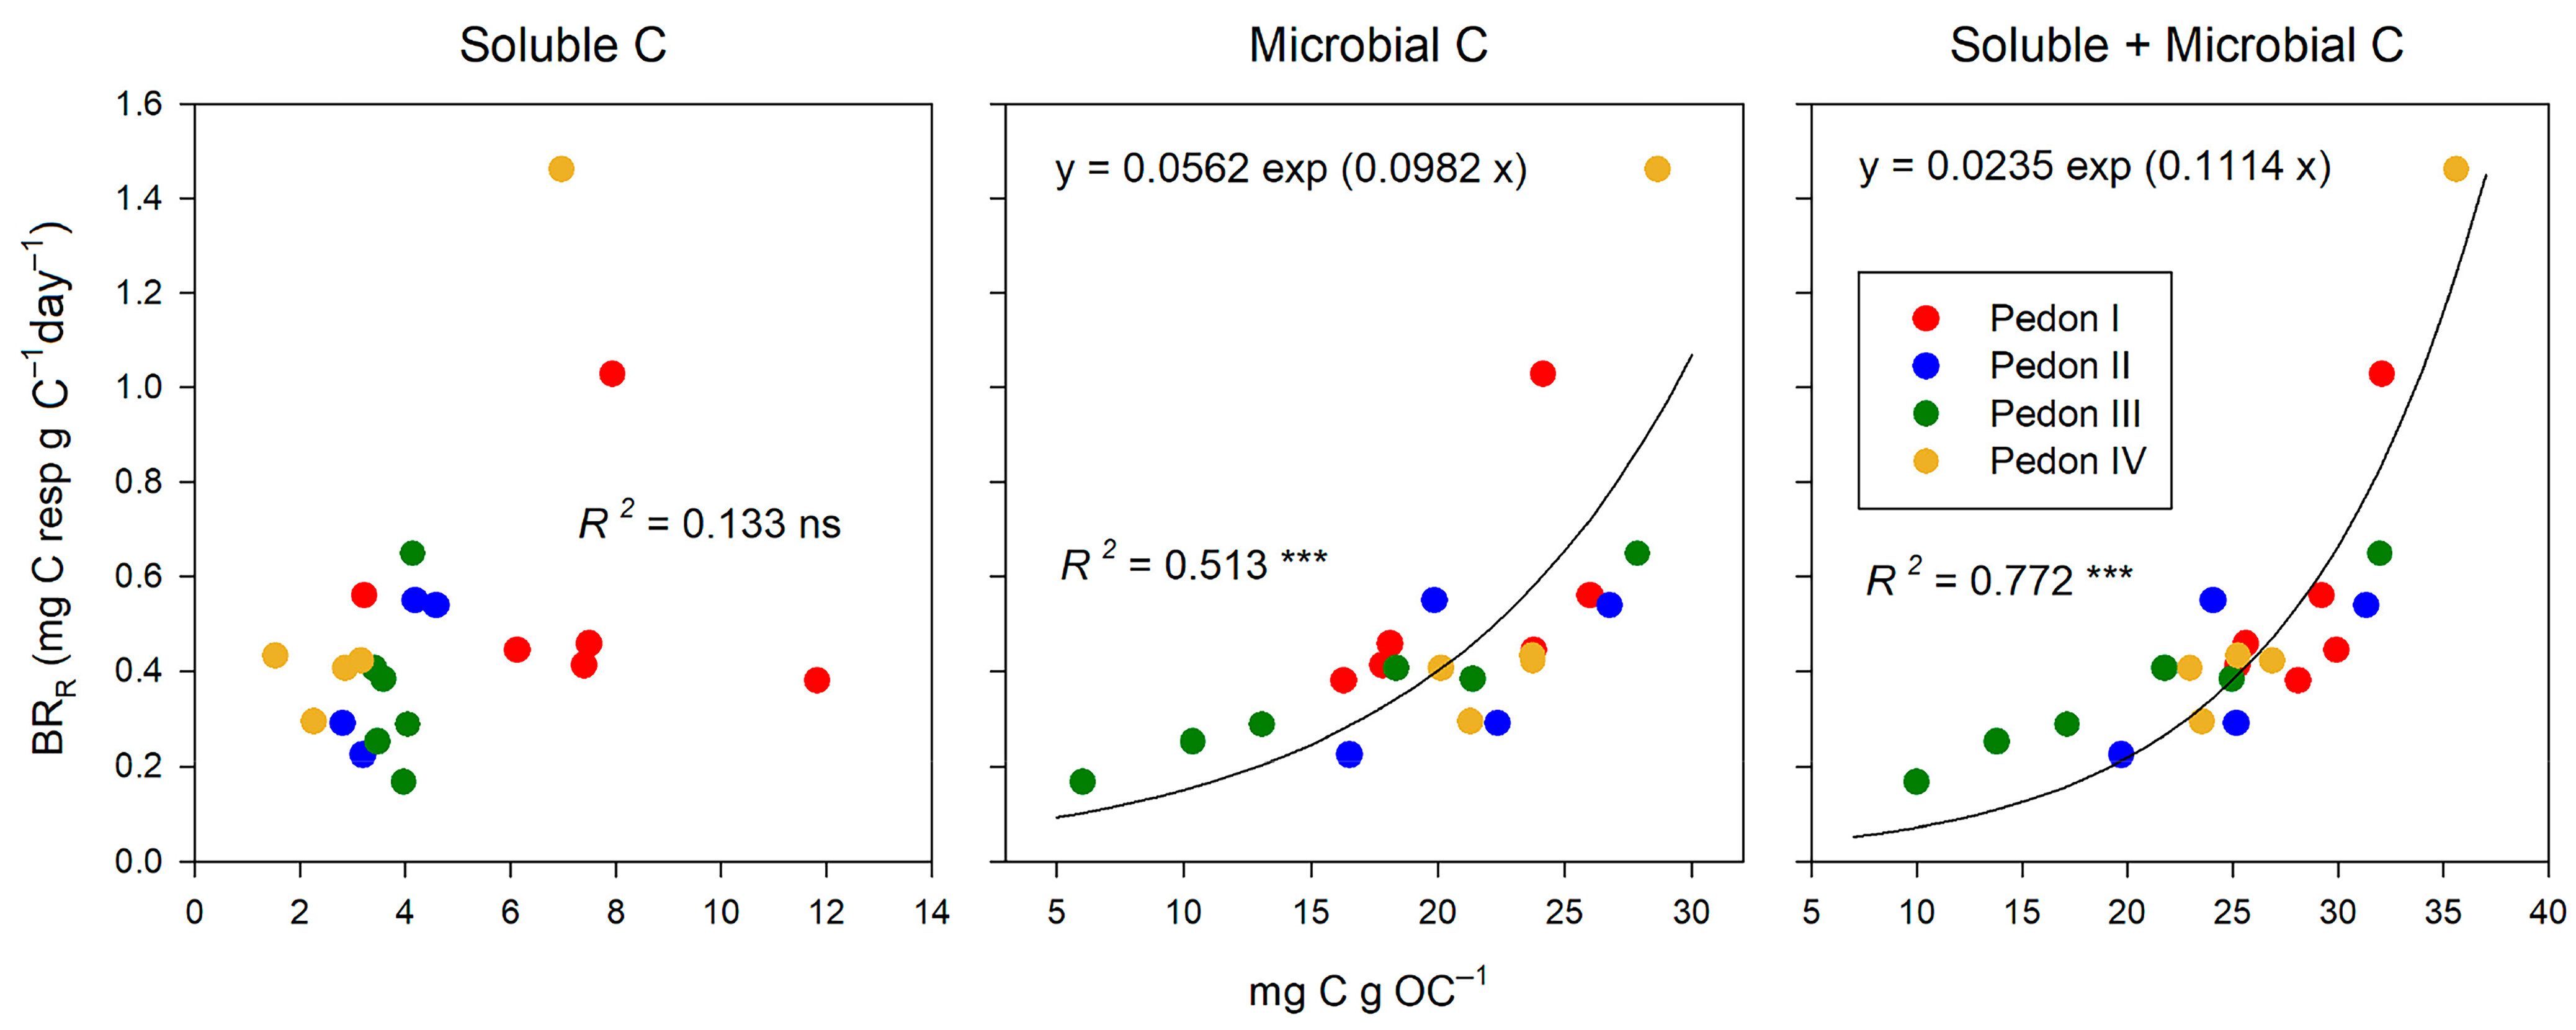

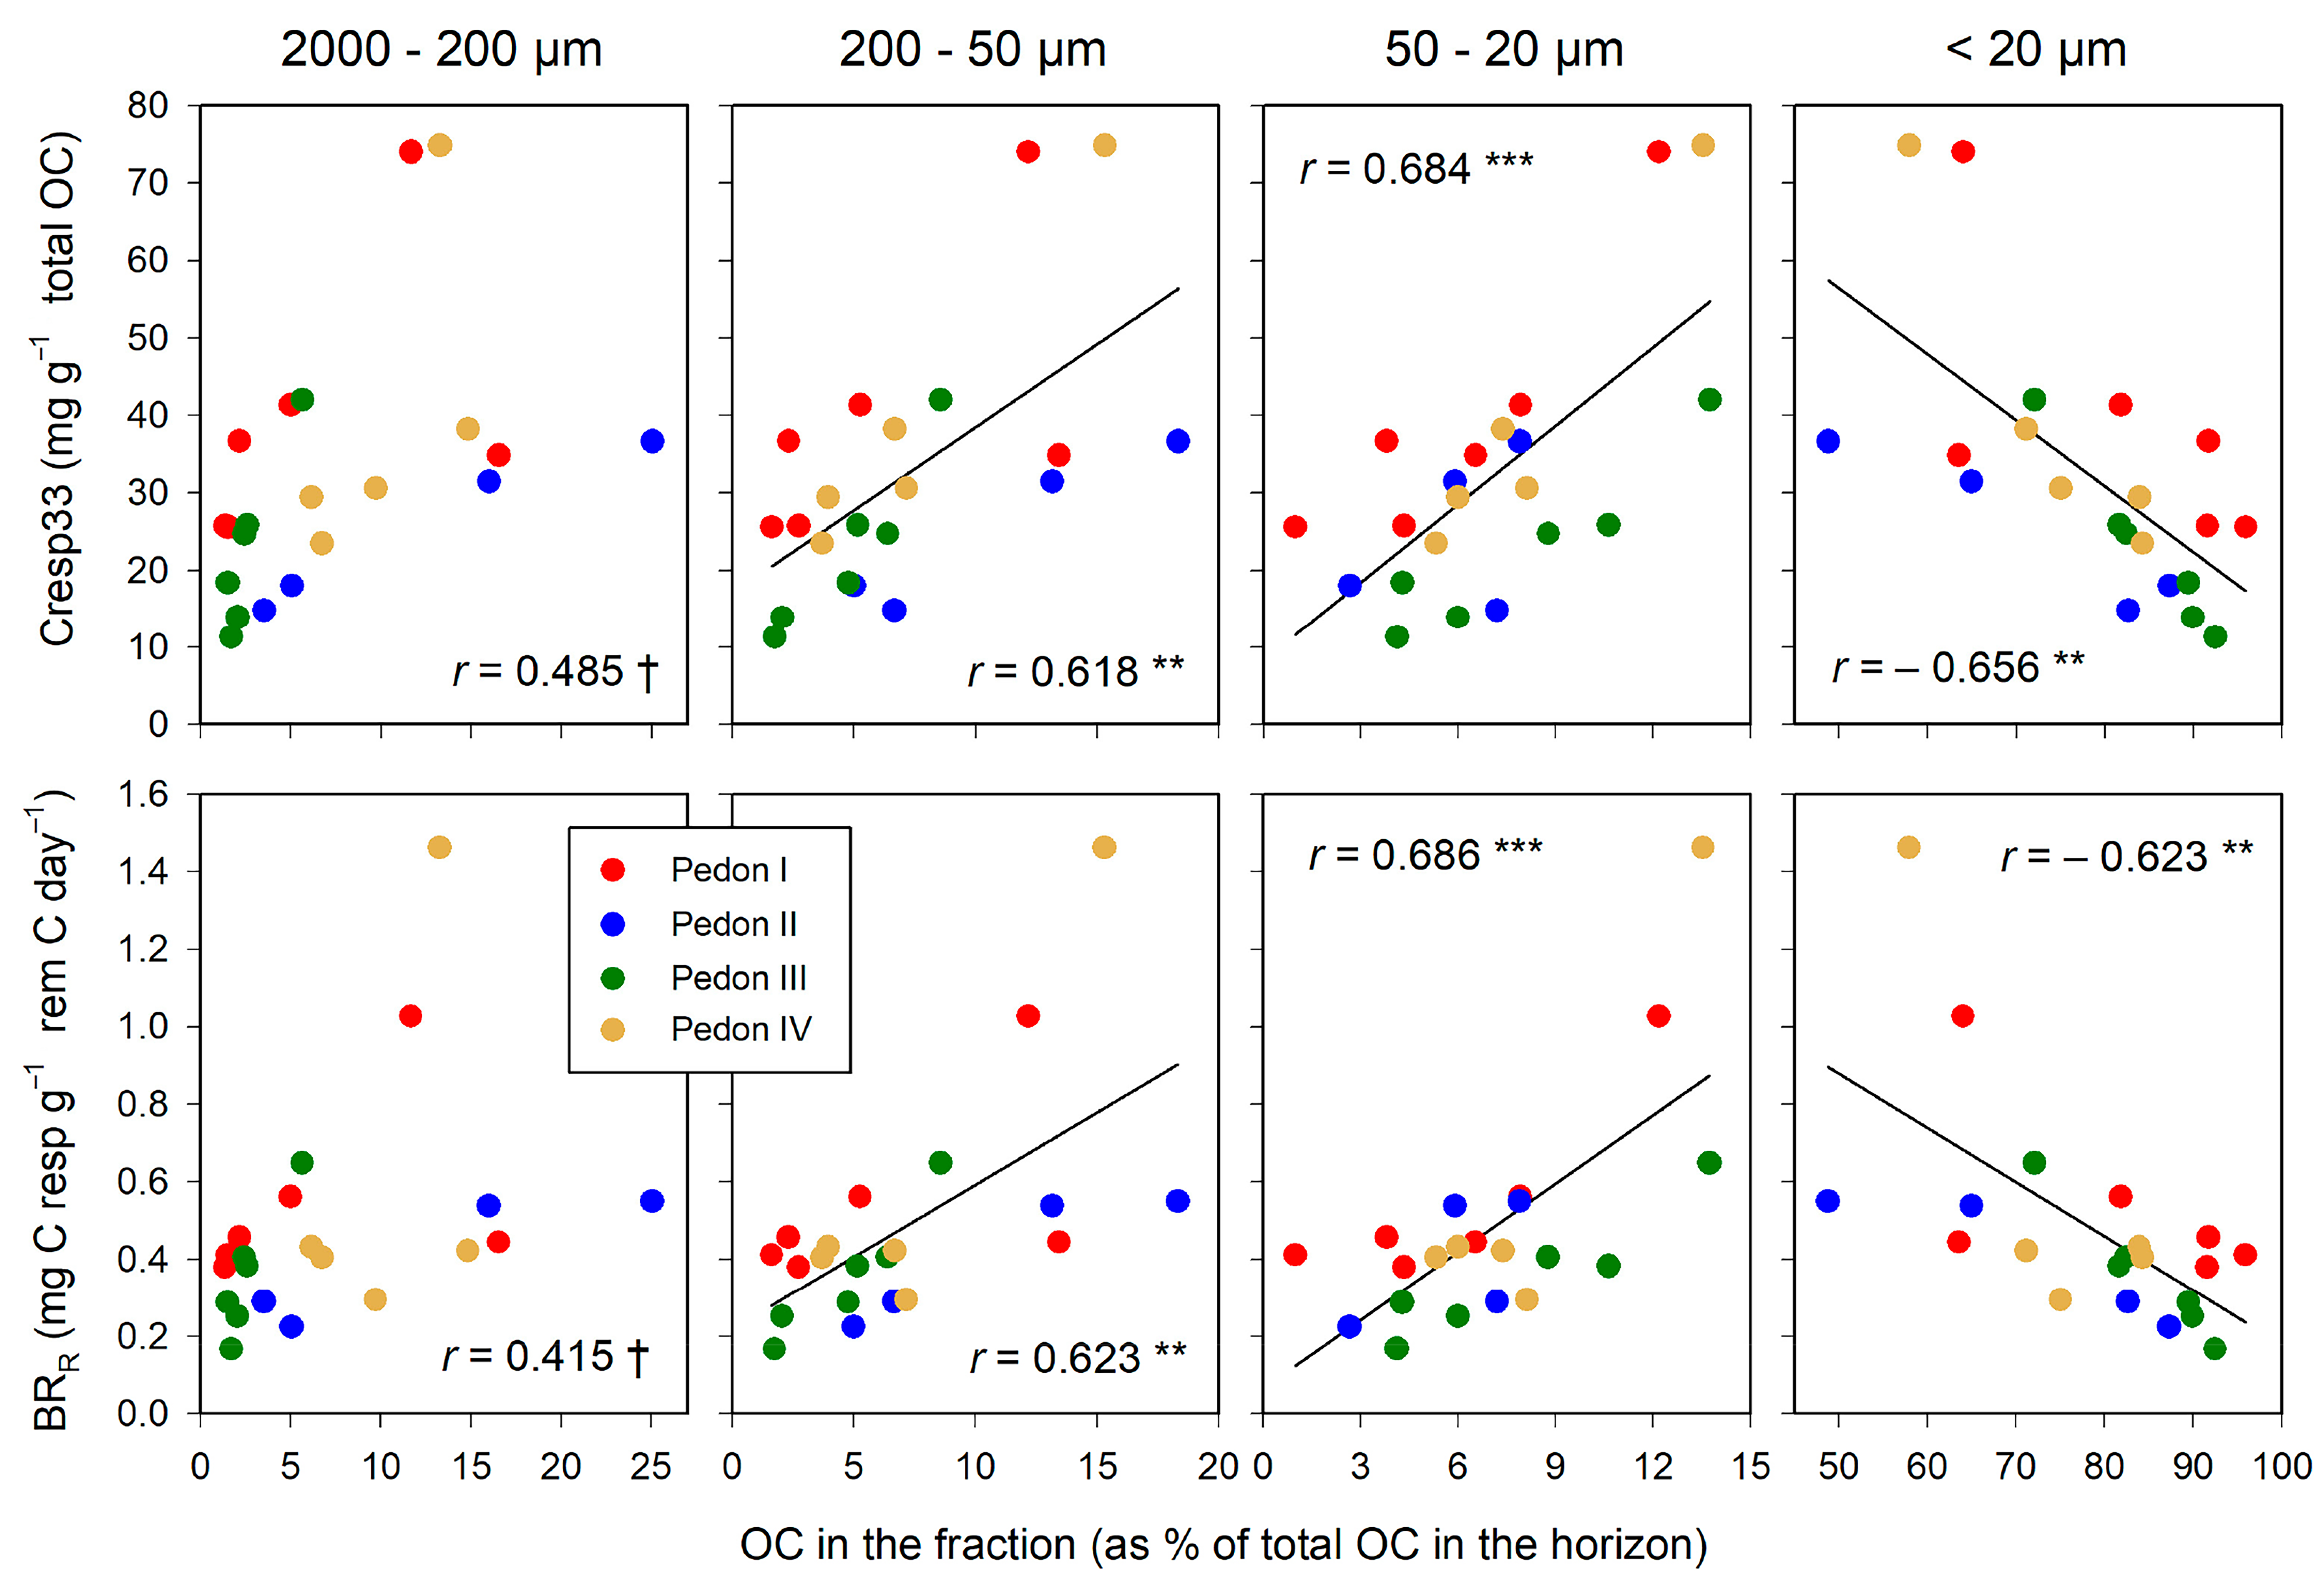
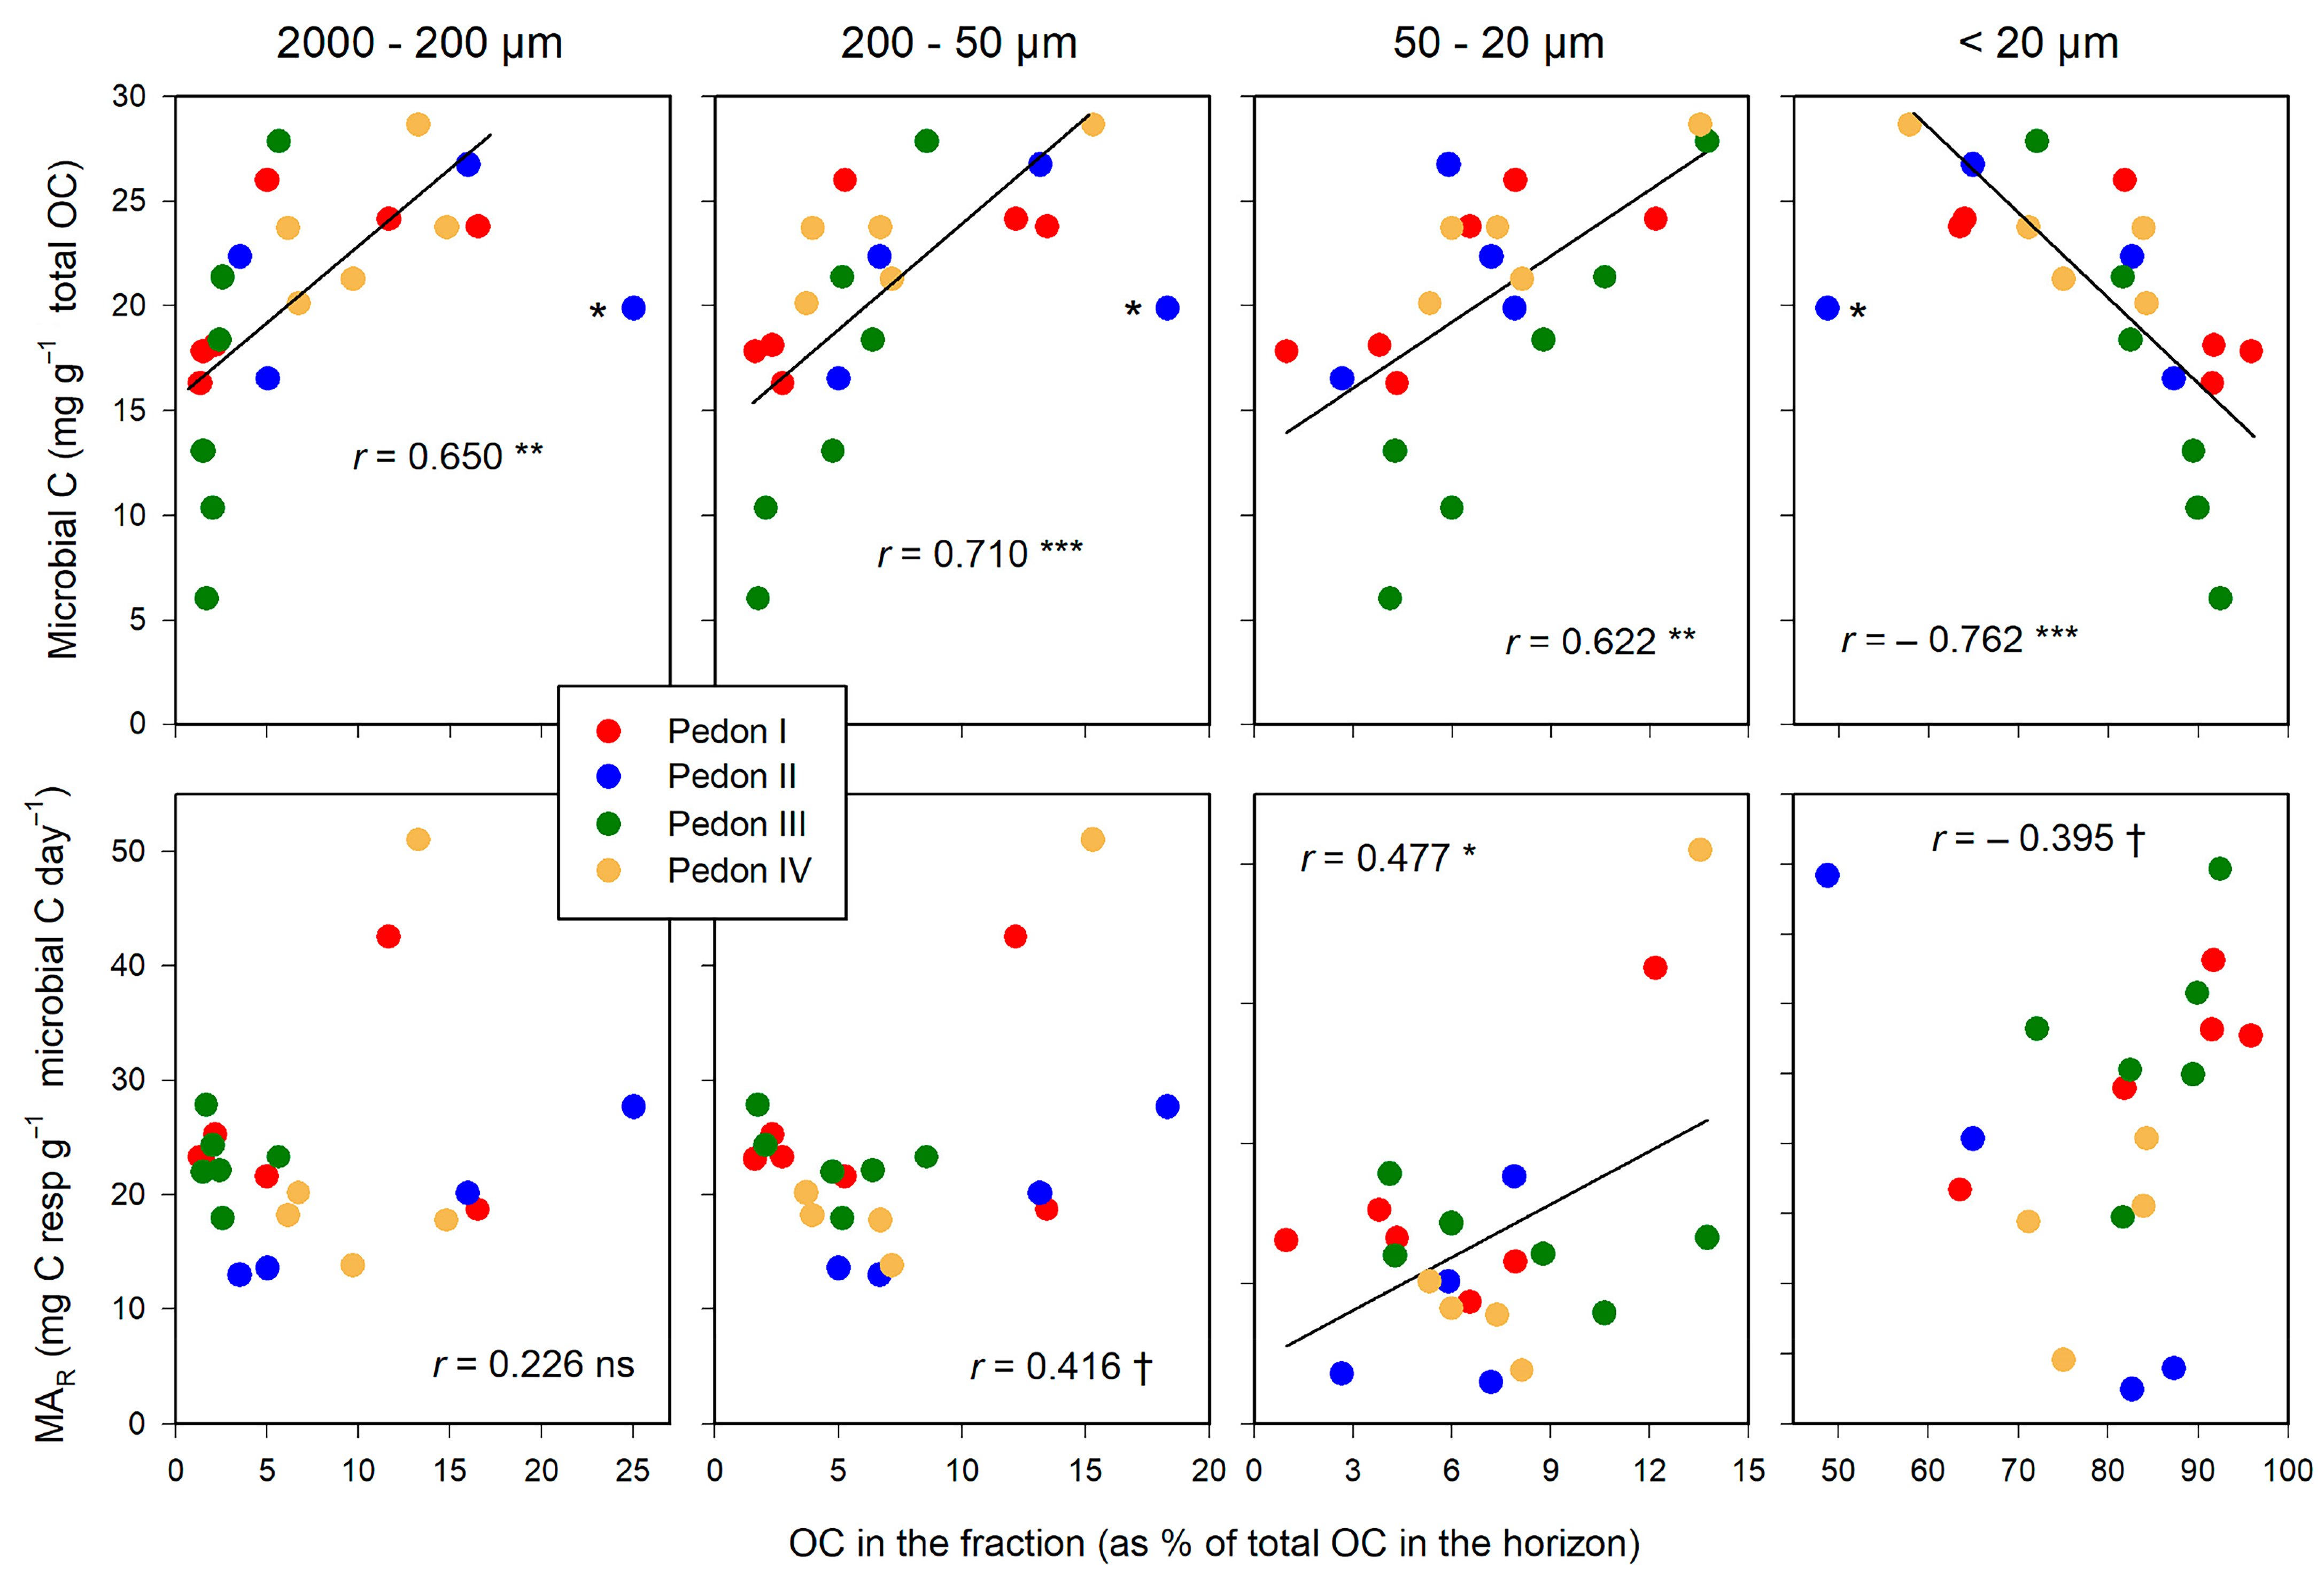
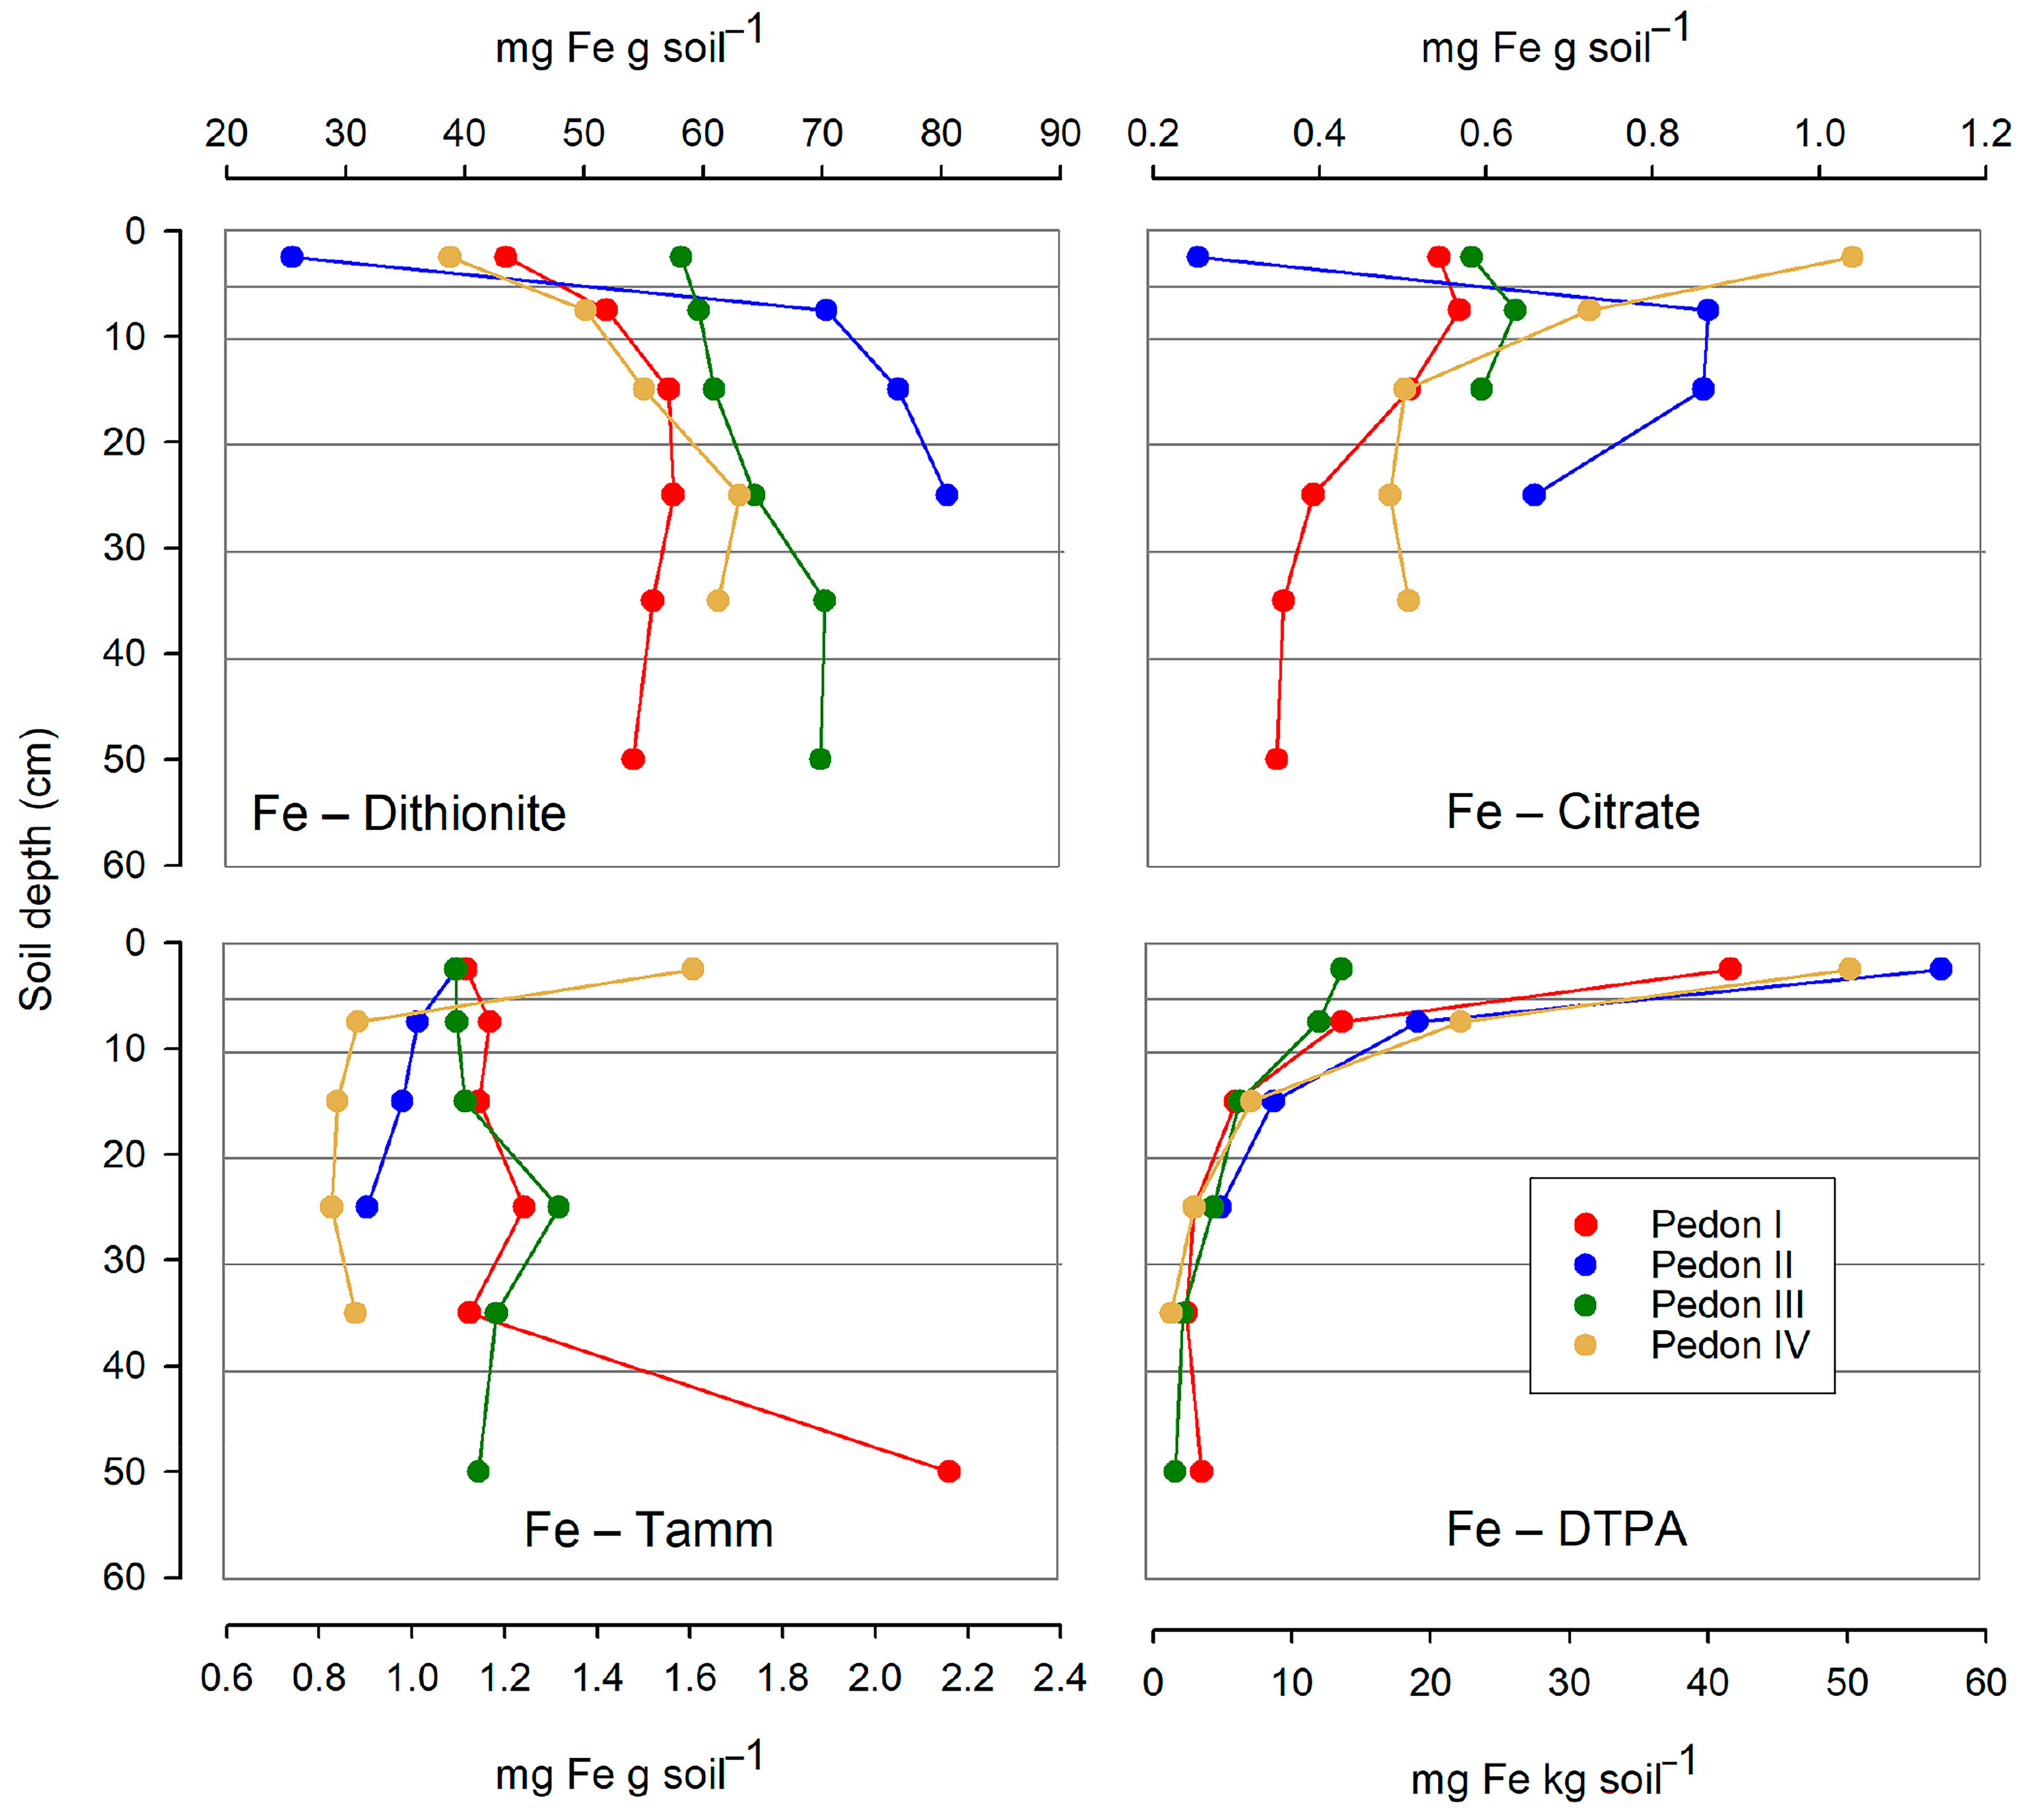
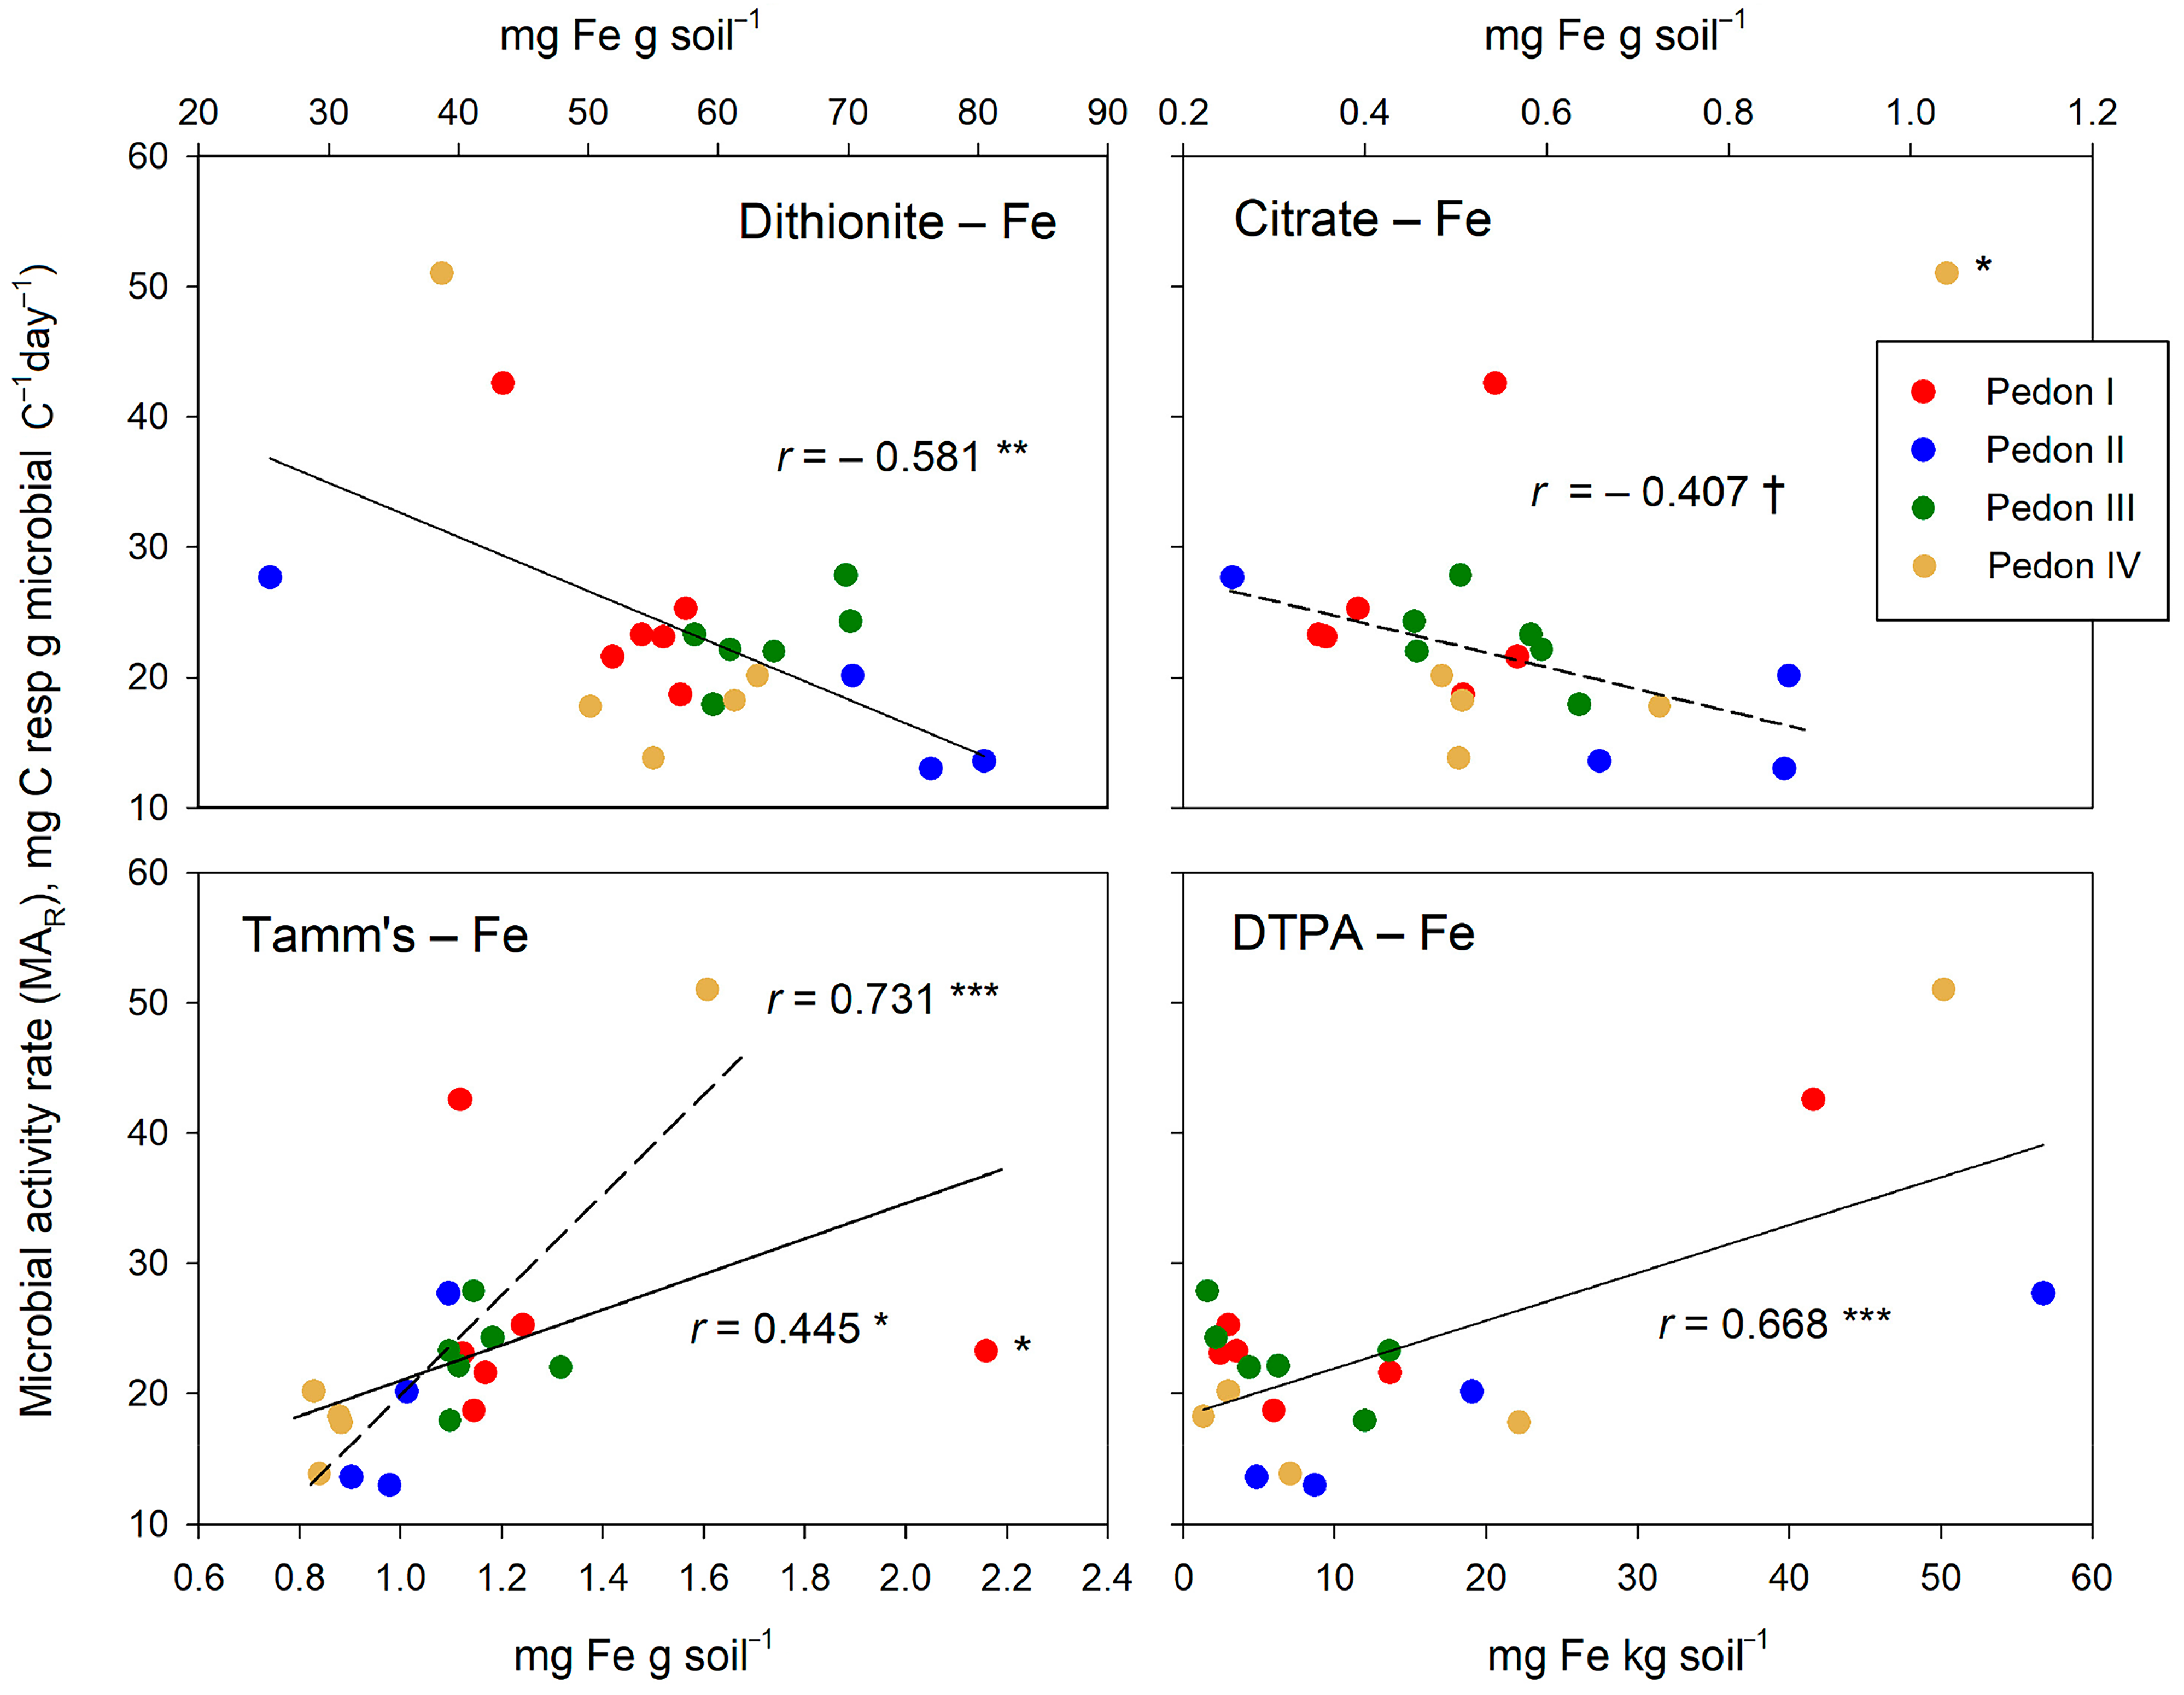
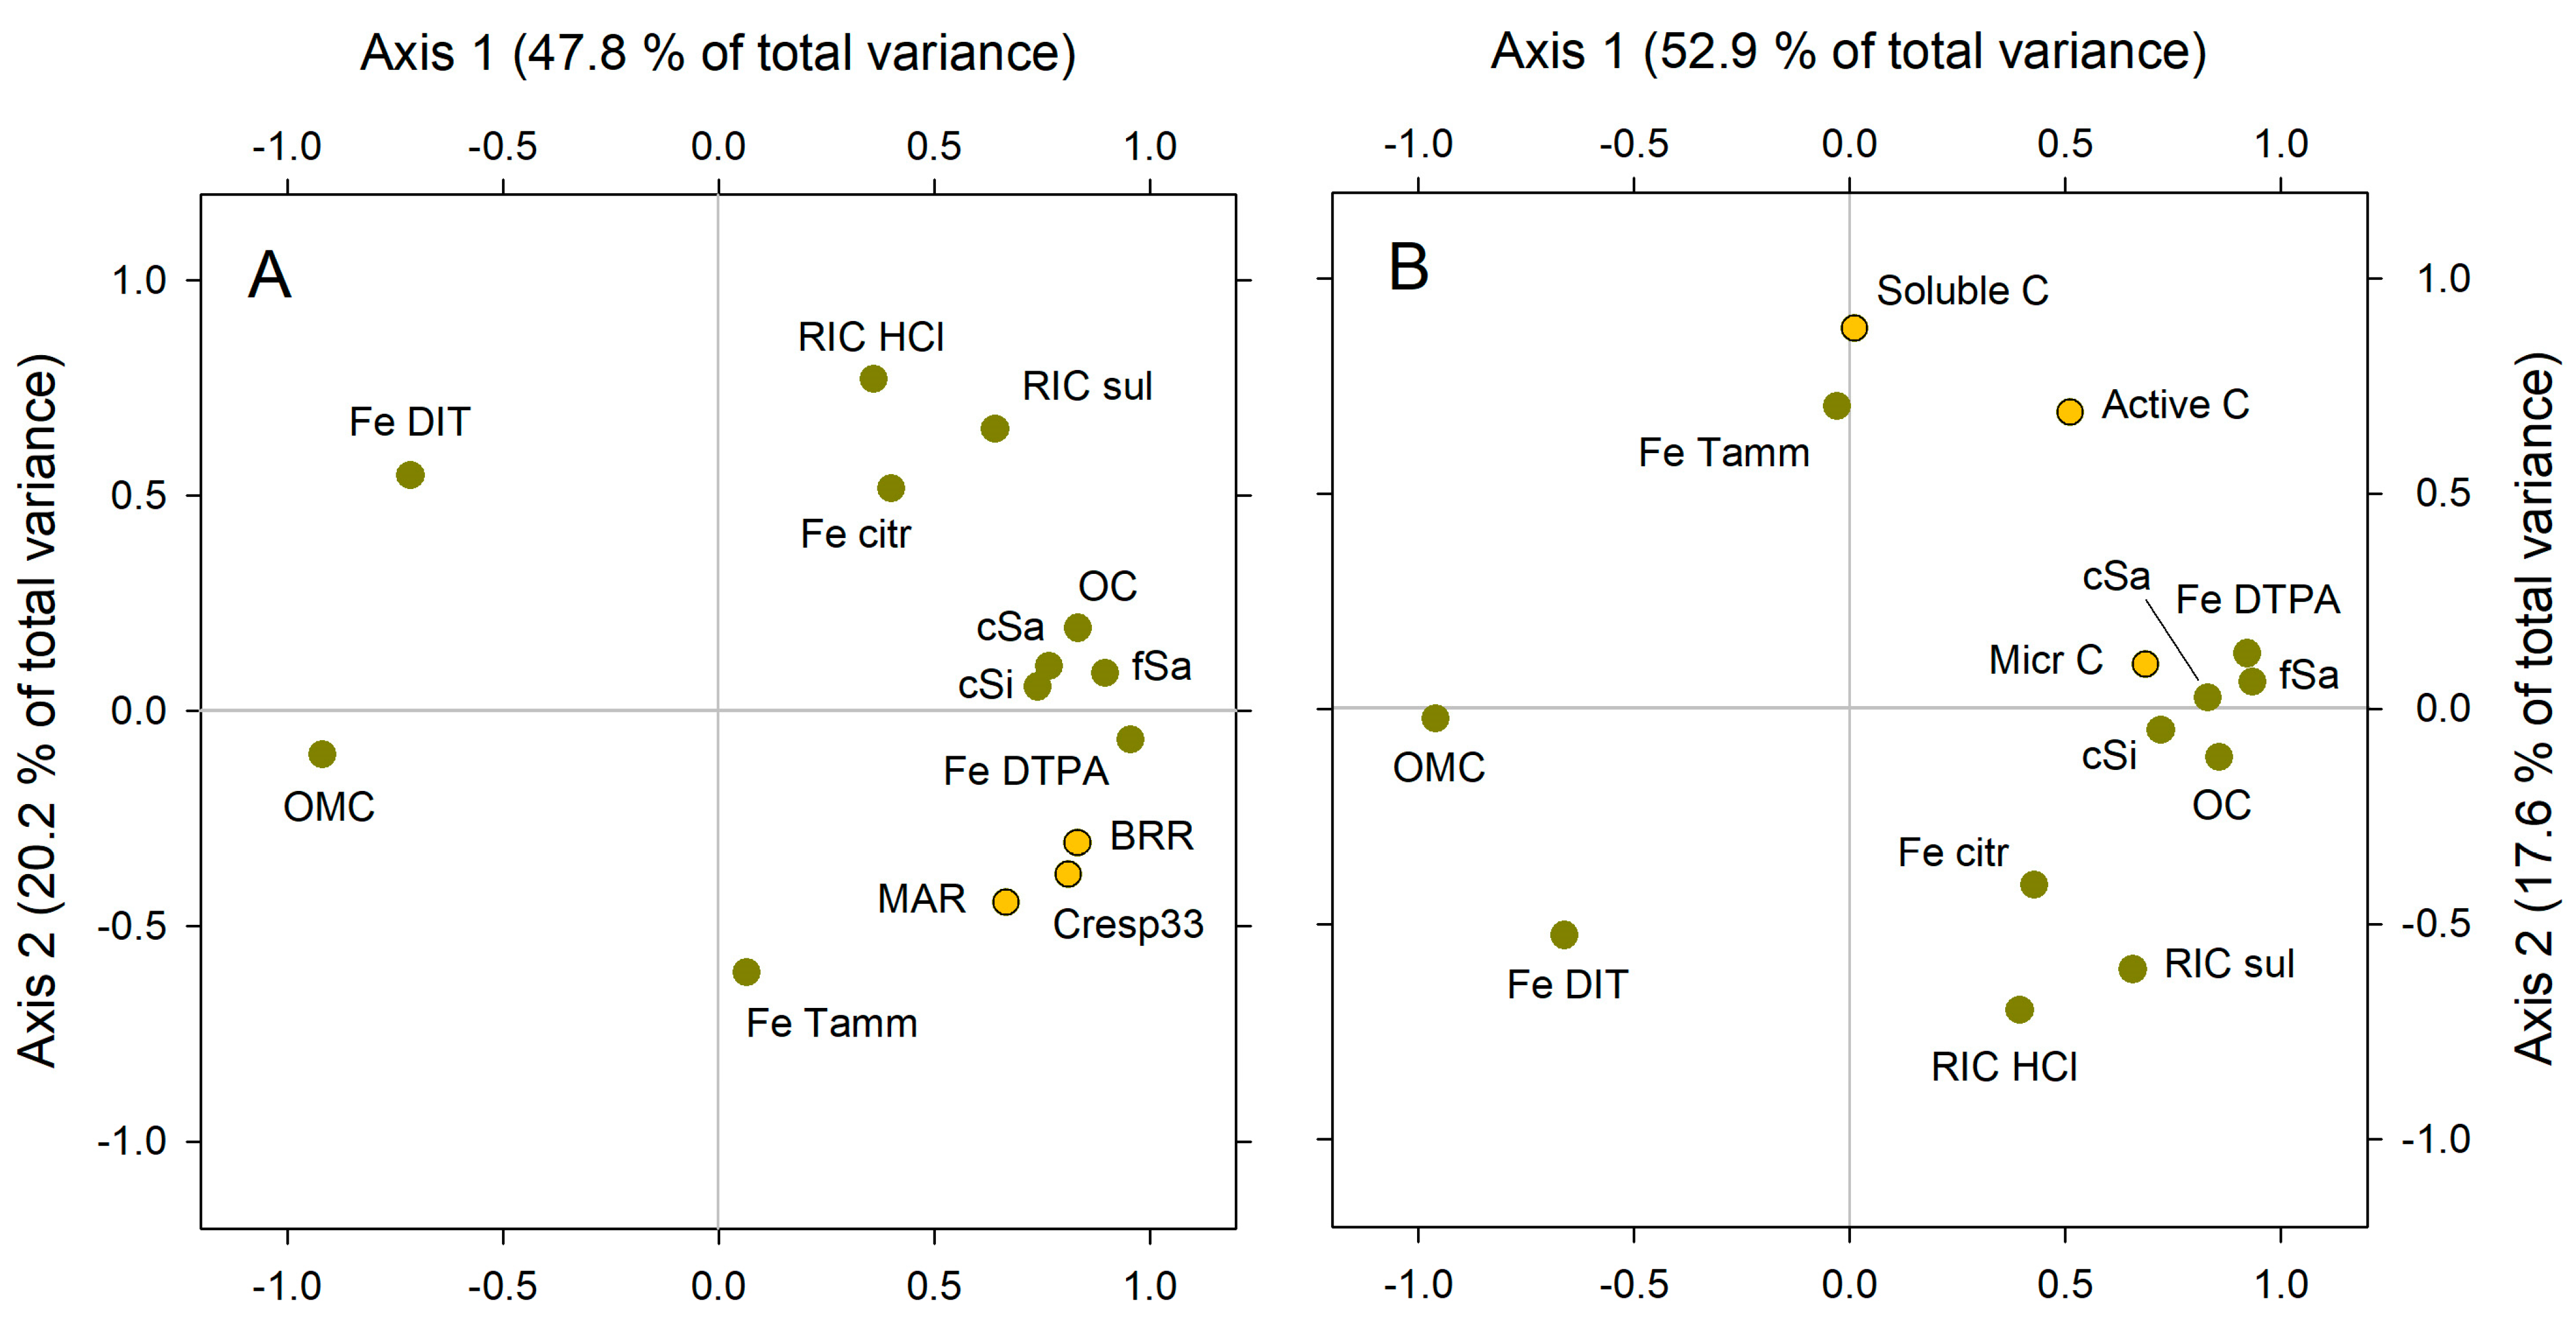
Disclaimer/Publisher’s Note: The statements, opinions and data contained in all publications are solely those of the individual author(s) and contributor(s) and not of MDPI and/or the editor(s). MDPI and/or the editor(s) disclaim responsibility for any injury to people or property resulting from any ideas, methods, instructions or products referred to in the content. |
© 2024 by the authors. Licensee MDPI, Basel, Switzerland. This article is an open access article distributed under the terms and conditions of the Creative Commons Attribution (CC BY) license (https://creativecommons.org/licenses/by/4.0/).