Abstract
A study was conducted to determine if the odor profile of Bos taurus manure could be altered by the addition of the simple saccharides glucose, lactose, and sucrose. Sucrose was added to manure slurry at 0, 12.5, 25, 50, or 125 g L−1, while glucose and lactose were added at 0, 6.45, 13.2, 26.4, or 65.8 g L−1. One hundred mL slurries were incubated in capped bottles at 30 °C for four weeks. Biogas production was measured throughout the incubations, and the pH and concentrations of short-chain fatty acids were measured at the end of the incubations. Odor compounds of the final manure slurries were isolated by stir bar sorptive extraction and identified by stir bar gas chromatography/mass spectroscopy. Unamended manure had high concentrations of the typical manure malodorants phenol, p-cresol, p-ethylphenol, indole, and skatole. The addition of the sugars decreased these malodors in a dose-dependent manner. The addition of sugars shifted odor production to aliphatic esters including ethyl butyrate and propyl propanoate. The sugar-amended manure therefore had a different odor profile than the unamended manure did. The addition of sugar also caused the accumulation of short-chain fatty acids and, thus, decreased the pH of the manure. The production of lactic acid was particularly enhanced at high concentrations of sugar, suggesting that lactic acid bacteria could be responsible for changes in the odor profile. Future research will investigate if the addition of lesser concentrations of sugars or agricultural and food wastes rich in carbohydrates can reduce manure malodor.
1. Introduction
Malodors from animal rearing facilities, animal manure storage facilities, anaerobic digesters, and manure composting facilities are nuisances and are perceived as a health hazard either directly or by their conversion to reactive species in the atmosphere, which contribute to smog formation [1,2]. As such, there have been numerous studies devoted to mitigating these odorants, as defined by Hudson [3], in order to reduce the presence of compounds responsible for malodors; most often, these studies involve engineering controls such as covered storage [4], housing exhaust filters [5], anaerobic digestion [6], or the use of influent pretreatments such as solid–liquid separation coupled with nitrification/denitrification prior to discharge to a lagoon [7].
The odorants considered most characteristic of manure malodor are the aromatic compounds para-cresol, para-ethylphenol, indole, and skatole [8,9]. Skatole, to date, has been found to be produced by only two phylogenetically unrelated genera. The best characterized of these are Clostridia, belonging to the order Eubacteriales, in the phylum Bacillota [10]. It has also been shown to be produced by Olsenella scatolienes, belonging to the order Coriobacteriales in the phylum Actinomyceota [11].
As an alternative to engineering controls for controlling malodors, the use of additives to alter the microbial environment has been investigated. This would ideally result in an environment that is less conducive to the growth of malodorant-producing bacteria or, conversely, considered to foster the growth of competing bacterial populations that do not produce malodorants. Varel and Miller, for instance, found that the addition of the monoterpenoids carvacrol and thymol inhibited the production of short-chain fatty acids (SCFAs) in cattle and swine manure [12] and later found that thymol and the volatile phenylpropanoid eugenol, added at a concentration of 0.2%, inhibited gas production and volatile fatty acid production. Eugenol did not inhibit lactate production as thymol did, however [13].
Diets high in sugar have been shown to alter the mammalian gut microbiome. For instance, adolescent female rats (Rattus norvegicus domestica) fed a high-sucrose diet exhibited increases in the proportion of five species belonging to the families Lachnospiraceae and Ruminococcaceae in the order Clostridiales [14]. In weaned male rats, high-sugar diets increased the proportions of Actinomyceota and Fibrobacterota compared to rats on a standard diet [15]. Thus, it has been demonstrated that fermentable carbohydrates are able to affect the gut microbiota.
Incorporating fermentable carbohydrates into livestock diets with the aim of modifying the odor profile of manure has also been carried out. For instance, Farnworth et al. added Jerusalem artichoke (Helianthus tuberosus) tubers to weanling pig diets, which increased the concentrations of SCFAs in the manure but seemed to reduce the skatole concentration, and the manure was described as having a sweeter, less pungent odor [16]. From this description, it is likely that the microbiome of the pigs was shifted from populations responsible for skatole production to those producing more pleasant-smelling compounds such as aliphatic esters.
Almost 400 years ago, John Gerard’s 1633 edition of The Herbal or General History of Plants described the Jerusalem artichoke using the following statement: “But in my judgement, which way soever they be drest and eaten they stirre and cause a filthie loathsome stinking winde within the bodie, thereby causing the belly to bee pained and tormented, and are a meat more fit for swine then men...”. [17]. Although sounding farcical to modern ears, this indicates a lack of enzymes for the degradation of fructans by the animal, which are the major polysaccharide of H. tuberosus, coupled with the utilization of fructans by gut microbiota competent to catabolize fructans, hence indicating a shift in the gut microbiota. Fructans, or inulins, are fructose polymers with β-2,1- or β-2,6-linkages, and they often possess a sucrose unit at one terminus [18]. They are considered prebiotics, promoting the growth of beneficial bacteria in the large intestine [19].
Salazar et al. showed that incorporating fructan supplementation into the diet of obese women over a three-month period decreased SCFAs in the intestine and increased the proportions of several Bifidobacterium species [20]. Members of this Actinomyceota genus are anaerobes and known fermenters of oligosaccharides such as lactose [21], and they are frequently considered to be probiotics and, therefore, beneficial for the treatment of conditions such as inflammatory bowel disease. Probiotics act by increasing the abundance of ‘good’ bacteria in the intestinal tract [22,23] and promoting a shift in monogastric animals from proteolytic activity that produces toxic and malodorous metabolites such as ammonia, phenols, indoles, and sulfides to SCFAs, which are considered beneficial to the host animal [22,24].
Since it seems more efficient to use fermentable carbohydrates for modifying manure malodor directly rather than using it as a feed additive, we conducted this study to test whether three simple fermentable sugars, glucose, sucrose, and lactose, could modify the odor profile of cow manure. The ability to hydrolyze simple disaccharides and then ferment the liberated monosaccharides presumably varies widely within bacteria, meaning their addition to manure cultures should profoundly affect the microbial population and relative proportions of phyla. Sucrases, or invertases, for instance, although common, are not of general occurrence. Genera in which at least some species are known to possess sucrase include Arthrobacter, Bacillus, Bifidobacterium, Brevibacterium, Lactobacillus, Streptomyces, and Thermotoga. Some of these sucrases are also capable of hydrolyzing fructans [25]. In control populations of mice fed antibiotics to induce diarrhea, bacterial lactase genes were found in the Proteobacteria, Actinomyceota, Firmicutes, and other, unclassified bacteria, with lactase being most prominent in the Proteobacteria [26]. Even the addition of the monosaccharide glucose to an anaerobic culture can be expected to enrich bacterial populations of species capable of utilizing it anaerobically and tolerating the reduced pH caused by the accumulation of SCFAs such as lactic, acetic, propanoic, and butyric acids.
Therefore, this experiment was conducted to see if the addition of fermentable sugars would alter the composition of semi-volatile compounds emitted by manure slurries. Thus, we hoped to determined whether adding simple sugars to manure affects its odor either by reducing the concentrations of odorants typically deemed as offensive and/or increasing the concentrations of less offensive compounds.
2. Materials and Methods
2.1. Manure Incubations
Cow (Bos taurus) manure was collected from a dairy located in the Western Kentucky University farm in Warren County, Kentucky. Briefly, 50 mL of manure was diluted to 100 mL with deionized water and placed in 150 mL crimp-top bottles equipped with rubber septa. For the glucose and lactose incubations, the manure was unamended or amended with 6.45, 13.2, 26.4, or 65.8 g L−1 sugar, corresponding to concentrations ranging from approximately 36 mM to 365 mM for glucose and 19 to 192 mM for lactose, thus keeping them at roughly equal concentrations when considered as units of monosaccharide. In the case of sucrose, the manure slurries were unamended or amended with 12.5, 25, 50, or 125 g L−1 of sugar, corresponding to a range of 36.5 to 365 mM. The bottles were incubated at 30 °C for 28 days, by which time it had been determined in preliminary experiments that the pH of the slurries had declined below pH 4.0 and biogas production had slowed. The experiments were replicated four times for each sugar incubation in two trials of two replicates each. Fresh cow manure samples were used for each trial.
2.2. Biogas Measurement
Gas production by the slurries was measured each week by using a syringe with a wetted plunger and equipped with an 18-gauge needle. At week one, a 25 mL portion of the gas was injected into a headspace vial with a volume of 20 mL and fitted with a rubber septum. Methane and carbon dioxide were analyzed on a gas chromatograph (GC, model CP-3800, Agilent Technologies, Santa Clara, CA, USA) modified for GHG analysis by RSC Group LLC (Katy, TX, USA). The GC was equipped with a model 1041 on a column injector operated at 75 °C and 263 kPa, which was connected to a ten-port gas sampling valve and pressure-actuated solenoid valve. A 250 μL sample of vial headspace was injected using a syringe temperature of 35 °C and syringe flush time of 30 s, with 250 μL of the sample transferred to a 1.8 m by 1.6 cm o.d. column packed with 80/100 mesh Hay Sep Q (Agilent Technologies) with a He flow rate of 55 mL min−1 for methane analysis. The column was connected to a thermal conductivity detector (TCD) operated at 120 °C and with a filament temperature of 200 °C for CO2 analysis. From the TCD, the sample was transferred to a flame ionization detector for CH4 analysis, carried out under the following conditions: N2 makeup gas 15 mL min−1, H2 30 mL min−1, air 300 mL min−1, and temperature 275 °C.
2.3. Determination of Short-Chain Fatty Acids
Short-chain fatty acids were analyzed by high-performance liquid chromatography (HPLC, Thermo Fisher Scientific, Waltham, MA, USA) after filtration of the slurry wastewater collected at day 28 through a 0.2 µM pore size nylon filter (Sigma-Aldrich Corp., St. Louis, MO, USA). The samples were analyzed using a RHX monosaccharide column (Phenomenex, Torrance, CA, USA). Sulfuric acid (5 mM) was used as the mobile phase at a flow rate of 5 mL min−1 and at a temperature of 65 °C. Detection was performed with a photodiode array detector at a wavelength of 210 nm.
2.4. Determination of Odor Compounds
Analysis (GC-MS) of the odor compounds contained in the day 28 slurry was performed using a Shimadzu Nexis GC-2030/QP2020 NX single-quadrupole mass spectrometer interfaced with a TD-30 thermal desorption system (Shimadzu Scientific Corp., Columbia, MD, USA). The stir bars were desorbed at 280 °C for 5 min with a He flow rate of 30 mL min−1. The cryogenic trap was maintained at −20 °C, and a transfer line temperature of 250 °C was used. The GC used a 30 m by 0.25 mm Rxi-5 ms (95% PDMS, 5% diphenyl polysiloxane) column with a film thickness of 0.25 µm (Restek Corp., Bellefonte, PA, USA). The GC had an initial oven temperature of 50 °C for 1 min, which was then increased at 1.5 °C min−1 to 105 °C and thereafter increased at 15 °C min−1 to 210 °C, with a final hold time of 2 min, using a linear He flow velocity of 47.2 cm s−1. The mass spectrometer used a scanning range of 35–500 m/z and a scan speed of 1666 amu s−1. The identification and external calibration of compounds were based on a comparison of spectra and retention times with those of authentic standards (Sigma-Aldrich Inc., Burlington, MA, USA).
3. Results and Discussion
3.1. Biogas Production
Biogas production from the cow manure fermentations was principally affected by sugar addition by a decrease in the proportion of CH4 and an increase in the proportion of CO2 (Table 1). This result was expected since bacterial fermentation to produce SCFAs also produces CO2, except in the case of homolactic and homoacetic acid fermentations [27].

Table 1.
Biogas production of cow manure incubated with various concentrations of sugars 1.
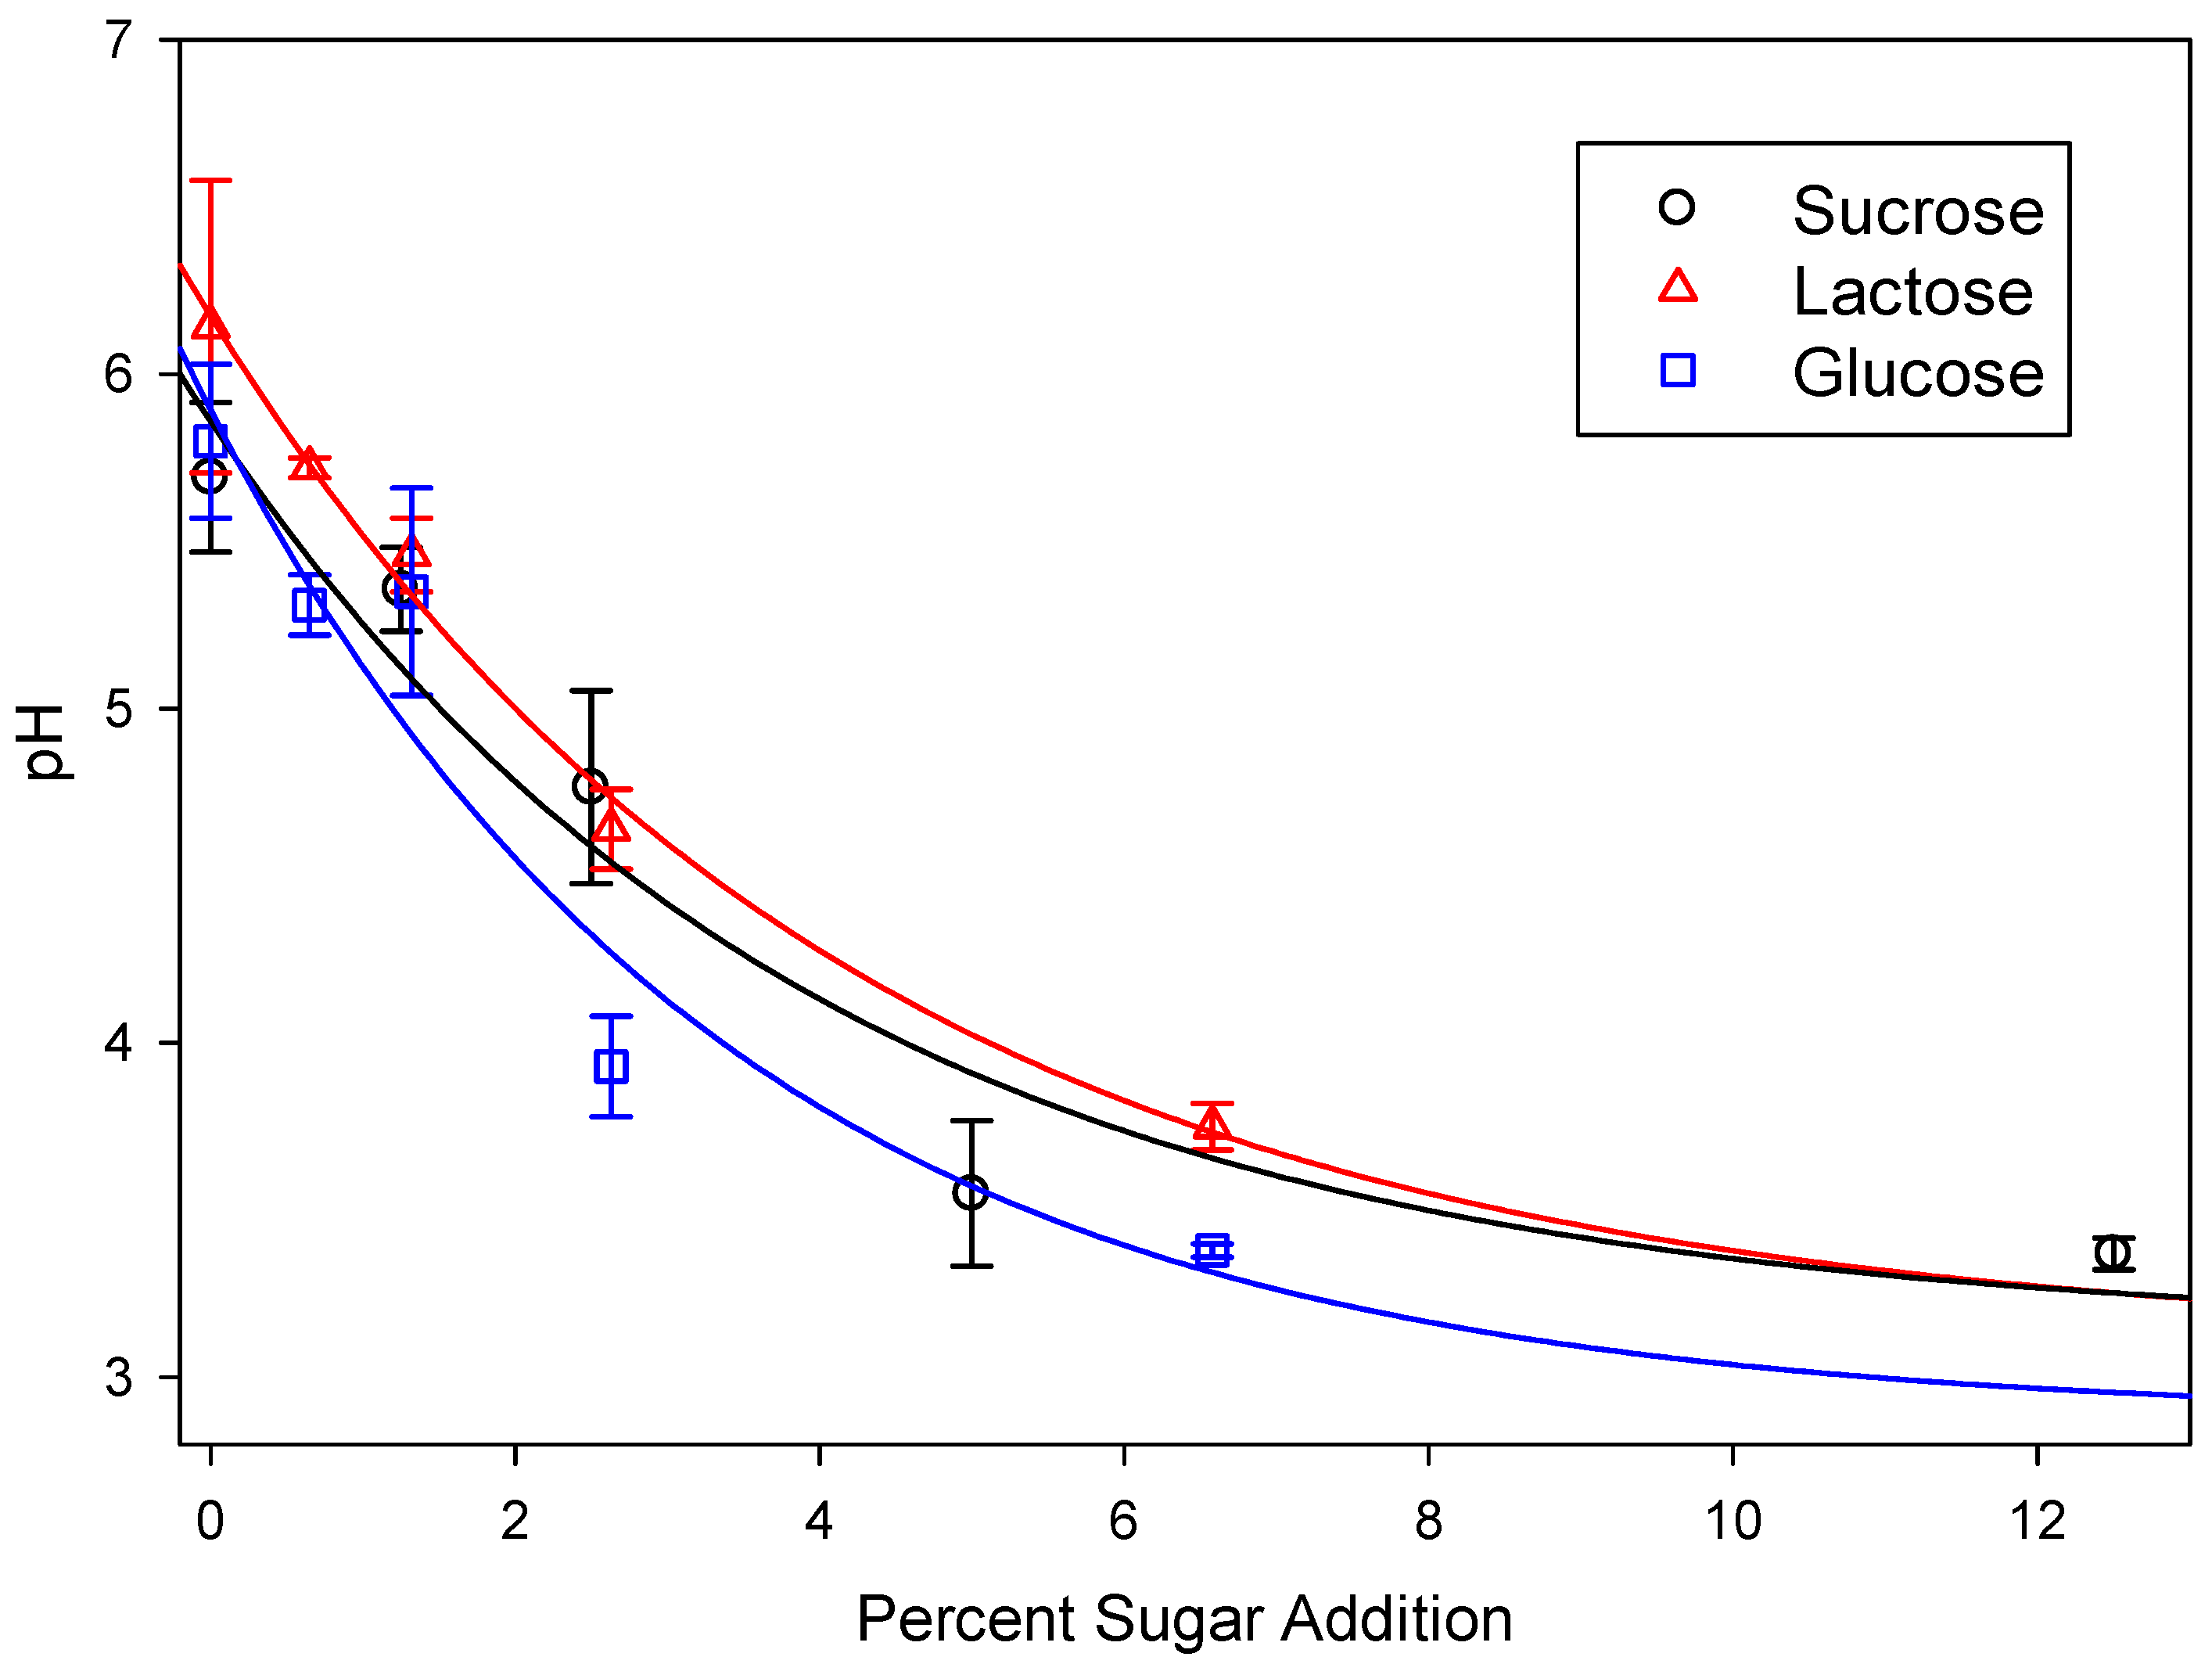
Due to the increase in the concentrations of CO2 and SCFAs (see below), the pH of the sugar-amended manure slurries was decreased relative to the control slurries (Figure 1). While the decrease in pH acted to further increase the proportion of CO2 in the biogas, it also decreased methane production. Since methanogens have a reported optimum pH of 6.7 to 7.4, this result was also expected [28].
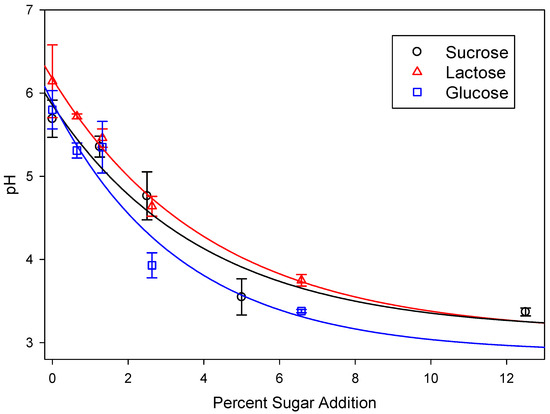
Figure 1.
pH of cow manure treated with various concentrations of sugars after 28 days of incubation. Lines represent data fitted to a exponential decay model with r2 = 0.891, 0.971, and 0.818 for glucose, lactose, and sucrose, respectively.
In the case of sucrose, the pH of the slurries was lowered to below pH 4.0 at five percent sugar addition, so subsequent incubations utilizing glucose and lactose were performed using half the weight that was used for sucrose.
3.2. Short-Chain Fatty Acids
Five SCFAs were found in the manure slurries, lactic acid, acetic acid, propanoic acid, butyric acid, and iso-butyric acid (Table 2), all of which are well known end products of bacterial fermentation [27]. Formic acid can be produced as a by-product of mixed acid fermentation by pyruvate formate lyase under carbon-limited conditions or with the use of carbon sources other than glucose, but it was not detected in the present study [29,30].
Table 2.
Concentrations of short-chain fatty acids in cow manure incubated for four weeks with various concentrations of sugars 1.
In the non-sugar-amended slurries, acetic acid occurred in the greatest relative proportions, with concentrations of 51.2., 33.6, and 56.9% of SCFAs in the glucose, lactose, and sucrose controls, respectively. Lactic acid, in contrast, occurred at relatively low concentrations, comprising 2.6 and 8.4 percent of the glucose and lactose controls, and it was not detected in the sucrose controls. Lactic acid also comprised less than five percent of the SCFAs for 0.65 percent glucose and lactose addition and 1.25 percent sucrose addition.
As the amount of sugar was increased, however, the concentration of SCFAs greatly increased, as did the relative proportion of lactic acid. For glucose, lactic acid occurred at 19,800 and 35,700 mg L−1 for 2.63 and 6.58 percent sugar addition, respectively. This represented 72.5 and 93.4 percent of the SCFAs. For lactose, lactic acid occurred at 7260 and 29,300 mg L−1 for 2.63 and 6.58 percent sugar addition, comprising 31.7 and 59.5 percent of the SCFAs. For sucrose, while lactic acid occurred at 463 mg L−1 for sugar additions of 1.25%, it occurred at 7330, 29,500, and 44,900 mg L−1 at 2.5, 5, and 12.5% sugar addition, respectively. This represented 33.2, 72.5, and 82.8 percent of all identified SCFAs. Thus, it appears that the growth of lactic acid bacteria (LAB) was stimulated by all three sugars.
SCFAs have long been known to possess antibacterial, antiviral, and antifungal properties [31,32,33]. In healthy women of reproductive age, for instance, the vaginal microbiota is characterized by having a large proportion of lactic acid-producing bacteria and a pH of approximately 3.5. In bacterial vaginosis, however, as the proportion of LAB is reduced, the concentration of lactic acid is also decreased, and the pH rises to 4.5 or greater. This allows for the growth of other anaerobic bacteria and higher concentrations of SCFAs such as acetate and butyrate [34]. Lactic acid, with a pka of 3.9, is a stronger acid than acetic acid or butyrate, which have a pKa of 4.76 and 4.82, respectively. Therefore, it may be supposed that the high production of lactic acid in the sugar-supplemented slurries acted to reduce microbial diversity.
3.3. Effect of Sugar Addition on Odorants
3.3.1. Glucose
The unamended manure had high concentrations of the typical manure malodorants phenol, para-cresol, para-ethylphenol, indole, and skatole (Table 3). The addition of the sugars decreased these malodorants in a dose-dependent manner. This was particularly apparent in the case of para-cresol and skatole, which are two volatile organic compounds highly typical of manure malodor [7,8]. The para-cresol concentrations were reduced by 24, 32, 61, and 72 percent by the addition of 6.5, 13.2, 26.3, and 65.8 g L−1 of glucose, respectively, whereas skatole was reduced by 8, 49, and 69 percent by 13.2, 26.3, and 65.8 g L−1 glucose addition, respectively. The addition of 6.5 g L−1 glucose to the manure slurry increased skatole production by 115 percent. Similar reductions were noted for other manure odorants. Glucose addition at 6.5, 13.2 and 26.3 g L−1 increased dimethyl disulfide production by the slurries, but its concentration in 65.8 g L−1 slurries was comparable to that of the control slurries. The addition of glucose to the manure slurries had little effect on phenol concentrations.
Table 3.
Concentrations of odor compounds in cow manure incubated with various concentrations of glucose.
At glucose concentrations of 26.3 and 65.8 g L−1, we noted the production of aliphatic esters, such as ethyl butyrate, propyl propanoate, propyl butyrate, and ethyl hexanoate, with fruity aromas. Ethyl butyrate, butyl butyrate, and ethyl hexanoate are important components of the aroma of apples [35]. This, accompanied by the decreases in manure malodorants, greatly altered the odorant composition of the manure slurries. It is interesting to note that despite glucose addition increasing lactic acid production, various Lactobacillus strains have been identified as producing para-cresol and skatole [36]. Conversely, other lactobacilli have been shown to catabolize phenol and para-cresol [37].
3.3.2. Lactose
Lactose affected manure odor profiles similarly to glucose (Table 4). For instance, the phenol concentration was reduced by 12% by the addition of 6.5 g L−1 of sugar, and the para-propylphenol concentration was reduced by 27%. With lactose additions of 26.3 and 65.8 g L−1, neither indole nor skatole were detected in the manure slurries. Similarly, as was seen for glucose, dimethyl sulfide production was stimulated at 13.2 and 26.3 g L−1 of lactose addition but not at 65.8 g L−1 of lactose addition.
Table 4.
Concentrations of odor compounds in cow manure incubated with various concentrations of lactose.
Also, as seen for glucose (Table 3), ester production was enhanced by lactose addition. While ethyl butyrate comprised over 60% of ester production in the glucose incubations, propyl propanoate accounted for over 60% of ester production in the lactose incubations. Other than the relative proportions of esters differing between the two sugars, the results were otherwise quite similar for the two sugars.
3.3.3. Sucrose
Sucrose also greatly affected the odorant profile of cow manure slurries similarly to glucose and lactose. At 50 g L−1 sucrose addition, approximately equivalent to the highest concentration used for glucose and lactose, phenol, para-cresol, para-ethylphenol, and para-propylphenol production was reduced by 44, 74, 17, and 77 percent, respectively, relative to the control (Table 5). Indole and skatole were not detected in the slurries at sucrose concentrations of 25 g L−1 or above.
Table 5.
Concentrations of odor compounds in cow manure incubated with various concentrations of sucrose.
Ethyl butyrate, propyl propanoate, and propyl butyrate were the only esters identified in the sucrose-amended slurries, and the relative proportion of ethyl butyarte increased as the concentration of sucrose was increased.
The addition of the three sugars affected the composition of the manure volatiles in a similar fashion, reducing the concentrations of aromatic malodorants such as para-cresol and skatole while leading to the production of aliphatic esters such as ethyl butyrate and propyl propanoate. Judging the relative pleasantness or unpleasantness of odors objectively is difficult due to variations in methodology and scaling systems [38]. For most studies, nevertheless, characteristic manure odorants are subjectively rated as “unpleasant”, and aliphatic esters are subjectively rated as as “pleasant” [39,40]. Further complicating impressions of the odor difference between the unamended and sugar-amended manure is the fact that the methods for measuring the odor detection thresholds of volatile organic compounds vary widely, and the ability to detect odors varies greatly from person to person. Still, Nagata measured the odor threshold of ethyl butyrate in air at 0.04 parts per billion (ppb) and skatole at 0.0056 ppb [41]. In the present study, it was subjectively noted that the sugar-amended manure had a less intense fecal odor, with fruit-like notes.
4. Conclusions
Implication of Sugar Addition for Manure Odorants
Although we measured the concentrations of the odor compounds in the aqueous phase, it was noted that the manure slurries amended with higher concentrations of all three sugars produced lower concentrations of the semi-volatile compounds typical of manure (e.g., indole and skatole) and higher concentrations of compounds more typically associated with fruits (e.g., ethyl butyrate). Lactic acid concentrations increased in a dose-dependent manner with the addition of all three sugars. This suggests that the addition of sugar to the manure shifted the microbiome to lactic acid-producing bacteria and perhaps other bacteria that tolerated the reduced pH. Lactobacilliales are a large and diverse order, including at least 16 families, including Lactobacilliaceae and Enterococcaceae, and determining which species were stimulated by sugar addition in the future will require microbiome sequencing.
It is interesting to note that, in addition to the research of Farnsworth [16], Øverland et al. noticed that the addition of chicory inulin to the diet of male pigs reduced skatole concentrations in the hind gut and adipose tissue [42]. Neither Øverland nor Farnworth noted the production of volatile esters, however. LAB are known producers of ethyl esters in dairy products such as cheese [43]. LAB are also important in the fermentation of baijiu, a Chinese liquor, imparting a distinctive flavor by their production of volatile aroma compounds including ethyl acetate and ethyl lactate [44].
Relatively large amounts of sugars were added to the manure slurries, resulting in significant reductions in the concentrations of manure malodorants such as para-cresol and skatole and the production of pleasant-smelling compounds such as ethyl butyrate and ethyl propanoate (Table 3, Table 4 and Table 5). In the future, research may show that the addition of smaller amounts of sugar can be used to gradually shift the microbiome of animal manure slurries and reduce its offensiveness.
Strategies could employ the addition of agricultural wastes rich in sugars, such as fruit waste, or waste rich in cellulose to increase the carbon–nitrogen ratio of slurries, promote the production of less offensive volatile organic compounds, and perhaps encourage the degradation of manure malodors. The addition of sugars to manure in the form of more complex carbohydrates also might have beneficial effects on manure odor while avoiding rapid and deleterious manure pH lowering.
Alternatively, manure could be supplemented with sugar to encourage the growth of these bacteria, and then be used as a supplement to manure pits, lagoons, or digesters to determine whether beneficial changes to manure microbiomes that act to remediate slurry malodors occur.
Author Contributions
Conceptualization, J.H.L. and G.E.A.; methodology, J.H.L. and N.L.; Investigation, J.H.L. and N.L.; writing—original draft preparation, J.H.L.; writing—review and editing: J.H.L., G.E.A. and N.L.; supervision, J.H.L.; funding acquisition, J.H.L., G.E.A. and N.L. All authors have read and agreed to the published version of the manuscript.
Funding
Funding was provided by the Agricultural Research Service (Grant No. 5040-12630-006-00D).
Data Availability Statement
The original contributions presented in the study are included in the article, further inquiries can be directed to the corresponding author.
Acknowledgments
The authors thank Stacy Antle, and Zachary Berry (USDAARS) for their technical assistance. The use of trade, firm, or corporation names in this article is for the information and convenience of the reader. Such use does not constitute an official endorsement or approval by the United States Department of Agriculture or the Agricultural Research Service of any product or service to the exclusion of others that may be suitable.
Conflicts of Interest
The authors declare no conflicts of interest. The funders had no role in the design of the study; in the collection, analyses, or interpretation of data; in the writing of the manuscript; or in the decision to publish the results.
Abbreviations
LAB: lactic acid bacteria; SCFAs: short-chain fatty acids.
References
- Yates, S.R.; McConnell, L.L.; Hapeman, C.J.; Papiernik, S.K.; Gao, S.; Trabue, S.L. Managing agricultural emissions to the atmosphere: State of the science, fate and mitigation, and identifying research gaps. J. Environ. Qual. 2011, 40, 1347–1358. [Google Scholar] [CrossRef]
- Ma, Q.; Meng, N.; Li, Y.; Wang, J. Occurrence, impacts, and microbial transformation of 3-methylindole (skatole): A critical review. J. Hazard. Mat. 2021, 416, 126181. [Google Scholar] [CrossRef]
- Hudson, R. Odor and odorant: A terminological clarification. Chem. Senses. 2000, 25, 693. [Google Scholar] [CrossRef]
- Parker, D.B. Reduction of odor and VOC emissions from a dairy lagoon. Appl. Eng. Agricul. 2008, 24, 647–655. [Google Scholar] [CrossRef]
- Rybarczyk, P.; Szulczyński, B.; Gebicki, J.; Hupka, J. Treatment of malodorous air in biotrickling filters: A review. Biochem. Eng. J. 2019, 141, 146–162. [Google Scholar] [CrossRef]
- Page, L.H.; Ni, J.-Q.; Zhang, H.; Heber, A.J.; Mosier, N.S.; Liu, X.; Joo, H.-S.; Ndegwa, P.M.; Harrison, J.H. Reduction of volatile fatty acids and odor offensiveness by anaerobic digestion and solid separation of dairy manure during manure storage. J. Environ. Manag. 2015, 152, 91–98. [Google Scholar] [CrossRef]
- Szogi, A.A.; Loughrin, J.H.; Vanotti, M.B. Improved water quality and reduction of odorous compounds in anaerobic lagoon columns receiving pre-treated pig wastewater. Environ. Technol. 2018, 39, 2613–2621. [Google Scholar] [CrossRef]
- Spoelstra, S.F. Simple phenols and indoles in anaerobically stored piggery wastes. Sci. Food Agricul. 1977, 28, 415–423. [Google Scholar] [CrossRef]
- Trabue, S.; Kerr, B.; Bearson, B.; Ziemer, C. Swine odor analyzed by odor panels and chemical techniques. J. Environ. Qual. 2011, 40, 1510–1520. [Google Scholar] [CrossRef]
- Whitehead, T.R.; Price, N.; Drake, H.L.; Cotta, M.A. Catabolic pathway for the production of skatole and indoleacetic acid by the acetogen Clostridium drakei, Clostridium scatologenes, and swine manure. Appl. Environ. Microbiol. 2008, 74, 1950–1953. [Google Scholar] [CrossRef] [PubMed]
- Li, X.; Jensen, R.L.; Højberg, O.; Canibe, N.; Jensen, B.B. Olsenella scatoligenes sp. nov., a 3-methylindole- (skatole) and 4-methylphenol- (p-cresol) producing bacterium isolated from pig faeces. Int. J. Syst. Evol. Microbiol. 2015, 65, 1227–1233. [Google Scholar] [CrossRef]
- Varel, V.H.; Miller, D.N. Effect of carvacrol and thymol on odor emissions from livestock wastes. Water Sci. Technol. 2001, 44, 143–148. [Google Scholar] [CrossRef] [PubMed]
- Varel, V.H.; Miller, D.N.; Lindsay, A.D. Plant oils thymol and eugenol affect cattle and swine waste emissions differently. Water Sci. Technol. 2004, 50, 207–213. [Google Scholar] [CrossRef]
- Kendig, M.D.; Hasebe, K.; McCague, R.; Lee, F.; Leigh, S.-J.; Arnold, R.; Morris, M.J. Adolescent exposure to a solid high-fat, high-sugar ‘cafeteria’ diet leads to more pronounced changes in metabolic measures and gut microbiome composition than liquid sugar in female rats. Appetite 2022, 172, 105973. [Google Scholar] [CrossRef]
- Neves, V.G.O.; de Oliveira, D.T.; Oliveira, D.C.; Perucci, L.O.; dos Santos, T.A.P.; Fernandes, I.C.; de Sousa, G.G.; Barboza, N.R.; Guerr-Sá. High-sugar diet intake, physical activity, and gut microbiota crosstalk: Implications for obesity in rats. Food Sci. Nutr. 2020, 8, 5683–5695. [Google Scholar] [CrossRef] [PubMed]
- Farnsworth, E.R.; Modler, H.W.; Mackie, D.A. Adding Jerusalem artichoke (Helianthus tuberosus L.) to weanling pig diets and the effect on manure composition and characteristics. Anim. Feed Sci. Technol. 1995, 55, 153–160. [Google Scholar] [CrossRef]
- Gerard, J. The Herbal or General History of Plants; Dover Publications: Mineola, New York, USA, 1975; p. 1678. [Google Scholar]
- Chibbar, R.N.; Jaiswal, S.; Gangola, M.; Baga, M. Carbohydrate Metabolism. Reference Module in Food Science; Elsevier: Amsterdam, The Netherlands, 2016. [Google Scholar] [CrossRef]
- Kolida, S.; Tuohy, K.; Gibson, G.R. Prebiotic effects of inulin and oligofructose. Br. J. Nutr. Suppl. 2002, 87, S193–S197. [Google Scholar] [CrossRef]
- Salazar, N.; Dewulf, E.M.; Neyrinck, A.M.; Bindels, L.B.; Cani, P.D.; Mahillon, J.; de Vos, W.M.; Thissen, J.-P.; Gueimonde, M.; de Los Reyes-Gavilán, C.G.; et al. Inulin-type fructans modulate intestinal Bifidobacterium species populations and decrease fecal short-chain fatty acids in obese women. Clin. Nutr. 2015, 2015, 501–507. [Google Scholar] [CrossRef]
- Yang, Y.-X.; He, M.; Hu, G.; Wei, J.; Pages, P.; Yang, X.-H.; Bourdu-Maturel, S. Effect of a fermented milk containing Bifidobacterium lactis DN-173010 on Chinese constipated women. World J. Gastroenterol. 2008, 14, 6237–6243. [Google Scholar] [CrossRef] [PubMed]
- Meyer, D.; Stasse-Wolthuis, M. The bifidogenic effect of inulin and oligofructose and its consequences for gut health. Eur. J. Clin. Nutr. 2009, 63, 1277–1289. [Google Scholar] [CrossRef]
- Ghouri, Y.A.; Richards, D.M.; Rahimi, E.F.; Krill, J.T.; Jelinek, K.A.; DuPont, A.W. Systematic review of randomized controlled trials of probiotics, prebiotics, and synbiotics in inflammatory bowel disease. Clin. Exp. Gastroenterol. 2014, 7, 473–487. [Google Scholar] [CrossRef]
- De Graff, A.A.; Venema, K. Gaining insight into microbial physiology in the large intestine: A special role for stable isotopes. Adv. Microb. Physiol. 2008, 53, 73–168. [Google Scholar] [CrossRef]
- Lincoln, L.; More, S.S. Bacterial invertases: Occurrence, production, biochemical characterization, and significance of transfructosylation. J. Basic Microbiol. 2017, 57, 803–813. [Google Scholar] [CrossRef]
- Long, C.-X.; He, L.; Guo, Y.-F.; Xiao, N.-X.; Tan, Z.-J. Diversity of bacterial lactase genes in intestinal contents of mice with antibiotics-induced diarrhea. World J. Gastroenterol. 2017, 23, 7584–7593. [Google Scholar] [CrossRef]
- Müller, V. Bacterial Fermentation. In Encyclopedia of Life Sciences; John Wiley & Sons: Hoboken, NJ, USA, 2001. [Google Scholar] [CrossRef]
- Lay, J.-J.; Li, Y.-Y.; Noike, T. The influence of pH and ammonia concentration on the methane production in high-solids digestion processes. Water Environ. Res. 1998, 70, 1075–1079. [Google Scholar] [CrossRef]
- Bintis, T. Lactic acid bacteria as starter cultures: An update in their metabolism and genetics. AIMS Microbiol. 2018, 4, 665–684. [Google Scholar] [CrossRef]
- Pietzke, M.; Meiser, J.; Vazquez, A. Formate metabolism in health and disease. Mol. Metab. 2020, 33, 23–37. [Google Scholar] [CrossRef]
- Peck, S.M.; Rosenfeld, H.; Leifer, W.; Bierman, W. Role of sweat as a fungicide: With special reference to the use of constituents of sweat in the therapy of fungous infections. Arch. Derm. Syphilol. 1939, 39, 126–148. [Google Scholar] [CrossRef]
- Machado, M.G.; Sencio, V.; Trottein, F. Short-chain fatty acids as a potential treatment for infections: A closer look at the lungs. Infect. Immun. 2021, 89, e00188-21. [Google Scholar] [CrossRef]
- Kadry, A.A.; El-Antrawy, M.A.; El-Ganiny, A.M. Impact of short chain fatty acids (SCFAs) on antimicrobial activity of new β-lactam/β-lactamase inhibitor combinations and on virulence of Escherichia coli isolates. J. Antibiot. 2023, 76, 225–235. [Google Scholar] [CrossRef]
- Aldunate, M.; Srbinovski, D.; Hearps, A.C.; Latham, C.F.; Ramsland, P.A.; Gugasyan, R.; Cone, R.A.; Tachedjian, G. Antimicrobial and immune modulatory effects of lactic acid and short chain fatty acids produced by vaginal microbiota associated with eubiosis and bacterial vaginosis. Front. Physiol. 2015, 6, 164. [Google Scholar] [CrossRef] [PubMed]
- López, M.L.; Lavilla, M.T.; Riba, M.; Vendrell, M. Comparison of volatile compounds in two seasons in apples: Golden delicious and Granny Smith. J. Food Qual. 1998, 21, 155–166. [Google Scholar] [CrossRef]
- Yokoyama, M.T.; Carlson, J.R. Production of Skatole and para-Cresol by a Rumen Lactobacillus sp. Appl. Environ. Microbiol. 1981, 41, 71–76. [Google Scholar] [CrossRef]
- Nowak, A.; Libudzisz, Z. Ability of intestinal lactic bacteria to bind or/and metabolise phenol and p-cresol. Ann. Microbio. 2007, 57, 329–3325. [Google Scholar] [CrossRef]
- Lim, J. Hedonic scaling: A review of methods and scaling. Food Qual. Pref. 2011, 22, 733–747. [Google Scholar] [CrossRef]
- Zarso, M. Hedonic judgements of chemical compounds are correlated with molecular size. Sensors 2011, 11, 3667–3686. [Google Scholar] [CrossRef] [PubMed]
- Zhang, S.; Koziel, J.A.; Cai, L.; Hoff, S.J.; Heathcote, K.Y.; Chen, L.; Jacobson, L.D.; Akdeniz, N.; Hetchler, B.P.; Parker, D.B.; et al. Odor and odorous chemical emissions from animal buildings: Part 5. Simultaneous chemical and sensory analysis with gas chromatography-mass spectrometry-olfactometry. Trans. ASABE 2015, 58, 1349–1359. [Google Scholar] [CrossRef]
- Nagata, Y.; Takeuchi, N. Measurement of odor threshold by triangle odor bag method. Odor Meas. Rev. 2003, 118, 118–127. [Google Scholar]
- Øverland, M.; Kjos, N.K.; Fauske, A.K.; Teige, J.; Sørum, H. Easily fermentable carbohydrates reduce skatole formation in the distal intestine of entire male pigs. Livestock Sci. 2011, 140, 206–217. [Google Scholar] [CrossRef]
- Liu, S.-Q.; Holland, R.; Crow, V.L. Esters and their biosynthesis in fermented dairy products: A review. Int. Dairy J. 2004, 14, 923–945. [Google Scholar] [CrossRef]
- Pang, X.-N.; Chen, C.; Huang, X.-N.; Yan, Y.-Z.; Chen, J.-Y.; Han, B.-Z. Influence of indigenous lactic acid bacteria on the volatile flavor profile of light-flavor Baijiu. LWT 2021, 147, 111540. [Google Scholar] [CrossRef]
Disclaimer/Publisher’s Note: The statements, opinions and data contained in all publications are solely those of the individual author(s) and contributor(s) and not of MDPI and/or the editor(s). MDPI and/or the editor(s) disclaim responsibility for any injury to people or property resulting from any ideas, methods, instructions or products referred to in the content. |
© 2024 by the authors. Licensee MDPI, Basel, Switzerland. This article is an open access article distributed under the terms and conditions of the Creative Commons Attribution (CC BY) license (https://creativecommons.org/licenses/by/4.0/).