Abstract
The foundation industries in the UK were responsible for emitting 42 Mt CO2eq in 2020, which is approximately 10% of the yearly territorial greenhouse gas emissions. The UK government decarbonisation roadmap issued in 2015 predicted that high-tech strategies such as carbon capture and utilisation, hydrogen and biofuels, as well as electrification of processes are key for achieving the climate mitigating targets by 2050. In this study, a critical assessment was performed on the limitations to achieve these high-tech strategies such as biomass availability, capital investment, and technology readiness. The study is the first to use the UK carbon budget values as the resource limit for the high-tech decarbonisation strategies. The findings show that the significant uncertainty associated with the high-tech scenarios limits their decarbonisation potential by 2050. More importantly, to stay within the mid-century carbon budget for the foundation industries, 20–40% reduction in production, through circular economic strategies such as material efficiency and/or changes in product specifications, is required in order to achieve the decarbonisation targets.
1. Introduction
1.1. Background
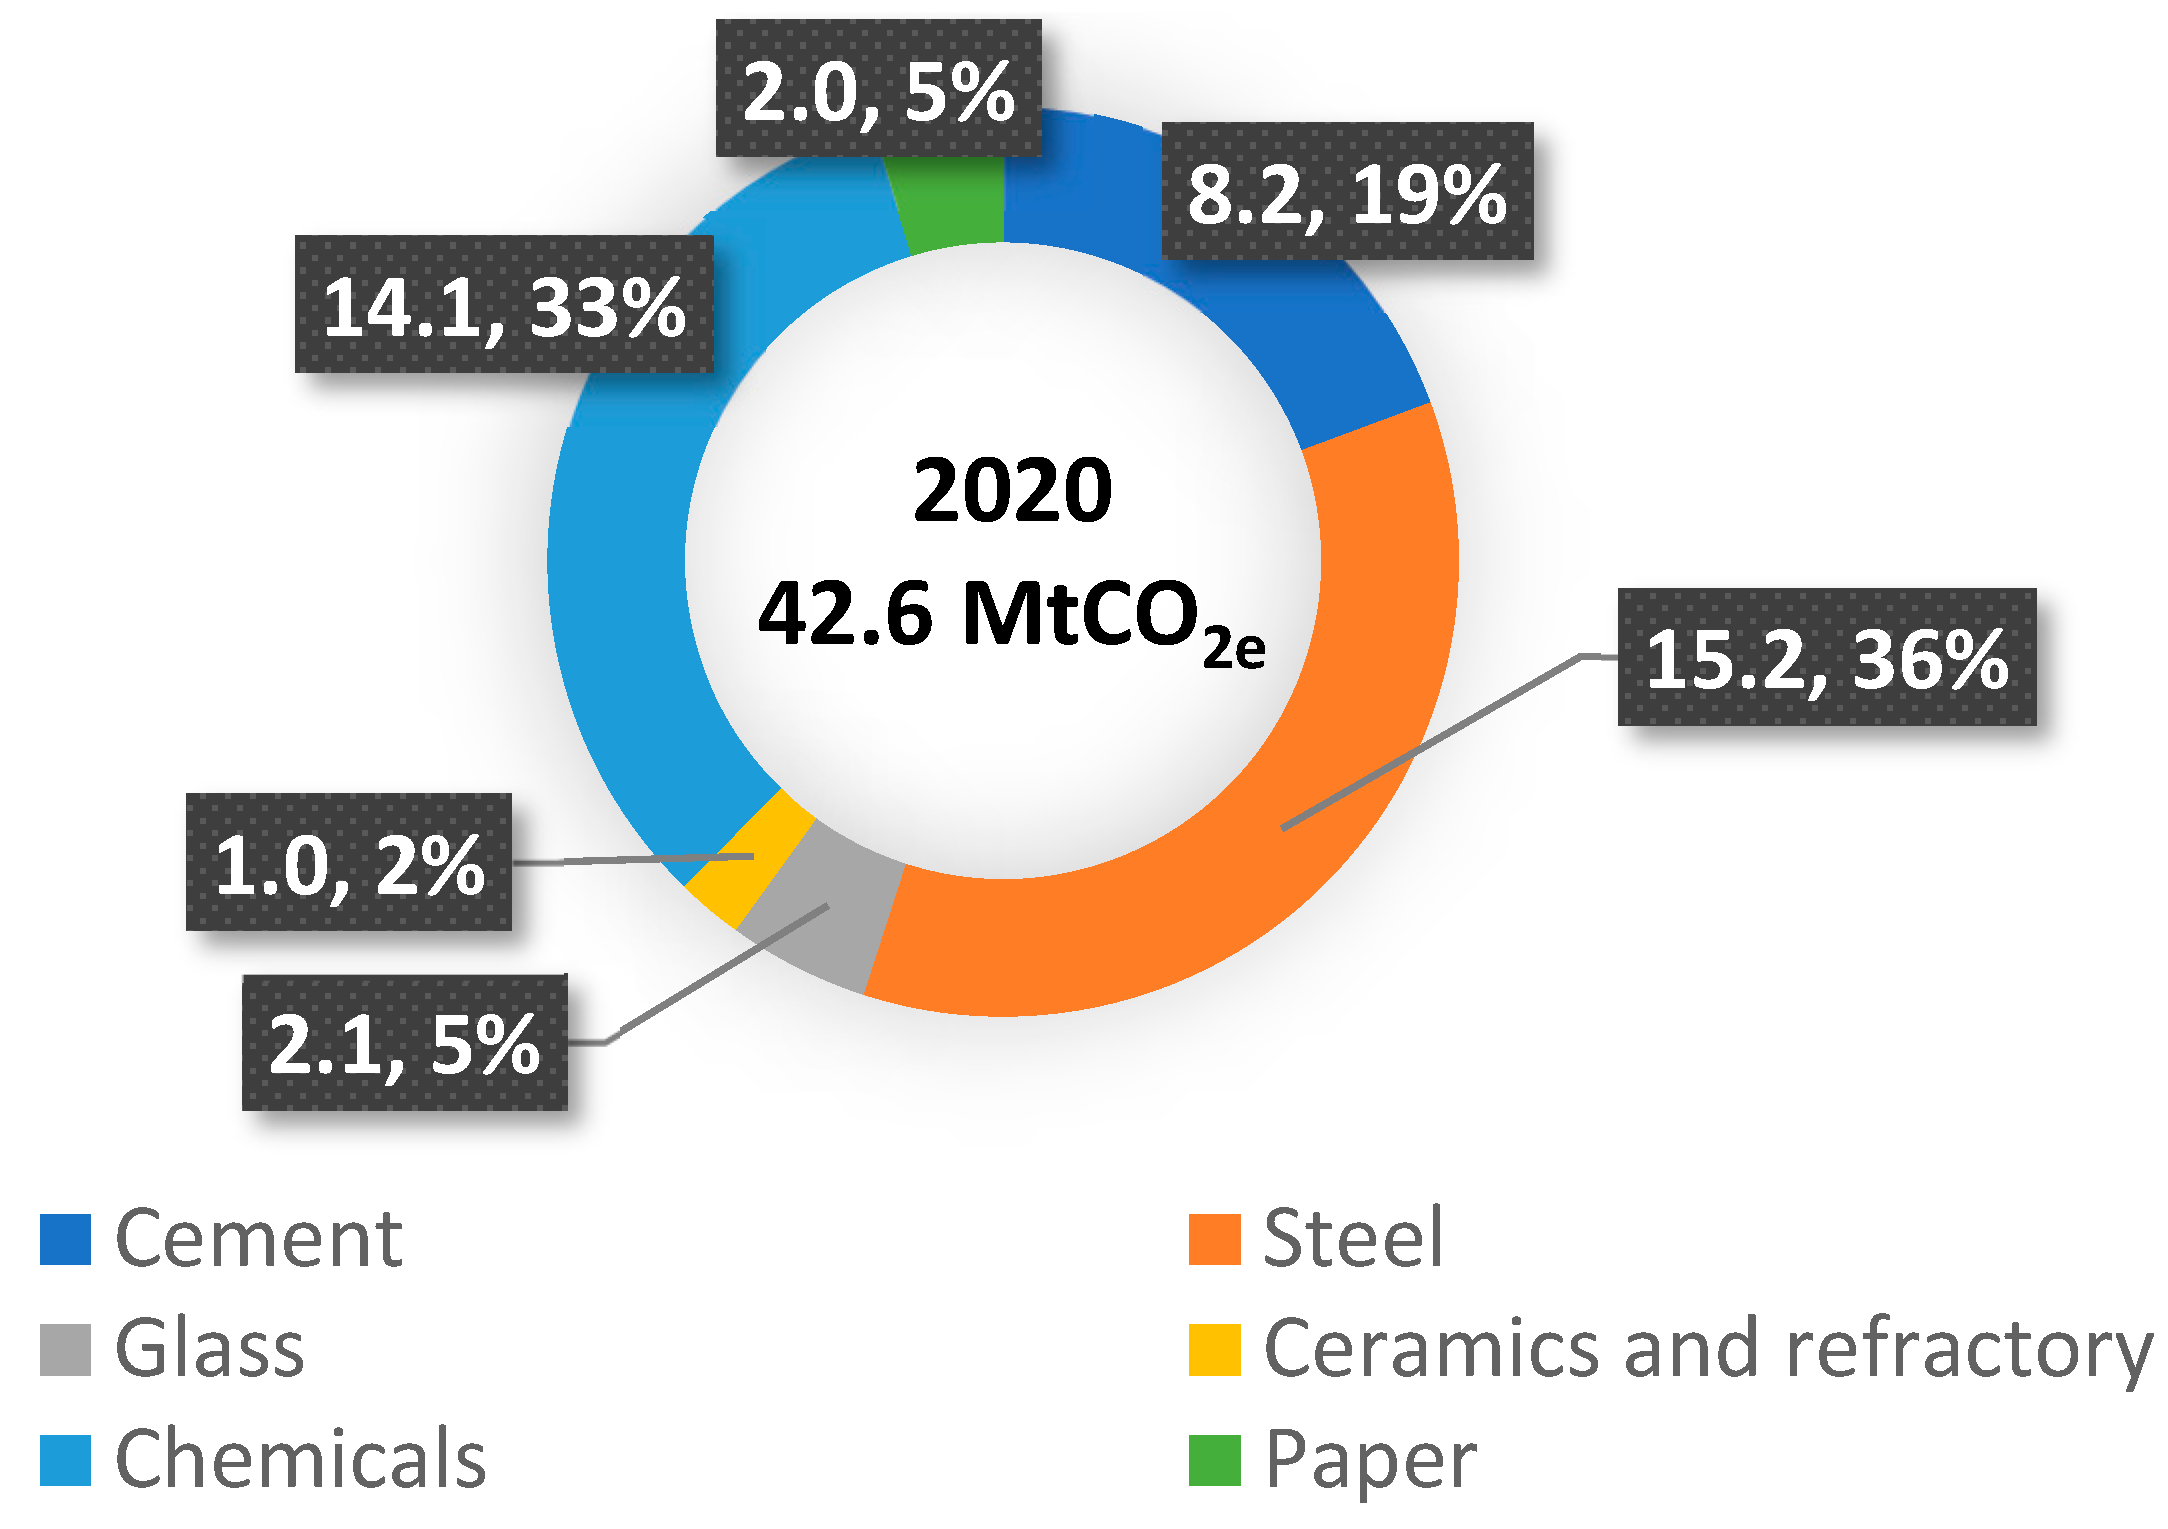
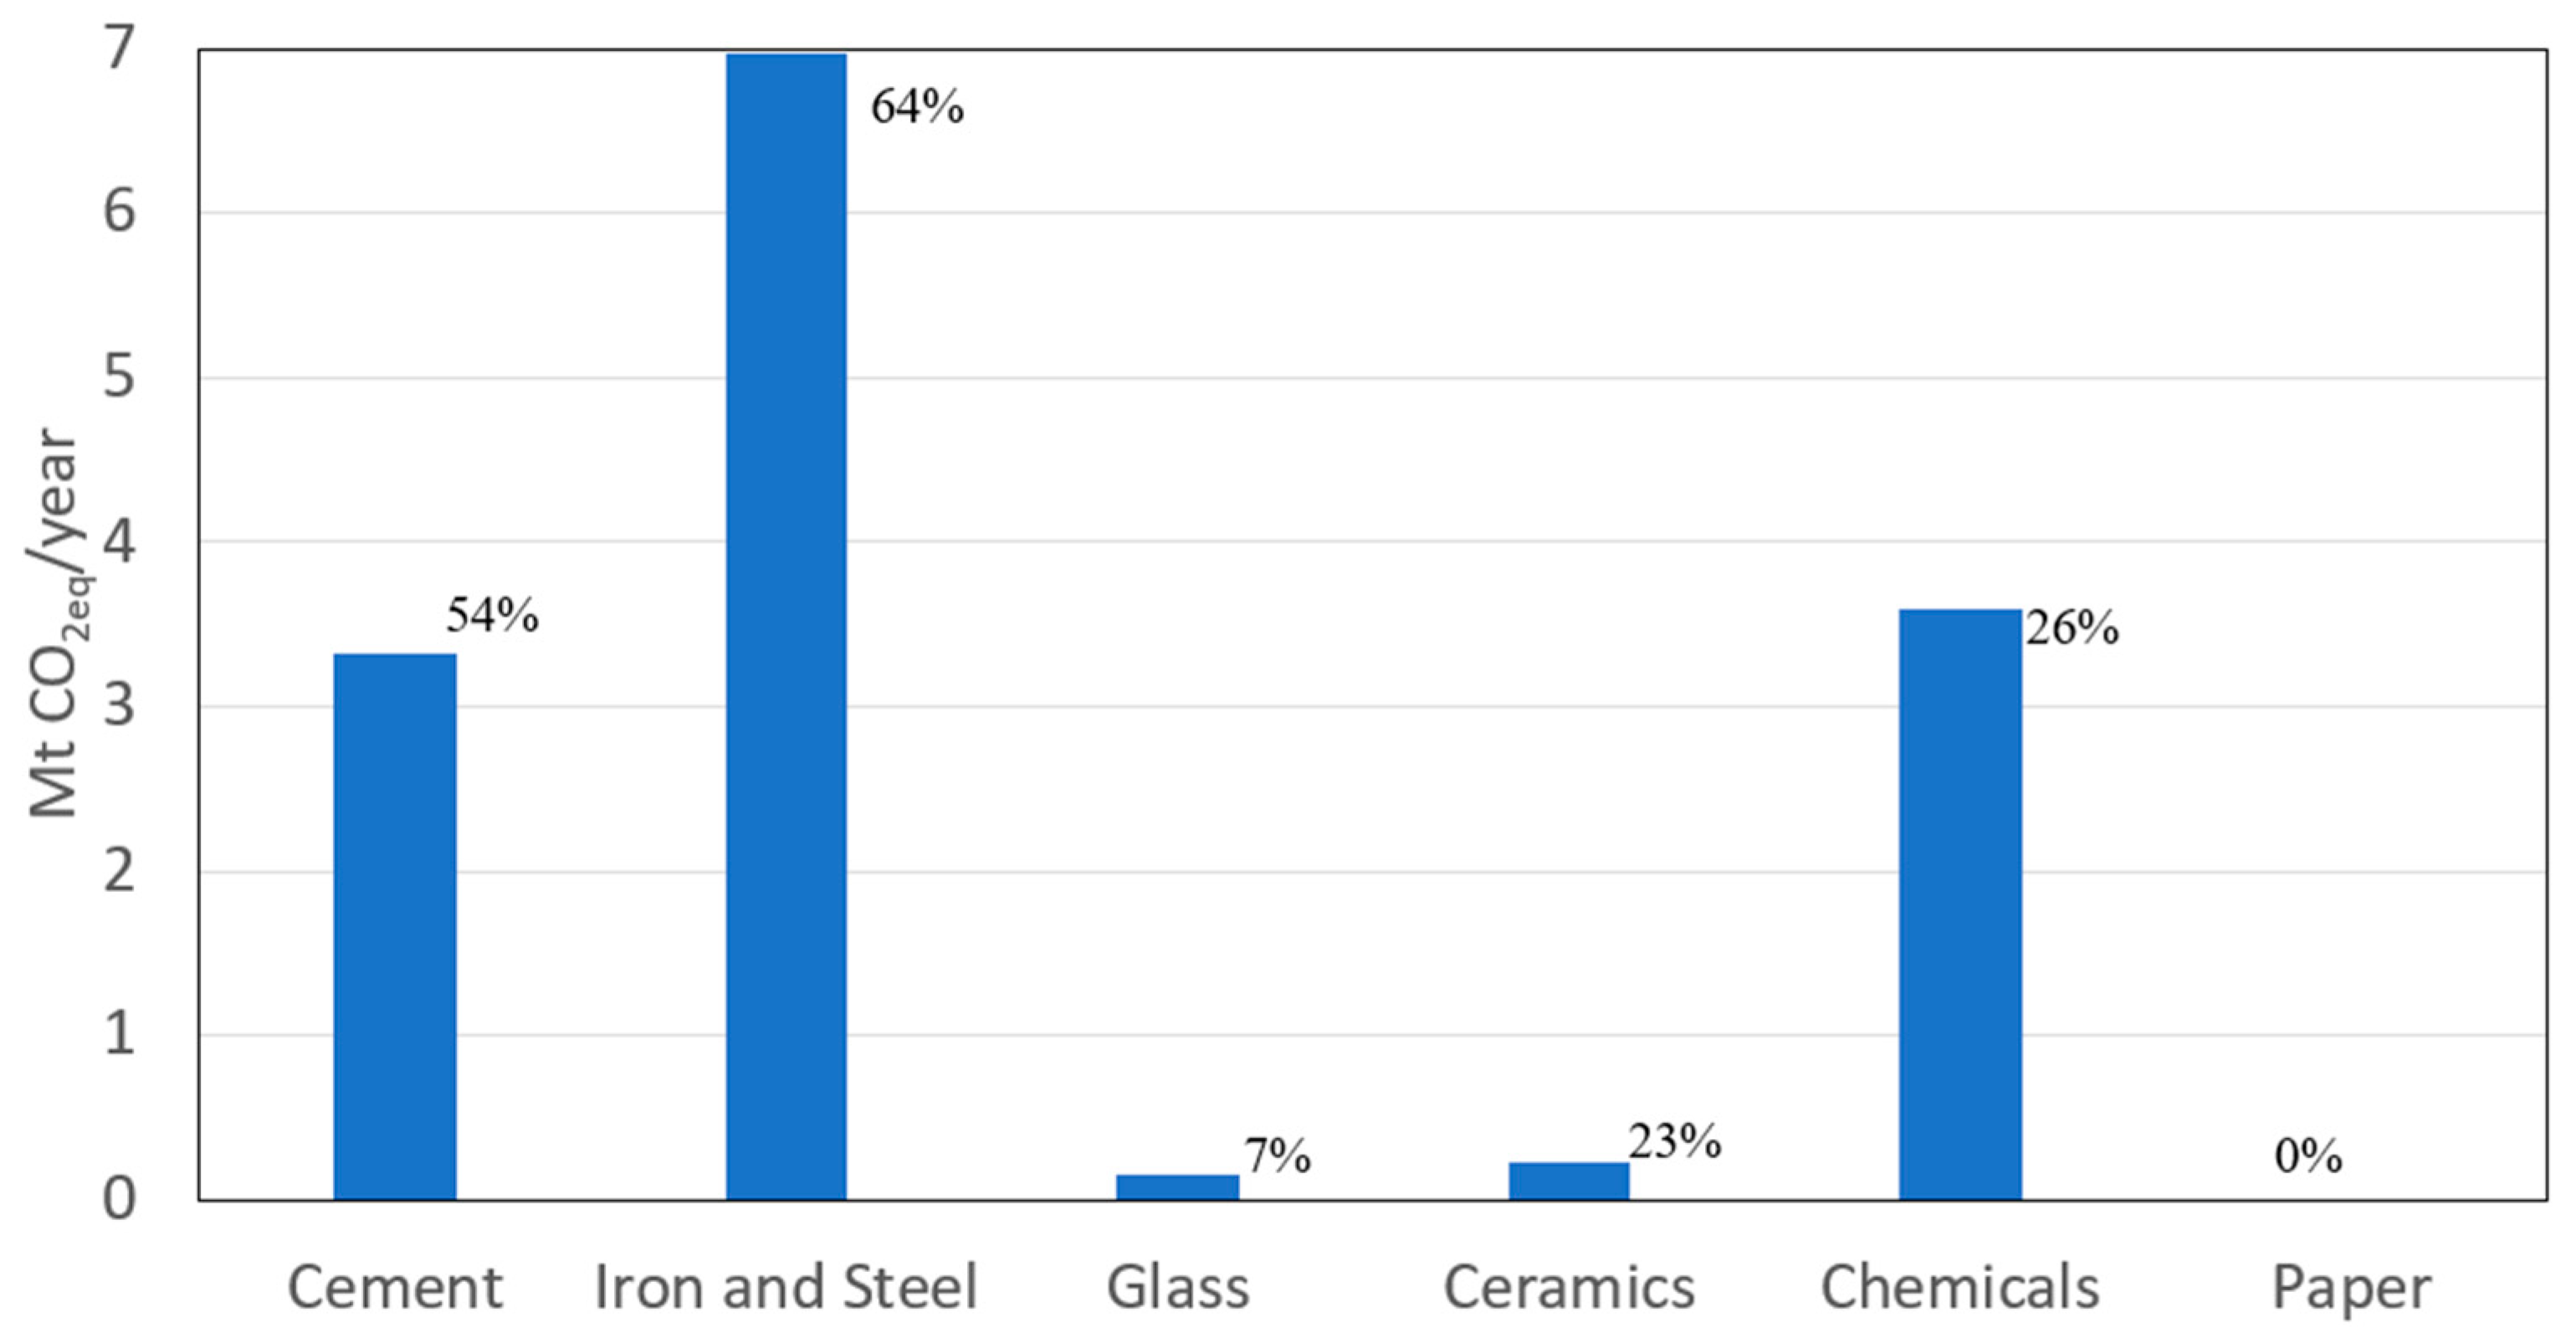
The industrial sector is amongst the priorities of international political efforts to combat global warming as it accounts for around 24% of global carbon dioxide emissions [1]. The industrial sector in the UK employs at least 2.5 million people and contributes more than GBP 570 billion to the total GDP [2]. A significant share of this could be attributed to six UK industries which are labelled as the Foundation Industries (FIs), namely Steel, Glass, Cement, Chemicals, Paper, and Ceramics. The FIs employ at least 250,000 people [2] and contribute more than GBP 50 billion to the GDP [3]. Nevertheless, the sum of the territorial greenhouse gas (GHG) emissions (i.e., emissions not accounting for those associated with imported goods) from the FI in 2020, as shown in Figure 1 below, reached 42.6 Mt CO2eq, approximately 10% of total UK emissions.
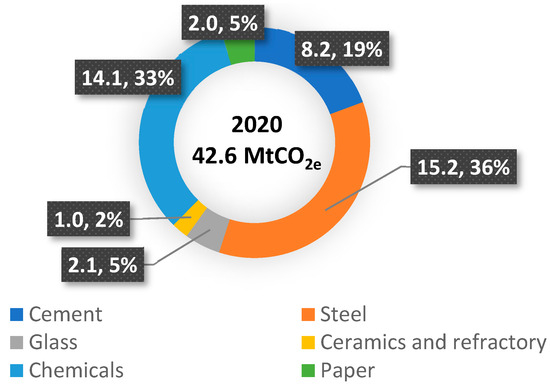
Figure 1.
The breakdown of the GHG emissions of each of the 6 FIs in 2020.
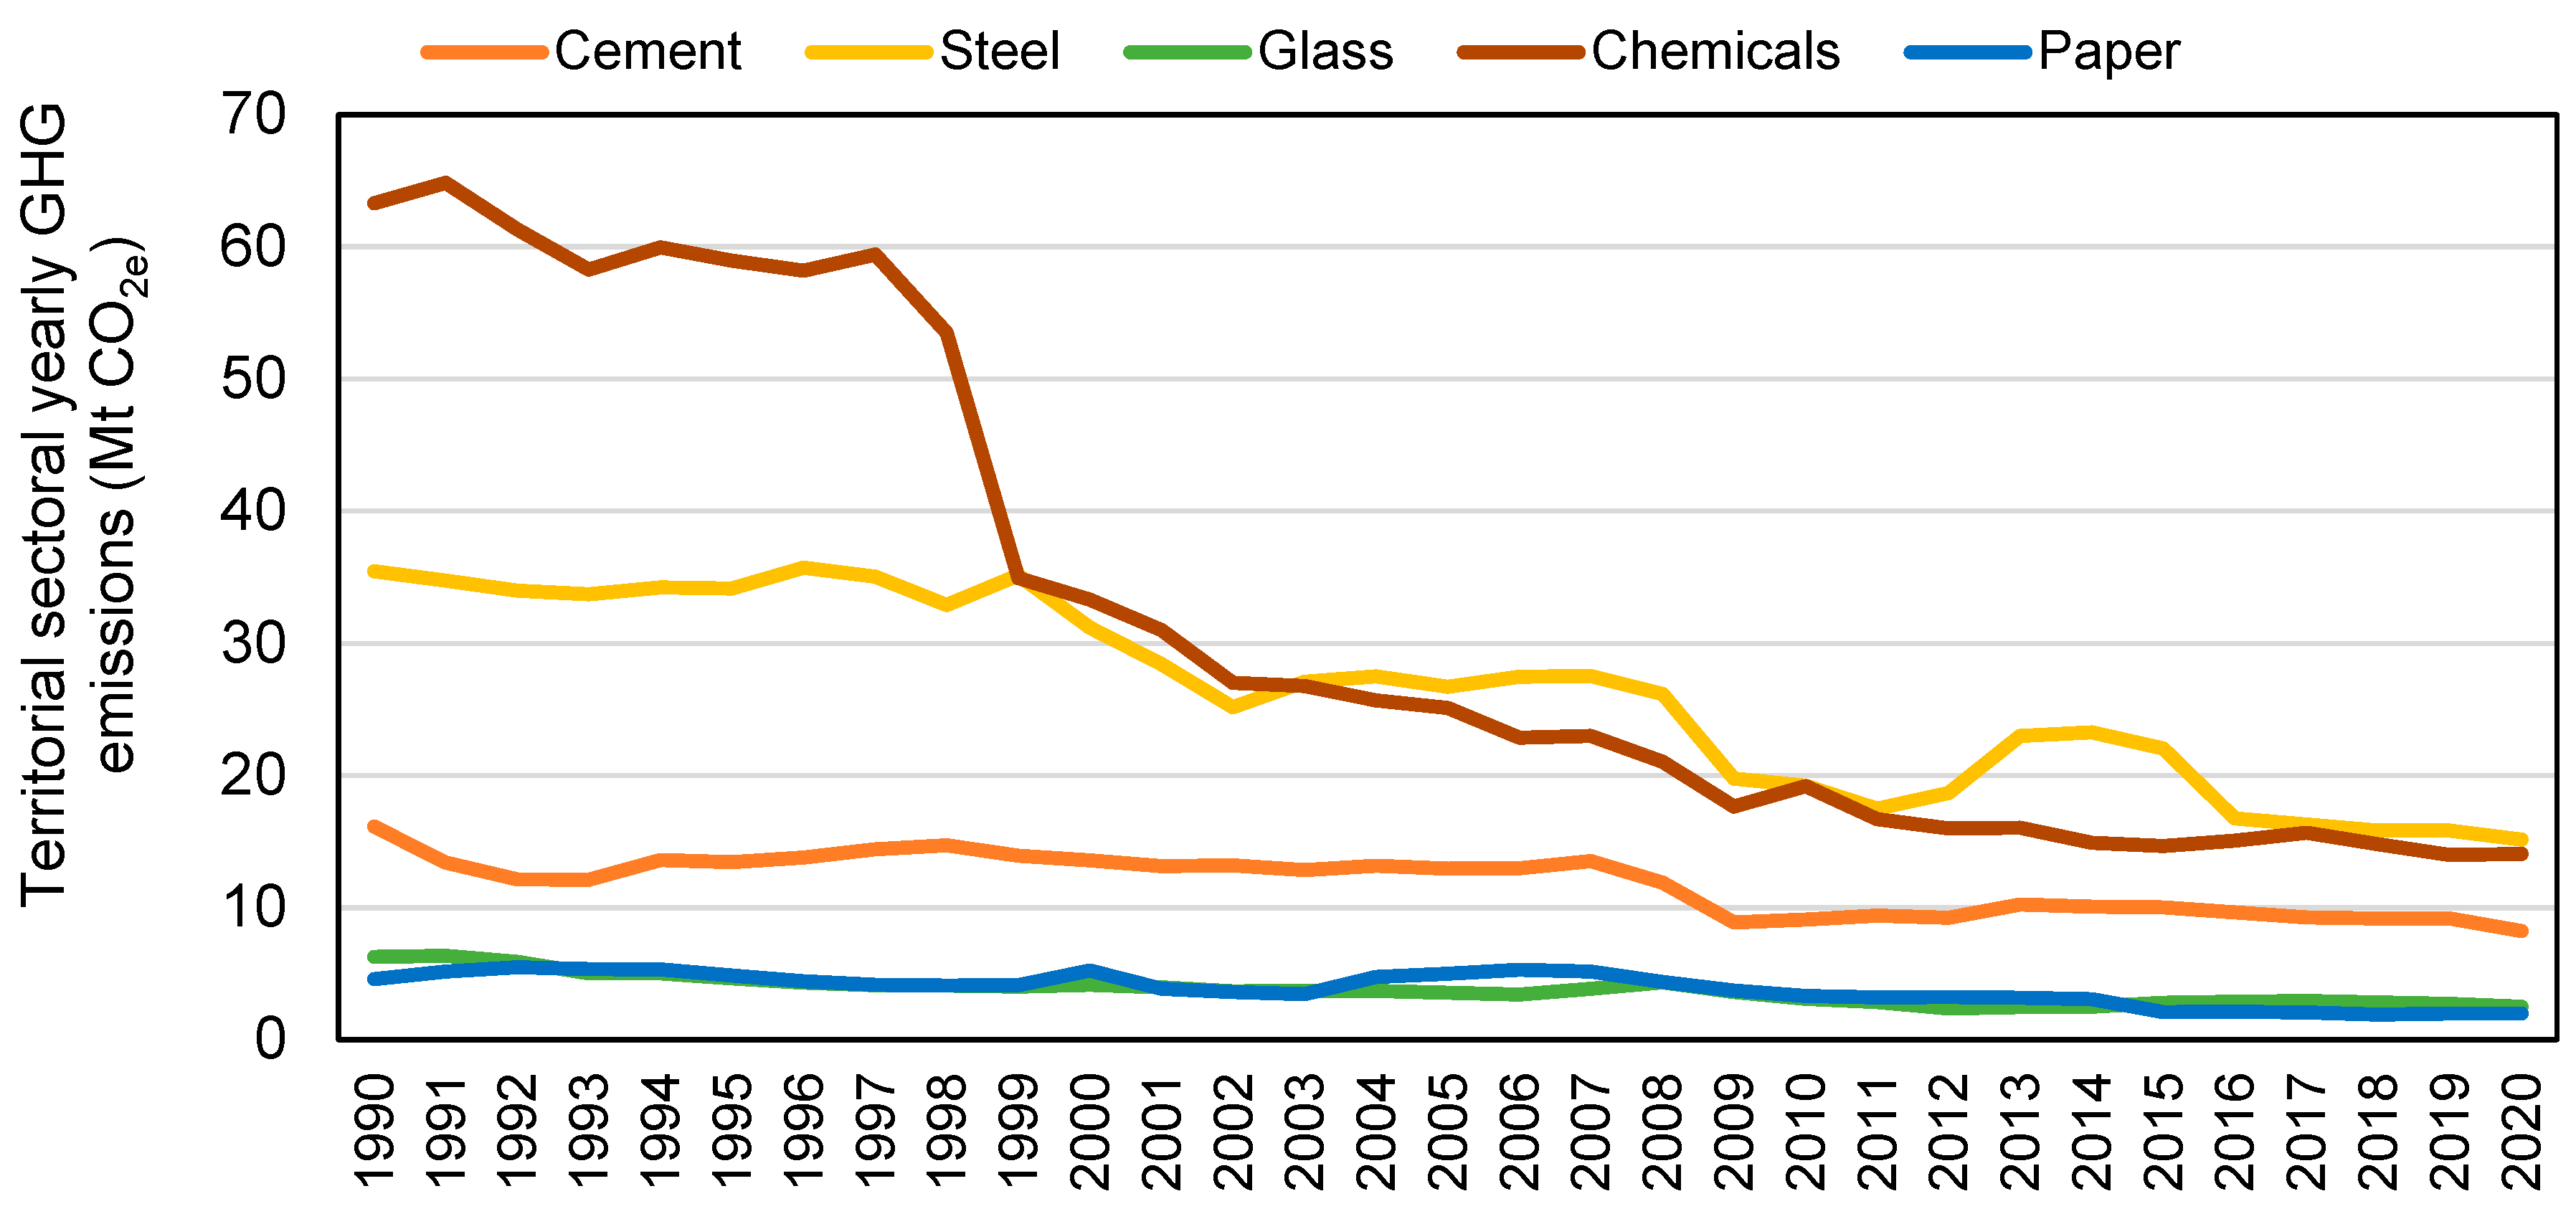
In 2008, the UK government passed a Climate Change Act through which it commits, by law, to reducing greenhouse gas emissions by at least 100% of the 1990 levels (net zero) by 2050 [4]. Historical data from the UK Department of Energy Security and Net Zero (2021) shows a reduction in the total GHG emissions of five of the six industries in 2020 (data for ceramics is not separately reported) by around 70% compared to the 1990 levels (Figure 2). However, the remaining 42.6 Mt CO2eq are not negligible and hence a decarbonisation roadmap was issued for each of the six foundation industries by the Business, Energy and Industrial Strategy (BEIS) department [5]. The following sections will describe the current production levels, energy and carbon intensities, as well as the state-of-the-art decarbonisation strategy for each of the sectors.

Figure 2.
Historical record of the GHG emissions of each of the 6 FIs between 1990–2020.
1.2. Sectoral Baseline Analysis
1.2.1. Iron and Steel
The iron and steel industry is a major sector in the UK with GBP 1.97 billion in revenues in 2020 from 1100 businesses employing 33,400 employees [6]. The typical energy and carbon intensive steel production process is based on the primary route where first iron is smelted in a blast furnace (BF) using coke and iron ore feedstock, then oxygenated in a basic oxygen furnace (BOF) to produce usable steel products. The less prominent yet substantial route is secondary steel production in electric arc furnaces (EAF) using steel scrap as the main feedstock [7]. The energy intensity of primary steel production (14–18 GJ/t) is almost four times that of the secondary process (4–5 GJ/t) [8]. In the UK, the production volumes peaked at 28 Mt in 1970, but declined slowly until it dropped in 2008 to only 5 Mt, after which it slowly recovered to reach nearly 7.5 Mt in 2018 [9]. In 2018, 80% of the steel in the UK was produced through primary processes, while only 20% was through EAF [10]. The global average carbon intensity of primary and secondary steel production is reported to be 2.2 and 0.84 kg CO2eq/kg, respectively [11]. The average UK carbon intensity of steel production could be estimated at 1.45 kg CO2eq/kg, since the values for the primary and secondary processes in the UK are reported as 1.66 and 0.73 kg CO2eq/kg, respectively [12].
1.2.2. Chemicals
The chemical industry in the UK is responsible for the synthesis of core end-products for public use such as paints, detergents, and personal care products. It also provides specialised industrial products (e.g., polymers, lubricants, fuel additives, construction materials, and catalysts), and also the supply of transformative products for input in other industries such as organic chemicals, industrial gases, fertilizers, and so on [13]. The chemical industry has, over recent years, emerged as a prominent player in the UK’s economic landscape, contributing over GBP 54 billion in exports and adding GBP 30.7 billion in value to the national economy, as well as employing more than 140,000 individuals [2]. Yet, the industry is the second largest emitting foundation industry in the UK with nearly 14.1 Mt CO2e/year [6]. Despite the variety of the end-products, most chemical products (>90% by mass) are derived from eight primary chemicals, namely ammonia, methanol, ethylene, propylene, benzene, toluene, and mixed xylenes [14]. In the UK, 1 Mt of ammonia is produced per year by synthesis from steam reforming of methane from natural gas and hence releasing approximately 1.19 kg CO2eq/kg of process emissions, as well as 0.64 kg CO2eq/kg from electricity use [13]. For the remaining chemical products, 4 Mt of chemical feedstock is used to produce 2.8 Mt of high value chemical products per year for a total emissions of approximately 2.4 Mt CO2eq/year [13].
1.2.3. Cement
The cement industry in the UK employs around 37,000 people and generates more than GBP 1 billion every year [2]. Cement is a generic term that describes the binder constituent in a cementitious material such as mortar or concrete. It consists primarily of clinker—the output from a cement kiln—and additions called supplementary cementitious materials (SCMs) such as ground limestone, fly ash (FA), and ground granulated blast furnace slag (GGBS) [15]. In 2018, 11 Mt of cement was produced in the UK, 7.4 Mt of which was clinker and 3.6 Mt of SCMs [16]. The production of clinker in the UK releases on average 0.86 kg CO2eq/kg, 50% of which is due to chemical decomposition of limestone and the other half from the fossil fuel used to produce the energy required for the kiln operation [17]. While FA and GGBS are industry by-products from the production of electricity from coal and steel, they are also allocated minor carbon emissions amounting to 0.079 and 0.0001 kg CO2eq/kg, respectively [18]. Accordingly, the average carbon intensity of the cement produced in the UK in 2018 is approximately 0.67 kg CO2eq/kg [18]. The cement industry is the third largest carbon emitting of the foundation industries in the UK with a share of 9 Mt CO2eq/year [19].
1.2.4. Glass
The glass industry is the joint fourth, along with the paper and pulp industry, in terms of GHG emissions among the foundation industries in the UK. The industry, which employs at least 6000 people, contributes more than GBP 1.3 billion to the British economy every year [5]. The industry produces over 3 Mt each year from 25 manufacturing sites in the UK, seven of which are labelled as “small batch specialty glass manufacturers [3]. The majority of glass products are in the form of container bottles and jars for the food and beverage industry (60%), 30% is flat glass used in glazing for the construction and automotive industries, and the remaining 10% is for special use such as fibre glass and medical applications [3]. According to British Glass, the production processes in 2018 resulted in a total GHG emissions of 2.2 Mt CO2eq divided between 1.28 Mt CO2eq from fuel combustion, 0.53 Mt CO2eq from electricity consumption and 0.49 Mt CO2eq as process emissions [3].
1.2.5. Paper and Pulp
The paper and pulp industry in the UK generates more than GBP 11.5 billion in income per annum and directly employs 56,000 people [20]. The industry contributes a yearly share of GHG emissions at approximately 2.2 Mt CO2eq [21]. All emissions are attributed to the fuel and electricity used for the processing of pulp and paper and specifically to generate the steam required for the drying process which consumes two thirds of the energy [22]. The 2018 industry level emissions are already more than 65% less than the 1990 levels and the industry is already moving towards heat recovery and an increased share of biofuel, but more work is needed to reach net zero by 2050 [23].
1.2.6. Ceramics
The ceramics industry in the UK employs around 17,550 people and generates approximately GBP 0.5 billion each year [2]. In 2012, the UK ceramic sector produced an estimated 4.2 Mt of ceramic products divided into four sub-sectors: 90% heavy clay products such as bricks and tiles, 5% for whiteware such as pottery, 4% for refractory operations needed to produce semiconductors, metallurgy, and steel production, and finally 1% for technical or high-performance ceramics [5]. The ceramic industry in the UK is responsible for 0.94 Mt CO2eq/year released by fossil fuel combustion and process emissions and an additional 0.28 for the electricity consumption [24]. The energy intensive nature of the industry is attributed mainly to the clay drying operations and heating up the kilns to temperatures between 800–2000 °C. All of the fossil fuel used for kiln operation in the industry is natural gas [5].
1.3. Decarbonisation Strategies by 2050
Despite the reports suggesting industry-specific decarbonisation strategies such as the use of bio-based feedstock for chemical production [3] and the use of non-clinker based (alternative) cements [25], there is a consensus in the BEIS decarbonisation roadmap for the six industries [5] on five main strategies as follows.
1.3.1. Energy Efficiency
Incentivised by the increasing cost of energy, increasing the energy efficiency of the production processes is considered a very cost-effective decarbonisation strategy [26]. Interventions such as heat recovery, recycling secondary products, improving the thermal insulation of kilns, as well as the use of combined heat and power plants are encouraged widely across the FIs in the UK [3]. However, as Table 1 shows, the margin of improvement in terms of the energy efficiency for production of the UK FIs varies widely. While clinker, paper, glass, and ceramics perform within 15–25% of the best practice, the steel production in integrated sites and ammonia synthesis are both nearly 40% lower.

Table 1.
A comparison between the energy efficiency of the main processes of the UK FIs and the global best practice reported in the literature.
Table 1.
A comparison between the energy efficiency of the main processes of the UK FIs and the global best practice reported in the literature.
| Process | UK Average | Best Practice | Improvement Margin | Reference |
|---|---|---|---|---|
| kWh/kg | ||||
| Clinker | 1.24 | 0.97 | 22% | [27] |
| Blast furnace steel | 7.71 | 4.66 | 40% | [27] |
| Glass | 2.42 | 2.09 | 13% | [3] |
| Fired clay bricks | 1.19 | 1.09 | 16% | [28] |
| Ammonia | 14.29 | 8.08 | 44% | [27] |
| Paper and pulp | 4.63 | 3.43 | 26% | [27] |
1.3.2. Fuel Switching
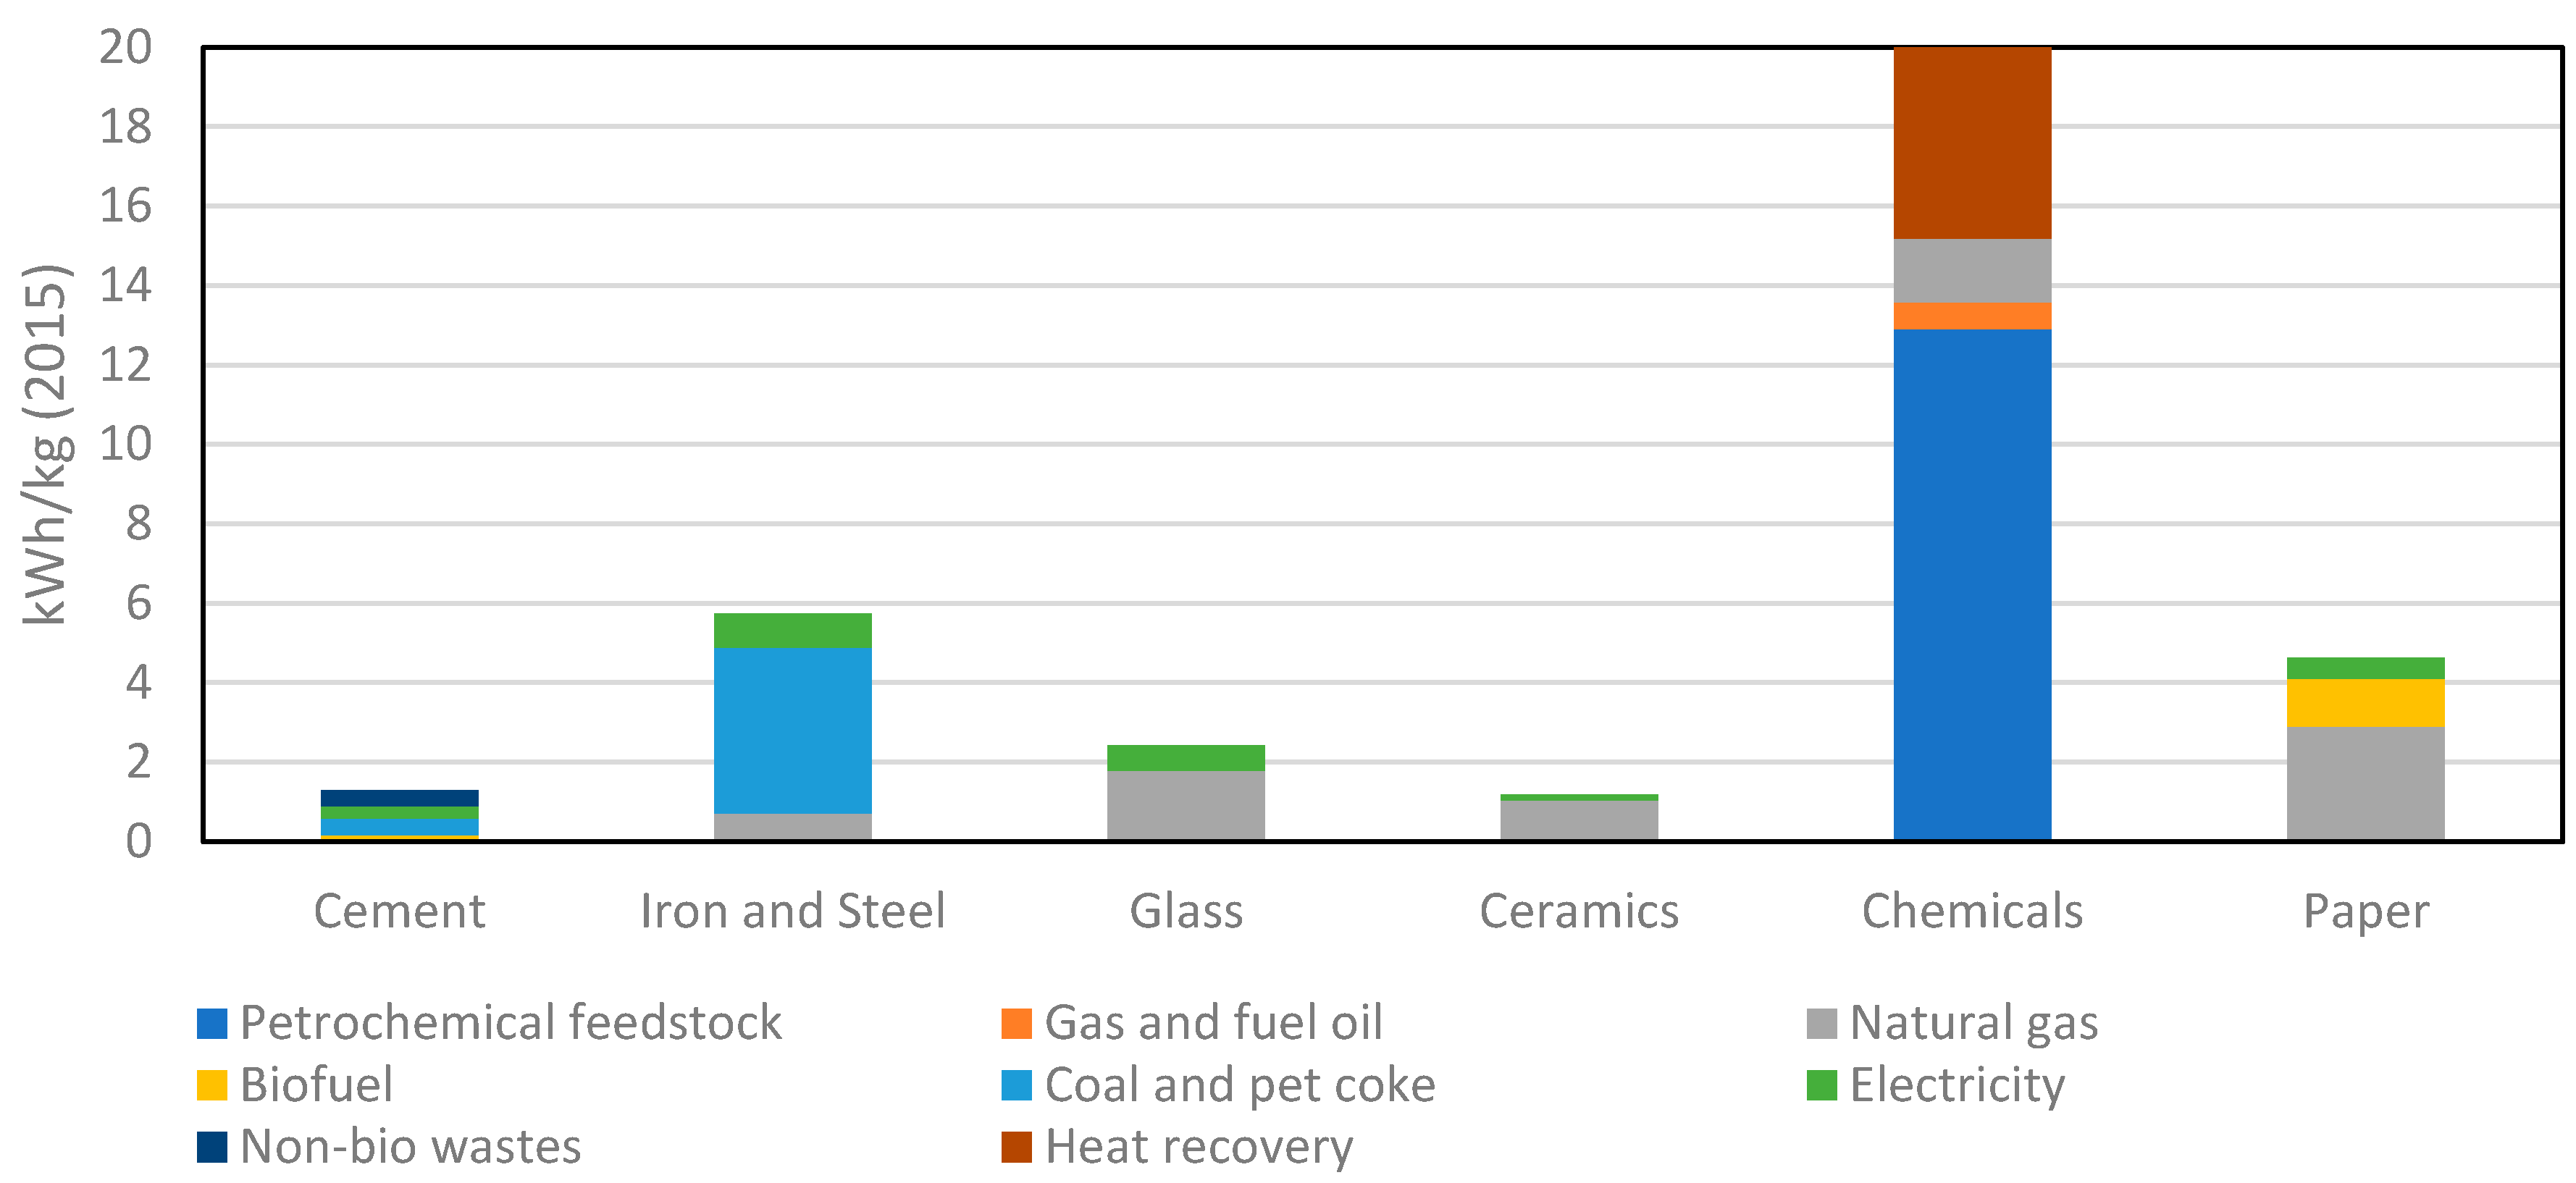
Based on the BEIS baseline assessment of 2015, Figure 3 below shows the breakdown of the energy sources for each of the FIs. It is observed that 60–80% of the fuel used is fossil-based to match the high energy demand and/or elevated temperatures required for the main production processes. Accordingly, a major strategy to decarbonise the FIs is to switch the fuels used from coal and oil to natural gas and from natural gas to biomass/bioenergy, and eventually to hydrogen [3]. The reason is as seen in Table 2, the carbon intensity of biomass, though a range, presents potentially more than 50% savings as a fuel source for the FIs compared to fossil fuels [6,29,30]. However, the carbon abatement of biofuels is sensitive to the source (trees vs. fast growing crops) and transportation distance. Moreover, according to Kaufman et al. [31], the carbon intensity of biofuel could increase from 0.06 to 0.16 kgCO2eq/kWh (similar to natural gas) just by changing the carbon accounting boundary approach from system expansion to mass allocation. In addition, the use of hydrogen is considered a promising future strategy to produce a zero-CO2 fuel, assuming a fully decarbonised electricity grid and transportation [32].

Figure 3.
The fuel mix used for energy production for each of the FIs in 2015 [5].
Table 2.
A summary of the carbon intensity of the fuels used in FIs from 3 different literature databases.
1.3.3. Process Electrification
Another energy-related strategy included in the roadmaps is to shift the process of providing heat energy from fuel combustion, which is responsible for 70% of the total FIs GHG emissions, to electricity. Technologies such as electric heat pumps, induction heating, or microwaves have been prototyped for the paper, ceramics, and cement industries, respectively [33]. A more established technology for process electrification is the shift of steel making from primary blast and basic oxygen furnaces to recycling steel in electric arc furnaces given the availability and quality of the scrap steel [34].
1.3.4. Carbon Capture and Storage (CCS)
Carbon capture and storage (CCS) is a process in which a relatively pure stream of carbon dioxide from industrial sources is separated, treated, and transported to a long-term storage location. It is considered by all industrial decarbonisation roadmaps to be a necessity to achieve net-zero by 2050 [35]. The apparent suitability of the technology to abate process emissions makes it even more suited for cement, steel, and chemicals sectors, as seen in Figure 4 below from the BEIS roadmap [5] for the FIs in the UK. The UK government has established a Carbon Capture and Storage Infrastructure Fund (CIF) with a GBP 1 billion budget to expedite the technology maturity and implementation [36].

Figure 4.
The decarbonisation potential expected for each FI in 2050 from the use of CCS technologies (the % represents the share of the total decarbonisation from all strategies in the BEIS roadmap in 2015).
1.3.5. Production and Demand Reduction
An important decarbonisation strategy is to reduce new materials production through three layers of primarily behavioural changes from different stakeholders that reduce demand including: (1) increasing the material utilisation through the efficient use of the product in its application such as carpooling to reduce the need for individual cars or changing the specs of the packaging to make it lighter; (2) making more durable materials and products that could last longer such as domestic buildings and paper products; and (3) increasing the material efficiency in production by fit-for-purpose designs and specifications [32]. Despite being a pivotal part to achieve net-zero in the literature [12] the UK government decarbonisation roadmaps attribute only minimal potential to it [5].
1.4. Critical Analysis of Decarbonisation Roadmaps
In addition to the production and demand reduction strategy, all remaining decarbonisation strategies depend on a degree of technological advancement and capital investment and hence could be labelled as “high-tech”. Since the 2015 FIs decarbonisation roadmaps were issued, several publications criticised the feasibility of achieving a high-tech-based decarbonisation route for the FIs for the following reasons.
1.4.1. Technological Barriers
According to the International Energy Agency (IEA), Technology and Market Readiness Levels (TMRLs) are a semi-quantitative measure of technological and market maturity for innovations [29]. The metric is divided into 11 levels where at level 6 a large lab-scale prototype is developed, at level 9 the solution is commercially available minimally and marginally, and only at level 11 is the innovation mature and of “predictable” growth levels [29]. For green (net-zero) hydrogen, in addition to the few industrial trials in Germany and South Korea, there are yet to be found a market with major successful commercial-level production of it and hence the TMRL is set at level 9 [37]. Accordingly, the IEA predicts no industry use of green hydrogen by 2050 [32]. Similarly, the TMRL level for CCS is also at level 9 since only one electrical power plant is reported to operate with CCS in Canada [12] and a few cement plants have minimal CCS capacities globally [38]. The uncertainty around the maturity of both decarbonisation strategies in the coming few years is significant in assessing their decarbonisation potential by 2050.
1.4.2. Economic Barriers
While energy efficiency strategies are reported to have a pay-back period of about 2 years, cash flow problems and risks associated with inflation and energy costs discourage most industrial plants from pursuing it [32]. Moreover, despite being technologically feasible such as the switch to electric arc furnaces for steel production for example, the expansion in electrification of the energy intensive industrial processes is associated with significant increase in the electricity grid, which would result in EAF steel producers paying four times the carbon tax compared to blast furnace steel producers [10]. Additionally, the generation of electricity from green hydrogen is priced at 0.053 GBP/kWh by 2050, which is more than double that of the projected prices for (0.02 GBP/kWh) natural gas and (0.026 GBP/kWh) solar energy [39]. Finally, the current estimated cost for carbon abatement using CCS technologies ranges between GBP 50–100/kgCO2eq, which is at least double the projected carbon tax [40].
1.4.3. Resource Limitations
The third pillar of the critical views on high-tech strategies for decarbonising the FIs is the availability of resources. Admitting the interconnectivity between the three barrier types, the resource limitation is meant to infer the boundary of natural resource, which applies more to the fuel switching to biomass. In order to increase the biomass portion of the fuel mix to 10% by 2050 rather than the current 7%, 1 million hectares land are to be allocated for energy crops, which is approximately 7% of the current agricultural land, while simultaneously increasing the rates of tree planting to 50,000 hectares/year [41]. Additionally, the ability to meet the forecasted demand of bioenergy depends upon importing biomass for fuel at competitive prices, as well as the recovery of local biowastes, which are considered less reliable sources [42]. To conclude, significant uncertainties are included in the resource-based projections for the supply of biomass as fuel for UK FIs by 2050.
1.4.4. Contradicting Decarbonisation Vectors
Another point of discussion from the literature is that development of the high-tech strategies will interact, often in contradictory ways. One example is that the electrification of the processes, as well as the use of electricity for green hydrogen production present a burden on the expansion of the electricity grid, which itself is required to decarbonise using CCS and/or biofuel [43]. In another example, the carbon abatement potential of biofuel use rests upon sustainable sourcing principles, as well as the assumption that the alternative fuel sources it would displace (and from which it thus gains much of its low-carbon credentials) by 2050 are fossil fuels without CCS, which contradicts other decarbonisation strategies [42].
1.5. Aims and Objectives
This state-of-the-art review of the decarbonisation strategies in the UK FIs roadmaps attributes the risks of high-tech strategies to three main barriers: technological, economic, and resource limitations (Table 3). However, two main gaps exist that constitute the main objectives behind this paper:
- How much should the production of each of the six FI products be reduced to accommodate for the aforementioned barriers?
- What are the interventions (e.g., reducing demand) that enable such production reduction in each FI and what could be the barriers facing each?
Table 3.
A summary of the type of barrier attributed to each of the high-tech decarbonisation strategy mentioned in the FIs roadmaps.
Table 3.
A summary of the type of barrier attributed to each of the high-tech decarbonisation strategy mentioned in the FIs roadmaps.
| Technological Barriers | Economic Barriers | Natural Resources Limitations | |
|---|---|---|---|
| Energy efficiency | x | ||
| Electrification | x | x | |
| Fuel switching | x | x | x |
| CCUS | x | x |
2. Methodology
The method adopted in this study is a cross-industry decomposition analysis where the baseline projections of the energy demand and carbon intensity of each of the 6 FIs is modelled using the benchmark values from BEIS roadmaps [5]. Using the data from the decarbonisation roadmaps, the carbon abatement potential by 2050 from each of the 4 high-tech scenarios is modelled and analysed (electrification, green hydrogen, biofuel, and CCS) for all FIs combined. For the 2050 decarbonisation scenario, two sub-scenarios are developed; where energy efficiency measures are either assumed to be fully implemented in all FIs, or no efficiency measures are adopted.
The carbon abatement potential by 2050 for each of the high-tech strategies assumes a certain capacity (energy production from biofuel, carbon uptake through CCS, increase in electricity supply to the industry, and energy supply using hydrogen). Hence, for each of the modelled scenarios, the total carbon abatement potential by 2050 of each of the 4 high-tech strategies is compared against the expected capacity in the UK 6th carbon budget [44]. Accordingly, the degree of production and demand reduction is calculated for each FI to lower the expected carbon abatement potential from high-tech strategies to the match the established limits. Finally, a qualitative assessment is performed on the potential barriers facing the aspired-for reduced production levels in industry.
3. Results and Discussions
3.1. Baseline Projection by 2050
The Climate Change Committee is an independent, non-departmental public body, formed under the Climate Change Act to advise the United Kingdom on tackling and preparing for climate change. Every three years, a new budget is issued to monitor the progress of the UK government in meeting the climate change targets. The latest budget, the sixth, presents an 80% reduction compared to the 2020 carbon emissions as the target for the moderate (1.5 °C) mitigation scenario by 2050. For the business-as-usual scenario, constant market demand is assumed and hence the carbon intensity of each of the six foundation industries, hence the carbon intensity should be reduced by 80%. It is worth noting that, due to the fuel dependant nature of the foundation industries, the full decarbonisation of the industrial electricity grid would only achieve 5% of the decarbonisation targets by 2050 as shown in Figure 5.
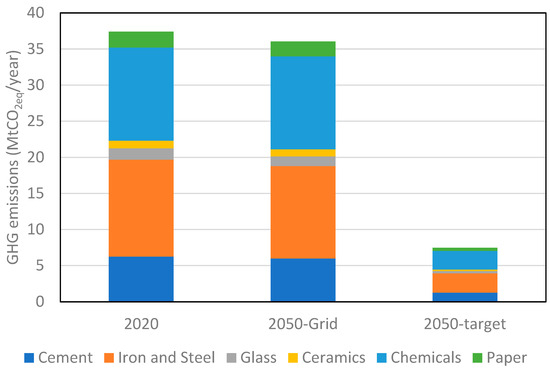
Figure 5.
The carbon intensities of the 6 foundation industries for the business as usual, decarbonisation of electricity and moderate mitigation target by 2050.
3.2. Decarbonisation of the FIs in the UK by 2050
3.2.1. Realistic Cap for High-Tech Strategies
The main objective of this paper is to challenge the carbon abatement potential for the four high-tech strategies listed in the decarbonisation roadmaps of the six foundation studies. As stated in the introduction, fuel switching to biofuel, the use of hydrogen fuel, electrification of processes, and CCS are still immature technologies as of 2020 [12]. However, the high-tech decarbonisation potential values could only be qualitatively challenged as there are no established methods in the literature through which new estimates could be generated. Hence, this paper utilises the % of resource availability of each of the four strategies in the sixth Climate Change Committee (CCC) carbon budget [44] as the cap for their respective projections for carbon abatement by 2050.
The CCC carbon budget considers the manufacturing and industry sectors combined when reporting the abatement potential from different strategies. However, the allocation method explained in the methodology section of the sixth carbon budget [44] shows that share of the manufacturing industry is 40% of this category. For ease of calculations, this paper assumes that the six foundation industries represent 100% of the manufacturing industry, which is a conservative assumption. Accordingly, a comparison between the resource availability values from the decarbonisation roadmaps for the FIs [5] and the projected values from the sixth carbon budget [44] is shown in Table 4. The total CCS capacity from direct processes in the UK is projected by the sixth carbon budget to be 8 Mt CO2eq while the roadmaps allocated an abatement potential of 14.3 Mt CO2eq by 2050. Similarly, realistic projections for energy generation biofuel and hydrogen by 2050 are referenced in the sixth carbon budget as 20 and 0 TWh/year, respectively, which is lower than the 26 and 1.8 TWh/year values from the roadmaps. Moreover, the expected increase in electricity supply to the manufacturing industry in the UK represents only 22% of the projections in the roadmaps.
Table 4.
A comparison between the sustainability potential values for each of the 4 high-tech strategies from the 6th carbon budget and the 2015 BEIS decarbonisation roadmaps for the 6 foundation industries.
3.2.2. High-Tech Scenario for 2050
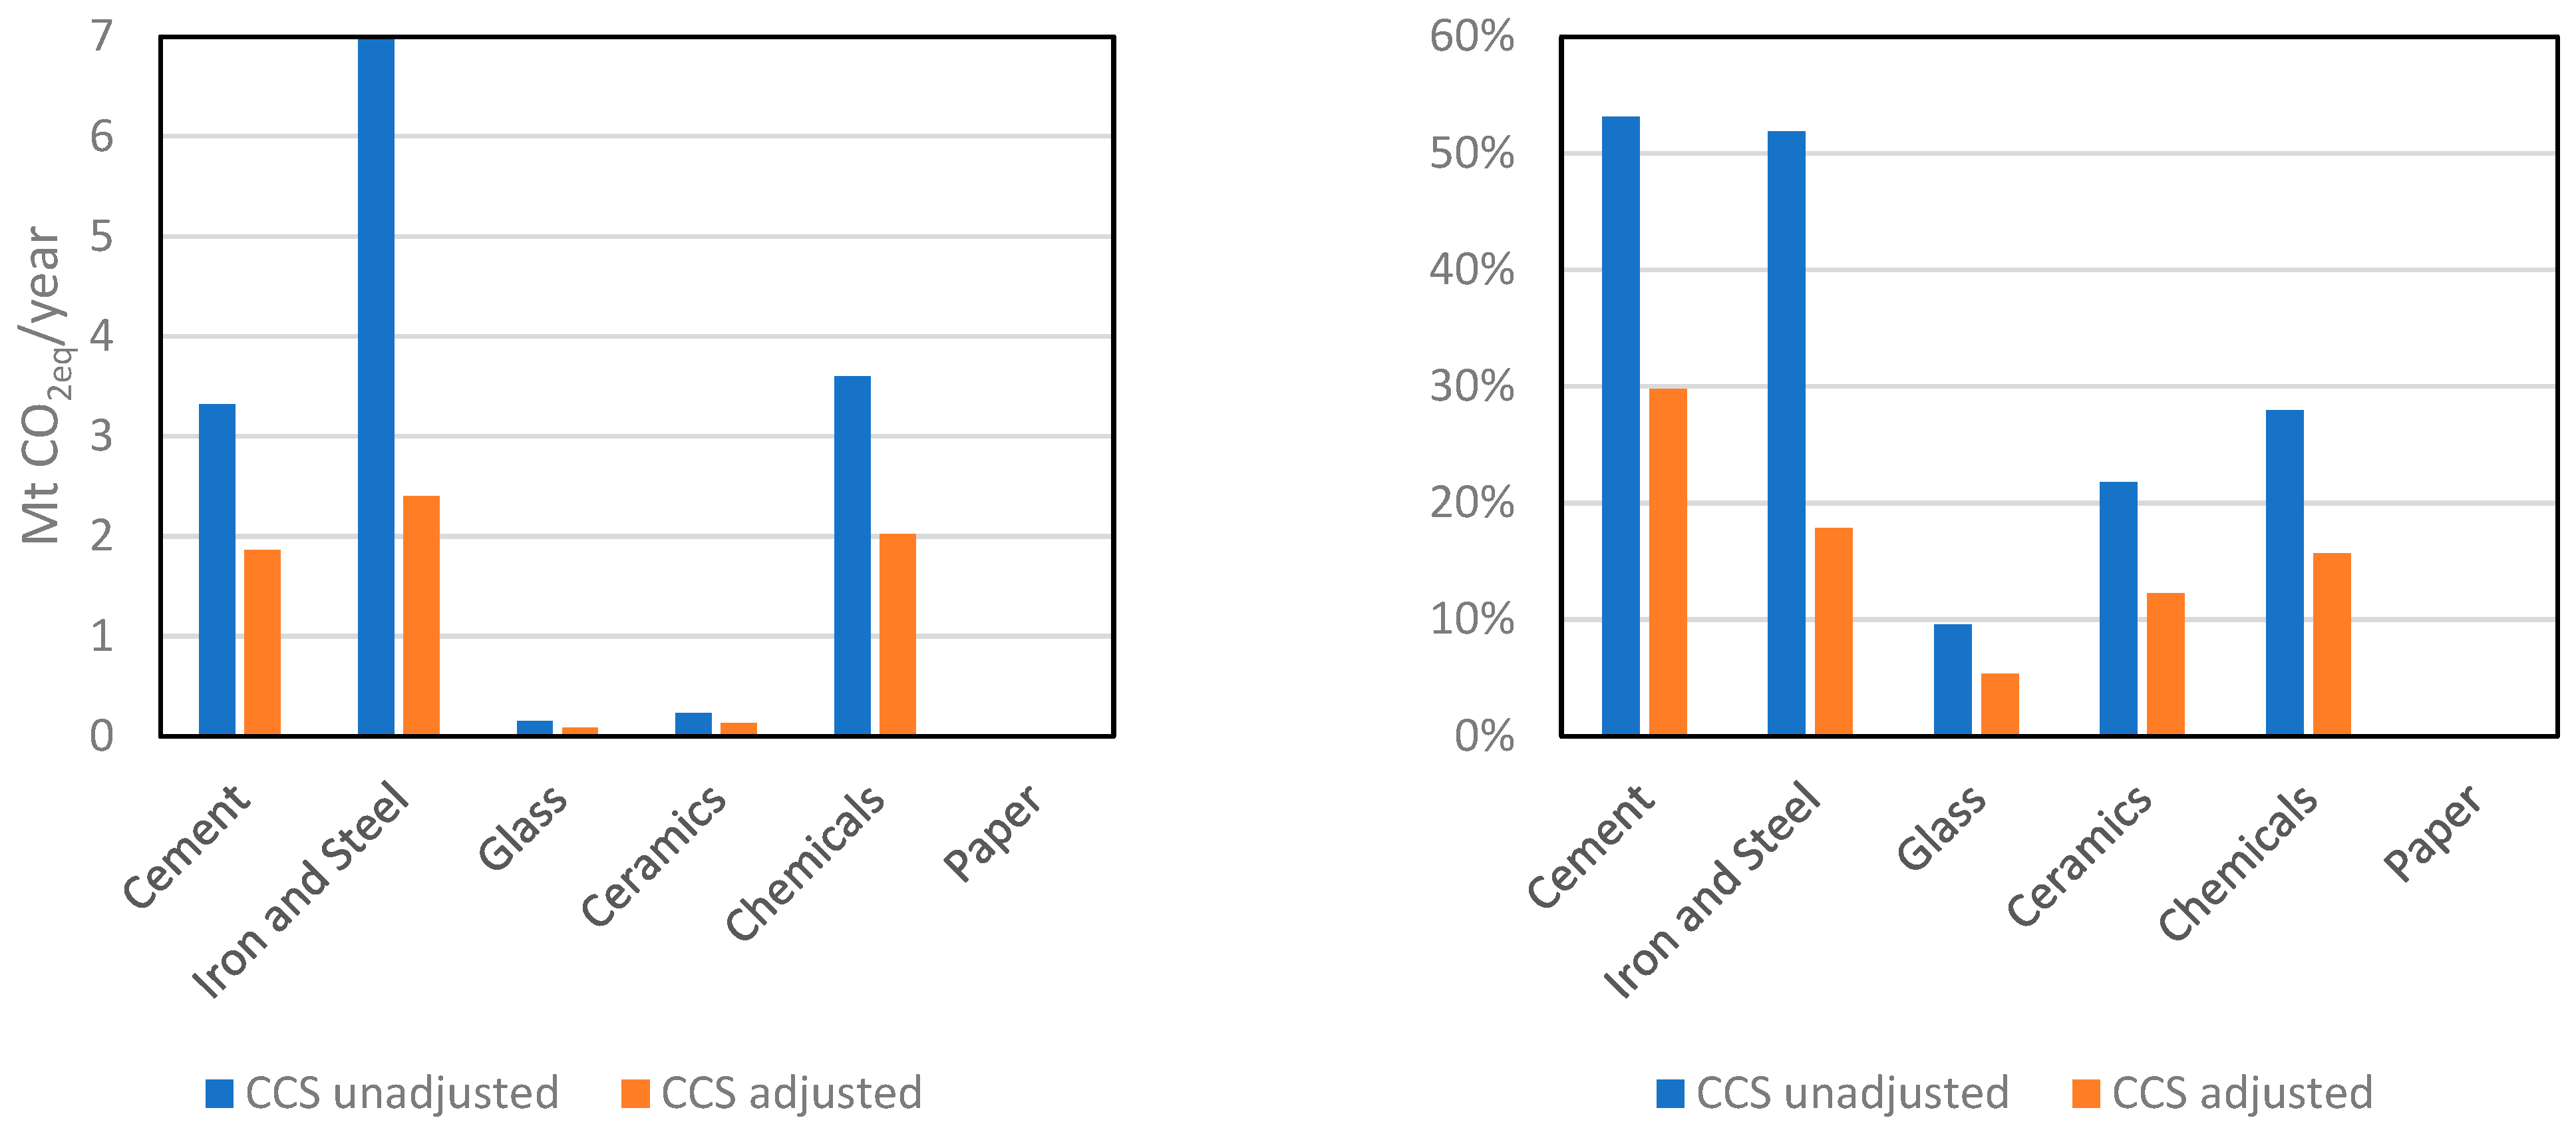
The fuel mix and CCS potential for each of the six FIs was updated based on the sixth carbon budget projections for the “cap” on the decarbonisation potential from high-tech decarbonisation strategies by 2050. The carbon abatement degree by 2050 using CCS technologies was reduced by an average of 50% as shown in Figure 6. In addition to the argument on the resource availability of CCS potential within the sixth carbon budget, the adjusted CCS abatement degrees should be communicated to the respective sectors since it is established in the literature that allocating the majority of the decarbonisation potential to CCS is risky due to the technology readiness level, high investment cost, the absence of infrastructure, and the risk of carbon leakage [32].

Figure 6.
A comparison between the yearly GHG reduction required by the roadmaps in Mt (left) and in % of industry emissions (right) before and after adjustment to the cap in the 6th carbon budget.
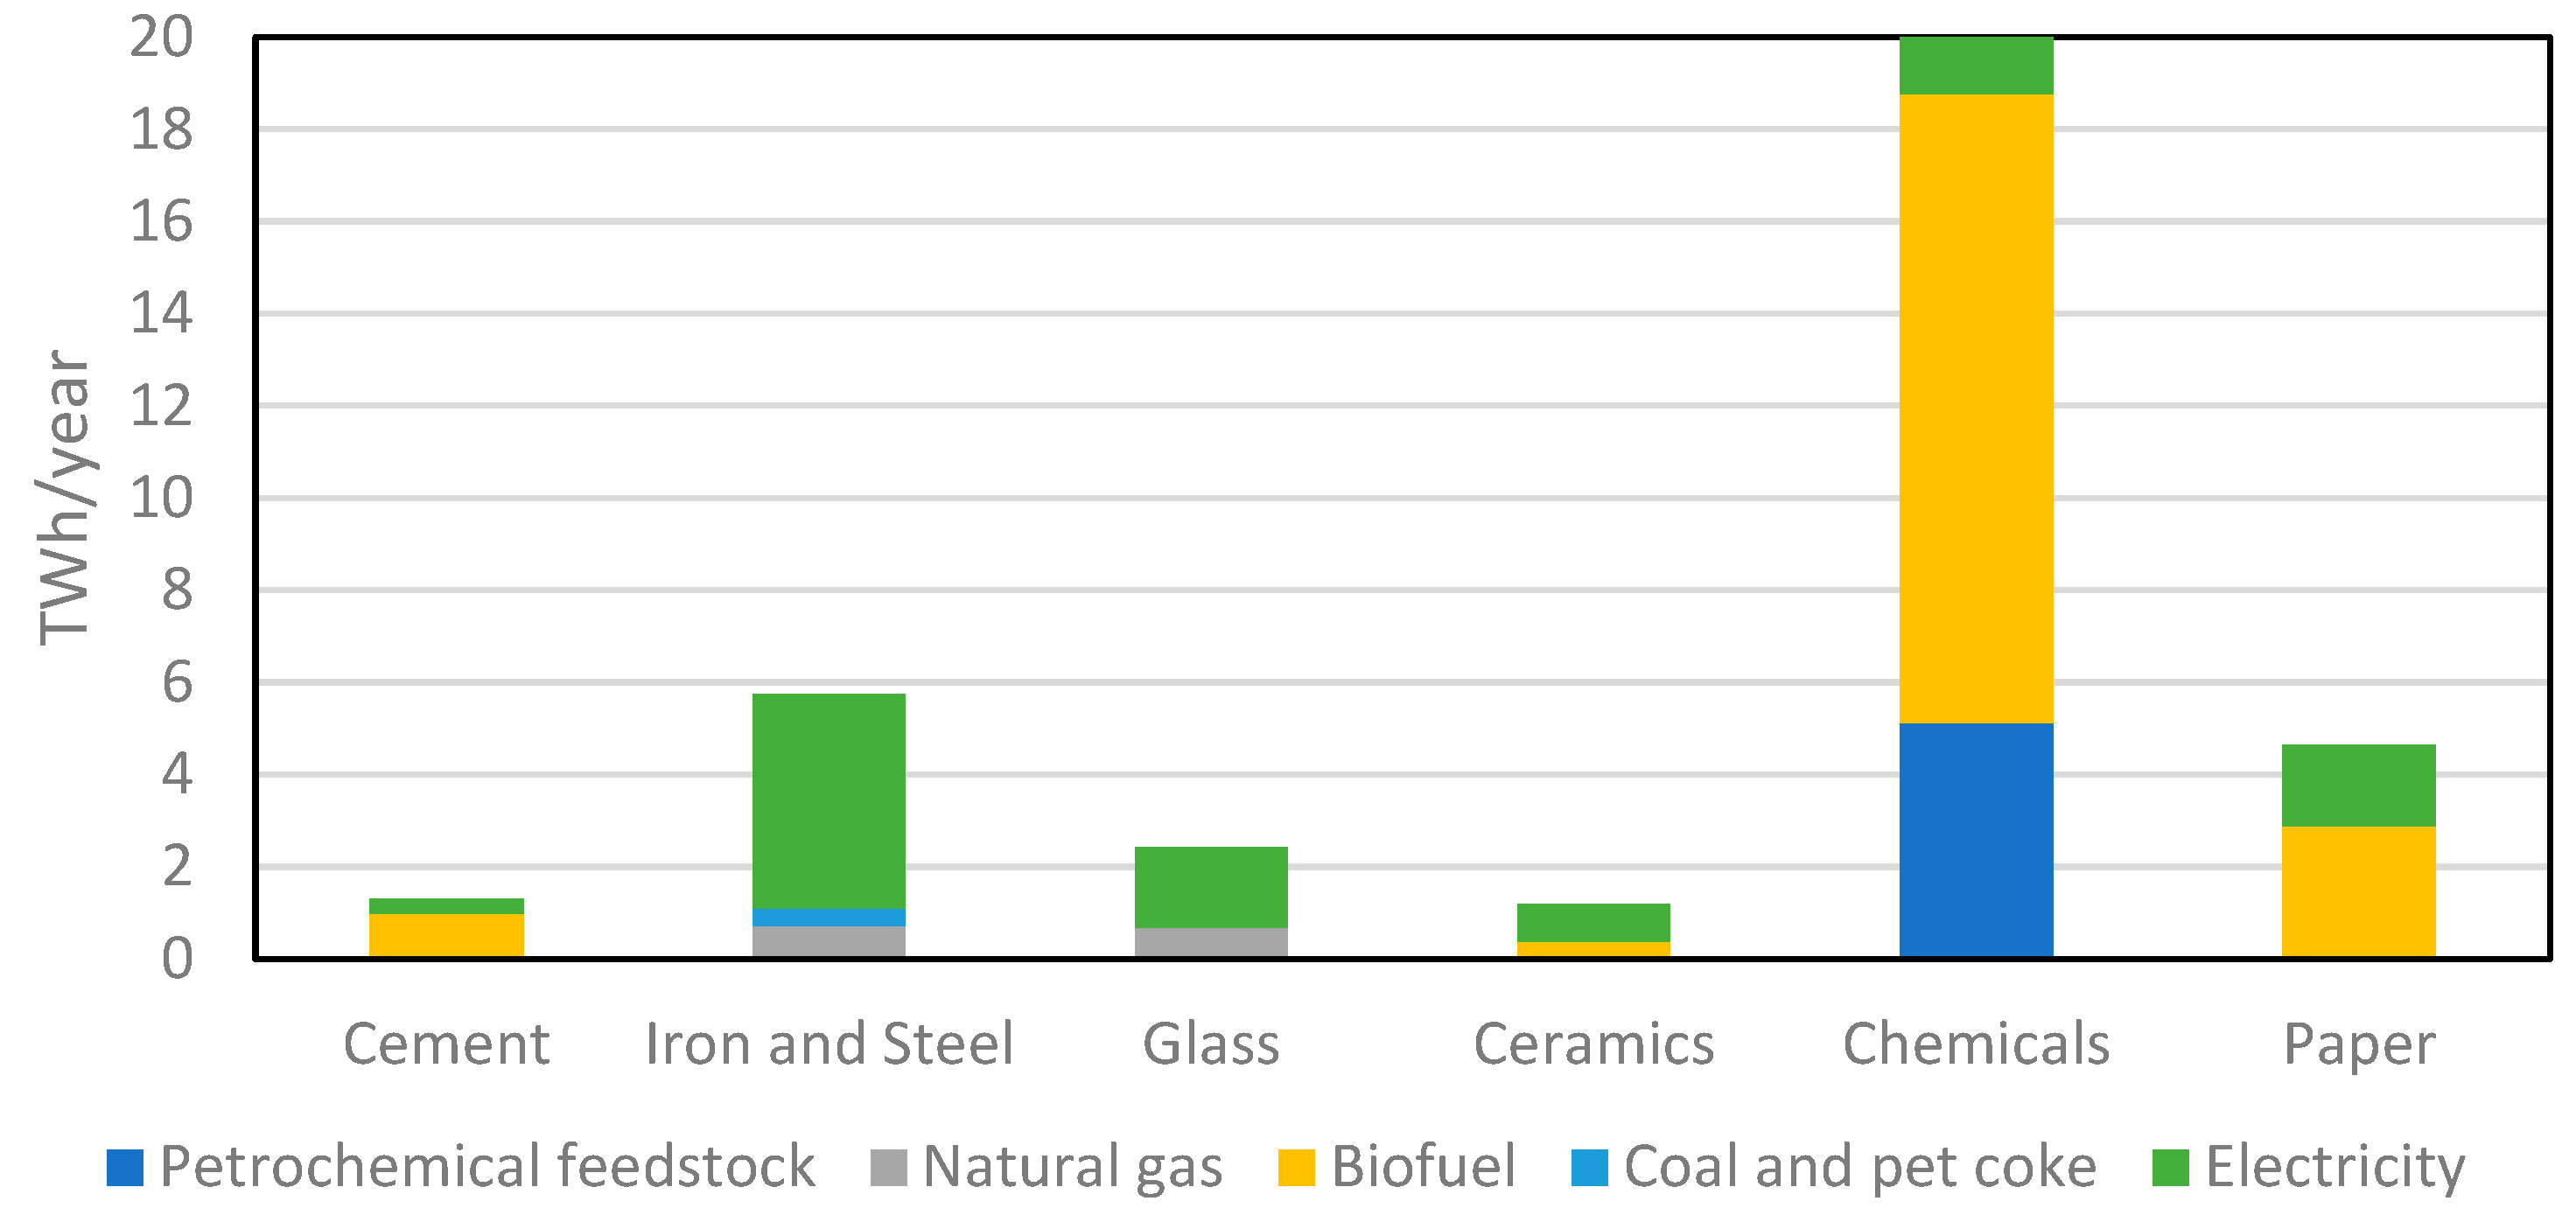
Additionally, as shown in Figure 7, the scenario eliminates to a great extent the need for hard and gaseous fossil fuel sources and prioritises the use of biofuel. Accordingly, the ability to achieve the carbon targets by 2050 are mainly dependent on the carbon intensity of the biofuel used. While some studies report significant social risks associated with the increase of harvesting biomass for fuel use due to its competition over land use with agricultural crops [45], there are others that more interestingly question the carbon benefits of using biofuel at the expected scale. According to Konadu et al. [46], the carbon benefits of using biomass for fuel in the UK is dependent on two main factors: that the source is either biowaste or locally produced fast-growing crops. Hence, due to the rapid expansion required to supply biomass at scale in 2050, Hammond and Li [47] argue that most of the biofuel would be imported and would not be limited to short-cycled crops which results in an accrued carbon intensity higher than that of natural gas.

Figure 7.
Updated energy demand for each FI in 2050 according to the “realistic” fuel switch share of biofuel.
3.2.3. Production and Demand Reduction Levels
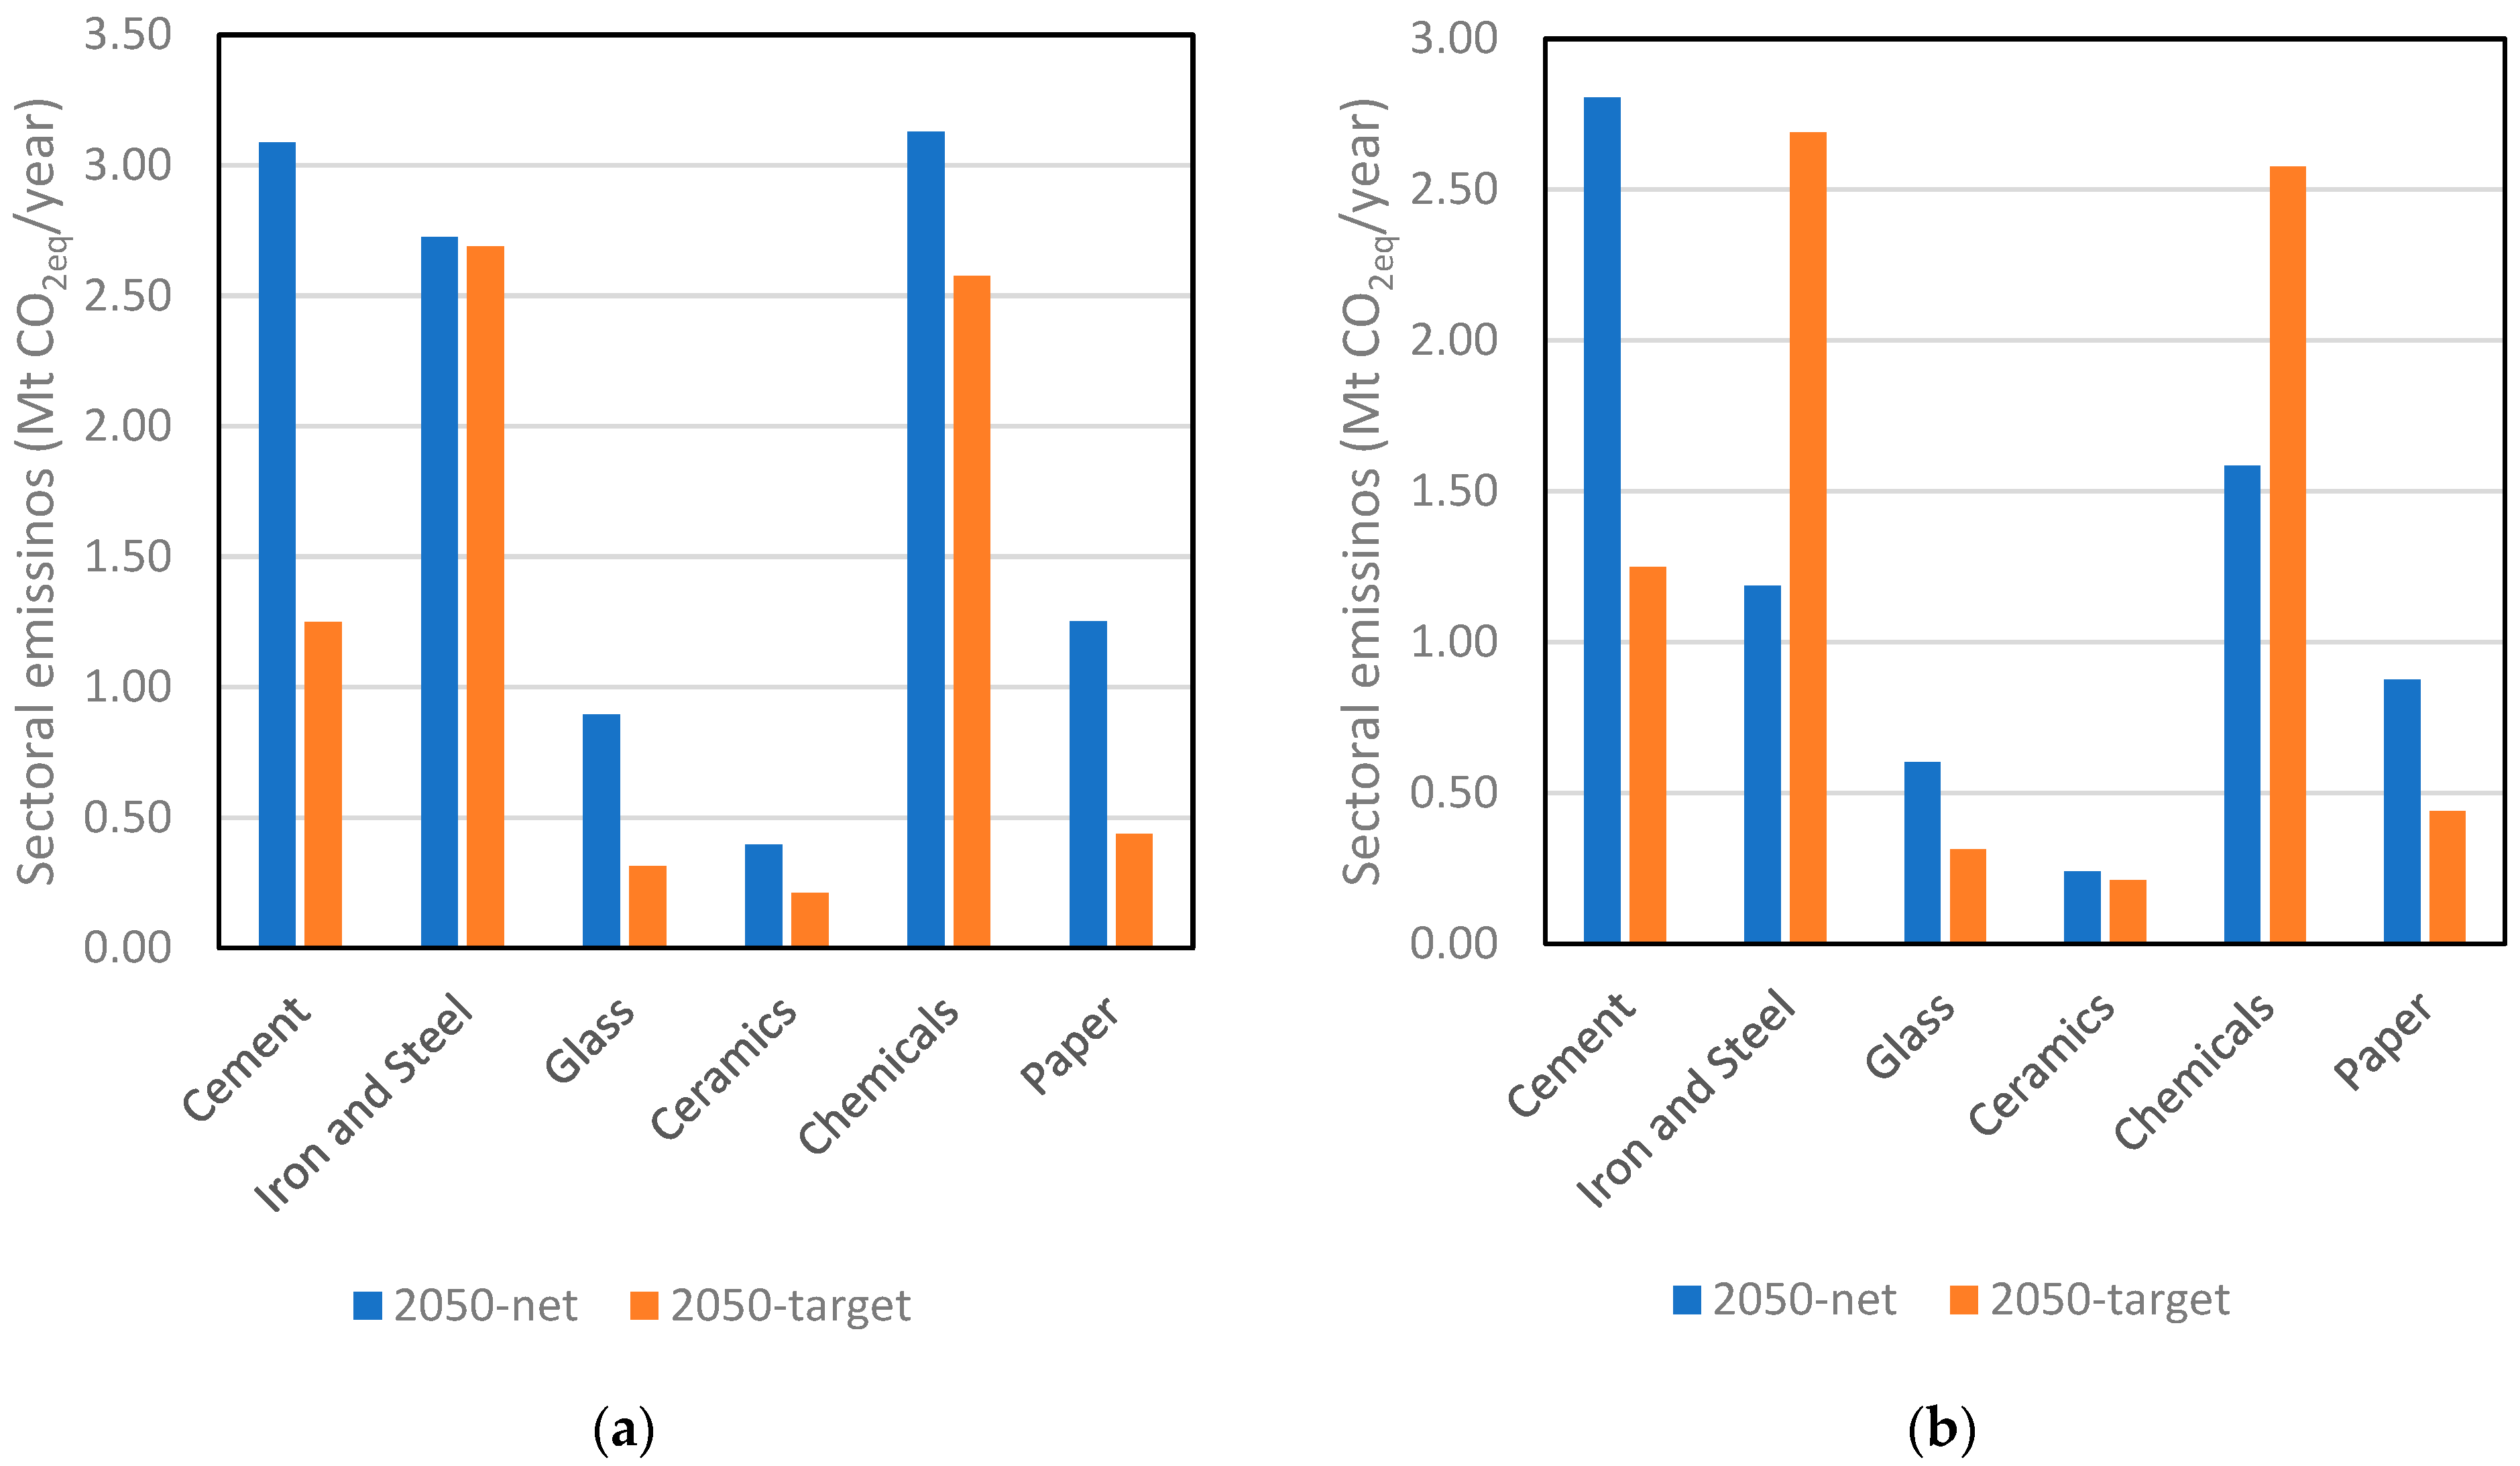
Upon adjusting the projected values for the high-tech interventions to decarbonise the FIs by 2050, the carbon targets were normally not met and hence reduction in production and demand is required to match the required abatement levels by 2050. However, the degree of production reduction is dependent on two parameters. First, the degree of reduction in the energy intensity in each of the six FIs due to the projected interventions to improve the energy efficiency of the production processes. As seen in Figure 8, the BAU (Figure 8a) scenario where thermal efficiency strategies are not implemented, show that only the chemicals and steel sectors are matching the 2050 carbon targets. For cement, glass, ceramics, and paper, 20–60% production reduction is required. The reason is mainly due to the adjusted CCS abatement values for 2050 which are less than the residual fuel-based emissions. However, as shown in Figure 8b, the production reduction required after the implementation of 30% reduction in energy intensity is marginal for all FIs except cement where process emissions (not energy related) still exceed the adjusted CCS abatement potential by 2050.

Figure 8.
A comparison between the net yearly carbon emissions from the FIs in 2050 after implementing the high-tech strategies versus the target (80% less than 2020) emissions before (a) and after (b) implementing the 30% reduction in energy intensity using thermal efficiency strategies.
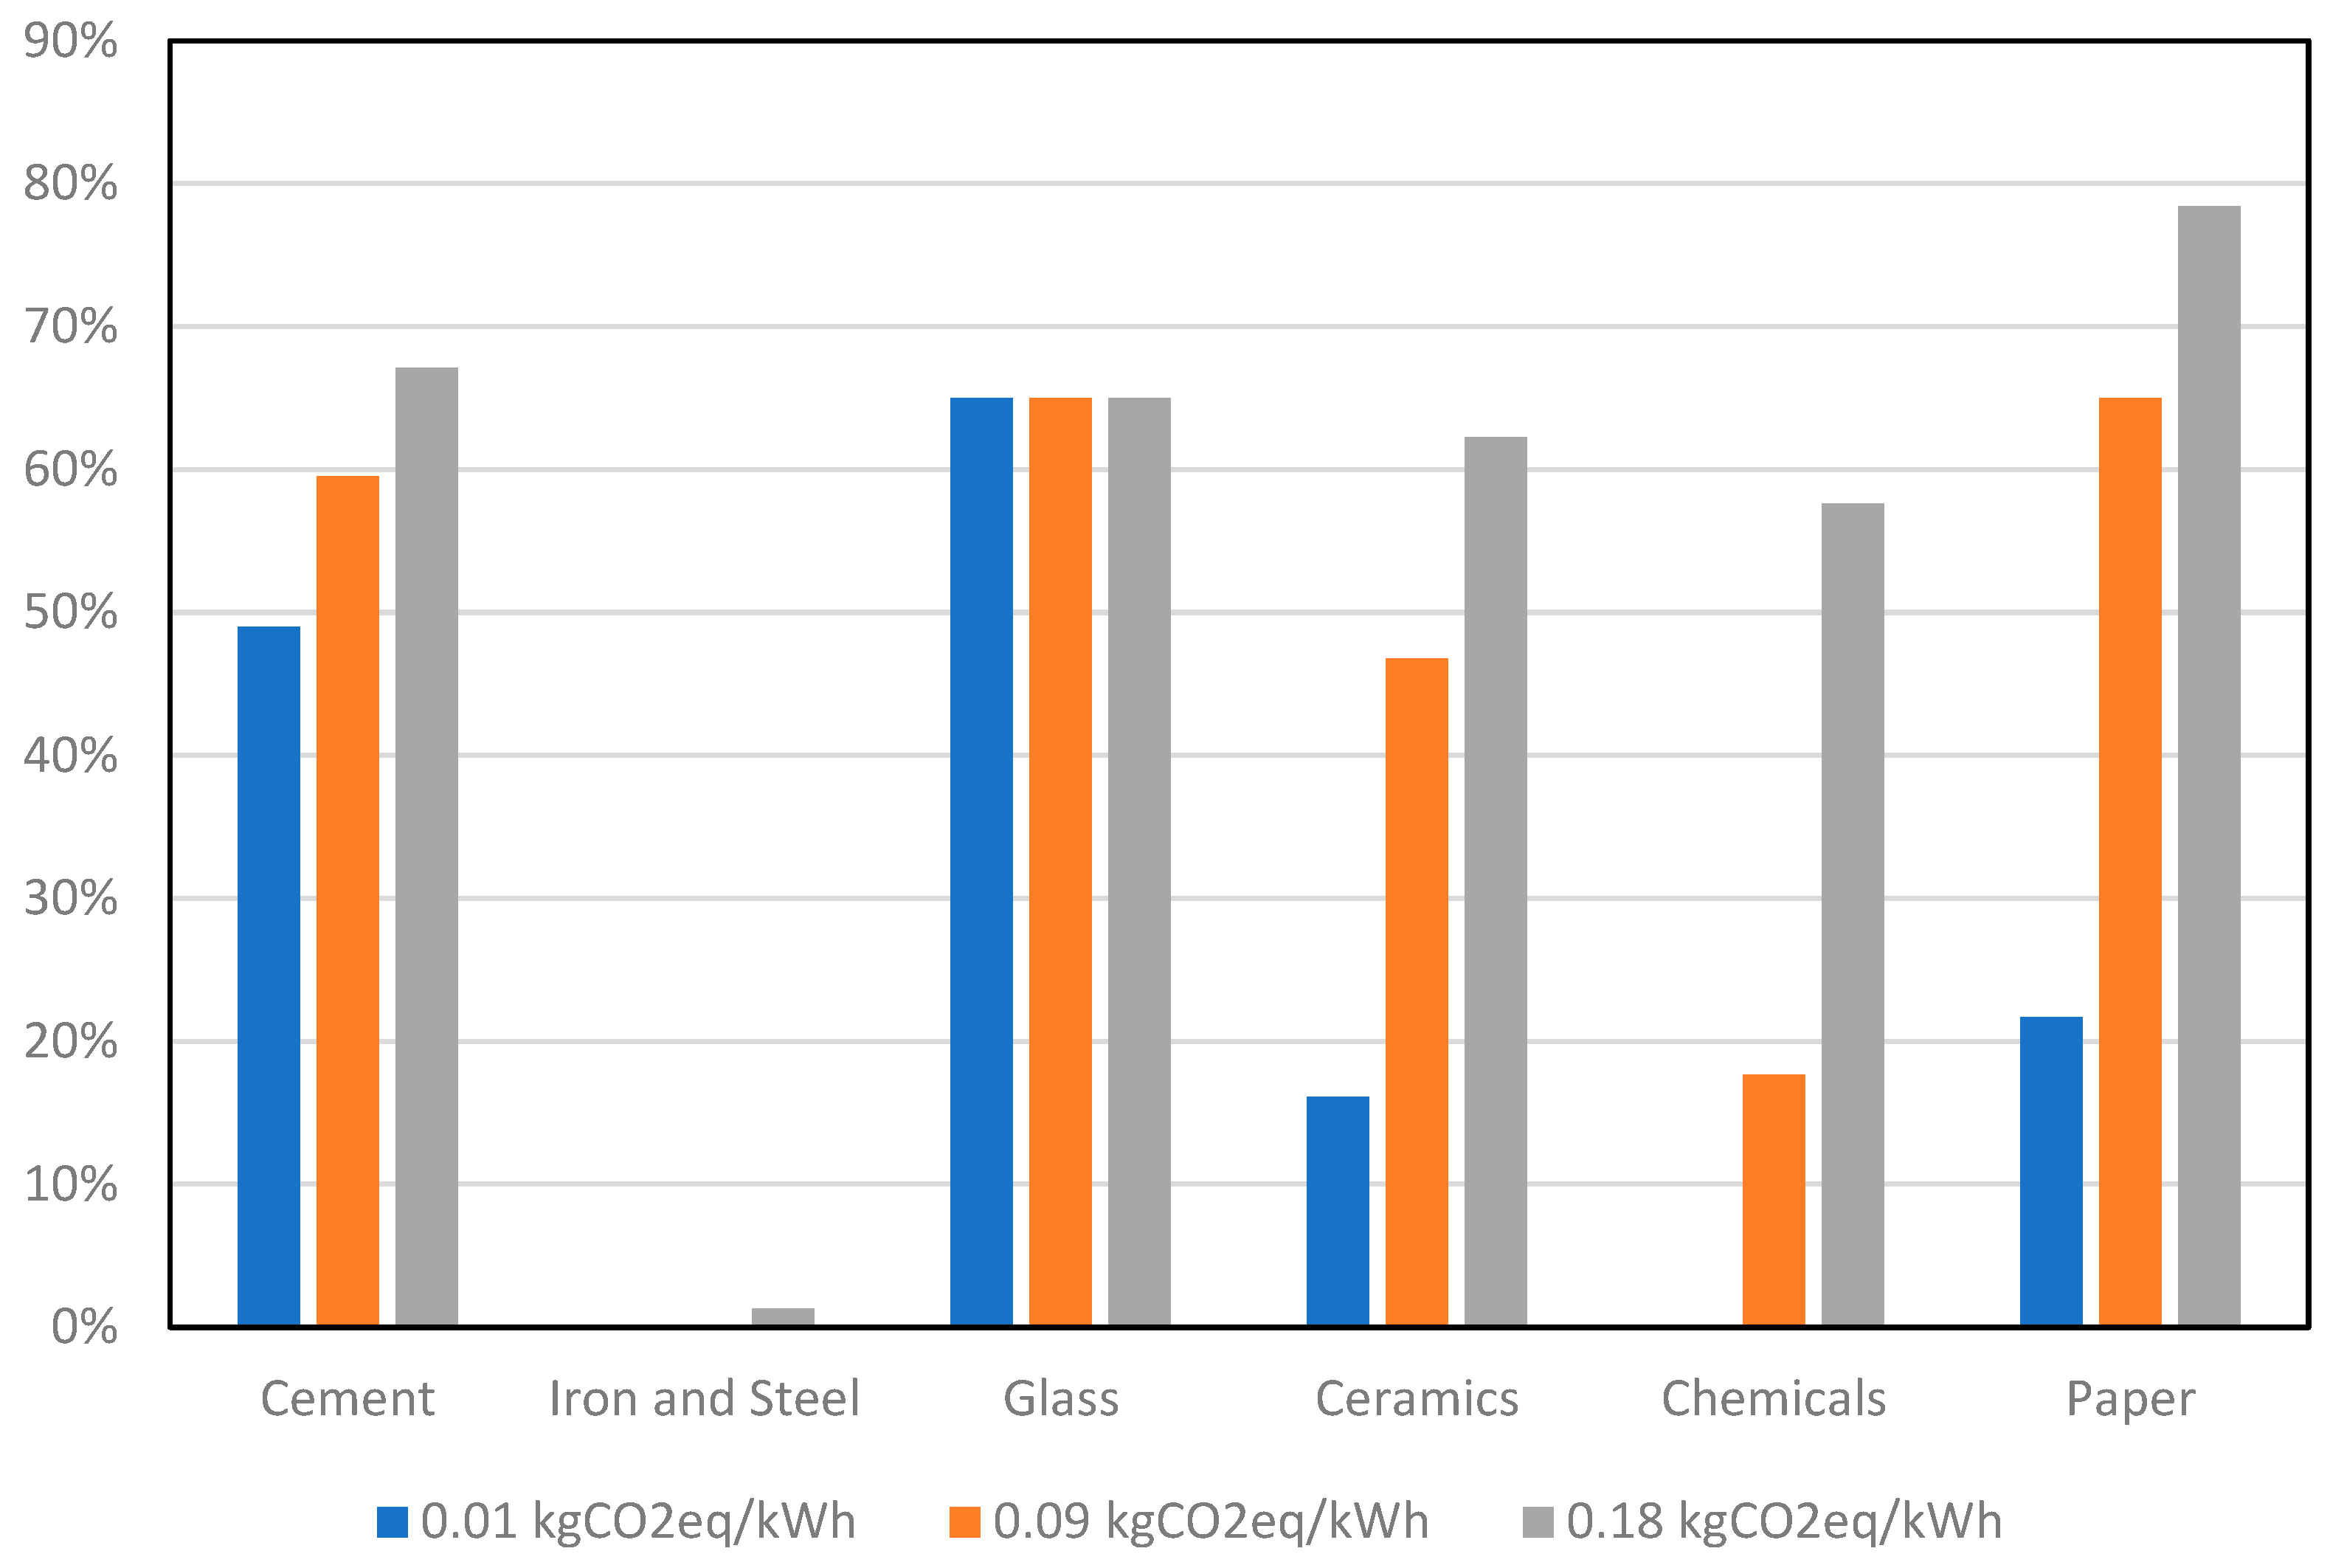
The second factor that impacts the degree of production reduction required to allow the FIs to achieve the carbon targets by 2050 is the carbon intensity assumed for the biomass used as biofuel. As explained from the literature findings, the source, calorific content, and transportation distance are all factors that impact the carbon intensity of biofuel and could be detrimental to its decarbonisation potential. Hence, as shown in Figure 9 below, the production reduction for paper, ceramics, and chemicals is very sensitive to the change of the carbon intensity of biofuel since a significant share of the fuel used for the high-tech scenario in 2050 in their production is biofuel. On the other hand, the remaining three FIs are less sensitive due to the dependence on electricity (glass and steel) or fossil fuels (cement) for their production. It is worth noting that cement is also less sensitive due to the process emissions associated with the clinker production process regardless of the energy source.

Figure 9.
Production reduction ratios for each FI by 2050 to achieve carbon targets depending on the assumed carbon intensity of the biofuels used.
It is worth noting that in both scenarios, the iron and steel industry is projected to match the 2050 targets under the assumption that 80% of the 2020 production would shift to electric arc production while accounting for an additional abatement through CCS of 2.3 MtCO2eq/year. However, this is dependent on the availability of scrap steel (EAF is primarily a recycling process) at the desired product quality. Currently, it is estimated that approximately 80% of the scrap steel generated in the UK is exported [48]. Projections from [12] conclude that enroute to 2050, scrap steel availability would only cover 60–70% of the current consumption and hence 30–40% of production and demand reduction is a must to meet the industry’s carbon targets.
3.2.4. Production and Demand Reduction Applications
Policies and subsequent industrial action towards demand reduction is already materialising in the UK for reducing meat consumption by adopting plant-based solutions [48] and retrofitting houses for less energy consumption for heating purposes [49]. The next paragraphs include examples from the literature showcasing demand reduction strategies in each of the FIs to achieve the aspired production reduction potential.
Iron and Steel
In addition to demolition, most of the scrap steel is generated from manufacturing processes such as vehicles and machinery and hence new technologies such as additive manufacturing could not only reduce the need for steel by optimising the design but also reduce the scrap generated in the manufacturing process by 20–30% [12]. Despite the logistical issues of storage and matching sellers with buyers, recent reports advocate the reuse of demolished structural steel members in new construction in the UK [50,51].
Chemicals
Demand-side interventions in the chemical industry span between end-products such as plastic packaging for recycling or substituting with bio-based alternatives and input from other industries such as fertilizers where reduction of demand is recommended through conservative use and controlling ammonia volatilisation [52].
Cement
In the UK, 80% of the cement produced is used in concrete, of which 60% ends up in buildings [19]. Judicious selection of the slab system and span width could reduce the concrete required in a building up to 30% [53]. Moreover, the use of advanced software packages could help optimise the structural design of a building and further reduce concrete demand by up to 30% [54].
Glass
The glass industry in the UK is already excelling at a 70% recycling rate for containers but is aiming at achieving 90% by 2040 [55].
Paper and Pulp
The environmental and cost savings from recycling paper and pulp products are not consensually agreed, but it is established that recycling one ton of paper conserves over 2.52 cubic meters of landfill space and 17 trees [56]. Accordingly, the UK is aiming at increasing the current recycling rate of paper and board as well as paper packaging from 70% to 90% [57].
Ceramics
There are successful documented trials to reduce the energy demand for producing ceramics by incorporating waste materials in the feedstock as well as attempts to reuse end-of-life roof tiles and bricks [58].
3.3. Discussion Points
Finally, it has now been established that production and demand reduction, with varying degrees, is a necessary strategy for all FIs to achieve their 2050 carbon targets. However, several challenges exist, confronting the industries’ ability to achieve, at the desired scale, this reduction as follows.
3.3.1. Consumer Behaviour
Users are reluctant to shift from their perceived notion of a certain product, whether it is by accepting a new shape (topologically optimised to reduce weight) or a shift to more sustainable products (the adverted shift away from meat to plant-based substitutes) unless clear environmental benefits are communicated and economic incentives are presented [59]. While it proved successful in reducing single-use plastics by 80% in Europe, the precedence of the tax on plastic packaging is not necessarily helpful for future case studies as it is now common knowledge that the substitution achieves minimal savings in terms of GHG emissions [60,61].
3.3.2. Green Development vs. Degrowth
The focus of this study, which matches that of the UK industrial decarbonisation roadmaps and carbon budgets, is focused on territorial carbon emissions. Hence, conscious of the global nature of the climate change crises, there is a risk associated that demand or production reduction at the home market level leads to emissions savings being wiped out by those associated with importing replacement carbon-intensive industrial products [62]. An analysis of the UK market between 1990–2009 shows that despite the 30% reduction in GHG emissions from production emissions, the consumption emissions were rising at a 1%/year rate due to the increase in the emissions associated with imports [63].
3.3.3. Business Model Shift
The typical business model of cement, as an example, is built on selling low-value products in bulk through centralised production and minimal competition [64]. This landscape would not welcome the business model shift to 50% reduction in the produced cement due to the associated risks to the profitability due to the current costing models and product image [65]. Similar examples exist on the need to change the existing business models for the steel industry to allow for innovative small-scale innovations, especially for less typical production processes such as hydrogen direct reduction [48]. Such industries would need to shift to producing a portfolio of higher-value specialist materials, components, and products aimed at the refurbishment or remanufacturing supply chain, rather than basic bulk materials.
3.3.4. Opposing Sustainability Vectors
The decarbonisation strategies described in the roadmaps, high- or low-tech, show potential to be implemented simultaneously without conflict given the availability of resources. However, demand reduction includes two main contradicting vectors of sustainability, the first of which is the competition over waste materials, for which examples abound, e.g., the need to reduce waste from steel production yet relying on waste steel for EAF production; attempting to use waste glass for production of ceramics while glass is already fully recycled in glass production; or relying on decarbonising concrete by using wastes from the steel or coal-burning industries, which are either becoming scarce or unsuitable [66]. The second contradiction is between the design for durability and the call to reduce the material specification through topology optimisation and additive manufacturing. An example would be the production of thicker glass (triple glazed) to ensure better thermal insulation in buildings, while increasing the required material for glass production.
3.4. Further Research
This study covered the contents of the decarbonisation roadmaps for the six main FIs in the UK till 2050 to critically analyse the ability to achieve the carbon targets using the acclaimed high-tech strategies. The findings show that production and demand reduction as a strategy is imminent unless the resource assumptions for 2050 change. However, the degree of reduction is sensitive to assumptions related to carbon accounting and resource availability. Hence, further research is required to validate the assumptions in this study and to explore further the critical points related to demand reduction, especially the business model shifts and consumer behaviour.
4. Conclusions
This study aimed at identifying the resource-based limitations on achieving the decarbonisation goals for the six main FIs in the UK by 2050. The main limitation of the study, which stems from the fact that all data originates from only one source, is not considering the uncertainty associated with the baseline and decarbonisation pathways. This considered, the main findings were as follows:
- The use of hydrogen fuel is not proving to have the technological market readiness to be utilised directly in full scale production of FIs by 2050.
- The sixth carbon budget for the UK industries define a cap for using biomass as fuel equal to approximately 60% of the planned share while only 40% of the planned CCS carbon abatement capacity is expected to be implemented by 2050.
- The resource-adjusted decarbonisation potential through high-tech strategies (biofuel, electrification, and CCS) falls 20–30% short of the 2050 carbon targets for the UK’s FIs.
- An average of 30% demand reduction for all FIs through reuse, recycling, and production material efficiency is imminent to achieve the 2050 carbon targets.
- Existing interventions to improve the energy efficiency of production could reduce the need for demand reduction by 10–20%.
- There are established interventions for demand reduction, especially the reduction of concrete demand through optimised structural designs, the topology optimisation of steel production, and reuse and recycle of glass and paper packaging.
Author Contributions
Conceptualization, H.H. and M.P.D.; methodology, H.H.; software, H.H.; validation, M.P.D., A.P.M.V. and P.P.; formal analysis, H.H.; investigation, H.H.; resources, P.P.; data curation, H.H.; writing—original draft preparation, H.H.; writing—review and editing, M.P.D., A.P.M.V. and P.P.; visualization, H.H.; supervision, M.P.D.; project administration, P.P.; funding acquisition, A.P.M.V. All authors have read and agreed to the published version of the manuscript.
Funding
This study was funded by the Engineering and Physical Sciences Research Council (ESPRC) fund through the TransFire hub (Grant Reference EP/V054627/1).
Data Availability Statement
The original contributions presented in the study are included in the article, further inquiries can be directed to the corresponding author.
Conflicts of Interest
The authors declare that they have no conflicts of interest.
References
- IEA. ETP Clean Energy Technology Guide [Online]. Paris. 2021. Available online: https://www.iea.org/articles/etp-clean-energy-technology-guide (accessed on 18 March 2024).
- Nelles, J.; Walsh, K.; Vorley, T. Transforming Foundation Industries: UKRI. 2022. Available online: https://innovationcaucus.co.uk/app/uploads/2022/08/Transforming-Foundation-Industries-Engaging-SMEs-in-Innovation.pdf (accessed on 7 April 2024).
- Griffin, P.W.; Hammond, G.P.; McKenna, R.C. Industrial energy use and decarbonisation in the glass sector: A UK perspective. Adv. Appl. Energy 2021, 3, 100037. [Google Scholar] [CrossRef]
- Somerville, P. The continuing failure of UK climate change mitigation policy. Crit. Soc. Policy 2021, 41, 628–650. [Google Scholar] [CrossRef]
- DECC. Industrial Decarbonisation and Energy Efficiency Roadmaps to 2050: Iron and Steel; Department of Energy and Climate Change: London, UK, 2015. [Google Scholar]
- UK GOV. The 2022 UK Greenhouse Gas Emissions: Provisional Figures. Department of Energy Security and Net Zero. 2023. Available online: https://assets.publishing.service.gov.uk/media/6424b8b83d885d000fdade9b/2022_Provisional_emissions_statistics_report.pdf (accessed on 8 April 2024).
- Geels, F.W.; Gregory, J. Low-carbon reorientation in a declining industry? A longitudinal analysis of coevolving contexts and company strategies in the UK steel industry (1988–2022). Energy Res. Soc. Sci. 2023, 96, 102953. [Google Scholar] [CrossRef]
- Griffin, P.W.; Hammond, G.P. Analysis of the potential for energy demand and carbon emissions reduction in the iron and steel sector. Energy Procedia 2019, 158, 3915–3922. [Google Scholar] [CrossRef]
- Garvey, A.; Norman, J.B.; Owen, A.; Barrett, J. Towards net zero nutrition: The contribution of demand-side change to mitigating UK food emissions. J. Clean. Prod. 2021, 290, 125672. [Google Scholar] [CrossRef]
- Richardson-Barlow, C.; Pimm, A.J.; Taylor, P.G.; Gale, W.F. Policy and pricing barriers to steel industry decarbonisation: A UK case study. Energy Policy 2022, 168, 113100. [Google Scholar] [CrossRef]
- Fan, Z.; Friedmann, S.J. Low-carbon production of iron and steel: Technology options, economic assessment, and policy. Joule 2021, 5, 829–862. [Google Scholar] [CrossRef]
- Ward, M.; Allwood, J.M.; Azevedo, J.; Cleaver, C.; Cullen, J.; Dunant, C.; Fellin, T.; Hawkins, W.; Horrocks, I.; Horton, P.; et al. Absolute Zero: Delivering the UK’s Climate Change Commitment with Incremental Changes to Today’s Technologies; University of Cambridge: Cambridge, UK, 2019. [Google Scholar]
- Griffin, P.W.; Hammond, G.P.; Norman, J.B. Industrial energy use and carbon emissions reduction in the chemicals sector: A UK perspective. Appl. Energy 2018, 227, 587–602. [Google Scholar] [CrossRef]
- Meng, F.; Wagner, A.; Kremer, A.B.; Kanazawa, D.; Leung, J.J.; Goult, P.; Guan, M.; Herrmann, S.; Speelman, E.; Sauter, P.; et al. Planet-compatible pathways for transitioning the chemical industry. Proc. Natl. Acad. Sci. USA 2023, 120, e2218294120. [Google Scholar] [CrossRef]
- Griffin, P.W.; Hammond, G.P.; Norman, J.B. Prospects for emissions reduction in the UK cement sector. Proc. Inst. Civ. Eng.-Energy 2014, 167, 152–161. [Google Scholar] [CrossRef]
- Shanks, W.; Dunant, C.F.; Drewniok, M.P.; Lupton, R.C.; Serrenho, A.; Allwood, J.M. How much cement can we do without? Lessons from cement material flows in the UK. Resour. Conserv. Recycl. 2019, 141, 441–454. [Google Scholar] [CrossRef]
- Hafez, H.; Kurda, R.; Al-Ayish, N.; Garcia-Segura, T.; Cheung, W.M.; Nagaratnam, B. A whole life cycle performance-based ECOnomic and ECOlogical assessment framework (ECO2) for concrete sustainability. J. Clean. Prod. 2021, 292, 126060. [Google Scholar] [CrossRef]
- McGarry, H.; Martin, B.; Winslow, P. Delivering low carbon concrete for network rail on the routemap to net zero. Case Stud. Constr. Mater. 2022, 17, e01343. [Google Scholar] [CrossRef]
- Drewniok, M.P.; Azevedo, J.M.C.; Dunant, C.F.; Allwood, J.M.; Cullen, J.M.; Ibell, T.; Hawkins, W. Mapping material use and embodied carbon in UK construction. Resour. Conserv. Recycl. 2023, 197, 107056. [Google Scholar] [CrossRef]
- Lui, S.; Black, R.; Lavandero-Mason, J.; Shafat, M. Business dynamism in the UK: New findings using a novel dataset. In Economic Statistics Centre of Excellence (ESCoE) Discussion Paper; ESCoE: London, UK, 2020; Volume 14. [Google Scholar]
- Muhumuza, R.; Eames, P. Decarbonisation of heat: Analysis of the potential of low temperature waste heat in UK industries. J. Clean. Prod. 2022, 372, 133759. [Google Scholar] [CrossRef]
- CPI, Confederation of Paper Industries. Paper: The Sustainable, Renewable and Recyclable Choice; Position Paper Edition; CPI, Confederation of Paper Industries: Swindon, UK, 2017; p. 2. [Google Scholar]
- Griffin, P.W.; Hammond, G.P.; Norman, J.B. Industrial decarbonisation of the pulp and paper sector: A UK perspective. Appl. Therm. Eng. 2018, 134, 152–162. [Google Scholar] [CrossRef]
- Khalil, A.M.; Velenturf, A.P.; Ahmadinia, M.; Zhang, S. Context analysis for transformative change in the ceramic industry. Sustainability 2023, 15, 12230. [Google Scholar] [CrossRef]
- Pamenter, S.; Myers, R.J. Decarbonizing the cementitious materials cycle: A whole-systems review of measures to decarbonize the cement supply chain in the UK and European contexts. J. Ind. Ecol. 2021, 25, 359–376. [Google Scholar] [CrossRef]
- Cooper, S.J.; Hammond, G.P. ‘Decarbonising’ UK industry: Towards a cleaner economy. Proc. Inst. Civ. Eng.-Energy 2018, 171, 147–157. [Google Scholar] [CrossRef]
- Worrell, E.; Price, L.; Neelis, M.; Galitsky, C.; Zhou, N. World Best Practice Energy Intensity Values for Selected Industrial Sectors; Lawrence Berkeley National Laboratory: Berkeley, CA, USA, 2007. [Google Scholar]
- Yüksek, İ.; Öztaş, S.K.; Tahtalı, G. The evaluation of fired clay brick production in terms of energy efficiency: A case study in Turkey. Energy Effic. 2020, 13, 1473–1483. [Google Scholar] [CrossRef]
- IEA. Emissions Factors 2023-Data Product. Available online: https://www.iea.org/data-and-statistics/data-product/emissions-factors-2023 (accessed on 7 April 2024).
- Forest Research. Carbon Emissions of Different Fuels. 2024. Available online: https://www.forestresearch.gov.uk/tools-and-resources/fthr/biomass-energy-resources/reference-biomass/facts-figures/carbon-emissions-of-different-fuels/ (accessed on 7 April 2024).
- Kaufman, A.S.; Meier, P.J.; Sinistore, J.C.; Reinemann, D.J. Applying life-cycle assessment to low carbon fuel standards—How allocation choices influence carbon intensity for renewable transportation fuels. Energy Policy 2010, 38, 5229–5241. [Google Scholar] [CrossRef]
- Rissman, J.; Bataille, C.; Masanet, E.; Aden, N.; Morrow, W.R., III; Zhou, N.; Elliott, N.; Dell, R.; Heeren, N.; Huckestein, B.; et al. Technologies and policies to decarbonize global industry: Review and assessment of mitigation drivers through 2070. Appl. Energy 2020, 266, 114848. [Google Scholar] [CrossRef]
- Leonelli, C.; Mason, T.J. Microwave and ultrasonic processing: Now a realistic option for industry. Chem. Eng. Process. Process Intensif. 2010, 49, 885–900. [Google Scholar] [CrossRef]
- Serrenho, A.C.; Mourão, Z.S.; Norman, J.; Cullen, J.M.; Allwood, J.M. The influence of UK emissions reduction targets on the emissions of the global steel industry. Resour. Conserv. Recycl. 2016, 107, 174–184. [Google Scholar] [CrossRef]
- Marsh, A.; Dillon, T.; Bernal, S. Cement and concrete decarbonisation roadmaps–a meta-analysis within the context of the United Kingdom. RILEM Tech. Lett. 2023, 8, 94–105. [Google Scholar] [CrossRef]
- Turner, K.; Race, J.; Alabi, O.; Katris, A.; Swales, J.K. Policy options for funding carbon capture in regional industrial clusters: What are the impacts and trade-offs involved in compensating industry competitiveness loss? Ecol. Econ. 2021, 184, 106978. [Google Scholar] [CrossRef]
- Hassan, Q.; Abdulateef, A.M.; Hafedh, S.A.; Al-samari, A.; Abdulateef, J.; Sameen, A.Z.; Salman, H.M.; Al-Jiboory, A.K.; Wieteska, S.; Jaszczur, M. Renewable energy-to-green hydrogen: A review of main resources routes, processes and evaluation. Int. J. Hydrogen Energy 2023, 48, 17383–17408. [Google Scholar] [CrossRef]
- Płaza, M.; Pawlik, Ł.; Deniziak, S. Call transcription methodology for contact center systems. IEEE Access 2021, 9, 110975–110988. [Google Scholar] [CrossRef]
- Franzmann, D.; Heinrichs, H.; Lippkau, F.; Addanki, T.; Winkler, C.; Buchenberg, P.; Hamacher, T.; Blesl, M.; Linßen, J.; Stolten, D. Green hydrogen cost-potentials for global trade. Int. J. Hydrogen Energy 2023, 48, 33062–33076. [Google Scholar] [CrossRef]
- Kearns, D.; Liu, H.; Consoli, C. Technology Readiness and Costs of CCS; Global CCS Institute: Melbourne, Australia, 2021; Volume 3. [Google Scholar]
- García-Freites, S.; Gough, C.; Röder, M. The greenhouse gas removal potential of bioenergy with carbon capture and storage (BECCS) to support the UK’s net-zero emission target. Biomass Bioenergy 2021, 151, 106164. [Google Scholar] [CrossRef]
- Allen, P.E.; Hammond, G.P. Bioenergy utilization for a low carbon future in the UK: The evaluation of some alternative scenarios and projections. BMC Energy 2019, 1, 3. [Google Scholar] [CrossRef]
- Stephenson, S.D.; Allwood, J.M. Technology to the rescue? Techno-scientific practices in the United Kingdom Net Zero Strategy and their role in locking in high energy decarbonisation pathways. Energy Res. Soc. Sci. 2023, 106, 103314. [Google Scholar] [CrossRef]
- CCC. The 6th Carbon Budget—The UK’s Path to Net Zero. 2020. Available online: https://www.theccc.org.uk/ (accessed on 25 May 2024).
- Howard, D.C.; Wadsworth, R.A.; Whitaker, J.W.; Hughes, N.; Bunce, R.G. The impact of sustainable energy production on land use in Britain through to 2050. Land Use Policy 2009, 26, S284–S292. [Google Scholar] [CrossRef]
- Konadu, D.D.; Mourão, Z.S.; Allwood, J.M.; Richards, K.S.; Kopec, G.; McMahon, R.; Fenner, R. Land use implications of future energy system trajectories—The case of the UK 2050 Carbon Plan. Energy Policy 2015, 86, 328–337. [Google Scholar] [CrossRef]
- Hammond, G.P.; Li, B. Environmental and resource burdens associated with world biofuel production out to 2050: Footprint components from carbon emissions and land use to waste arisings and water consumption. GCB Bioenergy 2016, 8, 894–908. [Google Scholar] [CrossRef] [PubMed]
- Garvey, A.; Norman, J.B.; Barrett, J. Technology and material efficiency scenarios for net zero emissions in the UK steel sector. J. Clean. Prod. 2022, 333, 130216. [Google Scholar] [CrossRef]
- Li, X.; Arbabi, H.; Bennett, G.; Oreszczyn, T.; Tingley, D.D. Net zero by 2050: Investigating carbon-budget compliant retrofit measures for the English housing stock. Renew. Sustain. Energy Rev. 2022, 161, 112384. [Google Scholar] [CrossRef]
- Tingley, D.D.; Cooper, S.; Cullen, J. Understanding and overcoming the barriers to structural steel reuse, a UK perspective. J. Clean. Prod. 2017, 148, 642–652. [Google Scholar] [CrossRef]
- Dunant, C.F.; Drewniok, M.P.; Sansom, M.; Corbey, S.; Cullen, J.M.; Allwood, J.M. Options to make steel reuse profitable: An analysis of cost and risk distribution across the UK construction value chain. J. Clean. Prod. 2018, 183, 102–111. [Google Scholar] [CrossRef]
- Woodall, C.M.; Fan, Z.; Lou, Y.; Bhardwaj, A.; Khatri, A.; Agrawal, M.; McCormick, C.F.; Friedmann, S.J. Technology options and policy design to facilitate decarbonisation of chemical manufacturing. Joule 2022, 6, 2474–2499. [Google Scholar] [CrossRef]
- Hafez, H.; Bajić, P.; Aidarov, S.; Malija, X.; Drewniok, M.; Purnell, P.; Tošić, N. Parametric study on the decarbonisation potential of structural system and concrete mix design choices for mid-rise concrete buildings. Mater. Struct. 2024, 57, 85. [Google Scholar] [CrossRef]
- Dunant, C.F.; Drewniok, M.P.; Orr, J.J.; Allwood, J.M. Good early stage design decisions can halve embodied CO2 and lower structural frames’ cost. Structures 2021, 33, 343–354. [Google Scholar] [CrossRef]
- Westbroek, C.D.; Bitting, J.; Craglia, M.; Azevedo, J.M.; Cullen, J.M. Global material flow analysis of glass: From raw materials to end of life. J. Ind. Ecol. 2021, 25, 333–343. [Google Scholar] [CrossRef]
- Cui, H.; Sošić, G. Recycling common materials: Effectiveness, optimal decisions, and coordination mechanisms. Eur. J. Oper. Res. 2019, 274, 1055–1068. [Google Scholar] [CrossRef]
- Del Rio, D.D.F.; Sovacool, B.K.; Griffiths, S.; Bazilian, M.; Kim, J.; Foley, A.M.; Rooney, D. Decarbonizing the pulp and paper industry: A critical and systematic review of sociotechnical developments and policy options. Renew. Sustain. Energy Rev. 2022, 167, 112706. [Google Scholar] [CrossRef]
- Del Rio, D.D.F.; Sovacool, B.K.; Foley, A.M.; Griffiths, S.; Bazilian, M.; Kim, J.; Rooney, D. Decarbonizing the ceramics industry: A systematic and critical review of policy options, developments and sociotechnical systems. Renew. Sustain. Energy Rev. 2022, 157, 112081. [Google Scholar] [CrossRef]
- Marteau, T.M. Towards environmentally sustainable human behaviour: Targeting non-conscious and conscious processes for effective and acceptable policies. Philos. Trans. R. Soc. A Math. Phys. Eng. Sci. 2017, 375, 20160371. [Google Scholar] [CrossRef]
- Thomas, G.O.; Poortinga, W.; Sautkina, E. The Welsh single-use carrier bag charge and behavioural spillover. J. Environ. Psychol. 2016, 47, 126–135. [Google Scholar] [CrossRef]
- Drewniok, M.P.; Gao, Y.; Cullen, J.M.; Cabrera Serrenho, A. What to do about plastics? Lessons from a study of United Kingdom plastics flows. Environ. Sci. Technol. 2023, 57, 4513–4521. [Google Scholar] [CrossRef]
- Ossewaarde, M.; Ossewaarde-Lowtoo, R. The EU’s green deal: A third alternative to green growth and degrowth? Sustainability 2020, 12, 9825. [Google Scholar] [CrossRef]
- Barrett, J.; Peters, G.; Wiedmann, T.; Scott, K.; Lenzen, M.; Roelich, K.; Le Quéré, C. Consumption-based GHG emission accounting: A UK case study. Clim. Policy 2013, 13, 451–470. [Google Scholar] [CrossRef]
- Roberts, S.; Simbanegavi, W.; Vilakazi, T. Cementing regional integration or building walls? Competition, cartels and regional integration in the cement industry in Africa. World Econ. 2023, 46, 437–452. [Google Scholar] [CrossRef]
- Kusuma, R.T.; Hiremath, R.B.; Rajesh, P.; Kumar, B.; Renukappa, S. Sustainable transition towards biomass-based cement industry: A review. Renew. Sustain. Energy Rev. 2022, 163, 112503. [Google Scholar] [CrossRef]
- Millward-Hopkins, J.; Zwirner, O.; Purnell, P.; Velis, C.A.; Iacovidou, E.; Brown, A. Resource recovery and low carbon transitions: The hidden impacts of substituting cement with imported ‘waste’materials from coal and steel production. Glob. Environ. Change 2018, 53, 146–156. [Google Scholar] [CrossRef]

Disclaimer/Publisher’s Note: The statements, opinions and data contained in all publications are solely those of the individual author(s) and contributor(s) and not of MDPI and/or the editor(s). MDPI and/or the editor(s) disclaim responsibility for any injury to people or property resulting from any ideas, methods, instructions or products referred to in the content. |
© 2024 by the authors. Licensee MDPI, Basel, Switzerland. This article is an open access article distributed under the terms and conditions of the Creative Commons Attribution (CC BY) license (https://creativecommons.org/licenses/by/4.0/).