Abstract
Information on associated gas flaring in the Niger Delta is analyzed to characterize the various stages in the lifecycle of an oil exploration and production facility through which gas flaring is introduced into an area, leading to ecological, health, and economic impacts, and possible policies and implementation strategies for the reduction of the flared gas are offered. Gas flaring is currently occurring at a rate of 5318 million m3 per year in the Niger Delta region. The impacts of gas flaring on the ecological, human, and economic systems include poor air quality, acid rain, and soil degradation. Other impacts include decreased crop yield, increased incidences of respiratory diseases amongst inhabitants in the area, and losses of billions of USD yearly in economic costs. Three dominant stages in the introduction of gas flaring are characterized in this study, using the concept of the management of the invasion of non-native species into an ecosystem and it is determined that the cheapest method of minimizing gas flaring is to incorporate mitigation measures during the design stage of the oil exploration/production facility, rather than after flaring has commenced, as is the common emphasis. During the early periods of oil production, gas flaring is largely localized, and the gas utilization measures can still be implemented to good effect. However, once the facility is established, gas flaring becomes pervasive, stretching kilometers beyond the flare points. Current policies like the imposition of flare-out years on the oil producers have helped, but they have been insufficient as the intensity of gas flaring in the region continues at double the average global levels. Working with relevant stakeholders, a realistic flare-out deadline should be agreed upon, clear and specific gas flaring legislation should be drawn up that includes measures to mitigate gas flaring for each proposed oil facility, and proper data collection and management services would enable the implementation of the policies to be based on robust evidence. These policies would shift the costs of gas flaring away from the inhabitants of the region back to the operators of the facilities that are the sources of the flares.
1. Introduction
The use of flaring to dispose of excess gas associated with oil production and processing facilities is common where there is insufficient capacity to use it [1]. This is undesirable because it contributes to environmental degradation, adverse health implications, and negative economic effects [2].
Gas flaring contributes significantly to regional and global atmospheric pollution [3]. For instance, it was estimated that gas flares in Iran emitted 49.7 metric tons of CO2 equivalent into the atmosphere each year, which amounted to about 5.5% to 6% of the total greenhouse gas (GHG) emissions from the country [4]. Some documented detrimental social impacts include poor air quality, respiratory diseases, and reduced crop yields [5]. In the conterminous U.S.A., for four simulated months in 2016, gas flaring and venting during oil and gas production contributed to 210 additional episodes of exceedances of the daily maximum 8-hourly average O3 emissions, an estimated annual burden of 710 excess deaths, and an annual excess of 73,000 childhood asthma exacerbations [6]. It has also been noted that the nearer a property is to a gas field, the lower the value of the property is [7]. Others have suggested that health damages due to air pollution resulting from gas flaring and venting cost USD 7.4 billion annually in the conterminous U.S.A. [6]. Using the reported U.S.A. flaring and venting data for 2015, it has been calculated that these produced between USD 0.9 and USD 1.8 billion in climate costs, with the figure rising to between USD 1.7 and USD 3.4 billion in climate costs when using the 2019 data [8].
Over the decades, several policies have been advocated for the reduction in gas flaring. In the U.S.A., some states, such as Texas and North Dakota, require companies to obtain flaring permits and to report most of their flared volumes [8]. Both states impose severance taxes on oil and natural gas production but give certain exemptions for flared gas, and this reduces the opportunity cost of gas flaring compared to gas capture in these cases [8]. A 120-year historical analysis of gas flaring regulations in Texas [9] is typical of the evolution of such policies in regions hosting oil and gas production and processing facilities, evolving from an initial lack of policies to very strict ones and a subsequent relaxation of the very strict policies.
Perspective and Issues Addressed
Despite decades of applications of anti-gas flaring policies, gas flaring persists worldwide, especially in developing countries [10]; therefore, there is a need to consider different approaches to formulating anti-gas flaring policies [11]. This is especially important because, despite the record use of clean (non-fossil fuel) energy in 2023, the world’s consumption of fossil fuels also reached a record high in 2023, reaching 505 exajoules [12]. This increase was mainly driven by developing countries, where advances in the quality of life have driven increased consumption of coal, gas, and oil [12]. Hitherto, many anti-gas flaring policies have been based on decades of cumulative regulations, which have at times been reactive to flaring events, contradictory to previous edicts, designed to be enforced by different agencies, and with loose connections to enhancing the quality of life, especially in developing countries [13,14,15]. Based on these factors, this paper presents a different approach to those measures hitherto taken by relating anti-gas flaring policies to the evolutionary stages of gas flaring in an oil and gas facility, and the impacts on the quality of life at each of these stages. This is especially pertinent to developing economies, where new oil- and gas-producing facilities are more likely to be signed off on due to the high energy demands and/or the fossil fuel-based economies in these regions [12], as well as areas where modifications to existing facilities might be required.
The next section of the paper presents details of the rationale and methodology used for this study. The three sections after that then present the impacts of gas flaring on the environment, the local society, and the economics of that society. Section 6 introduces the dominant stages for the introduction of gas flaring at oil-producing facilities, while the last two sections discuss the policies that can be used to reduce the effects of gas flares and the conclusions of the study.
2. Rationale, Methods, Contributions
2.1. Quality of Life and the Three Pillars of Sustainability
One contribution of this work is that it situates the impacts of gas flaring on the quality of life at each stage of the gas flaring process, and how policy formulations can ameliorate these impacts. Here, quality of life is used in terms of the sustainable development context in which “people should act here and now in such a way that the conditions for a (decent/high) quality of life later and elsewhere will not be eroded” [16]. This subjective concept is then mapped onto the more objective three pillars of sustainability [16,17,18] (Figure 1) through which the impacts of gas flaring are delineated, the stages of the introduction of gas flaring, and the policy impacts are situated. Thus, to this end, this work has viewed these three pillars as distinct perspectives [18] and not from the perspective of the overall the system approach.
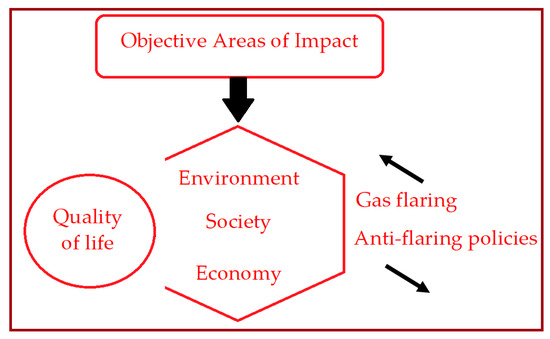
Figure 1.
The quality of life is objectively mapped to the three pillars of sustainability (environment, society, economy), as distinct perspectives [18]. Gas flaring increases the negative impacts on the three pillars and, thus, on the quality of life. Effective anti-gas flaring policies reduce the negative impacts on the three pillars of sustainability and, thus, on the quality of life.
Following this, Section 3, Section 4 and Section 5 present summaries of selected representative impacts of gas flaring on the environment, society, and economy of the study area, as a background to the study. This study is not a review of previous studies on the impacts of gas flaring. Recent detailed studies on the impacts of gas flaring on air quality and health [6], on the environment [19], and on the economics of an affected region [20] are available for interested readers.
2.2. The Concept of the Time of Intervention and the Motivation of the Study
The main motivation for this study was the practice of the integrated approach to the ecology management of the invasion of non-native species into an area [21], and how this approach can be applied to gas flare management, coupled with the publication of important new results over the past 10 years from studies highlighting in detail the extent of the ecological, health, and economic impacts of gas flares, and the extent of the success of the current policies available to mitigate them.
Figure 2, here adapted for gas flare-related interventions, depicts one of the basic ideas underpinning the integrated approach to ecology management: early intervention can significantly reduce the social costs of species invasions into an ecology where they hitherto did not exist. Even though this is self-evident, it must be mentioned that specific actions must be taken for the intervention to occur. Therefore, this study identifies the dominant stages at which gas flaring is introduced in oil and gas production facilities, in order to map the appropriate intervention measures for each of these stages. This is the main contribution of this work. Details of these are presented in Section 6. In the available literature, typically, more recent mitigation studies of gas flaring have concentrated on technological interventions [10,22] with an emphasis on post-flaring methods, without considering pre-flaring interventions.
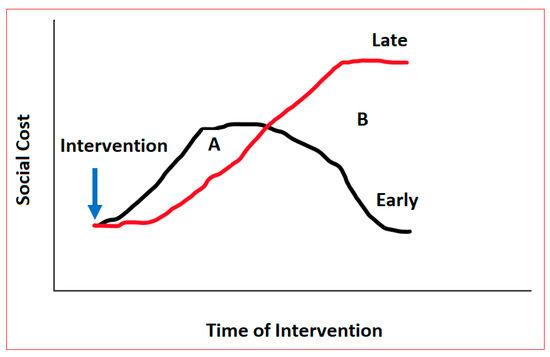
Figure 2.
Total social cost of the introduction of gas flaring (summation of costs of damage due to the introduction of gas flaring and the costs of anti-gas flaring measures) versus the intervention time (early versus late); Area A (social cost of early intervention) versus Area B (resulting later benefits of the early intervention). Adapted from [21].
2.3. The Area of Study
The geographic focus of this study is the Niger Delta in Nigeria (Figure 3 [23]). The region is in southern Nigeria, consists of 9 political states situated off the Gulf of Guinea (Figure 3), with an official projected population (in 2022) of 44,731,900 [24] (20.6% of the total population of Nigeria), and has an area of 111,043 km2 [24] (12% of the total area of Nigeria). This is the largest delta in Africa and the third-largest globally [25]. Nigeria is the largest oil producer in Africa [26], with most of the oil production carried out from oil wells in the Niger Delta, which also accounts for 70% of the total hydrocarbon reserves in sub-Saharan Africa [27]. The gas flaring problem is particularly acute in this region, with hundreds of gas flare sites emitting billions of cubic meters of associated gas per year and making Nigeria a globally high greenhouse gas emitter [28].
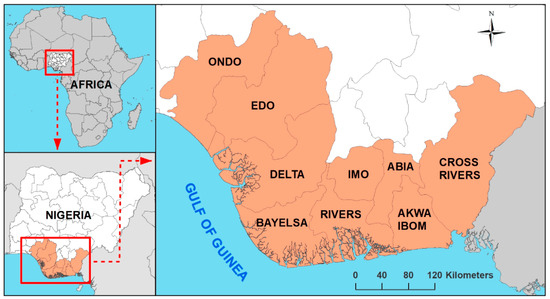
Figure 3.
Depictions of the geographic location of the Niger Delta region [23]. The nine political states comprise 111,043 km2 of land area and 44,731,900 inhabitants (Nigeria: 923,768 km2; 216,783,400 inhabitants). The population figures are from official projections as of 1 March 2022 [24].
Figure 4A presents an image of a flare site in Rivers State in the Niger Delta. Figure 4B shows gas flare locations in seven states in the Niger Delta obtained using Visible Infrared Imaging Radiometer Suite [VIIRS] satellite-based sensors, and their summed statistics for gas flared for the period between March 2012 and May 2024 [29]. Associated gas is produced because of crude oil production, whereas non-associated gas reserves are developed principally to produce natural gas. The effects of flares from both types of processes on the environment, the related social and economic costs, and the policies that might abate them are similar, but this paper focuses on the associated gas flares, because flares from natural gas and liquid natural gas facilities constitute only about 3% of all gas flares [30]. Associated gas flaring in the Niger Delta started with the first commercial oil production wells in 1958 [31,32], when 100% of the gas was flared, and the detrimental effects of this process were already known [33]. Even though by 1963, commercial exploitation of the gas had started [31], five and a half decades later, there were still at least 178 certified flare sites in the Niger Delta [34]. The next three sections summarize representative environmental, social, and economic costs associated with gas flaring in the Niger Delta region.
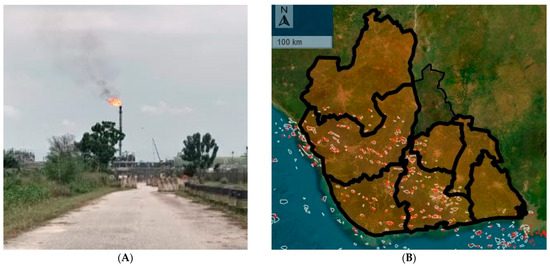
Figure 4.
(A). A gas flaring site in Rivers State, Niger Delta. Notice the proximity of the flare site to vegetation. (B) Geographic representation of gas flare sites [red dots] within oil fields [white enclosures] in seven states in the Niger Delta (obtained from the Nigerian Gas Flare Tracker, which is operated by the National Oil Spill Detection and Response Agency (NOSDRA) [29]). Estimates for the seven selected states, between March 2012 and May 2024: 2.2 billion Mscf; 115.0 million tonnes of CO2 emissions; value of USD 7.6 billion of gas flared; potential penalties for flaring, USD 4.3 billion; power generation potential, 216.5 thousand GWh [29].
3. Impacts of Gas Flaring on the Environment
3.1. Thermal Effects
The thermal effects of gas flaring on the environment are enormous; the resultant higher ambient and soil temperatures make living and farming close to the flare sites intolerable. Sixty billion kWh of heat was emitted into the atmosphere from the total volume of gas flared from 30 fields for nearly five decades [35]. More recent studies have shown that even 270 m from flare points, a surface temperature increase of 3.7 °C above the mean normal daily temperature has been observed [36], thus disturbing the thermal equilibrium in the affected areas.
Ambient and soil temperature values have been reported to rise to 57.1 °C within 40 m of a flare point, compared to 32 °C 140 m from the flare point [37]. Ozabor & Obisehan [38] recorded mean annual ambient temperature values of 29.2 °C and 28.1 °C at 150 m and 650 m, respectively, from a flare source. These affected the crop yield as well [see Section 4.3]. Anomohanran [39] presented data indicating that the thermal effects due to gas flaring can extend for 2.15 km (during the wet season) and 2.06 km (during the dry season) from the flaring source. The study recommended that structures not temperature resistant should not be sited within 2.15 km of gas flare sources. Another study [40] observed that the ambient and soil temperature values only normalized at 2 km from the flare point, prompting advice to the inhabitants to avoid farming any nearer.
3.2. Carbon Emissions
This is of major concern in the affected regions as this can potentially increase the greenhouse effect. Even though from 1999 to 2009, the CO2 emissions fell from 43.3 to 26.6 million metric tons per year, the total quantity of greenhouse gas emitted from flaring gas during this period was an estimated 457 million metric tons [39]. Another study [41] suggests that about 35 million metric tons of carbon dioxide (CO2) per year are released into the atmosphere in the Niger Delta. This is equivalent to driving 7,560,000 passenger cars for one year [42].
3.3. Quality of Rain and Ground Water
Increased lead concentration levels and rainwater acidification are persistent in the Niger Delta area, and the impact varies spatially from the flare sites. The mean pH value for rainwater samples collected over a 10-year period (1997 to 2006) in the region was 5.07 (with a range of 4.98 to 5.15) [43]; the World Health Organization (WHO) suggests that the optimum pH for potable water could be in the range of 6.5 to 9.5 [44]. The pH value for ‘normal’ rainwater is 5.6 [43], for raw water, it is within the range of 6.5 to 8.5 [44]. The spatial variation of the mean pH values was 5.01 (500 m from a flare point), 5.05 (4 km from the flare point), 5.08 (8 km from the flare point), and 5.09 (12 km from the flare point) [43]. Other studies have confirmed these variations [45,46,47].
The lead concentration levels in the water close to the gas flare points are also affected. These may be associated with the increased rate of gas flaring and high levels of pollution due to anthropogenic activities in the region [43]. The lead (Pb) concentration levels have been reported to be higher (0.88–1.04 mg/L) than the WHO drinking water guideline levels (0.01 mg/L) [43,48]. Other studies have also presented similar results [46,49].
4. Impacts of Gas Flaring on the Society
4.1. The Quality of Aquatic Life and Fishing Yield
Gas flaring reduces fish growth in the Niger Delta; therefore, the residents’ nutrition and livelihood are affected. Apart from changes in the rainwater quality [46,49] due to gas flaring in these regions, the quality of the water in the streams and rivers is also affected, as is the aquatic life. There is a noticeable fall in the population of eggs for species of fish such as Salmonidae and tilapia, thus leading to poor fish growth [43]. Consequently, birds, such as ospreys and loons, that feed on the fish in the area are no longer found [43], and the fish harvest, and therefore, the livelihood and nutritional levels of the inhabitants are affected.
4.2. The Recorded Noise Levels in the Area
Gas flaring affects the noise levels in the communities around the flare sites. A study presented recorded noise levels 75 m from flare points that were always close (93.6–96.1 dBA) to the recommended upper limit (100 dBA) of the Department of Petroleum Resources [in Nigeria] [45]. Other studies have shown a spatial relationship, with increasing noise levels the closer one is to the flare point [50].
4.3. Crop Production
Inhabitants of the Niger Delta region are primarily farmers and fish to supplement their income. As some of the flare sites in the region are close to vegetation and farms, crop yield is reduced in these locations, thus affecting their livelihoods. Crop yield is affected by gas flaring, leading to changes in the quality of the water, the crop physiology, and the soil quality [51]. These can lead to food insecurity. A study of the effects of gas flaring on crops in the Niger Delta over a 13-year period showed marked physiological deterioration of plants, with a loss of more than 40% of tree and plant species [43] in the area observed, and these were most pronounced in areas closest to the flare points, where a rainwater pH level of 3.39 was recorded during the period.
There is a spatial gradient with regard to the effects of gas flaring on crop growth [37]. Typical crops consumed in the region, such as cassava (Manihot esculenta) and pepper (Piper) have been shown to present physiological changes and reduced yields. The length and width of the leaves and the number of pepper plants flowering increase the further away they are from gas flare points. The cassava tuber dimensions (average length and the diameter at the thickest point) increase the further the crop is from the flare point. Also, the cassava tubers located furthest from them have been found to contain higher amounts of starch and ascorbic acid but lower levels of amino acid and total sugar [37]. Another staple food in the region, maize (Zea mays), has been observed to have an increased emergence rate, leaf area, growth rate, and yield with increasing distance from gas flare points [52]. Air and soil temperature values usually rose at locations closer to the flare points with attendant decreases in the values of the relative humidity and soil moisture, with the maize crop yield reduced by 76.4%, 70.2%, and 58.2% at locations 0.5 km, 1 km, and 2 km, respectively, from the flare point, compared to those planted 70 km away as a control. Conversely, for water leaf (Talinum) plants, the average width and length of the leaves, the height of the crops, the population density, and the rate of flowering of the crops increase the nearer they are to the gas flare point, thus indicating that the higher temperatures might be favorable to their production and that they can survive in harsher conditions, a probable reason for their prevalence as weeds in the tropics [37].
4.4. Health Impacts
The link between the particulate emissions due to gas flaring and health impacts on the communities has been well documented [53,54,55,56], including eye irritation, skin diseases/itching, chest pains, dizziness, decreased respiratory health, and associated premature deaths. There is also evidence of an association between gas flaring and underweight children in the Niger Delta [56]. The low air quality levels recorded in the coastal regions in Nigeria [57,58,59] are exacerbated by gas flaring in the Niger Delta region towards the east coast. In a study conducted over a 3-year period, the Total Suspended Particle (TSP) and the Particulate Matter (PM) levels increased at locations close to flare points, especially during the ‘dry’ season (December to January) period, and the frequency of asthma, coughing, breathing difficulty, and skin/eye irritation also increased 4-fold at these locations, compared to a control location [60]. Respiratory diseases are more likely to occur in communities residing near gas flaring sites. Acid rain due to gas flaring affects the health of the inhabitants as exposure to low pH values can result in irritation to the skin, eyes, and mucous membranes, and diminish the effectiveness of disinfection [61]. Incidents of conjunctivitis, bronchitis, prolonged coughing, and lung diseases have been increasingly reported in communities residing around the region, with the frequency increasing the closer they are to the flare points [43]. It has been estimated that the yearly health impacts from 17 onshore flare points in Bayelsa State [see Figure 3] in the Niger Delta include 49 premature deaths, 120,000 asthma attacks, and 4960 respiratory illnesses among children [62].
5. The Economic Impacts of Gas Flaring
5.1. Costs Due to Corrosion
Stained laundry, corrosion of metal pipes, discolored buildings needing more frequent repainting (every 2 years), corroded and leaking roofs needing more frequent repairs and/or replacement (every 3 years), increased corrosion of vehicles, all due to the prevalence of acid rains, leading to increased economic costs for households and institutions in the region [43]. Galvanized iron sheets are popular as materials for roofing houses in the region. It has been determined that due to gas flares in the region, a mass loss of up to 34.30 mg per galvanized iron sheet close to a flare point compared to a mass loss of just 2.36 mg at a location far away from the flare point is possible [63].
The economic costs of replacing the galvanized sheets used for roofing houses in the region have been estimated at USD 165 (at 2007 USD rates) every 5 years for a bungalow measuring 29 by 72 ft [64]. Since 80% of the inhabitants in the region earn less than USD 1 a day, this is largely unaffordable [63].
5.2. Gas Flaring Costs
Studies quantifying the actual economic consequences of gas flaring in the Niger Delta present estimates that vary widely, depending on the value of the quantity of gas flared and the value of the US dollar at the time. However, all the studies indicate that the economic costs of gas flares are high. The economic value of the flared gas was estimated at USD 2.5 billion annually in 2004 [37,63], and USD 3 billion annually in 2001 [65]. Another estimate, using an analysis from 1999 to 2009, suggested that the figure was a total of USD 188 billion; this represents an average of USD 17 billion per year during this period [66]. Recently, these values have been described as a value of USD 500 million in terms of emission credit values per year for 22 million tonnes of CO2 emitted per year [67]. The present study has estimated, using the Nigerian Gas Flare Tracker [29], that between March 2012 and May 2024, for seven selected states in the Niger Delta (see Figure 4B), USD 7.6 billion worth of gas was flared.
A summary of the environmental, societal, and economic impacts of the gas flaring discussed is presented in Table 1.

Table 1.
A summary of some of the impacts of gas flaring on the three pillars of sustainability.
6. Dominant Stages at Which Gas Flaring Is Introduced
Pathways to Gas Flaring and Relationships with the Flaring Stages
Following on from presenting the three pillars of sustainability as objective, distinct perspectives on the quality of life in the Niger Delta region, the basis for the identification of the dominant stages at which gas flaring is introduced is now presented. In the integrated approach to ecology management of the invasion of non-native plants into a region, effective control of the invasive species is achieved if the pattern of spread is identified and, based on this, early intervention measures are applied [21]. This is based on the premise that early intervention results in higher social benefits over time, compared to later interventions (see Figure 2). Then, from the identified pattern of spread, better management of the invasive species in the ecosystems is effected using appropriate policies. This approach has been used for the management of non-native forest insects and diseases in the United States [77], and the spread of insects beyond their native ecosystems due to human activities [78].
From the information available for the associated gas flaring in the Niger Delta, this paper identifies and characterizes the progression of the spread of gas flaring through three distinct stages (Figure 5): the pre-flaring stage (design stage of the oil field facility), the flaring stage (when the facility is in operation), and the post-flaring stage (longer-term impact of the facility on the communities, ecology, and economy).
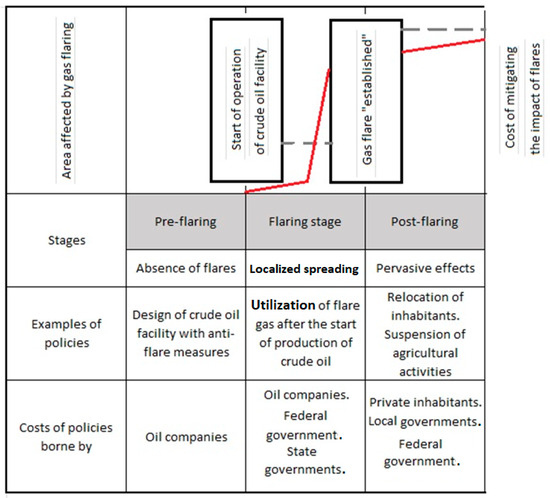
Figure 5.
A representation of the progression of the gas flaring process and its distinct stages. The red curve represents the geographic area affected by the flaring, the horizontal dashed lines are indicative of the costs of mitigating the impact of the flares at each stage, and the vertical bars and lines divide each stage of the process. Examples of the policies that are usually applied at the different stages, and who pays for most of the costs of these policies, are highlighted in the text. Schematic adapted from [21,78].
During the design phase of the oil production facility, opportunities exist to incorporate anti-flaring measures. This is mainly the responsibility of the oil company developing the facilities (Figure 5). If the facility is commissioned without these measures, the flaring stage is entered, and the effects of the gas flaring begin. The responsibility for the impact at this phase also shifts partly to the federal/national government, and the costs of mitigation increase. In the post-flare stage, the flaring is pervasive, with the impacts felt kilometers away from the flare points. The costs now also fall on the inhabitants of the region [69]. Mitigation becomes more problematic, and the effects become long-term [79]. Therefore, as the flaring moves from the pre-flaring to the post-flaring stage, it becomes more difficult to manage, the effects become more pervasive and irreversible, the responsibility for controlling and/or managing the effects shifts or becomes multi-agent (and hence costlier), and the environmental effects become immeasurable (Figure 5).
Table 2 summarizes the possible pathways through which gas flaring can occur, the temporal impact these have if they are not resolved, and how they are related to the three identified flaring stages presented in Figure 5. Therefore, more effective policies are needed at each of these flaring stages and pathways to ameliorate the effects of gas flaring on carbon emissions and social and economic costs in areas hosting oil production facilities.
Table 2.
Pathways to gas flaring, the temporal impacts if unresolved, and their relationship to the flaring stages.
7. Policies to Eliminate Gas Flaring
7.1. Present State of Gas Flaring and Prevention Policies
Many policies have been introduced over the past 4 decades to reduce or eliminate gas flaring in the Niger Delta, and these have had positive effects. Despite the ambiguity in the data from the published information about gas flaring sites (123 sites [64]; 325 sites [30]; 178 sites [34]), the trend is clearly downwards. The volume of gas flared, which is more indicative of the gas flaring problem, also indicates a reduction; the 2022 figures are just 22% of the peak 1996 figures (Figure 6A,B ([30,70])). However, gas is being flared at more than 11 m3 per barrel of oil produced per year, which is more than double the world average of 4.7 m3 ([70]; see Figure 7); the volume of gas being flared (5318 million m3 per year; Figure 6A,B) is the ninth largest in the world [70]. Figure 6 and Figure 7 show that the intensity of gas flaring flatlined in the past decade [from 2012 to 2022; the shaded areas on the graphs]. The rate of fall in the volume of gas being flared reduced markedly from 2012 to 2022 (shaded areas, Figure 6A,B) compared to the previous two decades; this is despite oil production falling to just 54% of the 2012 level by 2022 [shaded area, Figure 6B]. Consequently, the intensity of gas flaring has remained the same between 2012 [10.7 m3 per barrel of oil produced per year) and 2022 (11 m3 per barrel of oil produced per year], as seen on the shaded area in Figure 7.
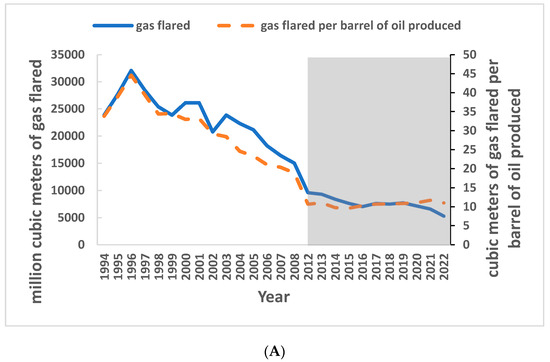
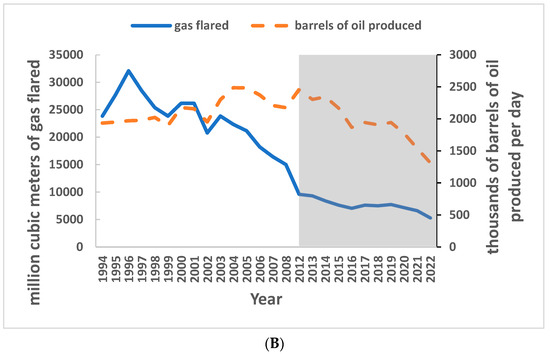
Figure 6.
(A). Volume of gas flared compared with the intensity of gas flared. (B). Volume of gas flared compared with the oil production rate. The 1994–2008 gas flare data were adapted from [79]; the 2012–2022 gas flare data were obtained from the World Bank GFMR [70]. The 1994–2008 oil production data were adapted from the “Statistical Review of World Energy” [71]; the 2012–2022 oil production data were from the World Bank GFMR [70]. Consistent data from 2009–2011 were unavailable.

Figure 7.
The intensity of gas flared compared with the global average level of gas flare intensity. The 2008 figures were calculated from gas flare and oil production data from [79] and the “Statistical Review of World Energy” [71]. The 2012–2022 gas flare and oil production data were obtained from the World Bank GFMR [52]. Consistent data from 2009–2011 were unavailable.
The policy system operating in Nigeria to prevent or regulate activities that lead to gas flaring has historically been linked to the oil production regulations, which mainly emphasize the oil spill problem, but the system appears to have been changed to reflect the peculiarities of gas flaring as opposed to oil spills, among other things [72]. These changes, however, are not reflected in the information present in Figure 6 and Figure 7.
Studies presenting analyses of the effectiveness of the policy systems in place to eliminate gas flaring are limited, but some evidence seems to suggest that it inadvertently depends, to a good extent, on the premise that flared gas will be utilized by the power sector in the country. This is not entirely unreasonable, as there is a lack of power generation capacity in the country. The electricity consumption of 144 kWh per capita in Nigeria is low compared to the global average of 3104 kWh, and only 25% of Nigeria’s 12,000 megawatts of installed capacity reaches the consumer [34]. However, increasing the power generation capacity requires a level of fiscal investment in infrastructure from the government and/or investors, which will ultimately lead to a viable local market for natural gas [1,10,73]; this has not happened. Even though evidence suggests that the volume of gas flared as of 2022 is about a quarter of the peak 1996 figures (Figure 6, [30,70]), gas is still being flared, per barrel of oil produced per year, at more than double the world average ([70]; see Figure 6A), and this leaves the region vulnerable to the environmental, societal, and economic impacts of the gas flares. Therefore, to achieve the desired reduction in gas flaring, policies must include measures that aim to prevent as much gas flare as possible at the production sites, rather than those only aimed at utilizing the gas when it has been flared. This is the main thrust of this work, discerned from the qualitative analysis of the three stages of the introduction of gas flaring presented.
A more coherent gas flaring policy is required, and this work recommends policy measures based on the three stages of the gas flaring process presented in Figure 5, which identify the points during the lifecycle of an oil exploration and production facility at which the measures should be implemented: (1) the pre-flaring stage, when measures should be focused on the design of crude oil facilities with anti-flare measures, (2) the flaring stage, when measures that utilize the gas flares are necessary, and (3) the post-flaring stage, when measures (e.g., suspension of cropping) should be taken to alleviate the pervasive effects of gas flaring. These policy options have been implemented to some extent in various uncoordinated patches across the Niger Delta, but they require strengthening and coordination to be effective. The challenge will be getting the stakeholders (including those bearing the costs of the policies (see Figure 5; [68,69]) together to achieve a coherent, holistic policy framework that cuts across all three different stages of the gas flaring process. A summary of the suggested policies is presented in Table 3, and the details are in Section 7.2, Section 7.3, Section 7.4 and Section 7.5.
Table 3.
Policy options for reducing the impact of gas flaring in the Niger Delta region.
7.2. Preventive Policy Measures at the Design Stage of the Oil Field Facility (Pre-Flaring Stage)
Adequate Pre-Flare Legislation Is Required, and Implementation Is Necessary
This would involve oil exploration companies, environmental agencies, the department of petroleum, and other stakeholders:
- The policy measures for the treatment of associated gas should be explicitly spelt out in legislation. This is currently entwined with oil production legislation [72] and embedded in 11 separate different pieces of legislature [74].
- The permissions to flare should be an explicit part of the proposed associated gas legislation described in (1.) above. Presently, these are handled by three different departments: the Department of Petroleum Resources (DPR), the Federal Environment Protection Agency, and the Environment Impact Assessment unit [75].
- It should be required that an oil exploration/production operator seeking a permit to operate should show evidence of associated gas utilization options (covering the routine, non-routine, and safety flaring pathways (see Table 2)) at the design stage, and, if the permit is granted, incorporate the appropriate gas utilization measures during the exploration, construction, and utilization phases of the facility. The Norwegian Petroleum Directorate has successfully applied a similar approach [76].
- The siting of new oil production facilities should be subject to restrictions in terms of distance to existing habitations based on evidence from the number of studies so far indicating the societal effects of gas flaring. This is to mitigate the health impacts.
7.3. Policy Options at Existing Oil Production Facilities (Flaring Stage)
Strengthen and Implement Existing Legislation
This would involve oil exploration companies, environmental agencies, the Department of Petroleum, and federal and state governments:
- Strengthen the Flare Gas (Prevention of Waste and Pollution) Regulations, 2018 [80], which is an update of the Associated Gas Reinjection Act of 1979 (which has a gas re-injection clause), with the flare penalties updated, to accommodate the nature of existing oil production facilities; existing facilities should be made to adopt currently feasible anti-flare measures.
- Establish a realistic flare-out deadline agreed upon with the stakeholders. It is best to identify key points and risks associated with the implementation of the desired gas utilization programs with the stakeholders, so that these can be tackled in a realistically timely way. Previous flare-out deadlines in 1984, 2004, and 2008 have all been missed [81], possibly because the stakeholders were not consulted in setting the targets, and they may have been unrealistic. The last flare-out deadline, for 2020 [31,81], was not met, because of this historical approach to establishing gas flare-out policies.
- Review the current flaring penalties with the oil companies, to possibly increase them each year, using the annual consumer inflation figure or some other agreed-upon escalator. Even though it was reviewed in 2018 for the first time since 1998, if all the oil companies were penalized at the upper limit of the new tariff (USD 2 per 1000 ft3 of gas flared [80]) and these were collected at the same proportion as reported previously [75], the total amount would add up to just over USD 9.7 million. Given that a gas-to-liquid plant could cost over GBP 2 billion to build [1] and mini-gas-to-liquid plants might require an investment of up to USD 140 million [65], it is still much cheaper to pay the penalties to flare gas than to utilize the flared gas.
- Involve smaller gas utilization operators in the gas flare management and incorporate policies (1 to 3) above in the arrangements. The Nigerian Gas Flare Commercialization Programme was set up to carry out and strengthen this type of policy [31] but it does not incorporate these three (1 to 3) measures enumerated above. Smaller gas utilization operators range from gas collection, storage, and distribution companies to operators of small to medium-sized power plants used in industries and residential estates.
- Strengthen the Department of Petroleum Resources [or similar departments] to train their personnel to measure, monitor, and report gas flares and enforce gas flare legislation and guidelines more effectively. This will enhance the monitoring of flares through the three stages of gas flare introduction and persistence (Figure 5). There has been uncertainty in the past about the actual number of gas flare sites in the region [82]. This makes policy decisions more difficult and less suitable.
7.4. Policy Options for the Affected Communities (Post-Flaring Stage)
7.4.1. Evacuation from Habitations Close to Gas Flare Sites
A medium-term policy (5 years) funded by the various levels of government and the oil corporations to carry out measures to alleviate the social impacts of gas flaring in communities close to the flare site is needed. The Oil Production Tax [or similar taxes in relevant countries] currently administered by the Department of Petroleum Resources (DPR) could also be channeled towards this policy.
Working with non-governmental bodies, local councils, and state and federal governments, communities living close to flare sites would need to be relocated over the 5-year period. This would also mean that fishing and farming activities in the affected areas would consequently stop. These would be delicate and expensive exercises, but are simply the only option at many locations close to the gas flare sites due to the pervasive environmental and health impacts.
7.4.2. Improve National Macro-Economic Planning and Management, and Back This with Resource Allocation
This should happen at federal, state, and local government levels. Corporations also need to be engaged with these policy options, and not just carry out standalone corporate social responsibility initiatives, which have been shown to be ineffective in the long term in some instances [83].
7.4.3. Water Treatment
The treatment of water with neutralizers such as soda ash (sodium carbonate) in the water systems might be required in the affected communities.
7.4.4. Corroding Roofs
Alternative corrosion-resistant roofing materials, such as aluminum, exist that could be used on houses in the affected regions, but these cost about 20 times more than the popular corrugated sheets [64]. Where relocation is not possible, a scheme that would allow the inhabitants to apply for grants to repair their roofs would be beneficial.
7.4.5. Health Care
The health care system in the localities affected by gas flaring in the Niger Delta should be staffed with trained staff and be made available, with drugs and facilities for the peculiar ailments associated with this region, such as respiratory diseases and conjunctivitis. Already, the oil companies fund several hospitals in the region but the coordination with the public health authorities is essential.
7.4.6. Education
A public campaign to alert the inhabitants in the region to the environmental and health tell-tale signs of the effects of gas flares should be carried out over a period of a year. The curriculum in the schools in the affected regions should include the teaching of the recognition of the early signs of the impacts associated with gas flaring (skin irritation, acid rain, soil changes, crop growth changes, etc.), and how to report these. This will improve the reporting of the impacts and ensure quicker and more effective responses to the effects.
7.5. The Science–Policy Gap Needs to Be Closed (Pre-Flaring, Flaring, Post-Flaring Stages)
Considerable opportunities exist to improve the use of scientific data to inform policy decisions for gas flaring in the Niger Delta region. The following policies could help to close the science–policy gap:
- Increase the funding for scientific research on the impacts of gas flaring on the environment, the society, and the economy of the Niger Delta region. Engage academic experts in these areas. For example, although much of the retarding influence of gas flares on plant growth may be due to increases in soil temperature, there are indications that chemical products of the flares have impacts, such as sulfuric acid, which is responsible for acid rain, and carbon dioxide and methane, which are responsible for the greenhouse effect; chemicals also affect the surrounding vegetation, as some studies have pointed out [84]. An analysis of the composition of gas flare emissions and the impacts of polycyclic aromatic hydrocarbons (PAHs) will provide significant insight into the broader impacts of gas flaring. Studies should be intensified with respect to this to fully characterize the synergistic effects of the various pollutants emitted by the flares.The health and environmental (water, soil, air) effects should be rigorously studied by research institutions. The safe limits of habitation, farming, and fishing with regard to the distance to flare points must be determined scientifically. For example, an oil company had previously commissioned a study to disprove the link between acid rain and corroding roofs before this link was confirmed in a scientific study [63].To start with, a specific funding pool dedicated to these studies can involve funding calls over a period of 5 years, with each call addressing particular topics of need; something similar to the European Commission’s Horizon framework of funding calls could work [85].
- Data quality and management must be improved. Researchers and other stakeholders report inconsistent data; the variability makes interpretation difficult. For instance, the Nigerian Gas Flare Commercialization Programme, while putting out tenders for the utilization of gas from flare points, discovered that there were 38 more flare points than were previously known [34]; this complicated the commercialization process. Global surveys of natural gas flaring are now reliant on the use of VIIRS satellite-based sensors, which can detect and measure radiant emissions from gas flares from which the flared gas volume can then be estimated ([30], and Figure 4B). However, there are concerns that the increasing use of enclosed combustors, which enclose the flares in oil production facilities, might impede flare detection using VIIRS sensors [86]; thus, there might be gaps in the available data. Therefore, increased funding for staff training and the latest technological tools for acquiring gas flaring data are needed for effective data collection and management. There should be access to the flare gas data by personnel from other government agencies, and academic researchers. For instance, the 2018 flare gas guidelines appear to restrict the gas flare data for commercial reasons [80]. Emerging data collection issues, such as those due to enclosed flares in oil production facilities [86] must be understood. These gas flare data should also be compared with global trends, and the comparison could partly inform policy decisions.
7.6. Discussion and Limitations of the Study
The three pillars of sustainability have been used as distinct perspectives in this study. An alternative would be to consider the systems approach to the three pillars of sustainability [18,87] and associate these to the United Nations Sustainability Development Goals for the oil and gas industry [14]. Identifying the appropriate dominant stages of the spread of an invading species in an environment can be challenging and requires more understanding, especially if the ecosystem involves complex interactions [88].
Even though the policy options presented in the previous sections were compiled using options usually presented as crucial for reducing the establishment and persistence of invasions to an environment, and on the literature reviewed and interviews/discussions with academics and policy makers in the Niger Delta, they are not exhaustive. Also, implementing the suggested policy options, for example, those presented in Section 7.4 [at the affected communities (post-flaring stage)], would require financial, technical, and social assessments before they can be considered. These assessments have not been considered in this study.
Although progress has continued in enacting improved and/or up-to-date legislation to tackle gas flaring in the Niger Delta, addressing the issues raised in Section 7.2 for the pre-flaring stage policies (see the recently enacted Petroleum Industry Act 2021 [13]), there is a poor record of policy implementation in the region. In the present study, the effects of the political interference and poor governance structures [13,89] that persist in this area were not in scope.
8. Conclusions
Gas flaring occurs when facilities are not in place to utilize gas produced because of oil production. In the Niger Delta, gas flaring causes significant damage to the environment, society, and economy of locations where it emanates. The ecological damage includes huge carbon emissions, and the social damage includes the loss of crop yields and ill health. The economic damage runs into billions of USD per year, and this is borne by the inhabitants in the region, the economy, and the various layers of government. Even though current policies have reduced gas flaring from the historic peak levels seen 20 years ago in the Niger Delta, the volume of gas being flared per barrel of oil produced continues to be more than double the world average rate. Using the concept of time of intervention as used in the ecology management of the invasion of non-native species into an area, this work identified three distinct stages in the lifetime of an oil exploration/production facility, during which the impacts of gas flaring could occur: the pre-flaring, flaring, and post-flaring stages. The most effective means of minimizing gas flaring is to put in place a robust regulatory system that requires gas flare prevention facilities to be designed as part of planned oil production facilities before a permit is given for oil exploration, at the pre-flaring stage. This and other measures, suitable for the two other flaring stages of a facility, will strengthen existing policies, shift the costs of gas flaring away from the inhabitants of the region and back to the operators of the gas-flaring facilities and, thus help to reduce the various effects of gas flaring, especially in developing regions in the world, where post-flare-stage measures are weak and difficult to implement. This is especially pertinent to developing economies where new oil- and gas-producing facilities are more likely to be signed off on due to the high energy demands and/or the presence of fossil-fuel-based economies in these regions [12] or in areas where modifications to existing facilities might be required.
This study also highlighted the need for up-to-date studies to assess the current impacts of gas flaring, especially on the carbon emissions and economy of the Niger Delta region. Studies to assess the practical feasibility of gas flare policies in such regions should also consider them within the context of the quality of the governance structures.
Funding
This research received no external funding.
Data Availability Statement
The original contributions presented in the study are included in the article, further inquiries can be directed to the author.
Acknowledgments
The author would like to acknowledge the support given by Thomas P. Gloria and Helen Silver of the [2019] Extension School Sustainability program at Harvard University and Adaeze Emekwuru for the image used for Figure 4A.
Conflicts of Interest
The author declares no conflicts of interest.
Correction Statement
This article has been republished with a minor correction to resolve spelling and grammatical errors. This change does not affect the scientific content of the article.
References
- Ojijiagwo, E.; Oduoza, C.F.; Emekwuru, N. Economics of gas to wire technology applied in gas flare management. Eng. Sci. Technol. Int. J. 2016, 19, 2109–2118. [Google Scholar] [CrossRef]
- Ismail, O.S.; Umukoro, G.E. Global impact of gas flaring. Energy Power Eng. 2012, 4, 290–302. [Google Scholar] [CrossRef]
- Caseiro, A.; Gehrke, B.; Rücker, G.; Leimbach, D.; Kaiser, J.W. Gas flaring activity and black carbon emissions in 2017 derived from the Sentinel-3A Sea and Land Surface Temperature Radiometer. Earth Syst. Sci. Data 2020, 12, 2137–2155. [Google Scholar] [CrossRef]
- Shojaei, S.M.; Vahabpour, A.; Saifoddin, A.A.; Ghasempour, R. Estimation of greenhouse gas emissions from Iran’s gas flaring by using satellite data and combustion equations. Integr. Environ. Assess. Manag. 2023, 19, 735–748. [Google Scholar] [CrossRef] [PubMed]
- Omobolanle, O.C.; Ikiensikimama, S.S. Gas flaring: Technicalities, challenges, and the economic potentials. Environ. Sci. Pollut. Res. 2024, 31, 40838–40850. [Google Scholar] [CrossRef] [PubMed]
- Tran, H.; Polka, E.; Buonocore, J.J.; Roy, A.; Trask, B.; Hull, H.; Arunachalam, S. Air quality and health impacts of onshore oil and gas flaring and venting activities estimated using refined satellite-based emissions. GeoHealth 2024, 8, e2023GH000938. [Google Scholar] [CrossRef] [PubMed]
- Bennett, A. The Impact of Hydraulic Fracturing on Housing Values in Weld County, Colorado: A Hedonic Analysis; Colorado State University: Fort Collins, CO, USA, 2013. [Google Scholar]
- Agerton, M.; Gilbert, B.; Upton, G.B., Jr. The economics of natural gas flaring and methane emissions in US shale: An agenda for research and policy. Rev. Environ. Econ. Policy 2023, 17, 251–273. [Google Scholar] [CrossRef]
- Willyard, K.A. An historical political economy analysis and review of Texas oil and gas well flaring laws and policy. Energy Policy 2019, 128, 639–647. [Google Scholar] [CrossRef]
- Ojijiagwo, E.N.; Oduoza, C.F.; Emekwuru, N. Technological and economic evaluation of conversion of potential flare gas to electricity in Nigeria. Procedia Manuf. 2018, 17, 444–451. [Google Scholar] [CrossRef]
- Calel, R.; Mahdavi, P. The unintended consequences of antiflaring policies—And measures for mitigation. Proc. Natl. Acad. Sci. USA 2020, 117, 12503–12507. [Google Scholar] [CrossRef]
- Statistical Review of World Energy 2024, Energy Institute. 2024. Available online: https://www.energyinst.org/statistical-review (accessed on 20 June 2024).
- Aigbe, G.O.; Stringer, L.C.; Cotton, M. Gas Flaring in Nigeria: A Multi-level Governance and Policy Coherence Analysis. Anthr. Sci. 2023, 2, 31–47. [Google Scholar] [CrossRef]
- Jatto, A.L.A. Impact of Oil and Gas Exploration and Infrastructure in Niger Delta on the United Nations Sustainable Development Goals. In Oil and Gas Pipeline Infrastructure Insecurity: Vandalism, Threats, and Conflicts in the Niger Delta and the Global South; Springer Nature: Cham, Switzerland, 2024; pp. 81–130. [Google Scholar]
- Okwelum, C.O. Revisiting the disconnection between State Policies and Gas Flare down in Nigeria. Int. J. Multidiscip. Res. Growth Eval. 2023, 4, 109–117. [Google Scholar]
- De Vries, B.J.; Petersen, A.C. Conceptualizing sustainable development: An assessment methodology connecting values, knowledge, worldviews and scenarios. Ecol. Econ. 2009, 68, 1006–1019. [Google Scholar] [CrossRef]
- Van Egmond, N.D.; De Vries, H.J.M. Sustainability: The search for the integral worldview. Futures 2011, 43, 853–867. [Google Scholar] [CrossRef]
- Purvis, B.; Mao, Y.; Robinson, D. Three pillars of sustainability: In search of conceptual origins. Sustain. Sci. 2019, 14, 681–695. [Google Scholar] [CrossRef]
- Aktar, K.F.; Basak, R.; Ara, S.; Mahmud, A. Impacts of gas flaring on soil physicochemical and microbial properties: A case study on kailashtila gas field. Heliyon 2024, 10, e28032. [Google Scholar] [CrossRef] [PubMed]
- Shahab-Deljoo, M.; Medi, B.; Kazi, M.K.; Jafari, M. A techno-economic review of gas flaring in iran and its human and environmental impacts. Process Saf. Environ. Prot. 2023, 173, 642–665. [Google Scholar] [CrossRef]
- Hobbs, R.J.; Humphries, S.E. An Integrated Approach to the Ecology and Management of Plant Invasions. Conserv. Biol. 1995, 9, 761–770. [Google Scholar] [CrossRef]
- Mansoor, R.; Tahir, M. Recent developments in natural gas flaring reduction and reformation to energy-efficient fuels: A review. Energy Fuels 2021, 35, 3675–3714. [Google Scholar] [CrossRef]
- Ebhuoma, E.E.; Simatele, M.D.; Leonard, L.; Ebhuoma, O.O.; Donkor, F.K.; Tantoh, H.B. Theorising indigenous farmers’ utilisation of climate services: Lessons from the oil-rich Niger Delta. Sustainability 2020, 12, 7349. [Google Scholar] [CrossRef]
- Brinkhoff, T. Nigeria: States & Agglomerations, Population Statistics, Maps, Charts, Weather and Web Information. 2022. Available online: https://www.citypopulation.de/en/nigeria/cities/agglos/ (accessed on 6 June 2024).
- Uwadiae Oyegun, C.; Lawal, O.; Ogoro, M. The Niger Delta Region. In Landscapes and Landforms of Nigeria; Springer Nature: Cham, Switzerland, 2023; pp. 101–121. [Google Scholar] [CrossRef]
- Crude Oil including Lease Condensate Monthly, February 2024 (2024) International—U.S. Energy Information Administration (EIA). Available online: https://rb.gy/mgii24 (accessed on 6 June 2024).
- Odesa, G.E.; Ozulu, G.U.; Eyankware, M.O.; Mba-Otike, M.N.; Okudibie, E.J. A Holistic Review of Three-Decade Oil Spillage across the Niger Delta Region, with Emphasis on Its Impact on Soil and Water. World Sci. News 2024, 190, 119–139. [Google Scholar]
- Onyena, A.P.; Sam, K. A review of the threat of oil exploitation to mangrove ecosystem: Insights from Niger Delta, Nigeria. Glob. Ecol. Conserv. 2020, 22, e00961. [Google Scholar] [CrossRef]
- Nigerian Gas Flare Tracker. NOSDRA. 2024. Available online: https://nosdra.gasflaretracker.ng/gasflaretracker.html (accessed on 7 June 2024).
- Elvidge, C.D.; Zhizhin, M.; Baugh, K.; Hsu, F.-C.; Ghosh, T. Methods for Global Survey of Natural Gas Flaring from Visible Infrared Imaging Radiometer Suite Data. Energies 2016, 9, 14. [Google Scholar] [CrossRef]
- Nigerian Gas Flare Commercialization Programme (NGFCP): Historical Background. 2019. Available online: http://www.ngfcp.gov.ng/about-us/historical-background/ (accessed on 9 May 2019).
- Osuoka, A.; Roderick, P. Gas Flaring in Nigeria. A Human Rights, Environmental and Economic Monstrosity. 2005. Available online: https://www.amisdelaterre.org/wp-content/uploads/2019/10/gas-flaring-nigeria.pdf (accessed on 4 May 2024).
- Natural Gas in Nigeria. The National Archives, Kew (DO 35/10500). 1960. Available online: https://discovery.nationalarchives.gov.uk/details/r/C4719664 (accessed on 7 June 2024).
- Fidelis, M. ‘How Nigeria Can Save $1B Yearly from Flared Gas’, The Guardian Nigeria News—Nigeria and World News. 2018. Available online: https://guardian.ng/business-services/how-nigeria-can-save-10b-yearly-from-flared-gas/ (accessed on 4 May 2024).
- Ologunorisa, T.E. A review of the effects of gas flaring on the Niger Delta environment. Int. J. Sustain. Dev. World Ecol. 2001, 8, 249–255. [Google Scholar] [CrossRef]
- Oseji, J.O. Thermal gradient in the vicinity of Kwale/Okpai gas plant, Delta state, Nigeria: Preliminary observations. Environmentalist 2007, 27, 311–314. [Google Scholar] [CrossRef]
- Dung, E.J.; Bombom, L.S.; Agusomu, T.D. The effects of gas flaring on crops in the Niger Delta, Nigeria. GeoJournal 2008, 73, 297–305. [Google Scholar] [CrossRef]
- Ozabor, F.; Obisesan, A. Gas flaring: Impacts on temperature, agriculture and the people of Ebedei in Delta State Nigeria. J. Sustain. Soc. 2015, 4, 5–12. [Google Scholar]
- Anomohanran, O. Thermal effect of gas flaring at Ebedei area of Delta State, Nigeria. Pac. J. Sci. Technol. 2012, 13, 555–560. [Google Scholar]
- Obi, E.O.; Osang, J.E. Thermal effects of gas flaring activities in Ogba-Egbema-Ndomi community, Rivers State, Nigeria. Int. J. Energy Environ. Res 2015, 3, 1–11. [Google Scholar]
- Ite, A.; Ibok, U. Gas Flaring and Venting Associated with Petroleum Exploration and Production in the Nigeria’s Niger Delta. Am. J. Environ. Prot. 2013, 1, 70–77. [Google Scholar] [CrossRef]
- California Air Resources Board: Climate Change. Conversion of 1MMT CO2 to Familiar Equivalents. 2007. Available online: https://ww3.arb.ca.gov/cc/factsheets/1mmtconversion.pdf (accessed on 8 August 2019).
- Efe, S.I. Spatial variation in acid and some heavy metal composition of rainwater harvesting in the oil-producing region of Nigeria. Nat. Hazards Dordr. 2010, 55, 307–319. [Google Scholar] [CrossRef]
- WHO: pH in Drinking-Water. 2003. Available online: https://www.who.int/water_sanitation_health/dwq/chemicals/ph.pdf (accessed on 10 May 2019).
- Ubani, E.; Onyejekwe, I. Environmental impact analyses of gas flaring in the Niger delta region of Nigeria. Am. J. Sci. Ind. Res. 2013, 4, 246–252. [Google Scholar] [CrossRef]
- Amadi, A.N. Impact of gas-flaring on the quality of rain water, groundwater and surface water in parts of Eastern Niger Delta, Nigeria. J. Geosci. Geomat. 2014, 2, 114–119. [Google Scholar]
- Etesin, U.M.; George, N.J.; Ogbonna, I.J.; Akpan, I.O. Source identification and variation in the chemical composition of rainwater in the coastal and industrial areas: A case study of Ikot Abasi, South-Eastern Nigeria. Earth Sci. Malays. 2023, 7, 55–63. [Google Scholar]
- WHO: Lead in Drinking-Water. 2011. Available online: https://www.who.int/water_sanitation_health/dwq/chemicals/lead.pdf (accessed on 15 September 2019).
- Ezenwaji, E.E.; Okoye, A.C.; Otti, V.I. Effects of gas flaring on rainwater quality in Bayelsa State, Eastern Niger-Delta region, Nigeria. J. Toxicol. Environ. Health Sci. 2013, 5, 97–105. [Google Scholar] [CrossRef][Green Version]
- Abdulkareem, A.S.; Odigure, J.O. Deterministic Model for Noise Dispersion from gas Flaring: A case study of Niger–Delta area of Nigeria. Chem. Biochem. Eng. Q. 2006, 20, 157–164. [Google Scholar]
- Wemedo, S.A.; Appah, M.O. Impact assessment of gas faring on soil bacterial community structure and physicochemical property in Nigeria. Open Access J. Microbiol. Biotechnol. 2020, 5, 1–9. [Google Scholar] [CrossRef]
- Odjugo, P.O.; Osemwenkhae, E.J. Natural gas flaring affects microclimate and reduces maize (Zea mays) yield. Int. J. Agric. Biol. 2009, 11, 408–412. [Google Scholar]
- Chen, C.; McCabe, D.C.; Fleischman, L.E.; Cohan, D.S. Black carbon emissions and associated health impacts of gas flaring in the United States. Atmosphere 2022, 13, 385. [Google Scholar] [CrossRef]
- Blundell, W.; Kokoza, A. Natural gas flaring, respiratory health, and distributional effects. J. Public Econ. 2022, 208, 104601. [Google Scholar] [CrossRef]
- Nwosisi, M.C.; Oguntoke, O.; Taiwo, A.M.; Agbozu, I.E.; Noragbon, E.J. Spatial patterns of gas flaring stations and the risk to the respiratory and dermal health of residents of the Niger Delta, Nigeria. Sci. Afr. 2021, 12, e00762. [Google Scholar] [CrossRef]
- Alimi, O.B.; Gibson, J. The Impact of Gas Flaring on Child Health in Nigeria; World Bank: Washington, DC, USA, 2022. [Google Scholar]
- Ejohwomu, O.A.; Oladokun, M.; Oshodi, O.S.; Bukoye, O.T.; Edwards, D.J.; Emekwuru, N.; Adenuga, O.; Sotunbo, A.; Uduku, O.; Balogun, M.; et al. The exposure of workers at a busy road node to PM2.5: Occupational risk characterisation and mitigation measures. Int. J. Environ. Res. Public Health 2022, 19, 4636. [Google Scholar] [CrossRef] [PubMed]
- Ejohwomu, O.A.; Shamsideen Oshodi, O.; Oladokun, M.; Bukoye, O.T.; Emekwuru, N.; Sotunbo, A.; Adenuga, O. Modelling and forecasting temporal PM2. 5 concentration using ensemble machine learning methods. Buildings 2022, 12, 46. [Google Scholar] [CrossRef]
- Emekwuru, N.; Ejohwomu, O. Temperature, humidity and air pollution relationships during a period of rainy and dry seasons in Lagos, West Africa. Climate 2023, 11, 113. [Google Scholar] [CrossRef]
- Gobo, A.E.; Richard, G.; Ubong, I.U. Health Impact of Gas Flares on Igwuruta/Umuechem Communities in Rivers State. J. Appl. Sci. Environ. Manag. 2009, 13. [Google Scholar] [CrossRef]
- pH Values in Drinking Water Completely Explained—Pt. 2, n.d. Available online: https://www.freedrinkingwater.com/water-education/quality-water-ph-page2.htm (accessed on 12 May 2019).
- Okafor, C. Gas Flaring: FG to Hand over Sites to Investors by 2020, THISDAYLIVE. 2019. Available online: https://www.thisdaylive.com/index.php/2019/04/30/gas-flaring-fg-to-hand-over-sites-to-investors-by-2020 (accessed on 4 May 2024).
- Ekpoh, I.J.; Obia, A.E. The role of gas flaring in the rapid corrosion of zinc roofs in the Niger Delta Region of Nigeria. Environmentalist 2010, 30, 347–352. [Google Scholar] [CrossRef]
- Uyigue, E.; Agho, M. Coping with Climate Change and Environmental Degradation in the Niger Delta of Southern Nigeria; Community Research and Development Centre (CREDC): Benin, Nigeria, 2007; Volume 1, p. 30. [Google Scholar]
- Ishisone, M. Gas Flaring in the Niger Delta: The Potential Benefits of its Reduction on the Local Economy and Environment. Berkeley. 2004. Available online: https://nature.berkeley.edu/classes/es196/projects/2004final/Ishone.pdf (accessed on 4 May 2024).
- Anomohanran, O. Determination of greenhouse gas emission resulting from gas flaring activities in Nigeria. Energy Policy 2012, 45, 666–670. [Google Scholar] [CrossRef]
- Ohakah, C. 700 Firms Jostle for 178 Gas Flare Sites in Niger Delta. 28 February 2019. Available online: https://orientenergyreview.com/oil-and-gas/firms-jostle-gas-flare-sites/ (accessed on 9 May 2019).
- Siloko, B.E. Human security, sustainable livelihoods and development: The case of the Niger Delta region in Nigeria. Glob. Discourse 2024, 14, 411–432. [Google Scholar] [CrossRef]
- Adekola, O.; Mitchell, G.; Grainger, A. Inequality and ecosystem services: The value and social distribution of Niger Delta wetland services. Ecosyst. Serv. 2015, 12, 42–54. [Google Scholar] [CrossRef]
- Global Gas Flaring Data. World Bank. Available online: https://www.worldbank.org/en/programs/gasflaringreduction/global-flaring-data (accessed on 3 May 2024).
- Statistical Review of World Energy|Energy Economics|Home. 2018. Available online: https://www.bp.com/content/dam/bp/business-sites/en/global/corporate/pdfs/energy-economics/statistical-review/bp-stats-review-2018-full-report.pdf (accessed on 11 May 2019).
- Aghalino, S.O. Gas flaring, environmental pollution and abatement measures in Nigeria, 1969-2001. J. Sustain. Dev. Afr. 2009, 11, 219–238. [Google Scholar]
- Ojijiagwo, E.; Oduoza, C.F.; Emekwuru, N. Development of a framework for reduction of flare gas in an oil and gas processing environment. Pet. Coal 2017, 59, 662–671. [Google Scholar]
- Ite, A.E.; Ibok, U.J.; Ite, M.U.; Petters, S.W. Petroleum exploration and production: Past and present environmental issues in the Nigeria’s Niger Delta. Am. J. Environ. Prot. 2013, 1, 78–90. [Google Scholar] [CrossRef]
- Regulation of Associated Gas Flaring and Venting A Global Overview and Lessons from International Experience 2004. World Bank Group. Available online: https://documents1.worldbank.org/curated/en/590561468765565919/pdf/295540Regulati1aring0no10301public1.pdf (accessed on 4 May 2024).
- Guidance on Upstream Flaring and Venting: Policy and Regulation 2009. World Bank Group. Available online: https://documents1.worldbank.org/curated/en/200701468344636937/pdf/826120WP0polic00Box379864B00PUBLIC0.pdf (accessed on 4 May 2024).
- Lovett, G.; Weiss, M.; Liebhold, A.; Holmes, T.P.; Leung, B.; Lambert, K.; Orwig, D.A.; Campbell, F.T.; Rosenthal, J.; McCullough, D.G.; et al. Nonnative forest insects and pathogens in the United States: Impacts and policy options. Ecol. Appl. 2016, 26, 1437–1455. [Google Scholar] [CrossRef] [PubMed]
- Gippet, J.M.; Liebhold, A.M.; Fenn-Moltu, G.; Bertelsmeier, C. Human-mediated dispersal in insects. Curr. Opin. Insect Sci. 2019, 35, 96–102. [Google Scholar] [CrossRef] [PubMed]
- Elvidge, C.D.; Ziskin, D.; Baugh, K.E.; Tuttle, B.T.; Ghosh, T.; Pack, D.W.; Zhizhin, M. A Fifteen Year Record of Global Natural Gas Flaring Derived from Satellite Data. Energies 2009, 2, 595–622. [Google Scholar] [CrossRef]
- Nigerian Gas Flare Commercialization Programme (NGFCP). 2018. Available online: http://www.ngfcp.gov.ng/media/1120/flare-gas-prevention-of-waste-and-pollution-regulations-2018-gazette-cleaner-copy-1.pdf (accessed on 11 May 2019).
- Adebayo, T.-H. How Nigeria’s Gas Flare Commercialisation Will Work. Premium Times Nigeria. 2019. Available online: https://www.premiumtimesng.com/business/325262-how-nigerias-gas-flare-commercialisation-will-work.html (accessed on 4 May 2024).
- Eboh, M. FG Discovers 178 Gas Flare Sites across Nigeria. Vanguard. 2017. Available online: https://www.vanguardngr.com/2017/12/fg-discovers-178-gas-flare-sites-across-nigeria/ (accessed on 4 May 2024).
- Ite, U.E. Multinationals and corporate social responsibility in developing countries: A case study of Nigeria. Corp. Soc. Responsib. Environ. Manag. Bognor. Regis. 2004, 11, 1–11. [Google Scholar] [CrossRef]
- Okeagu, J.E.; Okeagu, J.C.; Adegoke, A.O.; Onuoha, C.N. The environmental and social impact of petroleum and natural gas exploitation in Nigeria. J. Glob. South Stud. 2006, 23, 199. [Google Scholar]
- Programme for the Environment and Climate Action. 2024. European Commission. Available online: https://ec.europa.eu/info/funding-tenders/opportunities/portal/screen/programmes/life2027 (accessed on 4 May 2024).
- Brown, T.; Last, C. Methane Emissions from Gas Flaring Being Hidden from Satellite Monitors, The Guardian. 2024. Available online: https://www.theguardian.com/environment/2024/may/02/methane-emissions-gas-flaring-hidden-satellite-monitors-oil-gas (accessed on 2 May 2024).
- De Vries, B.J. Sustainability Science; Cambridge University Press: Cambridge, UK, 2023. [Google Scholar]
- Tobin, P.C.; Robinet, C. Advances in understanding and predicting the spread of invading insect populations. Curr. Opin. Insect Sci. 2022, 54, 100985. [Google Scholar] [CrossRef]
- Alola, A.A.; Onifade, S.T.; Magazzino, C.; Obekpa, H.O. The effects of gas flaring as moderated by government quality in leading natural gas flaring economies. Sci. Rep. 2023, 13, 14394. [Google Scholar] [CrossRef]


Disclaimer/Publisher’s Note: The statements, opinions and data contained in all publications are solely those of the individual author(s) and contributor(s) and not of MDPI and/or the editor(s). MDPI and/or the editor(s) disclaim responsibility for any injury to people or property resulting from any ideas, methods, instructions or products referred to in the content. |
© 2024 by the author. Licensee MDPI, Basel, Switzerland. This article is an open access article distributed under the terms and conditions of the Creative Commons Attribution (CC BY) license (https://creativecommons.org/licenses/by/4.0/).