Article

Using Indoor and Outdoor Measurements to Understand Building Protectiveness against Wildfire, Atmospheric Inversion, and Firework PM2.5 Pollution Events

1
Department of Atmospheric Sciences, University of Utah, 135 S 1460 E, Room 819, Salt Lake City, UT 84112, USA
2
Pulmonary Division, Department of Internal Medicine, School of Medicine, University of Utah, 26 N 1900 E, Salt Lake City, UT 84132, USA
3
Department of City & Metropolitan Planning, University of Utah, 375 S 1530 E, Suite 220, Salt Lake City, UT 84112, USA
4
Department of Political Science, University of Utah, 260 S Central Campus Drive, Salt Lake City, UT 84112, USA
5
Department of Life, Earth and Environmental Sciences, West Texas A&M University, Natural Sciences Building 343, Canyon, TX 79016, USA
6
Utah Division of Air Quality, Utah Department of Environmental Quality, 195 North 1950 West, Salt Lake City, UT 84116, USA
7
Office of Sustainability, Princeton University, MacMillan Annex West, Princeton, NJ 08544, USA
*
Author to whom correspondence should be addressed.
Environments 2024, 11(9), 186; https://doi.org/10.3390/environments11090186
Submission received: 26 July 2024 / Revised: 17 August 2024 / Accepted: 22 August 2024 / Published: 25 August 2024
(This article belongs to the Special Issue Advances in Urban Air Pollution)

Abstract

:
The world has seen an increase in the frequency and severity of elevated outdoor pollution events exacerbated by the rise in distant polluting events (i.e., wildfires). We examined the intersection between indoor and outdoor air quality in an urban area using research-grade sensors to explore PM2.5 infiltration across a variety of pollution events by testing two separate indoor environments within the same building. We confirmed prior work suggesting that indoor environments in buildings are most protective during wintertime inversion events and less so during fireworks and wildfire events. The building indoor environment protectiveness varies notably during different pollution episodes, especially those that have traveled longer distances (e.g., wildfires), and we found evidence of varied infiltration rates across PM2.5 types. Inversion events have the lowest infiltration rates (13–22%), followed by fireworks (53–58%), and wildfires have the highest infiltration rates (62–70%), with distant wildfire events persisting longer and, therefore, infiltrating for greater durations than local-wildfire-related particle matter. The differences in PM infiltration rates were likely due to the combined effects of several factors, including varying particle size, concentration, and chemistry. Subsequently, the local wildfires had different temporal air quality impacts than distant wildfire pollution in this case. Based on these findings, indoor air quality appears more conducive to protective action and policies than outdoor air quality because the built environment may serve to shield individuals from outdoor air.

1. Introduction

Elevated or severe pollution episodes are associated with acute public health impacts [1]. The factors contributing to severe air pollution episodes in urban areas include both meteorological stagnation events as well as local and regional pollution transport and secondary pollution chemistry [1]. Historically, severe urban air pollution episodes were primarily associated with emissions from local sources in urban and industrial centers, but today, with the continuing expansion of urban populations and increasing anthropogenic and natural pollution sources from distant locales, many cities around the world have seen an increase in the frequency and severity as well as a change in character of severe pollution events [2]. In fact, a recent study found that nearly half of all fine particulate matter (PM2.5) found in areas of the Western United States is already attributable to wildfire smoke, and that trend is expected to increase [3].
While outdoor air pollution is difficult to avoid, indoor air quality is more amenable to protective action and policies that might shield individuals from poor outdoor air [4,5]. For example, Kaewrat et al. [6] recently attempted to measure the impact of outdoor NO2 levels on indoor concentrations observed in classrooms to better understand air pollution exposure impacts on educational outcomes [6]. Pirouz et al. [7] also recently showed how heating, ventilation, and air conditioning (HVAC) systems play an important protective role on indoor air quality by improving and optimizing air flow [7]. Emerging research even suggests that air-handling systems may be protective of some pollutants more than others [6,7,8]. HVAC systems exist at the interface of outdoor and indoor air quality since they determine the extent to which outdoor air pollution events influence indoor air quality.
In this study, we investigate the intersection between indoor and outdoor air quality and elevated urban pollution events using direct measurements. We extend the literature in several important ways. First, we explore how elevated outdoor PM2.5 pollution events impact indoor PM2.5 levels across a range of pollution events of varying severities. Second, we confirm prior work that suggests that indoor environments are more protective during wintertime inversion events than during firework and wildfire events, and that higher outdoor PM2.5 concentrations do not necessarily result in higher indoor PM2.5 concentrations [8]. Third, we extend prior research that illustrates how greater levels of air pollution exposure occur indoors during wildfire events [9]. Fourth, we provide additional evidence that ambient outdoor air quality impacts indoor concentrations [10]. Fifth, we explore the protectiveness of indoor environments and the expected human exposure that might result from various outdoor PM2.5 pollution types, especially for pollution events with PM2.5 particles that have traveled longer distances such as distant wildfires. Based on these findings, there is evidence of divergent infiltration across different sources of PM2.5.
Severe air pollution events often affect communities who lack a nearby air quality monitoring station or easy-to-understand and accessible data from a local station. Additionally, characterizing exposure retrospectively is methodologically challenging due to the complex behavior of smoke and other air pollutants [11]. In this study, we aim to fill this gap in the literature by directly measuring, assessing, and reporting on such events using a network of high-quality, research-grade sensors. We also comparatively test the protective abilities of two separate but identical air-handling systems in the same building and report on these findings. Hagan and Kroll [12] summarize the accuracy of nephelometer particulate measurements as a function of particle size. Laser nephelometers (such as used in this study) generally have less error than other optical particle measurements. For wildfire aerosols, nephelometers can perform well, but as the wildfire plume evolves, larger errors can be observed [12]. Improving scientific understanding of optical sensor accuracy during wildfire events is an active area of research, particularly for low-cost sensors that have been shown to have lower accuracy than research-grade sensors [13,14]. The research-grade MetOne nephelometers used in this study have been assessed against smoke concentrations and have been shown to be accurate [15,16].
Beyond characterizing changing pollution patterns, there is a growing need to understand varying human exposure patterns during extreme air pollution events such as wildfires, inversions, and firework events. Understanding changing and variable exposure is critical for assessing potential health impacts since human protection from such events is imperative to ensure that all individuals in society are safe and healthy. Efforts in this area may both advance scientific progress and help to inform public policy outcomes.
This study took place in Provo, Utah (USA), where local air pollution emissions, wintertime meteorological conditions, mountain topography, and stable atmospheric conditions combine to cause episodes of persistent cold air pools (PCAPs), commonly referred to as inversions, which trap locally emitted pollutants (Figure 1). The building air intakes were oriented northwest and northeast and MERV 13 filters were used by the air-handling system. This atmospheric stagnation also promotes chemical reactions that create secondary particulate matter (PM) that results in prolonged build-up of elevated concentrations of particulates from nearby anthropogenic emission sources (e.g., industry and vehicle emissions), including PM2.5. Like many parts of the world, Provo has also seen an increase in pollution from non-local sources, particularly in the summertime. This includes transport from large wildfires and background emissions from distant anthropogenic sources (often referred to as transboundary pollution since the pollution originates outside the state or country being evaluated). While distant sources are increasingly found to combine with typical local sources, atypical local sources such as pollution from fireworks or urban fires also contribute to severe urban pollution events. The following provides a theoretical overview of the research questions and hypotheses that resulted from this research.
Since even short-term exposure to particulate pollution is associated with increased risk of morbidity and mortality [17], such changes are concerning for scientists and policymakers alike. Exposure to poor air quality, even at low levels, has been found to worsen various health conditions including myocardial infarction and asthma exacerbations, as well as negatively affecting educational outcomes [18,19]. Subsequently, efforts to reduce exposure have become increasingly important.
The health effects of wildfire smoke exposure have only recently been characterized. Current research suggests that wildfire smoke is associated with increased mortality, exacerbation of asthma and COPD, susceptibility to respiratory infection, and cardiovascular hospitalization [20,21]. For instance, recent evidence suggests that wildfire-specific particulate pollution may be ten times more harmful to respiratory health that non-wildfire air pollution [22]. Particulate pollution in general, and specifically wildfire smoke, has also been associated with increased incidence, prevalence, severity, and mortality from COVID-19 [23,24]. Wildfire smoke is composed of a large number of chemicals known to be highly toxic which are in the form of fine and ultrafine particulates that may infiltrate buildings at a higher rate than larger particles [25]. For example, Azimi et al. [26] show how wildfire (smaller PM size distributions) and fireworks (larger PM distributions) may be impacted differently by infiltration and filtration efficiency.
Official firework events, and even personal fireworks used on a larger scale, can lead to short-term periods of extremely high PM2.5 and elevated levels of various trace metals, ions, elemental carbon (EC), organic carbon (OC), and organics in PM. However, the health effects of these periods are still not well understood [27,28,29]. Additionally, transboundary air pollution has been demonstrated to cause harmful impacts at great distances [30,31]. Despite their potential harm to human health, extreme pollution events are expected to increase in type and intensity along with changing weather patterns, but how these changes will occur is still far from understood [32].
To better understand how the built environment can play a role in indoor air quality, we explore three key propositions. First, we investigate how direct measurement using research-grade air quality instrumentation can improve our understanding of the differences between indoor and outdoor particulate matter concentrations, and thus estimate potential human exposure. Second, we aim to better understand if indoor environments play a protective role during elevated pollution events (e.g., inversions, fireworks, and both local and distant wildfire events). Finally, for this study, we aim to understand the potential benefits of different indoor environments and whether improvements can be made to increase occupant health and safety. Based on these research goals, we explored three research questions elaborated in more detail below.
1.
Are all indoor areas in buildings equally protective from outdoor pollution events?
Emerging research suggests that air-handling systems may be protective of some pollutants more than others [6,7,8]. We set out to confirm if indoor areas are equally protective of similar outdoor pollution levels. This is relevant for indoor air quality and expected human exposure. To address this, we hypothesize (H1) that two indoor areas within the same building would record approximately the same level of PM2.5 throughout the study. In addition, we assume that the contributions of indoor sources of are negligible in this study. While we recognize that indoor sources may be relevant to this analysis, we found only one prior period (late March 2020) where indoor sources were notable. As a result, we did not measure indoor signals that did not correspond to a prior outdoor signal for this study because they have not been a substantial contributor to the PM2.5 observed in the indoor locations studied in this paper.
2.
Are indoor environments protective across a range of extreme pollution events?
In our prior research [8,33], we noted that the indoor environment of a building was highly protective during inversion events but less protective during wildfire and firework events—regardless of duration. We measured PM2.5 for a year using sensors located on the rooftop, air-handling room, and indoor office space in a building and quantified the impacts of three types of elevated pollution events: wintertime atmospheric inversions, wildfires, and fireworks. The events had different magnitudes and durations, and infiltration rates varied for each event leading to dissimilar indoor air pollution levels. The building’s air-handling unit and different environmental conditions (lower indoor humidity and higher temperature during the winter) combined to reduce indoor pollution from inversion events, but particulate matter from wildfires and fireworks infiltrated at higher rates. Additionally, the particle size distribution of PM2.5 from distant wildfires [34] is often smaller than the secondary particles [35] associated with inversion events, which are also likely to be more susceptible to particle loss associated with volatilization when experiencing a rapid shift in environmental parameters. To further confirm our prior research, we hypothesize (H2) that indoor environments would be more protective against outdoor PM2.5 and during inversion events and less protective during wildfire and firework events.
3.
Are the impacts of local versus distant wildfire PM2.5 pollution the same for indoor air quality?
Wildfire smoke impacts on urban air quality have been steadily increasing over the past several decades and are predicted to continue growing over the next 20 years [36]. Since the 1970s, the intensity and duration of wildfires in the U.S. has grown by nearly 400% [37], but the Western U.S. exceeds the national average for a variety of reasons including excess fuel stock, rising temperatures, and increasing drought. While all Western states are impacted by wildfire, Utah’s unique geography and anthropogenic emissions are responsible for air quality issues, which are exacerbated by pollution produced by nearby and distant wildfires. As a result, the summertime, which used to only be plagued by elevated ozone [38], is now also prone to elevated PM2.5.
While the effects of wildfires on human health are increasingly well-documented, less is understood about the intersection of wildfires with preexisting air quality issues. Particulate matter from wildfires has been shown to differ from other sources of particulate matter, and this is relevant to our understanding of its toxicology [21,39]. Epidemiologic studies have focused primarily on high levels of particulate pollution created by wildfires; however, the actual composition of wildfire smoke varies depending on fuel type, temperature, landscape characteristics, and wind. Wood smoke is a complex mixture of not only particulate matter but also carbon dioxide, carbon monoxide, methane, complex hydrocarbons, nitrogen oxides, and trace minerals and contains many of the same toxic substances as cigarette smoke [39,40]. Secondary pollutants (e.g., organic aerosols and ozone) further worsen air quality, suggesting that the health effects may vary beyond those of particulate matter alone. To explore this further, we hypothesize (H3) that the indoor spaces would be equally protective against PM2.5 originating from both local and distant wildfires. As a result, local wildfires would have similar impacts on indoor air quality as distant wildfire pollution, mainly from California, Idaho, Oregon, Nevada, and Washington, for this study.

2. Materials and Methods

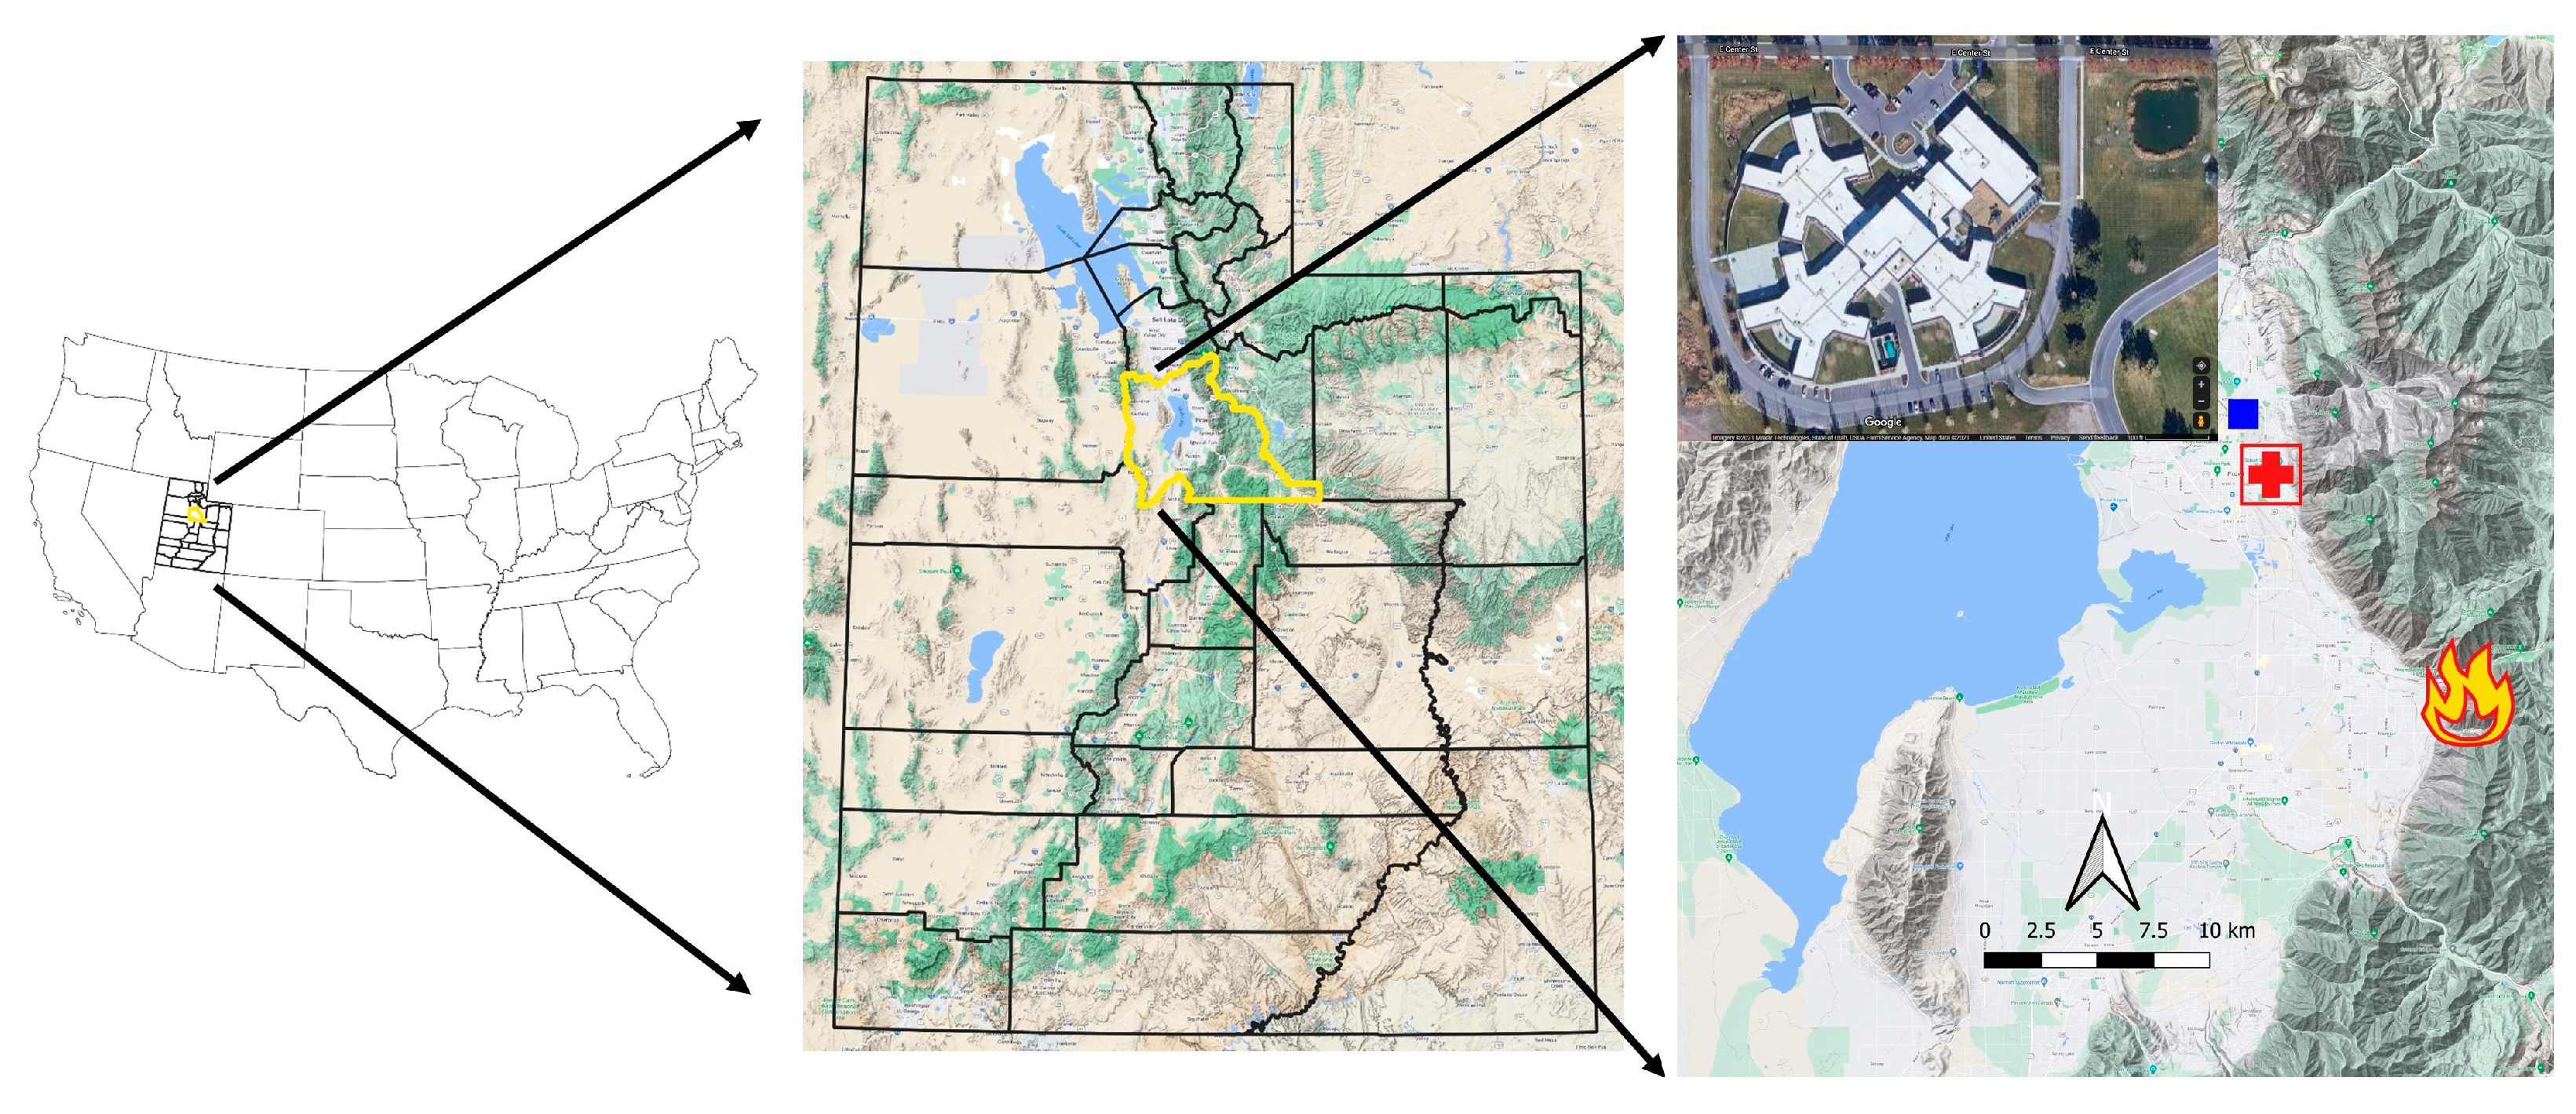
2.1. Study Period and Location

This study took place from 2 February 2020, to 3 March 2021, in Provo, Utah—a medium-sized city and the third-largest urban area in Utah (Figure 1). Provo is one of the fastest growing cities in the United States, with a metro population of approximately 7000,000, a median age of 23.6, and a median household income of $48,888 [41]. The city is surrounded by natural sites including Utah Lake to the West and the Wasatch Mountains to the East. The climate in Provo is hot and dry in the summer, resembling a Mediterranean climate, and cool and semi-arid in the winter. The city is home to Brigham Young University and is increasingly well known as a regional research and technology hub.
As illustrated in Figure 1, instrumentation was installed at the Utah State Hospital in Provo; location coordinates: 40.23466 N, −111.63748 W [42], elevation 1392 MASL [43]. For this study, one air quality instrument was installed on the rooftop of the Pediatric building (“Rooftop”) and two air quality instruments were installed in rooms belonging to the dormitory (“Dorm”) and daycare wings (“Daycare”). Separate indoor locations were selected because they included independent air handlers, allowing our team to assess the impact of different ventilation and filtration technologies on indoor air quality. The Dorm system had intake louvers facing northwest and the Daycare system had intake louvers facing northeast. All the building air handlers have pleated MERV 13 [26], 40% efficiency, high-capacity filters that are changed quarterly and within days of each other, so variations in decreased particulate matter were likely not due to variations in filter type or maintenance. Both air handlers work on operable variable frequency drives (VFD) which regulate the amount of air being drawn into the building based on demand from a variety of temperature sensors placed throughout the air-handling system [44].

2.2. Equipment

Instrumentation: This study deployed research-grade instruments, which have been shown to be comparable to regulatory grade instrumentation in accuracy and precision [45] and significantly more robust and reliable than commonly used low-cost or citizen science sensors [46]. We installed three Met One Instruments (Met One Instruments Inc., Grants Pass, OR 97526, USA) ES-642 Remote Dust Monitors, with inlet sharp-cut cyclones to measure PM2.5, with a manufacturer’s stated uncertainty of 1 µg m−3 [47], on tripods with the inlets at 1.5 m height. The Met One sensors have been previously evaluated and validated by this research group, with precision and accuracy nearly as good as regulatory-grade instrumentation [45]. Data was stored locally by a Raspberry Pi 3 that recorded the incoming serial stream from the ES-642 via RS-232 communications at its native frequency of 10 s. Data was downloaded at monthly intervals and was expected to be used for policy evaluation and research purposes and to encourage efficient and actionable policy making in the short term. The instruments were sent to the manufacturer for recalibration prior to the start of the measurement campaign. They were inspected every 3–4 months, and standard maintenance, including filter changes, was performed during the visits.

2.3. Identifying Elevated Air Pollution Events

As wildfires and other transboundary pollution have increased, Provo and other cities around the world have seen an increase in the number of elevated pollution events, commonly classified as “red air” days. The U.S. Environmental Protection Agency (EPA) established Air Quality Index (AQI) cutoffs for criteria pollutants [48], including PM2.5, to help communicate the dangers of air quality to local communities. Appendix A, Table A1 illustrates the 24 h average AQI breakpoints along with the respective index colors and impacts for each air quality range.
As illustrated in Appendix A, Table A1, “green air” quality days (0–50 AQI; 0–12 µg/m3 PM2.5) occur when pollution levels are within a healthy range for the general population. “Red air” quality days (151–200 AQI; 55.5–150.4 µg/m3 PM2.5) occur when pollution levels (generally PM2.5 and ozone in Utah) reach levels that are unhealthy for the general population. However, the detrimental human health effects of PM2.5 have even been demonstrated following short-term exposure to lower levels of pollution, including levels that fall within the category of “green” air quality (<12.1 µg/m3 PM2.5) [18,49,50].
Measurements from 2 February 2020, to 3 March 2021, captured multiple elevated PM2.5 events, four of which are the subject of this analysis. These events include the following:
  • 4 July 2020: Fireworks—Provo hosted the largest fireworks event in its history.
  • 16–31 August 2020: Major wildfires in California—Complex Fire (Figure 2a and Figure 3a).
  • 8–21 September 2020: Local wildfire in Utah Valley (Figure 2b and Figure 3b).
  • 27 December 2020–4 January 2021: Wintertime PCAP or inversion.
All four events resulted in elevated levels of primary PM2.5; however, the inversion event beginning in December 2020 was likely composed of local primary (~30%) and secondary PM (~70% ammonium nitrate) as in previously studied PCAP events [51]. Because the MERV 13 air filters have different filtration efficiency depending on particle size, it is likely their performance varied for each event [26].

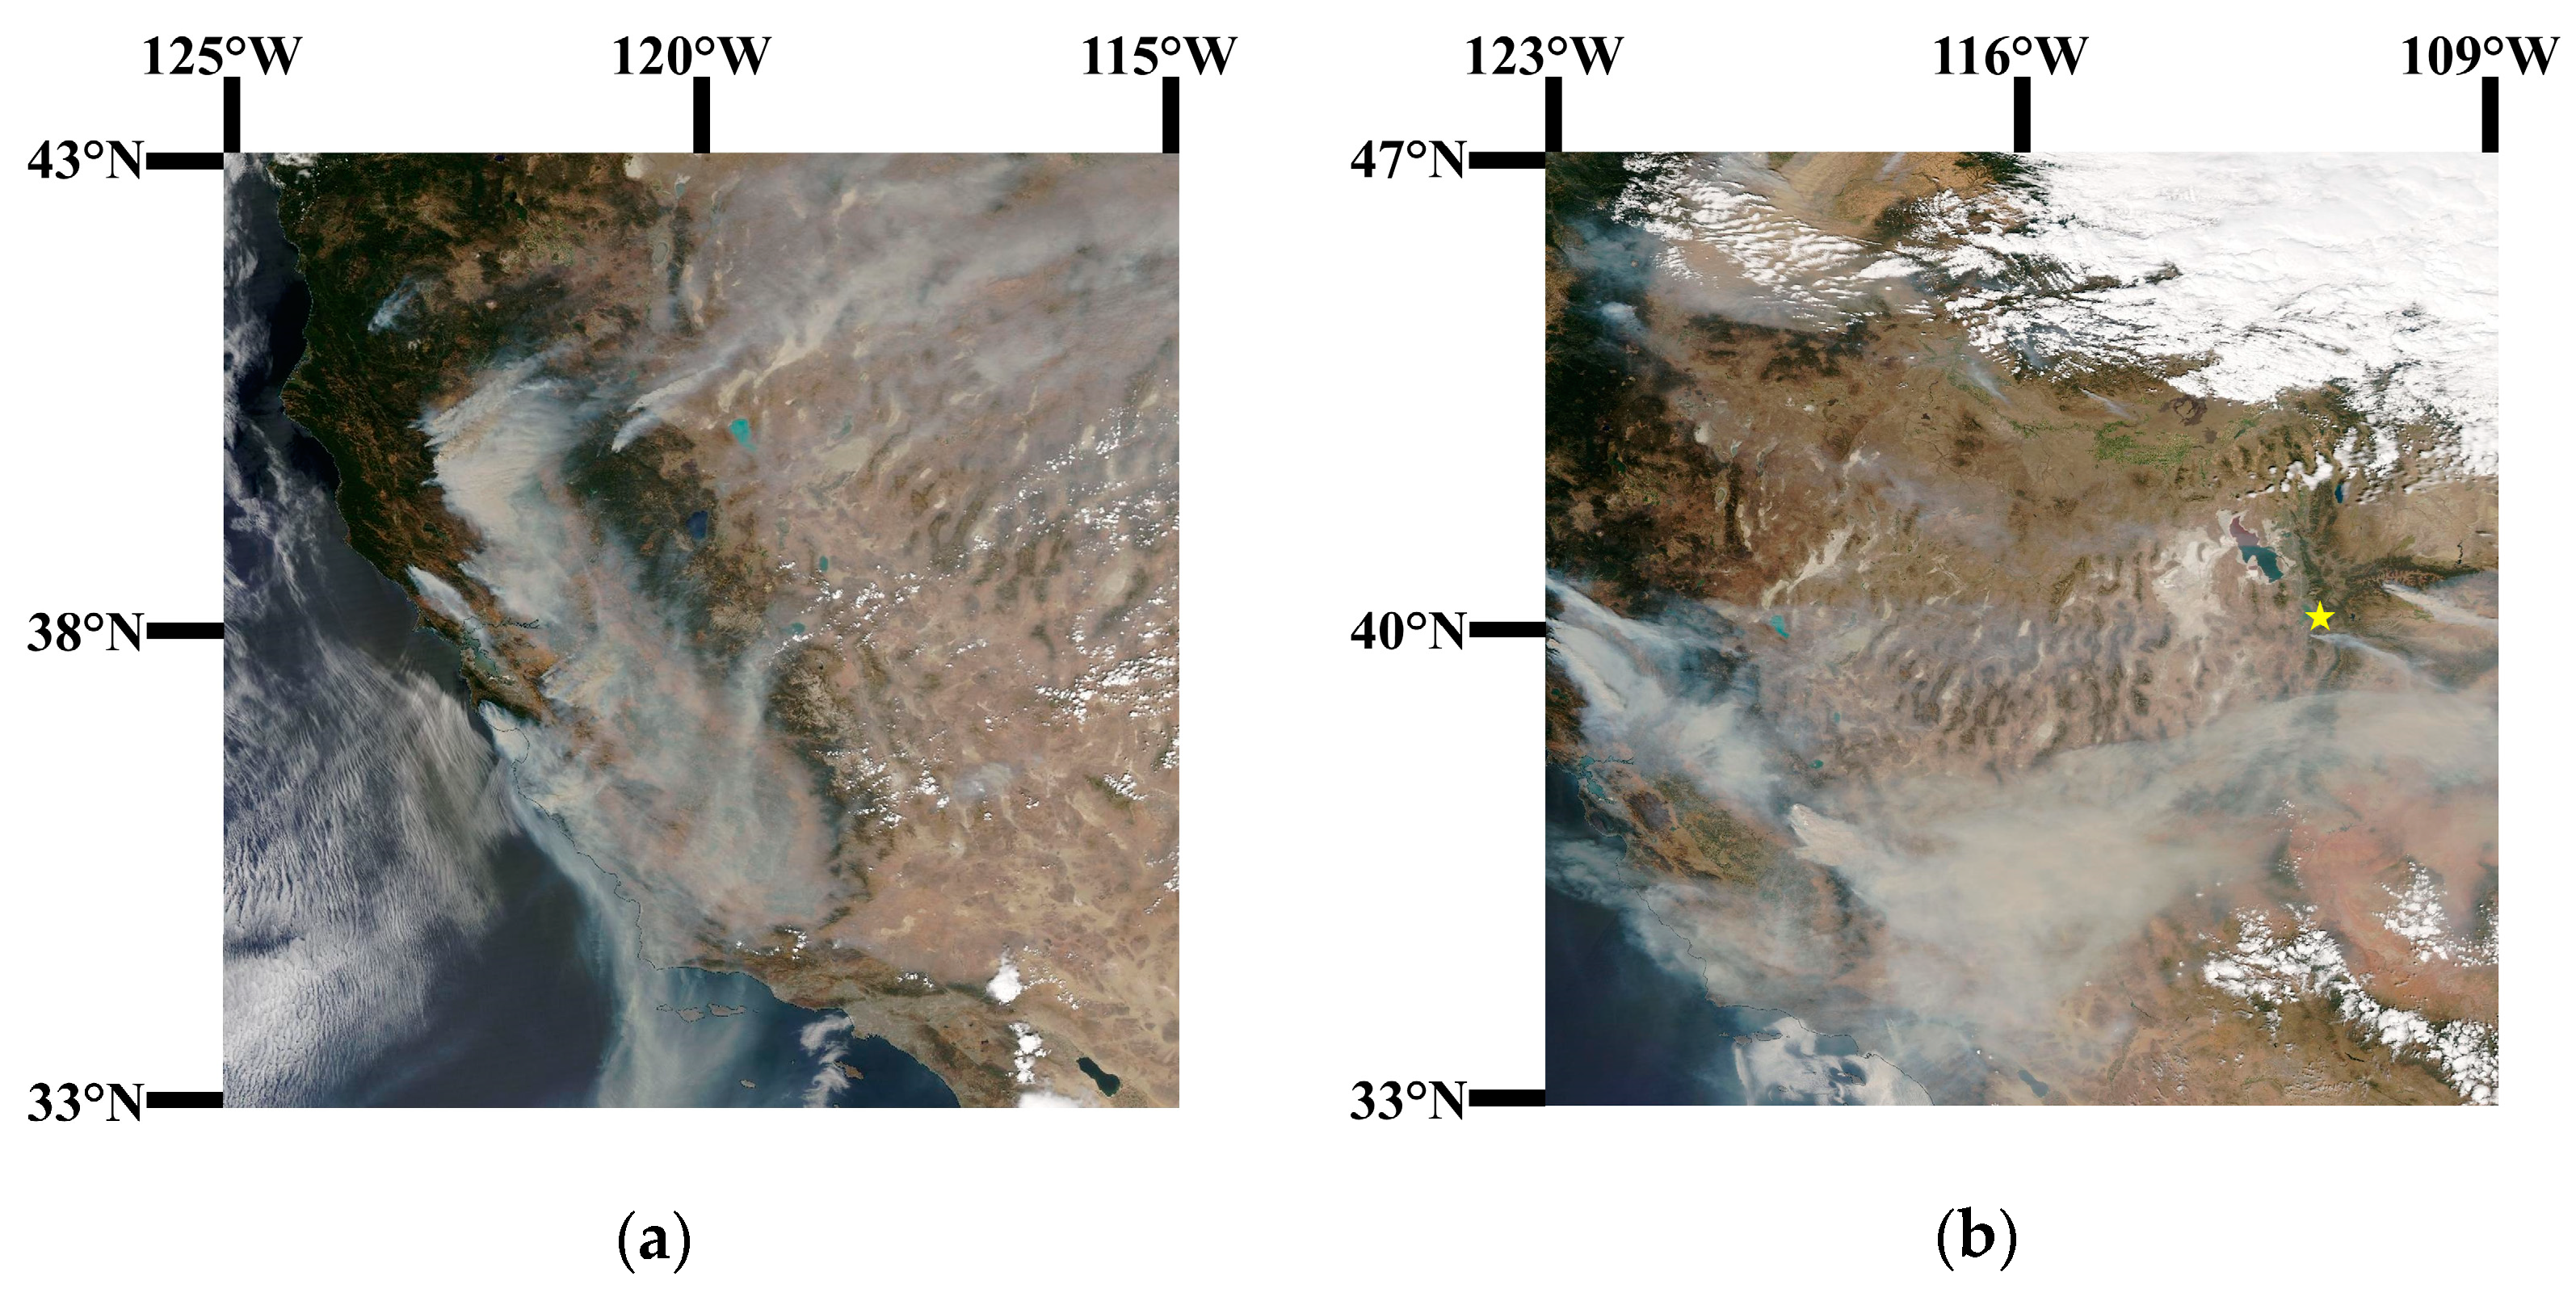
2.3.1. Satellite and Source Imagery

Figure 2 illustrates the wildfire pollution events using satellite images. Figure 2a illustrates the smoke from the California Complex fire on 20 August 2020, using MODIS true-color imagery over the Western USA from the AQUA instrument. Here, smoke from the August Complex fire is apparent, being transported westward toward Utah. In Figure 2b, also using MODIS true-color imagery but over Utah’s Wasatch Front from the AQUA instrument on 7 September 2020, we see local wildfire smoke in the Utah Valley. The wind-driven fire behavior ceased in the following days and smoke remained in the Utah Valley.

2.3.2. STILT Modeling

In Figure 3, we provide Stochastic Time-Inverted Lagrangian Transport (STILT) trajectories to identify the impact of wildfires on the signal. To determine the source of PM2.5 for the summer and early fall of 2020, the STILT model [52,53,54] was used to simulate smoke transport. STILT is a Lagrangian Particle Dispersion model that simulates atmospheric transport with an ensemble of backward trajectories and parameterizes turbulence as a stochastic process. The High-Resolution Rapid Refresh model [55] provided STILT with the meteorological input needed to drive the backward trajectories.
Backward trajectories generated from STILT were linked with the Quick Fire Emissions Dataset (QFED) [56] following the methodology described in [57,58]. Two-hundred backward trajectories were released from the Provo State Hospital every six hours from 20 June 2020, to 1 October 2020, with each trajectory running four days backward in time.
The High-Resolution Rapid Refresh (HRRR) model is a high resolution state-of-the-art meteorological numerical weather prediction model used in this study to force the meteorological transport in the STILT model and is run hourly for the conterminous US by the National Center for Environmental Prediction [59]. There was a period of missing data for the HRRR model between 3 and 7 September 2020, and no STILT analyses were generated during this time frame. QFED emission data beyond 1 October 2020, was also not yet available; therefore, no STILT analyses could be generated beyond this date. The simulations generated for this research account for dry and wet aerosol deposition but do not include secondary aerosol formation. Studies have also shown that the secondary organic aerosol (SOA) contribution to smoke is relatively limited for smoke plumes older than eight hours due to the competing effects of PM accumulation and evaporation [60].
Figure 4 shows the observed and STILT model simulations indicated the wildfire episodic contributions of PM2.5 during the summer and early fall of 2020. The smoke episode of 16–31 August was associated with regional smoke coming from large wildfires located in California according to the STILT analyses (Figure 3). Another major smoke episode occurred during 8–21 September. Here, many different wildfires across the Western U.S. were likely responsible for elevating PM2.5 at the Provo State Hospital. The precent contribution of modeled wildfire smoke to the observed PM2.5 was 50% and 63% for the Complex and Ether Wildfires, respectively.

2.4. Statistical Analysis

During the outdoor elevated pollution periods (>12 µg/m3) of each of the study events, we compared the indoor PM2.5 levels using a t-test as the data was normally distributed.

3. Results

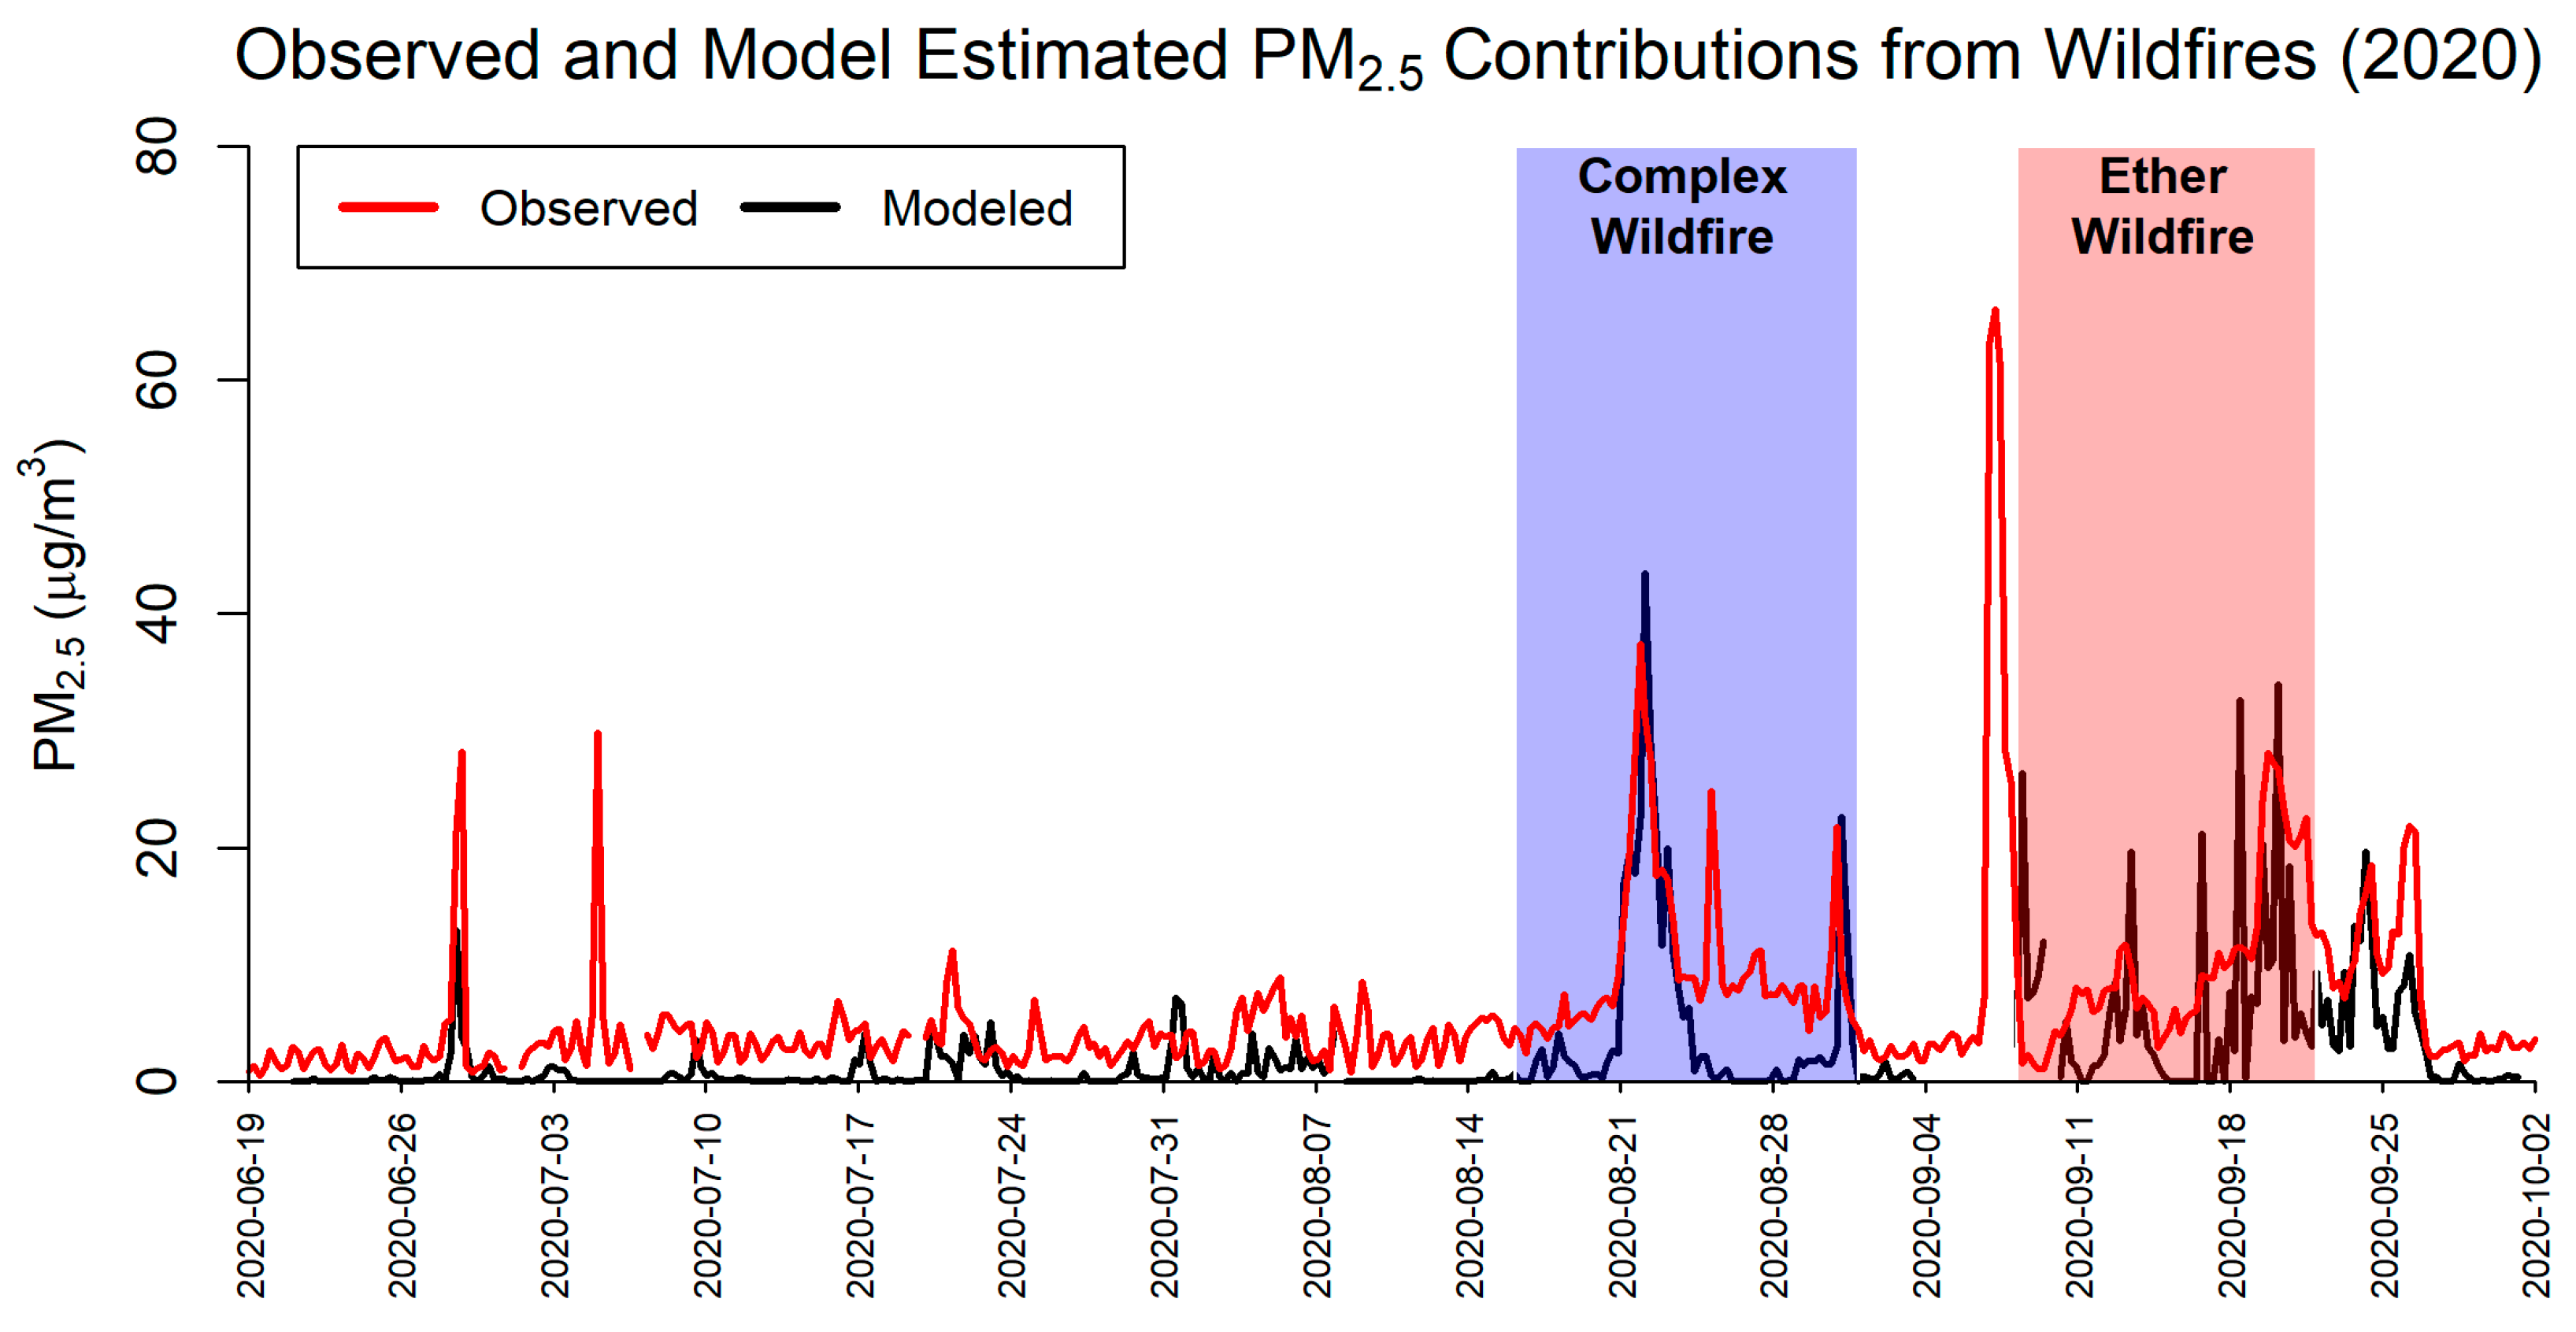
3.1. Time Series Results

Figure 5 illustrates the hourly full time series of the three sensors used in this study. The black line represents the sensor readings from the rooftop sensor and the red and blue lines represent the readings from the indoor sensors (Dorm and Daycare) located in separate wings of the hospital. The Dorm sensor was unplugged by the staff from 25 October 2020, to 12 December 2020. Otherwise, the units operated continuously, with minor data losses due to cleaning of the indoor spaces.

3.2. Elevated Pollution Events

The time series for the four elevated pollution events (ranging in length from 2 days to ~2 weeks) discussed in this paper are shown in Figure 6. The location of the indoor and outdoor PM2.5 sensors is shown in Figure 1.
Figure 6a demonstrates the California Complex wildfire (approximately 1250 km west of the sensors) signal where elevated PM2.5 levels, both indoors and outside, were present for the latter part of August 2020. The Ether wildfire event (Figure 6b—approximately 10 km south of the sensors), spanning from mid to late September 2020, shows a slight overall increase and a marked jump in PM signal around 19 September. The 4 July 2020 fireworks event is clearly highlighted around 10 pm local time in Figure 6c. Fireworks caused the highest recorded outdoor readings of PM2.5 during the entire study period (~80 μg/m3). An early winter inversion episode occurred in early February 2021 (Figure 6d).

3.3. Indoor Air Quality Comparison

In this study, we compared outdoor and indoor PM2.5 in two separate indoor spaces of the same building during each of the four elevated pollution events to better understand how such outdoor pollution events impact air quality. Table 1 shows the results of the statistical analysis comparing the readings of both indoor concentrations. The differences between the infiltration rates for each event are very clear. Inversions have the lowest infiltration rates (13–22%), followed by fireworks (53–58%), and wildfires have the highest infiltration rates (62–70%). The low infiltration rates for inversions are likely associated with drastic changes in meteorological conditions from the outside (low temperature, high humidity) to indoor (higher temperature, lower humidity) environments [8]. This both confirms our prior research and also supports work by other researchers in this area as well [10]. Since a large amount of the PM2.5 present in inversion events is secondary, a sudden change in environmental conditions may lead to the dissociation of these particles into their primary constituents as they enter the building [61]. Further, the main constituents of secondary particulate matter in Utah inversions are ammonium nitrate (NH4NO3) [51,62], a compound that is highly water-soluble and volatile and thus susceptible to volatilization when experiencing rapid transitions in temperature and relative humidity. Another important factor is that wintertime secondary PM2.5 is more likely to “swell” due to increased humidity, in addition to the larger droplet sizes associated with the growth of pollution particles associated with ammonia nitrate secondary PM2.5 particles [63]. These larger particles may be more likely to be filtered by the HVAC system versus the ultrafine particles associated with wildfire smoke.
Based on this additional analysis, all the results, with one exception, are statistically significant. The only event that does not show statistically significant differences is the inversion event. Inversion events involve stagnant air which would negate the influence of wind direction values. A critical finding is that the difference in indoor PM2.5 concentrations can be up to 20%, as shown for the Complex wildfire. During prolonged exposure periods, such as lengthy wildfire events, the difference in being exposed to these pollution levels may have significant health impacts for building occupants. It is possible that the distribution of firework PM consists of larger particles, which are more likely to be captured by HVAC filters and less likely to penetrate indoors, but without particle size distribution measurements we can only speculate. The difference in infiltration rates between the local wildfire (Ether) and the distant California wildfires (Complex) is small. However, the slightly greater inside PM2.5 measurements (relative to outdoor) during the distant California wildfire smoke is hypothesized to be due to the smaller size distribution of the smoke that had aged more. This is an active area of research, and there is considerable uncertainly on the evolution of wildfire smoke plume particle size distributions as they are transported and age, but Sedlacek et al. [64] found that wildfire black carbon has been shown to have a thinner coating and hence becomes smaller over time. Long-range transport of wildfire could shift the chemical composition and distribution of particle sizes of a wildfire plume, likely resulting in a greater proportion of smaller particles within the 0 to 2.5 µm range [65]. This in turn could impact the infiltration rate of PM associated with more distant wildfires compared to local fires. However, without more detailed measurement examining the composition and the particle size distribution of each of these events, the actual distribution of particle sizes and particulate composition for each of the events studied in this analysis are unknown.

4. Discussion

4.1. Study Outcomes

Although we hypothesized that the two indoor environments would produce the same results during the study period because they were identical systems in the same building, this was not the case, as each indoor environment showed statistically different indoor PM2.5 readings (Figure 5 and Figure 6; Table 1). We hypothesized that indoor air quality would be more affected by wildfires and fireworks than inversions. The majority of wildfire particle pollution is primary while inversion PM is predominantly secondary. Lower inversion PM infiltration rates are likely due to volatilization since indoor conditions (e.g., temperature, relative humidity) are substantially different than outdoor conditions.
This research supports prior findings that suggest that some indoor environments may be more protective from some pollutants over others [8]. Thus, when aiming to ensure human exposure to pollutants is maintained at a healthy level, policy alone may not achieve this goal. Instead, multi-level governance may be needed. Subsequently, building managers and owners will need to make decisions about the health of individual buildings (and the health of everyone who occupies the building), while state and local policy makers must also face a trade-off between strong air quality policy and a broad array of social, economic, and environmental externalities. One of the limitations of this study is that we did not attempt to quantify how differences in the use of the indoor space might impact the indoor air quality or exchange rates in the buildings. For example, daycare has higher usage during the day, whereas the dorm has more consistent usage at all times of the day, with usage peaking likely during the morning and evening.
We expected indoor environments to be equally protective of all types of PM2.5. As a result, local wildfires were expected to have similar impacts on indoor air quality as distant wildfire pollution. While both wildfires resulted in similarly elevated outdoor PM2.5 levels, the distant wildfire event led to an extended period of elevated pollution. We found at least three major PM2.5 peaks related to distant wildfire events that reached into, or nearly into, the orange air category outside, and an additional 9–10 days in the yellow air category, with commensurate effects on indoor concentrations. Subsequently, the local wildfires had different temporal air quality impacts than distant wildfire pollution in this case.

4.2. Implications

We examined the intersection between indoor and outdoor air quality in an urban area using research-grade sensors to explore the behavior of PM2.5 infiltration across a variety of pollution episodes by testing two separate, but identical, air-handling systems in the same building. Based on this study, we found elevated PM2.5 levels during inversions, fireworks, and both local and distant wildfire events.
This research confirms prior work suggesting that indoor environments are most protective during wintertime inversion events and less so during fireworks and wildfire events. We quantified indoor environment protectiveness during various pollution events, especially those that have traveled longer distances (e.g., wildfires). Indoor spaces showed consistently lower PM2.5 levels compared to outdoor values, but some variation was associated with the type of exposure and the HVAC intake orientation. This has implications for facilities management and the role of the built environment in human health, especially in public spaces like schools and hospitals [18,66,67].
Additionally, we found evidence of varied infiltration rates across PM2.5 sources. Inversion events were found to have the lowest infiltration rates (13–22%), followed by fireworks (53–58%), and wildfires (62–70%), with distant wildfire events having greater infiltration than local wildfire events due to the longer event duration associated with distant events. We recognize that the differences between indoor and outdoor PM2.5 concentrations are a function of both the type of event generating the elevated outdoor PM2.5 as well as the indoor environmental conditions, as described in previous work [8]. Based on these findings, indoor air quality appears more conducive to protective action and policies than outdoor air quality because the built environment may serve to shield individuals from outdoor air. This has potential implications for public health, human behavior related to personal exposure, and the subsequent health consequences of air pollution. Since particulate pollution exposure is associated with numerous respiratory, cardiovascular, and neurologic health effects and increased mortality, understanding the nuances of outdoor and indoor exposures of various pollution sources is critical to protecting human health [68].
Lastly, this research may encourage other long-term behavioral changes that can be gained from better place-based data to help educate and illustrate the true risks associated with poor air quality. When combined with publicly available air quality data, research-based findings such as these could support more effective communication efforts and help citizens and stakeholders take action to protect themselves and the populations they are responsible for. A possible institutional intervention strategy would be to reduce building ventilation during poor air quality periods, such as fireworks, to minimize potential occupant exposure. Air quality information, when used appropriately, can protect children and vulnerable populations, such as older adults, pregnant women and fetuses, and those with preexisting cardiac and pulmonary disease, from premature and preventable death. Since real-time, place-based pollution information has a greater impact on behavioral change and visual information sharing has been demonstrated to lower health impacts, this research offers great potential to a range of actors impacted by poor air quality. An informed public can also advocate for the investments needed to reduce pollution to help drive down the price of sensor technology for a variety of purposes.
As these various implications suggest, our results enhance the understanding of the various factors affecting indoor air quality. While it is generally believed that being anywhere indoors is equally protective against pollution compared to being outdoors, this is not always true. We quantified the effects of different elevated pollution events on indoor air quality to better characterize these exceptions to our general understanding. Furthermore, we identified the importance of intake vent orientation as a potential variable of concern for particulate matter mitigation.

5. Conclusions

While we are learning more about the impact of anthropogenic activities on PM2.5 and ozone, less is known about elevated pollution events intensified by wildfires and other transboundary and distant air pollution sources. Although air pollution is a well-studied area, research on compounded air quality conditions in the U.S. is less understood. This research attempts to fill this gap. In this case, we found that indoor environments, even in the same building, may be impacted by meteorological conditions and wind direction in ways previously not understood. We also were able to confirm that indoor environments were more protective of PM2.5 during wintertime inversion events but less so during wildfire and firework events. We hypothesize this is partially due to the varying size distributions and particle volatility for PM2.5 particulates from distant wildfire smoke transported to the region versus secondary particles forming locally during wintertime inversions. However, additional data would need to be collected and analyzed to prove this hypothesis. In addition, we found relevant differences in PM2.5 types in wildfire pollution. This suggests that both local and distant wildfire smoke behave in different ways, which may influence how they impact indoor air quality.

Author Contributions

Conceptualization, D.L.M., T.M.B. and S.B.; methodology, D.L.M., T.M.B., E.T.C., R.B., D.V.M. and S.B.; investigation, D.L.M., T.M.B., E.T.C., R.B., D.V.M., C.S.P., A.L.F. and S.B.; writing—original draft preparation, D.L.M., T.M.B., E.T.C., R.B., D.V.M., C.S.P., A.L.F. and S.B.; writing—review and editing, D.L.M., T.M.B., E.T.C., R.B., D.V.M., C.S.P., A.L.F. and S.B.; visualization, D.L.M., E.T.C. and D.V.M.; supervision, D.L.M. and S.B. All authors have read and agreed to the published version of the manuscript.

Funding

This work was supported by the State of Utah, Division of Facilities Construction and Management.

Data Availability Statement

The original contributions presented in the study are included in the article, further inquiries can be directed to the corresponding author.

Acknowledgments

Mark Mellor, Facilities Management, Utah State Hospital; Jeff Wrigley, State of Utah, Division of Facilities Construction & Management; Geoff Seastrand, Utah State Hospital; Robert Paine III, University of Utah, Department of Internal Medicine, Pulmonary Division.

Conflicts of Interest

The authors declare no conflicts of interest. The funders had no role in the design of the study; in the collection, analyses, or interpretation of data; in the writing of the manuscript; or in the decision to publish the results.

Appendix A

Table A1. The U.S. Environmental Protection Agency (USEPA) established Air Quality Index (AQI) cutoffs for criteria pollutants, including PM2.5, and these are listed along with their commonly referred colors as well as general health guidelines. Source: AirNow.gov [48].
ColorPM2.5
(µg/m3)
Level of ConcernAQI RangeDescription of Air Quality
Green0.0–12.0Good0 to 50Air quality is satisfactory, and air pollution poses little or no risk.
Yellow12.1–35.4Moderate51 to 100Air quality is acceptable. However, there may be a risk for some people, particularly those who are unusually sensitive to air pollution.
Orange35.5–55.4Unhealthy for Sensitive Groups101 to 150Members of sensitive groups may experience health effects. The general public is less likely to be affected.
Red55.5–150.4Unhealthy151 to 200Some members of the general public may experience health effects; members of sensitive groups may experience serious health effects.
Purple150.5–250.4Very Unhealthy201 to 300Health alert: The risk of health effects is increased for everyone.
Maroon250.5+Hazardous301 and higherHealth warning of emergency conditions: Everyone is more likely to be affected.

References

  1. Morawska, L.; Zhu, T.; Liu, N.; Torkmahalleh, M.A.; de Fatima Andrade, M.; Barratt, B.; Broomandi, P.; Buonanno, G.; Ceron, L.C.B.; Chen, J. The state of science on severe air pollution episodes: Quantitative and qualitative analysis. Environ. Int. 2021, 156, 106732. [Google Scholar] [CrossRef] [PubMed]
  2. Shaddick, G.; Thomas, M.; Mudu, P.; Ruggeri, G.; Gumy, S. Half the world’s population are exposed to increasing air pollution. NPJ Clim. Atmos. Sci. 2020, 3, 23. [Google Scholar] [CrossRef]
  3. Burke, M.; Driscoll, A.; Heft-Neal, S.; Xue, J.; Burney, J.; Wara, M. The changing risk and burden of wildfire in the United States. Proc. Natl. Acad. Sci. USA 2021, 118, e2011048118. [Google Scholar] [CrossRef] [PubMed]
  4. Tran, V.V.; Park, D.; Lee, Y.-C. Indoor air pollution, related human diseases, and recent trends in the control and improvement of indoor air quality. Int. J. Environ. Res. Public Health 2020, 17, 2927. [Google Scholar] [CrossRef] [PubMed]
  5. Gonzalez-Martin, J.; Kraakman, N.; Perez, C.; Lebrero, R.; Munoz, R. A state-of-the-art review on indoor air pollution and strategies for indoor air pollution control. Chemosphere 2020, 262, 128376. [Google Scholar] [CrossRef]
  6. Kaewrat, J.; Janta, R.; Sichum, S.; Kanabkaew, T. Indoor Air Quality and Human Health Risk Assessment in the Open-Air Classroom. Sustainability 2021, 13, 8302. [Google Scholar] [CrossRef]
  7. Pirouz, B.; Palermo, S.A.; Naghib, S.N.; Mazzeo, D.; Turco, M.; Piro, P. The Role of HVAC Design and Windows on the Indoor Airflow Pattern and ACH. Sustainability 2021, 13, 7931. [Google Scholar] [CrossRef]
  8. Mendoza, D.L.; Benney, T.M.; Boll, S. Long-term analysis of the relationships between indoor and outdoor fine particulate pollution: A case study using research grade sensors. Sci. Total Environ. 2021, 776, 145778. [Google Scholar] [CrossRef]
  9. Liang, Y.; Sengupta, D.; Campmier, M.J.; Lunderberg, D.M.; Apte, J.S.; Goldstein, A.H. Wildfire smoke impacts on indoor air quality assessed using crowdsourced data in California. Proc. Natl. Acad. Sci. USA 2021, 118, e2106478118. [Google Scholar] [CrossRef]
  10. Meng, Q.Y.; Turpin, B.J.; Korn, L.; Weisel, C.P.; Morandi, M.; Colome, S.; Zhang, J.; Stock, T.; Spektor, D.; Winer, A. Influence of ambient (outdoor) sources on residential indoor and personal PM2. 5 concentrations: Analyses of RIOPA data. J. Expo. Sci. Environ. Epidemiol. 2005, 15, 17–28. [Google Scholar] [CrossRef]
  11. Wheeler, A.J.; Jones, P.J.; Reisen, F.; Melody, S.M.; Williamson, G.; Strandberg, B.; Hinwood, A.; Almerud, P.; Blizzard, L.; Chappell, K. Roof cavity dust as an exposure proxy for extreme air pollution events. Chemosphere 2020, 244, 125537. [Google Scholar] [CrossRef] [PubMed]
  12. Hagan, D.H.; Kroll, J.H. Assessing the accuracy of low-cost optical particle sensors using a physics-based approach. Atmos. Meas. Tech. 2020, 13, 6343–6355. [Google Scholar] [CrossRef]
  13. Molina Rueda, E.; Carter, E.; L’Orange, C.; Quinn, C.; Volckens, J. Size-Resolved Field Performance of Low-Cost Sensors for Particulate Matter Air Pollution. Environ. Sci. Technol. Lett. 2023, 10, 247–253. [Google Scholar] [CrossRef]
  14. Barkjohn, K.K.; Holder, A.L.; Frederick, S.G.; Clements, A.L. Correction and Accuracy of PurpleAir PM2. 5 Measurements for Extreme Wildfire Smoke. Sensors 2022, 22, 9669. [Google Scholar] [CrossRef]
  15. Mehadi, A.; Moosmüller, H.; Campbell, D.E.; Ham, W.; Schweizer, D.; Tarnay, L.; Hunter, J. Laboratory and field evaluation of real-time and near real-time PM2. 5 smoke monitors. J. Air Waste Manag. Assoc. 2020, 70, 158–179. [Google Scholar] [CrossRef] [PubMed]
  16. Schweizer, D.; Cisneros, R.; Shaw, G. A comparative analysis of temporary and permanent beta attenuation monitors: The importance of understanding data and equipment limitations when creating PM2. 5 air quality health advisories. Atmos. Pollut. Res. 2016, 7, 865–875. [Google Scholar] [CrossRef]
  17. Di, Q.; Dai, L.; Wang, Y.; Zanobetti, A.; Choirat, C.; Schwartz, J.D.; Dominici, F. Association of Short-term Exposure to Air Pollution With Mortality in Older Adults. JAMA 2017, 318, 2446–2456. [Google Scholar] [CrossRef] [PubMed]
  18. Mendoza, D.L.; Pirozzi, C.S.; Crosman, E.T.; Liou, T.G.; Zhang, Y.; Cleeves, J.J.; Bannister, S.C.; Anderegg, W.R.; Paine, R., III. Impact of low-level fine particulate matter and ozone exposure on absences in K-12 students and economic consequences. Environ. Res. Lett. 2020, 15, 114052. [Google Scholar] [CrossRef] [PubMed]
  19. Pope, C.A., III; Muhlestein, J.B.; Anderson, J.L.; Cannon, J.B.; Hales, N.M.; Meredith, K.G.; Le, V.; Horne, B.D. Short-term exposure to fine particulate matter air pollution is preferentially associated with the risk of ST-segment elevation acute coronary events. J. Am. Heart Assoc. 2015, 4, e002506. [Google Scholar] [CrossRef] [PubMed]
  20. Liu, Y.; Austin, E.; Xiang, J.; Gould, T.; Larson, T.; Seto, E. Health impact assessment of the 2020 Washington State wildfire smoke episode: Excess health burden attributable to increased PM2.5 exposures and potential exposure reductions. GeoHealth 2021, 5, e2020GH000359. [Google Scholar] [CrossRef]
  21. Balmes, J.R. The Changing Nature of Wildfires: Impacts on the Health of the Public. Clin. Chest Med. 2020, 41, 771–776. [Google Scholar] [CrossRef]
  22. Aguilera, R.; Corringham, T.; Gershunov, A.; Benmarhnia, T. Wildfire smoke impacts respiratory health more than fine particles from other sources: Observational evidence from Southern California. Nat. Commun. 2021, 12, 1493. [Google Scholar] [CrossRef] [PubMed]
  23. Meo, S.A.; Abukhalaf, A.A.; Alomar, A.A.; Alessa, O.M.; Sami, W.; Klonoff, D.C. Effect of environmental pollutants PM2.5, carbon monoxide, and ozone on the incidence and mortality of SARS-COV-2 infection in ten wildfire affected counties in California. Sci. Total Environ. 2021, 757, 143948. [Google Scholar] [CrossRef]
  24. Zhou, X.; Josey, K.; Kamareddine, L.; Caine, M.C.; Liu, T.; Mickley, L.J.; Cooper, M.; Dominici, F. Excess of COVID-19 cases and deaths due to fine particulate matter exposure during the 2020 wildfires in the United States. Sci. Adv. 2021, 7, eabi8789. [Google Scholar] [CrossRef]
  25. Black, C.; Tesfaigzi, Y.; Bassein, J.A.; Miller, L.A. Wildfire smoke exposure and human health: Significant gaps in research for a growing public health issue. Environ. Toxicol. Pharmacol. 2017, 55, 186–195. [Google Scholar] [CrossRef] [PubMed]
  26. Azimi, P.; Zhao, D.; Stephens, B. Estimates of HVAC filtration efficiency for fine and ultrafine particles of outdoor origin. Atmos. Environ. 2014, 98, 337–346. [Google Scholar] [CrossRef]
  27. Lin, C.-C. A review of the impact of fireworks on particulate matter in ambient air. J. Air Waste Manag. Assoc. 2016, 66, 1171–1182. [Google Scholar] [CrossRef]
  28. Mousavi, A.; Yuan, Y.; Masri, S.; Barta, G.; Wu, J. Impact of 4th of July Fireworks on Spatiotemporal PM2. 5 Concentrations in California Based on the PurpleAir Sensor Network: Implications for Policy and Environmental Justice. Int. J. Environ. Res. Public Health 2021, 18, 5735. [Google Scholar] [CrossRef]
  29. Rindelaub, J.D.; Davy, P.K.; Talbot, N.; Pattinson, W.; Miskelly, G.M. The contribution of commercial fireworks to both local and personal air quality in Auckland, New Zealand. Environ. Sci. Pollut. Res. 2021, 28, 21650–21660. [Google Scholar] [CrossRef]
  30. Jaffe, D.A.; Cooper, O.R.; Fiore, A.M.; Henderson, B.H.; Tonnesen, G.S.; Russell, A.G.; Henze, D.K.; Langford, A.O.; Lin, M.; Moore, T. Scientific assessment of background ozone over the US: Implications for air quality management. Elem. Sci. Anthr. 2018, 6, 56. [Google Scholar] [CrossRef]
  31. Yu, P.; Toon, O.B.; Bardeen, C.G.; Zhu, Y.; Rosenlof, K.H.; Portmann, R.W.; Thornberry, T.D.; Gao, R.-S.; Davis, S.M.; Wolf, E.T.; et al. Black carbon lofts wildfire smoke high into the stratosphere to form a persistent plume. Science 2019, 365, 587–590. [Google Scholar] [CrossRef] [PubMed]
  32. Álvarez-Miño, L.; Taboada-Montoya, R. Effects of climate change on Public Health 2015–2020. A systematic review. Rev. Esp. Salud Publica 2021, 95, e202103042. [Google Scholar]
  33. Mendoza, D.L.; Benney, T.M.; Bares, R.; Fasoli, B.; Anderson, C.; Gonzales, S.A.; Crosman, E.T.; Hoch, S. Investigation of Indoor and Outdoor Fine Particulate Matter Concentrations in Schools in Salt Lake City, Utah. Pollutants 2022, 2, 82–97. [Google Scholar] [CrossRef]
  34. Junghenn Noyes, K.; Kahn, R.; Sedlacek, A.; Kleinman, L.; Limbacher, J.; Li, Z. Wildfire smoke particle properties and evolution, from space-based multi-angle imaging. Remote Sens. 2020, 12, 769. [Google Scholar] [CrossRef]
  35. SCHäFER, K.; Elsasser, M.; Arteaga-Salas, J.M.; Gu, J.; Pitz, M.; Schnelle-Kreis, J.; Cyrys, J.; Emeis, S.; Prevot, A.S.; Zimmermann, R. Impact of meteorological conditions on airborne fine particle composition and secondary pollutant characteristics in urban area during winter-time. Meteorol. Z. 2016, 25, 267–279. [Google Scholar] [CrossRef]
  36. Abatzoglou, J.T.; Williams, A.P. Impact of anthropogenic climate change on wildfire across western US forests. Proc. Natl. Acad. Sci. USA 2016, 113, 11770–11775. [Google Scholar] [CrossRef]
  37. Westerling, A.L. Increasing western US forest wildfire activity: Sensitivity to changes in the timing of spring. Philos. Trans. R. Soc. London. Ser. B Biol. Sci. 2016, 371, 20150178. [Google Scholar] [CrossRef] [PubMed]
  38. Horel, J.; Crosman, E.T.; Jacques, A.; Blaylock, B.; Arens, S.; Long, A.; Sohl, J.; Martin, R. Summer ozone concentrations in the vicinity of the Great Salt Lake. Atmos. Sci. Lett. 2016, 17, 480–486. [Google Scholar] [CrossRef]
  39. Cascio, W.E. Wildland fire smoke and human health. Sci. Total Environ. 2018, 624, 586–595. [Google Scholar] [CrossRef]
  40. Balmes, J.R. Where There’s Wildfire, There’s Smoke. N. Engl. J. Med. 2018, 378, 881–883. [Google Scholar] [CrossRef]
  41. United States Census Bureau. State & County QuickFacts; United States Census Bureau: Suitland, MD, USA. Available online: https://www.census.gov/quickfacts/fact/table/provocityutah,US/INC110219 (accessed on 24 August 2021).
  42. Google. Utah State Hospital in Provo; Google: Mountain View, CA, USA, 2021. [Google Scholar]
  43. United States Geological Survey. Elevation Point Query Service; United States Geological Survey: Reston, VA, USA, 2024. [Google Scholar]
  44. Li, Y. Variable frequency drive applications in HVAC systems. New Appl. Electr. Drives 2015, 167–185. [Google Scholar]
  45. Mendoza, D.L.; Crosman, E.T.; Mitchell, L.E.; Jacques, A.; Fasoli, B.; Park, A.M.; Lin, J.C.; Horel, J. The TRAX Light-Rail Train Air Quality Observation Project. Urban Sci. 2019, 3, 108. [Google Scholar] [CrossRef]
  46. Bulot, F.M.J.; Russell, H.S.; Rezaei, M.; Johnson, M.S.; Ossont, S.J.J.; Morris, A.K.R.; Basford, P.J.; Easton, N.H.C.; Foster, G.L.; Loxham, M. Laboratory comparison of low-cost particulate matter sensors to measure transient events of pollution. Sensors 2020, 20, 2219. [Google Scholar] [CrossRef]
  47. Met One Instruments Inc. ES-642 Dust Monitor Operation Manual; Met One Instruments Inc.: Grants Pass, OR, USA, 2013. [Google Scholar]
  48. United States Environmental Protection Agency. Air Quality Index (AQI) Basics. Available online: https://www.airnow.gov/aqi/aqi-basics/ (accessed on 12 December 2023).
  49. Shi, L.; Zanobetti, A.; Kloog, I.; Coull, B.A.; Koutrakis, P.; Melly, S.J.; Schwartz, J.D. Low-concentration PM2.5 and mortality: Estimating acute and chronic effects in a population-based study. Environ. Health Perspect. 2016, 124, 46–52. [Google Scholar] [CrossRef] [PubMed]
  50. Liu, C.; Chen, R.; Sera, F.; Vicedo-Cabrera, A.M.; Guo, Y.; Tong, S.; Coelho, M.S.; Saldiva, P.H.; Lavigne, E.; Matus, P. Ambient particulate air pollution and daily mortality in 652 cities. N. Engl. J. Med. 2019, 381, 705–715. [Google Scholar] [CrossRef]
  51. Silcox, G.D.; Kelly, K.E.; Crosman, E.T.; Whiteman, C.D.; Allen, B.L. Wintertime PM2.5 concentrations during persistent, multi-day cold-air pools in a mountain valley. Atmos. Environ. 2012, 46, 17–24. [Google Scholar] [CrossRef]
  52. Lin, J.C.; Gerbig, C.; Wofsy, S.C.; Andrews, A.E.; Daube, B.C.; Davis, K.J.; Grainger, C.A. A near-field tool for simulating the upstream influence of atmospheric observations: The Stochastic Time-Inverted Lagrangian Transport (STILT) model. J. Geophys. Res. Atmos. 2003, 108. [Google Scholar] [CrossRef]
  53. Fasoli, B.; Lin, J.C.; Bowling, D.R.; Mitchell, L.; Mendoza, D. Simulating atmospheric tracer concentrations for spatially distributed receptors: Updates to the Stochastic Time-Inverted Lagrangian Transport model's R interface (STILT-R version 2). Geosci. Model Dev. 2018, 11, 2813–2824. [Google Scholar] [CrossRef]
  54. Loughner, C.P.; Fasoli, B.; Stein, A.F.; Lin, J.C. Incorporating Features from the Stochastic Time-Inverted Lagrangian Transport (STILT) Model into the Hybrid Single-Particle Lagrangian Integrated Trajectory (HYSPLIT) Model: A Unified Dispersion Model for Time-Forward and Time-Reversed Applications. J. Appl. Meteorol. Climatol. 2021, 60, 799–810. [Google Scholar] [CrossRef]
  55. Benjamin, S.G.; Weygandt, S.S.; Brown, J.M.; Hu, M.; Alexander, C.R.; Smirnova, T.G.; Olson, J.B.; James, E.P.; Dowell, D.C.; Grell, G.A. A North American hourly assimilation and model forecast cycle: The Rapid Refresh. Mon. Weather Rev. 2016, 144, 1669–1694. [Google Scholar] [CrossRef]
  56. Koster, R.D.; Darmenov, A.S.; da Silva, A.M. The Quick Fire Emissions Dataset (QFED): Documentation of Versions 2.1, 2.2 and 2.4; Technical Report Series on Global Modeling and Data Assimilation; Goddard Space Flight Center, NASA Goddard Space Flight Center: Greenbelt, MD, USA, 2015; Volume 38. [Google Scholar]
  57. Mallia, D.V.; Kochanski, A.K.; Urbanski, S.P.; Lin, J.C. Optimizing smoke and plume rise modeling approaches at local scales. Atmosphere 2018, 9, 166. [Google Scholar] [CrossRef]
  58. Mallia, D.V.; Lin, J.C.; Urbanski, S.; Ehleringer, J.; Nehrkorn, T. Impacts of upwind wildfire emissions on CO, CO2, and PM2.5 concentrations in Salt Lake City, Utah. J. Geophys. Res. Atmos. 2015, 120, 147–166. [Google Scholar] [CrossRef]
  59. Dowell, D.C.; Alexander, C.R.; James, E.P.; Weygandt, S.S.; Benjamin, S.G.; Manikin, G.S.; Blake, B.T.; Brown, J.M.; Olson, J.B.; Hu, M. The High-Resolution Rapid Refresh (HRRR): An hourly updating convection-allowing forecast model. Part I: Motivation and system description. Weather. Forecast. 2022, 37, 1371–1395. [Google Scholar] [CrossRef]
  60. Kelly, J.T.; Koplitz, S.N.; Baker, K.R.; Holder, A.L.; Pye, H.O.; Murphy, B.N.; Bash, J.O.; Henderson, B.H.; Possiel, N.C.; Simon, H. Assessing PM2.5 model performance for the conterminous US with comparison to model performance statistics from 2007–2015. Atmos. Environ. 2019, 214, 116872. [Google Scholar] [CrossRef] [PubMed]
  61. Avery, A.M.; Waring, M.S.; DeCarlo, P.F. Seasonal variation in aerosol composition and concentration upon transport from the outdoor to indoor environment. Environ. Sci. Process. Impacts 2019, 21, 528–547. [Google Scholar] [CrossRef] [PubMed]
  62. Kuprov, R.; Eatough, D.J.; Cruickshank, T.; Olson, N.; Cropper, P.M.; Hansen, J.C. Composition and secondary formation of fine particulate matter in the Salt Lake Valley: Winter 2009. J. Air Waste Manag. Assoc. 2014, 64, 957–969. [Google Scholar] [CrossRef] [PubMed]
  63. Wang, S.; Wang, L.; Wang, N.; Ma, S.; Su, F.; Zhang, R. Formation of droplet-mode secondary inorganic aerosol dominated the increased PM2.5 during both local and transport haze episodes in Zhengzhou, China. Chemosphere 2021, 269, 128744. [Google Scholar] [CrossRef] [PubMed]
  64. Sedlacek, A.J., III; Lewis, E.R.; Onasch, T.B.; Zuidema, P.; Redemann, J.; Jaffe, D.; Kleinman, L.I. Using the black carbon particle mixing state to characterize the lifecycle of biomass burning aerosols. Environ. Sci. Technol. 2022, 56, 14315–14325. [Google Scholar] [CrossRef]
  65. Okoshi, R.; Rasheed, A.; Reddy, G.C.; McCrowey, C.J.; Curtis, D.B. Size and mass distributions of ground-level sub-micrometer biomass burning aerosol from small wildfires. Atmos. Environ. 2014, 89, 392–402. [Google Scholar] [CrossRef]
  66. Mullen, C.; Grineski, S.E.; Collins, T.W.; Mendoza, D.L. Effects of PM2.5 on Third Grade Students’ Proficiency in Math and English Language Arts. Int. J. Environ. Res. Public Health 2020, 17, 6931. [Google Scholar] [CrossRef]
  67. Tang, C.-S.; Wan, G.-H. Air quality monitoring of the post-operative recovery room and locations surrounding operating theaters in a medical center in Taiwan. PLoS ONE 2013, 8, e61093. [Google Scholar] [CrossRef] [PubMed]
  68. Afful, A.E.; Osei Assibey Antwi, A.D.D.; Ayarkwa, J.; Acquah, G.K.K. Impact of improved indoor environment on recovery from COVID-19 infections: A review of literature. Facilities 2022, 40, 719–736. [Google Scholar] [CrossRef]
Figure 1. Study area including location of wildfire and fireworks event. Utah within the United States, Utah County and Provo within Utah, and sensor location in context showing the Wasatch Mountain Range (to the East), Utah Lake (to the West), and the orientation of the hospital (approximately 45 degrees to the North). The hospital is marked with a red cross, the Ether wildfire is shown as a yellow and red flame to the southeast of the hospital, and the location of the 4 July fireworks is the blue square just north of the hospital.
Environments 11 00186 g001
Figure 2. Study case wildfire satellite and source images. (a) MODIS true-color imagery over the Western USA from the AQUA instrument on 20 August 2020, corresponding to the California Complex Wildfire. (b) MODIS true-color imagery over Utah’s Wasatch Front from the AQUA instrument on 7 September 2020, corresponding to the Ether Wildfire; the yellow star marks the observation site.
Environments 11 00186 g002
Figure 3. STILT-estimated PM2.5 contributions from regional wildfires across the Western United States percentage (%) contribution to the measurements at the study site during the period of the Complex Wildfire (a) 20–24 August 2020, and Ether Wildfire (b) 10–26 September 2020; the blue star marks the observation site.
Environments 11 00186 g003
Figure 4. Observed and STILT-estimated wildfire PM2.5 contributions during the summer and fall of 2020. Highlighted areas denote studied wildfire episodes; purple corresponds to the Complex Wildfire (16–31 August 2020) and red to the Ether Wildfire (8–21 September 2020).
Environments 11 00186 g004
Figure 5. Hourly PM2.5 full time series for the outdoor and indoor sensors. The dashed horizontal lines indicate the lower limits of yellow, orange, and red air quality as indicated by the U.S. Environmental Protection Agency (EPA) established Air Quality Index (AQI) cutoffs for criteria pollutants [48].
Environments 11 00186 g005
Figure 6. PM2.5 study event timeseries. (a) California Complex wildfire (8–31 August 2020), (b) Ether wildfire (7–21 September 2020), (c) 4 July fireworks (4–5 July 2020), and (d) wintertime inversion (27 December 2020–4 January 2021). The dashed horizontal lines indicate the lower limits of yellow, orange, and red air quality as indicated by the U.S. Environmental Protection Agency (EPA) established Air Quality Index (AQI) cutoffs for criteria pollutants [48].
Environments 11 00186 g006
Table 1. Comparison of study case indoor and outdoor PM2.5 measurements. Indoor PM2.5 comparison t-test results for study events at high (>12 µg/m3) PM2.5 values as read at the outdoor rooftop (“Out”) sensor. The mean values at the two indoor sensors (“Dorm” and “Daycare”) are shown as well as their concentration compared to the outside readings. Mean wind direction is also shown for each event.
EventMean Out
(µg/m3)
Mean Dorm
µg/m3 (% Out)
Mean Daycare
µg/m3 (% Out)
p-Valuet-StatisticCI
Low, High
Complex Wildfire21.7115.18 (70%)13.52 (62%)1.24 × 10−4514.251.43, 1.89
Ether Wildfire20.8013.64 (66%)14.17 (68%)0.000−5.581−0.72, −0.34
4 July Fireworks32.6817.16 (53%)18.99 (58%)0.001−3.208−2.95, −0.71
Inversion18.073.99 (22%)2.30 (13%)0.00053.691.62, 1.75
Disclaimer/Publisher’s Note: The statements, opinions and data contained in all publications are solely those of the individual author(s) and contributor(s) and not of MDPI and/or the editor(s). MDPI and/or the editor(s) disclaim responsibility for any injury to people or property resulting from any ideas, methods, instructions or products referred to in the content.

