Abstract
This study analyzes the evolution of surface water and groundwater temperatures at various depths in the sand-dune ponds of Doñana National Park (southern Spain) over eight hydrometeorological years (2016–2024). This research aims to characterize the water temperature regime, identify water temperature trends, and analyze patterns in groundwater flow dynamics. The results indicate that, in a recent dry–warm period (2020–2023), coinciding with a notable decrease in precipitation and an increase in the average air temperature in the area, there was an increase in the annual mean temperature of pond water and in shallow piezometers (~15 m depth). However, in deep piezometers, a decrease in water temperature was recorded during the dry–warm period, along with a reduction in temperature variability. A phase shift has also been observed between groundwater temperature extremes and air temperature variations, with the magnitude of this shift depending on sensor depth. These findings enable the analysis of the sensitivity of these wetlands to global environmental change and contribute to the characterization of recharge and discharge flows in the aquifer, both at local and regional scales, allowing for the evaluation of flow variability in hydrological years with below-average precipitation and above-average air temperature and shallow groundwater temperature.
1. Introduction
Sand-dune ponds are among the most iconic ecosystems of Doñana National Park (DNP) in southwestern Spain. These wetlands play a critical role, not only supporting local biodiversity but also providing key ecosystem services, such as offering habitats for threatened species and contributing to global ecological balance [1,2,3]. The good ecological status of these ponds is closely tied to the Almonte-Marismas aquifer system, making them sensitive indicators of both global environmental change and anthropogenic pressures on the ecosystem [4].
The Almonte-Marismas detrital aquifer is a multilayered system administratively divided into six groundwater bodies, with complex hydrogeological dynamics that complicate sustainable management [2,5,6]. Since the 1970s, agricultural intensification and the growing demand for urban water have led to significant historical groundwater drawdowns, with water table declines of up to 20 m reported in some areas [2,7]. This overexploitation jeopardizes not only the aquifer’s long-term sustainability but also the equilibrium of dependent ecosystems, such as ponds and marshes [2,8,9].
From a hydrological perspective, Doñana’s sand-dune ponds function as local discharge or flow-through systems for one of the groundwater bodies comprising the Almonte-Marismas aquifer, known as the Coastal Aeolian Mantle of Doñana [10,11,12,13]. This close dependency on groundwater makes these wetlands particularly vulnerable to changes in the aquifer’s water levels. Consequently, numerous scientific studies have focused on understanding how fluctuations in the aquifer’s water regime influence pond dynamics and, by extension, the overall functionality of the ecosystem [4,9,12,14].
A particularly effective method for analyzing the interconnection between the surface environment and the behavior of an aquifer is the use of water temperature as a hydrological tracer ([15] and references therein). Ref. [16] emphasized the relevance of this method in the Almonte-Marismas aquifer, analyzing vertical temperature profiles and performing one-dimensional modeling of heat transport to investigate groundwater recharge and discharge processes. However, its initial applications were limited due to the lack of suitable technology for obtaining precise thermal records at the time. In recent decades, advances in instrumentation and numerical modeling have significantly enabled the use of temperature to study recharge, discharge, and groundwater transport processes in both karst [17,18] and detrital aquifers [19,20]. In fact, in [19], two-dimensional numerical modeling of heat transport in a detrital coastal aquifer was conducted, providing a detailed framework for understanding thermal transport in coastal aquifers, such as the Almonte-Marismas aquifer system. This model integrated field data and sensitivity analysis to evaluate how changes in input variables affect model outputs, to identify how parameters like hydraulic conductivity, thermal gradient, and aquifer geological properties influence temperature distribution, providing a solid foundation for future studies on the use of heat as a groundwater tracer in coastal aquifers. However, even in this study, the authors highlighted the need to calibrate such models with empirical data, particularly with thermal measurements from deep coastal wells (approx. 150 m).
Recent studies have provided methodological advancements in the modeling of heat transport in coastal aquifers, with particular relevance given to those that account for variability in the position of the saline interface [5,21,22,23]. These new models, beyond their methodological progress in describing the hydrogeological functioning of such aquifers, are particularly interesting from the perspective of using heat as a tracer of subsurface flow. However, no studies on thermal modeling or heat transport in groundwater have been conducted in the Almonte-Marismas aquifer since Custodio’s work in 1996 [16], despite the significant uncertainty inherent in this single study due to the technological limitations at the time, which made it impossible to monitor surface water and groundwater temperature at key points within the aquifer. This expansion of the description of groundwater flows at both local and regional scales in the Almonte-Marismas aquifer becomes particularly relevant when considering the increasing impacts of climate change on Mediterranean wetlands, e.g., [24,25].
In 2015, the Guadalquivir River Basin Authority (Confederación Hidrográfica del Gualdalquivir, CHG), in collaboration with Pablo de Olavide University, launched a research project focused on the hydrological study of the sand-dune ponds of the DNP, which remains ongoing. As part of this initiative, a comprehensive monitoring network was established, incorporating pressure transducers and temperature sensors in the park’s most significant ponds, along with piezometers installed near these water bodies. Data collection occurs at three-hour intervals, resulting in a rich dataset on time-dependent water level fluctuations and temperature dynamics both in the pond’s surface water and in groundwater. The continuous thermal records since 2016 represent valuable information that may help calibrate the impacts of climate change on these ecosystems and contribute to the characterization of vertical and horizontal groundwater flow, providing important insights for understanding the complex hydrological dynamics of the Almonte-Marismas aquifer. Regardless of the results achieved by this research project in characterizing the hydrological functioning of the sand-dune ponds, a specific study was carried out [10] involving the use of a water temperature dataset obtained between 2016 and 2018. However, this thermal analysis was limited to the characterization of groundwater flow at a local scale (m to hm) and did not yet record the evolution of surface water and groundwater temperature during the extreme heat and drought periods that have occurred in recent years.
In this particular context, it is essential to assess the extent to which the increase in air temperature has affected the thermal regime of these aquatic ecosystems and what hydrogeological information can be extracted from high-resolution water temperature records during the period analyzed in this research.
Overall, the analysis of accurate water temperature records in these ponds is a crucial tool for monitoring the effects of global environmental change on these ecosystems and is also useful for the calibration and development of groundwater flow and heat transport models. Accordingly, the objectives of this study include, first, the creation of a database integrating the thermal records obtained during the research project. Second, this study aims to characterize the thermal regime of both the surface water and groundwater around the sand-dune ponds and identify recent trends related to rising temperatures and decreasing precipitation. Through this analysis, the water temperature records are intended to serve as indicators of global change impacts and help identify potential groundwater flow dynamics at both local (m to hm) and regional (>km) scales.
2. Study Zone and Hydrogeological Characteristics of the Almonte-Marismas Aquifer
Doñana National Park (DNP) is a large, protected area in southwestern Spain (Figure 1A). Located on the right bank of the Guadalquivir River, near its estuary where it meets the Atlantic Ocean, this area is one of the most important wetlands in Europe, recognized as a UNESCO World Heritage Site and a Ramsar Wetland of International Importance.
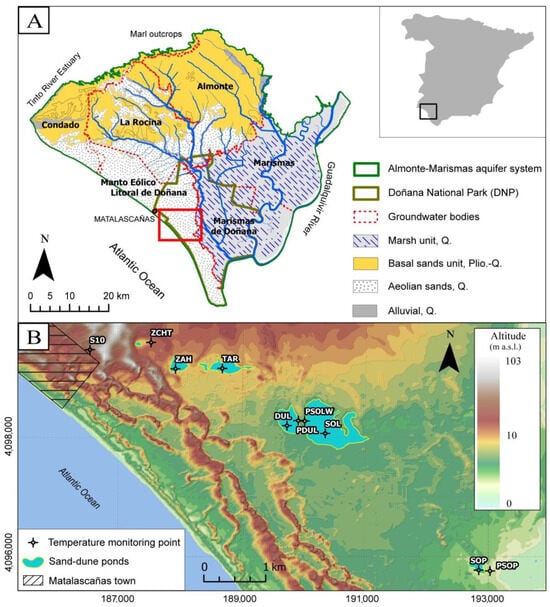
Figure 1.
(A) Map of the Almonte-Marismas aquifer system, showing the boundaries of the groundwater bodies (Almonte, Condado, Rocina, Manto Eólico, Marismas, and Marismas de Doñana), the main lithostratigraphic units, and the location of Doñana National Park (DNP). (B) Location of monitoring points of the sand-dune pond system, Zacallón Charco del Toro (ZCHT), Zahíllo pond (ZAH), Taraje pond (TAR), Dulce pond (DUL), Santa Olalla pond (SOL), and Sopetón pond (SOP), and groundwater monitoring points, Sopetón pond piezometer (PSOP), Santa Olalla pond west piezometer (PSOLW), Dulce pond piezometer (PDUL), and borehole 10 (S10).
The DNP experiences a Mediterranean climate with hot, dry summers and mild, wet winters. During the summer months, temperatures can soar to over 40 °C, while winter temperatures typically range from 5 to 15 °C. The area receives most of its rainfall in the winter months. Despite significant spatial variability in rainfall, the average annual precipitation is 525 mm [26,27]. These weather conditions contribute to a highly diverse landscape in Doñana, which hosts a variety of habitats with high biodiversity, including ponds, seasonally flooded marshlands, dunes, and forests.
All these wetlands are dependent on the Almonte-Marismas aquifer, a hydrogeological system that extends beyond the boundaries of the DNP over an area of 2700 km2 (Figure 1A). For a detailed description of the lithostratigraphy of the aquifer see [28,29]. It lies above a Miocene–Pliocene marl unit that forms its impervious basement, dipping southeastward from ~50 m above sea level in the north to ~200 m below sea level in the south. Overlying these marls, the aquifer consists of Plio-Quaternary siliciclastic sediments of variable thickness—gravels, sands, and silts—referred to as the “Almonte-Marismas basal sands” [30]. These sands overlie a coarser detrital unit that dips towards the Atlantic Ocean [16,28]. In the southeasternmost area, the basal sands are covered by silt and clay deposits from the marsh unit (Figure 1A). Consequently, this unit functions as an unconfined aquifer in the northern half, where it outcrops (Figure 1A), transitioning into a confined system beneath the low-permeability marsh deposits in the south. In the southernmost part of the area, a Quaternary aeolian sand unit further covers the basal sand and marsh deposits, forming an active dune belt (Figure 1A). The aquifer is primarily recharged through direct rainfall infiltration in the unconfined zone, with groundwater flow predominantly directed southward and southeastward [16].
The Almonte-Marismas aquifer is a single hydrogeological system, but it is administratively divided into six groundwater bodies (Figure 1A), five managed by the Guadalquivir River Basin Authority (Marismas, Marismas de Doñana, Almonte, La Rocina, and Manto Eólico Litoral de Doñana) and one, called Condado, belonging to the Tinto–Odiel basin. The sand-dune ponds studied in this research are located on the edge of the mobile dune system of the aeolian sand unit, stretching from the town of Matalascañas to the boundary with the marshlands (Figure 1B). These ponds, mostly temporary, are primarily associated with the groundwater body of the aeolian sands and are directly supplied by rainfall and groundwater from this part of the aquifer. The specific characteristics of these ponds, as well as their location, are detailed in Table 1. In general, they are shallow lakes that usually do not exceed 2 m in depth. They are located at low altitudes, with the Charco del Toro pond being the highest (approx. 10.6 m a.s.l.). The flooded area occupied by these ponds varies greatly between wet and dry periods (Table 1). They are generally surrounded by sparse phreatophytic vegetation, except for the Taraje pond, which is densely surrounded by Tamarix sp. The Zacallón of Charco del Toro is also shaded by conifers most of the time.

Table 1.
Characteristics of the monitoring points, including ponds and piezometers. Altitude refers to the ground elevation (m a.s.l.), either at the lowest point of the pond basin or at the piezometer location. * Depth indicates the maximum depth reached by the pond during the monitoring period or the total depth of the piezometer. * For ZCHT, dimensions of the trench are provided, with the depth representing the total trench depth and the flooded area corresponding to the Zacallón area.
The Charco del Toro pond (ZCHT), the closest to Matalascañas, is located less than one kilometer from the town (Figure 1B). It is a temporary pond that only fills sporadically after heavy rainfall and remained dry during the study period. Southeast of it are the Zahíllo (ZAH) and Taraje (TAR) ponds, which have historically maintained a seasonal hydroperiod but have only flooded in recent years following intense rain episodes [31]. In contrast, the Dulce (DUL) and Santa Olalla (SOL) ponds exhibit longer hydroperiods. Santa Olalla is the only sand-dune pond with a permanent hydroperiod, although in recent years, it has dried up during the summer droughts of 2022 and 2023, an unprecedented event since 1995. Finally, the Sopetón pond (SOP), located at the boundary between the aeolian sands and the marshlands, is the farthest from Matalascañas.
All the ponds mentioned are connected to the aquifer; therefore, they are not perched systems. The water temperature monitoring points in this study were located in these six ponds and in piezometers near the Dulce (PDUL), Santa Olalla (PSOLW), and Sopetón (PSOP) ponds (Figure 1B). Temperature was also monitored in borehole 10 (S10), a supply well for Matalascañas, located only 700 m from the Charco del Toro pond.
3. Material and Methods
Surface water and groundwater temperatures were meticulously recorded through high-frequency monitoring (every three hours) in the sand-dune ponds of the DNP and in piezometers situated nearby. This monitoring was carried out by installing Levelogger and TD-Divers® 10 m pressure transducers, which accurately measure both water level variations, based on hydrostatic pressure, and water temperature. The TD-Diver and CTD-Diver sensors used in this study have a temperature accuracy of ±0.1 °C and a resolution of 0.01 °C. These sensors undergo a 30-point factory calibration, ensuring high precision, and do not require additional user calibration. However, monthly field visits were conducted throughout the monitoring period to collect temperature data. These visits allowed for the in situ calibration of the sensors using a portable multimeter (HACH-HQ40D, Hach Company, Loveland, Colorado, EE.UU.), ensuring consistency and accuracy in the recorded measurements.
Specifically, the monitoring encompassed six points for surface and subsurface waters and four points for groundwater (Figure 1B and Table 1).
Monitoring was conducted in each of the previously described ponds: Charco del Toro (ZCHT), Zahíllo (ZAH), Taraje (TAR), Dulce (DUL), Santa Olalla (SOL), and Sopetón (SOP). After bathymetric analyses of these ponds, the sensors were installed at their deepest points, where the staff gauge is generally located. However, in ponds like Zahíllo and Sopetón, significant water level reductions in recent years necessitated lowering the sensors to just a few centimeters below the ground surface. In these cases, the recorded temperature data represent shallow subsurface water temperatures, referred to here as “subsurface water”. Furthermore, in the case of the Charco del Toro pond, which remained dry throughout the monitoring period, the sensor was installed in a nearby artificial trench locally known as a “Zacallón”. These trenches are created to access groundwater for cattle when ponds dry out, ensuring the presence of water during drought periods. In this case, the sensor was also placed a few centimeters below the ground level, although it has not dried up as frequently as the ponds. Finally, the Dulce pond has no records between 2016 and 2020, as the sensor was installed in this pond in September 2020.
For groundwater monitoring, data were collected from four piezometers at different depths. The deepest of these, borehole 10 (S10), is a reserve water supply well located in Matalascañas, with a total depth of 170 m. However, the sensor was installed at a depth of 15 m below ground level. This well is located approximately 750 m from the Charco del Toro pond and about 1 km from the coastline (Figure 1). It is the only well in this study intermittently exploited, primarily during summer. Other piezometers, each around 20 m deep, are situated near the Dulce (PDUL) and Santa Olalla (PSOLW) ponds, with sensors installed at 9 m and 4 m depths, respectively. The shallowest piezometer, near the Sopetón pond, is a perforated PVC tube approximately 2 m deep, with the sensor positioned 1.5 m below ground level.
In addition to the temperature monitoring in piezometers, vertical temperature profiles were obtained in two piezometers using a Solinst Reelogger temperature-conductivity probe, with 0.1 °C temperature resolution. Temperature profiles were conducted with the aim of confirming the temperature profiles already presented in [16]. These two profiles were made in October 2024. Temperature measurements were taken at 1 m depth intervals, allowing the temperature to stabilize for a minimum of two minutes at each measurement point.
For data analysis, a database was created containing temperature records from each monitoring point. To identify and remove anomalous values, first, we graphically represented the temperature time series. Anomalous values were detected as clear outliers that deviated significantly from the expected trends in the dataset. These values were typically associated with sensor malfunctions and are very rare. Additionally, to ensure consistency, we applied a simple statistical outlier identification based on values that exceeded standard deviations considerably. Outliers were verified manually. Gaps in the dataset correspond to periods when the sensor was not functioning, usually spanning several days. These gaps were filled using linear interpolation when appropriate, ensuring minimal impact on the overall data structure.
The water temperature records covered eight full hydrometeorological years, from 1 September 2016 to 31 August 2024, in most locations, except for the Dulce pond, where monitoring began in 2020, and in the ZCHT pond, where water temperature was not recorded between 2018 and 2020. Similarly, the reliability of the data from well S10, which is intermittently exploited for urban supply to Matalascañas, was conditioned by the extraction frequency, leading to the exclusion of some years from the record due to insufficient reliability.
The temperature regime of the surface water, subsurface water, and groundwater was determined through a statistical descriptive analysis of the mean daily temperature from each monitoring point. After filtering and completing the database, preliminary analyses of daily average temperatures were conducted, followed by statistical descriptive evaluations to characterize the thermal regime at each monitored location. These statistical analyses were conducted using R Studio 2023.03.0+386 [32]. To assess temperature trends and variance comparison, we performed a t-test for independent samples to evaluate differences between different periods and ANOVA when comparing more than two groups. The significance level (α) was set at 0.05, and the obtained p-values were greater than 0.05, indicating no statistically significant differences.
Air temperature and precipitation data were also obtained from two meteorological stations in the study area: the Almonte station (37°08′53″ N, 06°28′35″ W) and the Palacio de Doñana station (36°59′19″ N, 06°26′35″ W). These meteorological stations are the closest to the ponds studied. Although there are local differences in precipitation distribution, this is not the case for air temperature. Therefore, the combined use of both stations in the climatic description of the study area is primarily determined by data availability. The Almonte station provides daily data starting from 2020, while the Palacio de Doñana station provides a longer dataset, dating back to 1978. These data were analyzed to contextualize the climatic conditions in the study area over the past two decades.
Considering the climatic context during the monitoring period, trend analyses were performed for 2020–2023, a period which represents the driest and warmest years in the dataset. Variance analysis (t-test) was also performed to compare the temperatures from the 2022/23 hydrometeorological year (end of the dry–warm period) with those of 2017/18, the coldest and wettest year in the series. We considered the month of September as the starting point of each hydrometeorological year.
During the development of the research project and up to the present, actual evapotranspiration has been measured using a Class A evaporimeter near the ponds. This has allowed for the precise determination of the hydrological balance variables in the studied ponds. However, in the Mediterranean climate, potential evapotranspiration always greatly exceeds annual precipitation. Therefore, we consider it relevant to highlight the evolution of annual precipitation when evaluating changes in water availability in these ecosystems.
4. Results
4.1. Climate Setting
Figure 2 shows the evolution of the annual average, maximum, and minimum air temperatures recorded at the Almonte weather station over the past 20 years. It also illustrates the annual thermal anomaly relative to the historical average air temperature in Doñana (i.e., 17.3 °C, based on the average temperature recorded at the Palacio de Doñana weather station between 1978 and 2024).
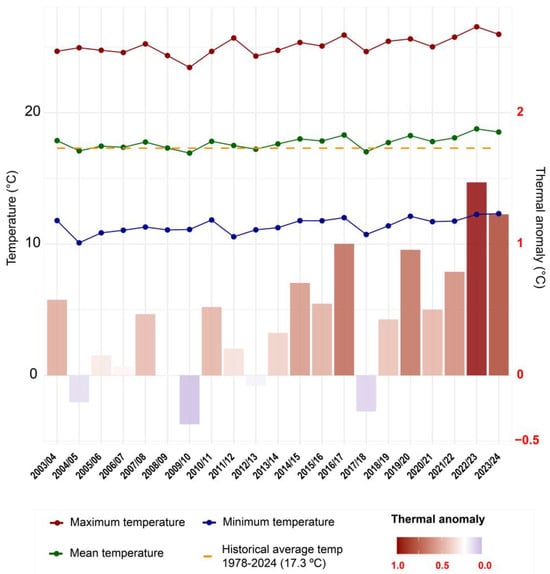
Figure 2.
Annual maximum, minimum, and mean air temperatures (°C) recorded at the Almonte meteorological station (2003–2024), along with the thermal anomaly. The historical average air temperature (1978–2024) of 17.3 °C was calculated from the daily mean temperature data recorded at the Palacio de Doñana meteorological station.
The average annual air temperature for the 2003–2024 period was 17.6 °C, slightly higher than the average for the 1978–2024 period (17.3 °C). While the annual average air temperature remained close to the historical average during the first decade of the 21st century, a sustained increase has been observed since 2014, with thermal anomalies reaching nearly 1.5 °C during the 2022/23 hydrometeorological year. In fact, between 2015 and 2024, the air temperature rose by up to 0.47 °C compared to the 2003–2014 period. This trend persisted throughout the monitoring period, except during the 2017/18 hydrometeorological year, which was relatively cold in this context (Figure 2).
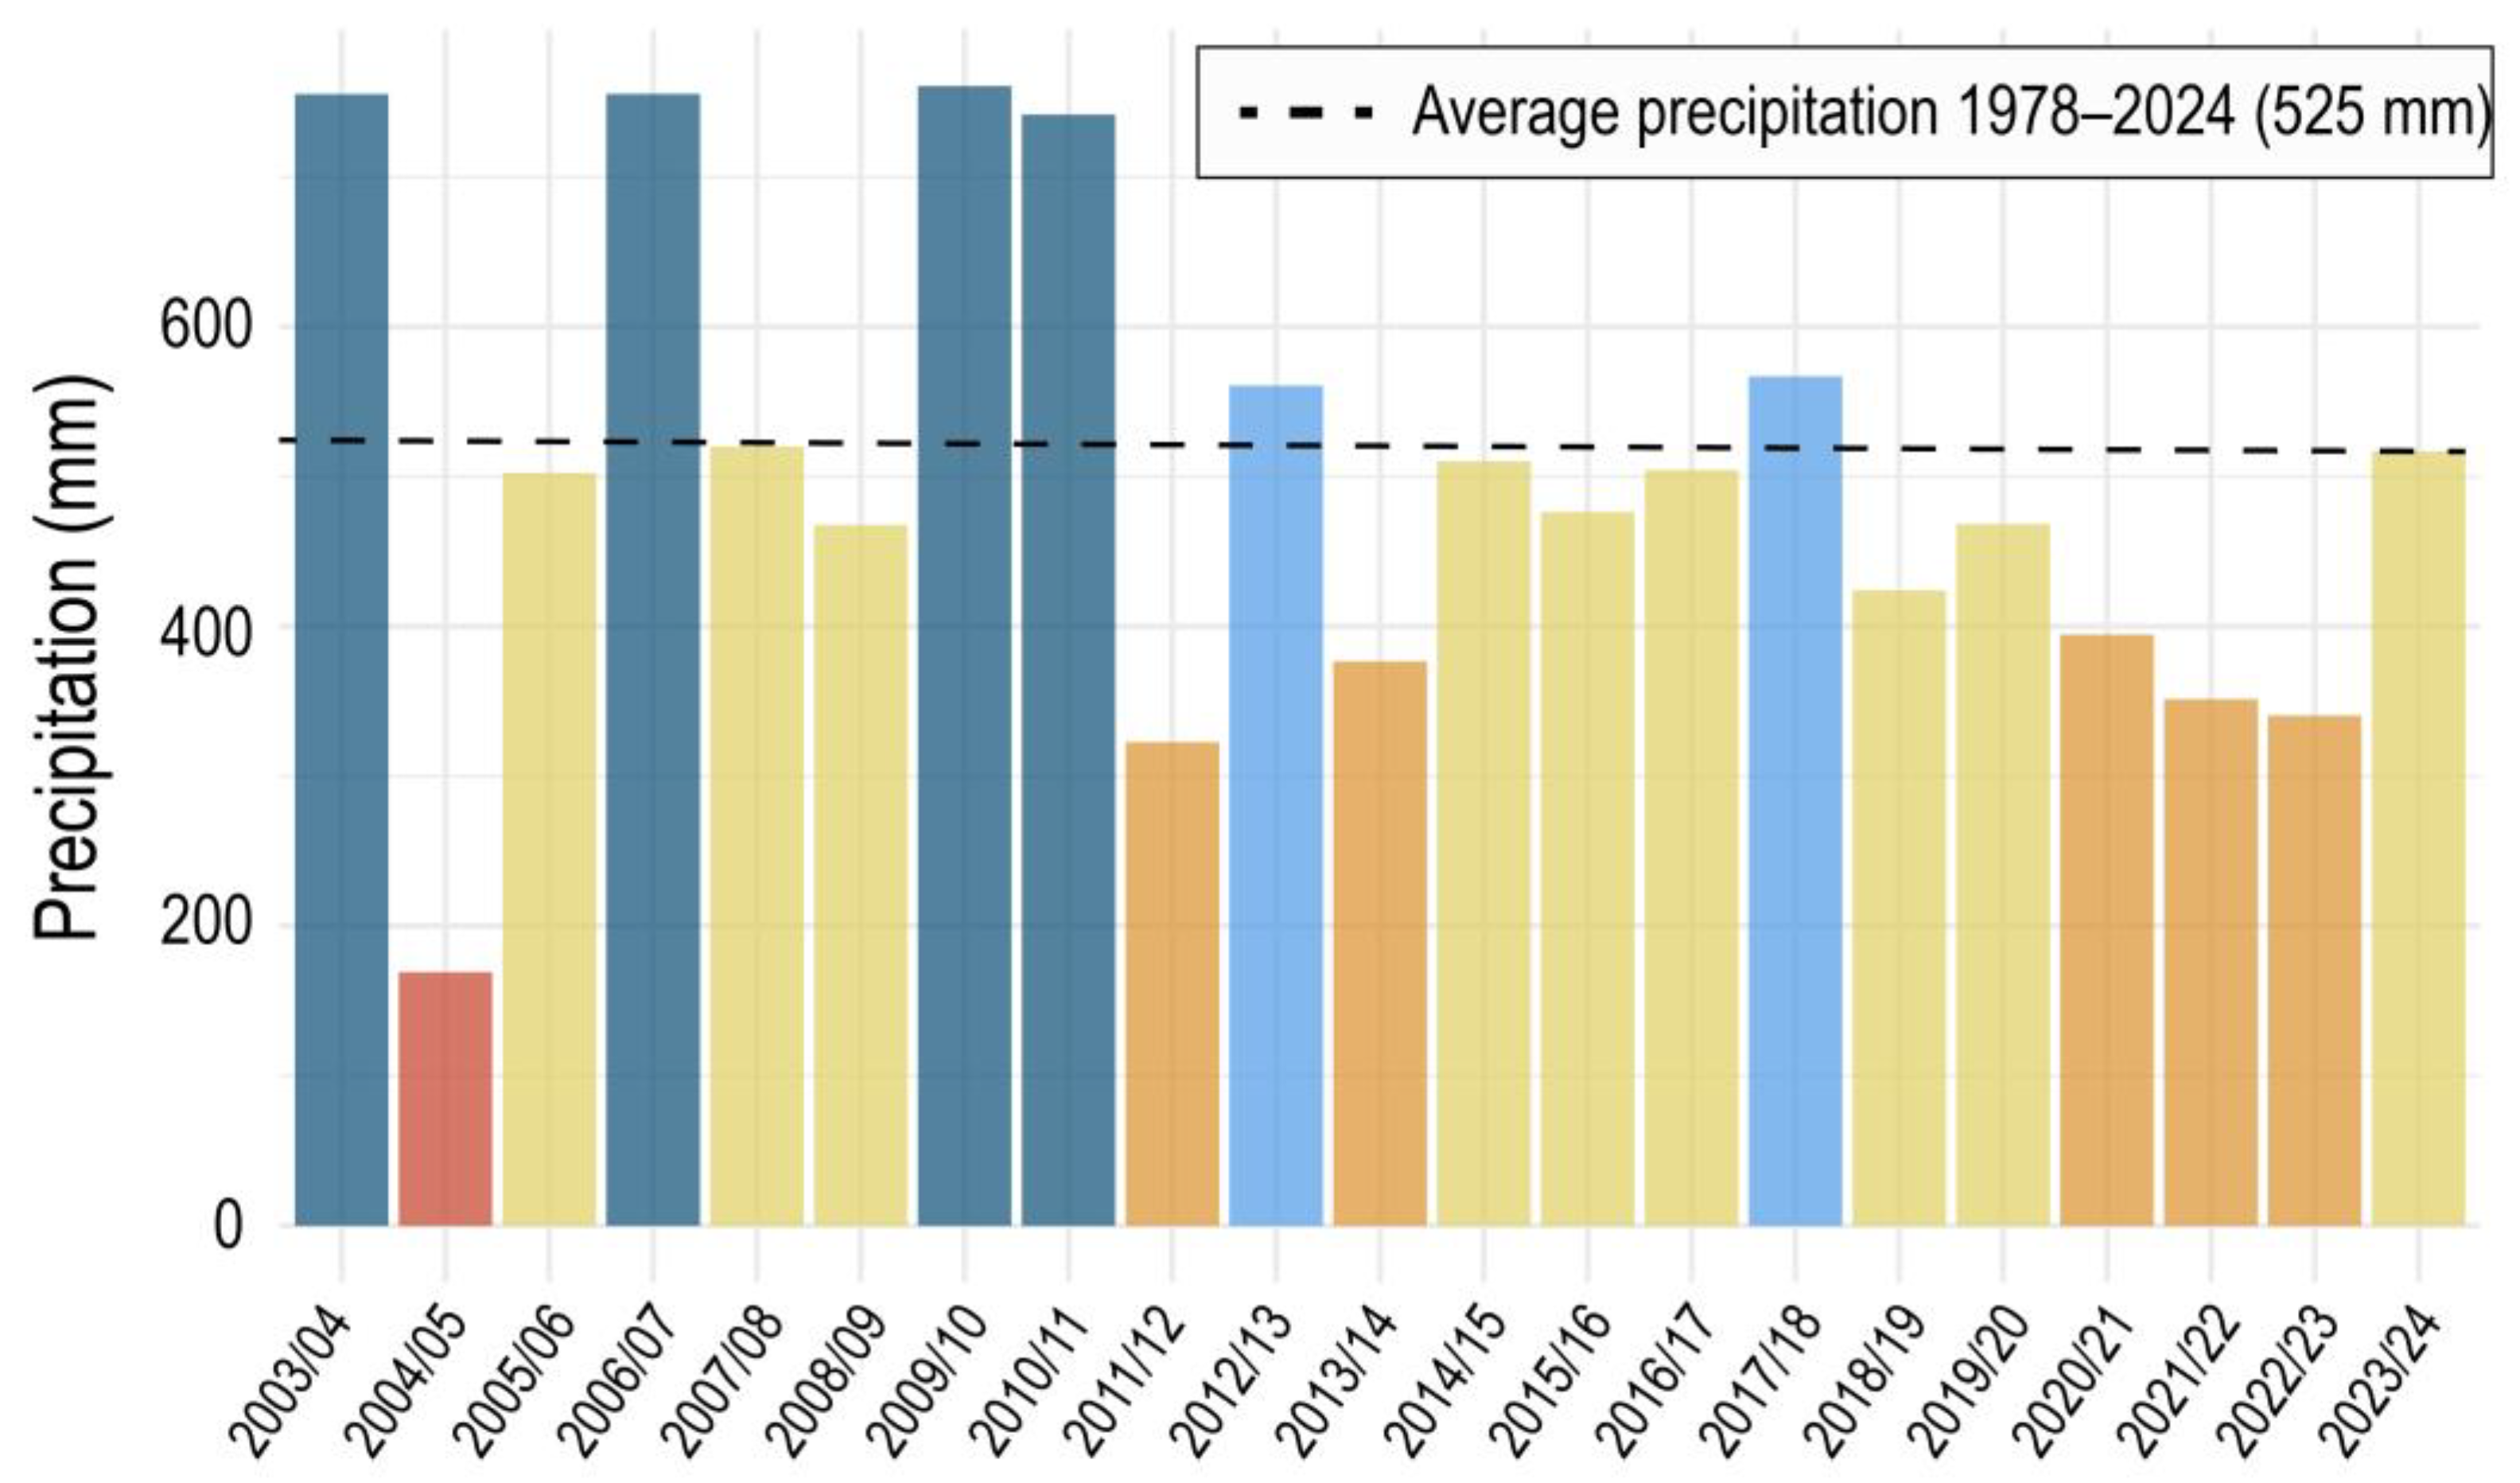
The total annual precipitation for the last 20 hydrometeorological years recorded at the Almonte weather station is displayed (Figure 3). Like the air temperature, a breaking point is observed in 2014. After this year, precipitation fell below the historical average in Doñana (i.e., 525 mm/year, based on the average precipitation recorded at the Palacio de Doñana weather station between 1978 and 2024), once again with the exception of the 2017/18 hydrometeorological year, when precipitation slightly exceeded the average.
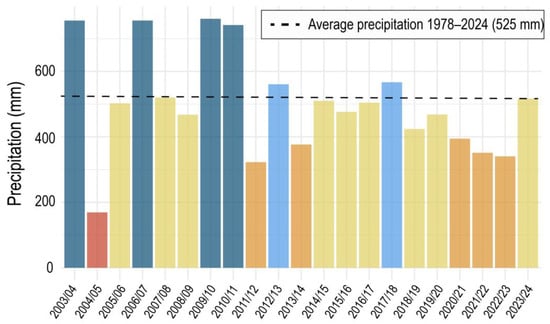
Figure 3.
Annual precipitation (mm) recorded at the Almonte meteorological station (2003–2024). The historical average precipitation (1978–2024) of 525 mm was calculated from the daily precipitation data recorded at the Palacio de Doñana meteorological station. Blue bars indicate years with above-average precipitation, while red, orange, and yellow bars indicate below-average precipitation.
Based on these data, the monitoring period has been characterized as a climatically anomalous dry–warm period, especially between 2020 and 2023, during which the most significant thermal anomalies and markedly below-average precipitation (approx. 360 mm/year) were recorded. In this context, the 2017/18 hydrometeorological year stands out as an exception, being relatively wet and cold.
4.2. Thermal Regime of Surface and Subsurface Waters
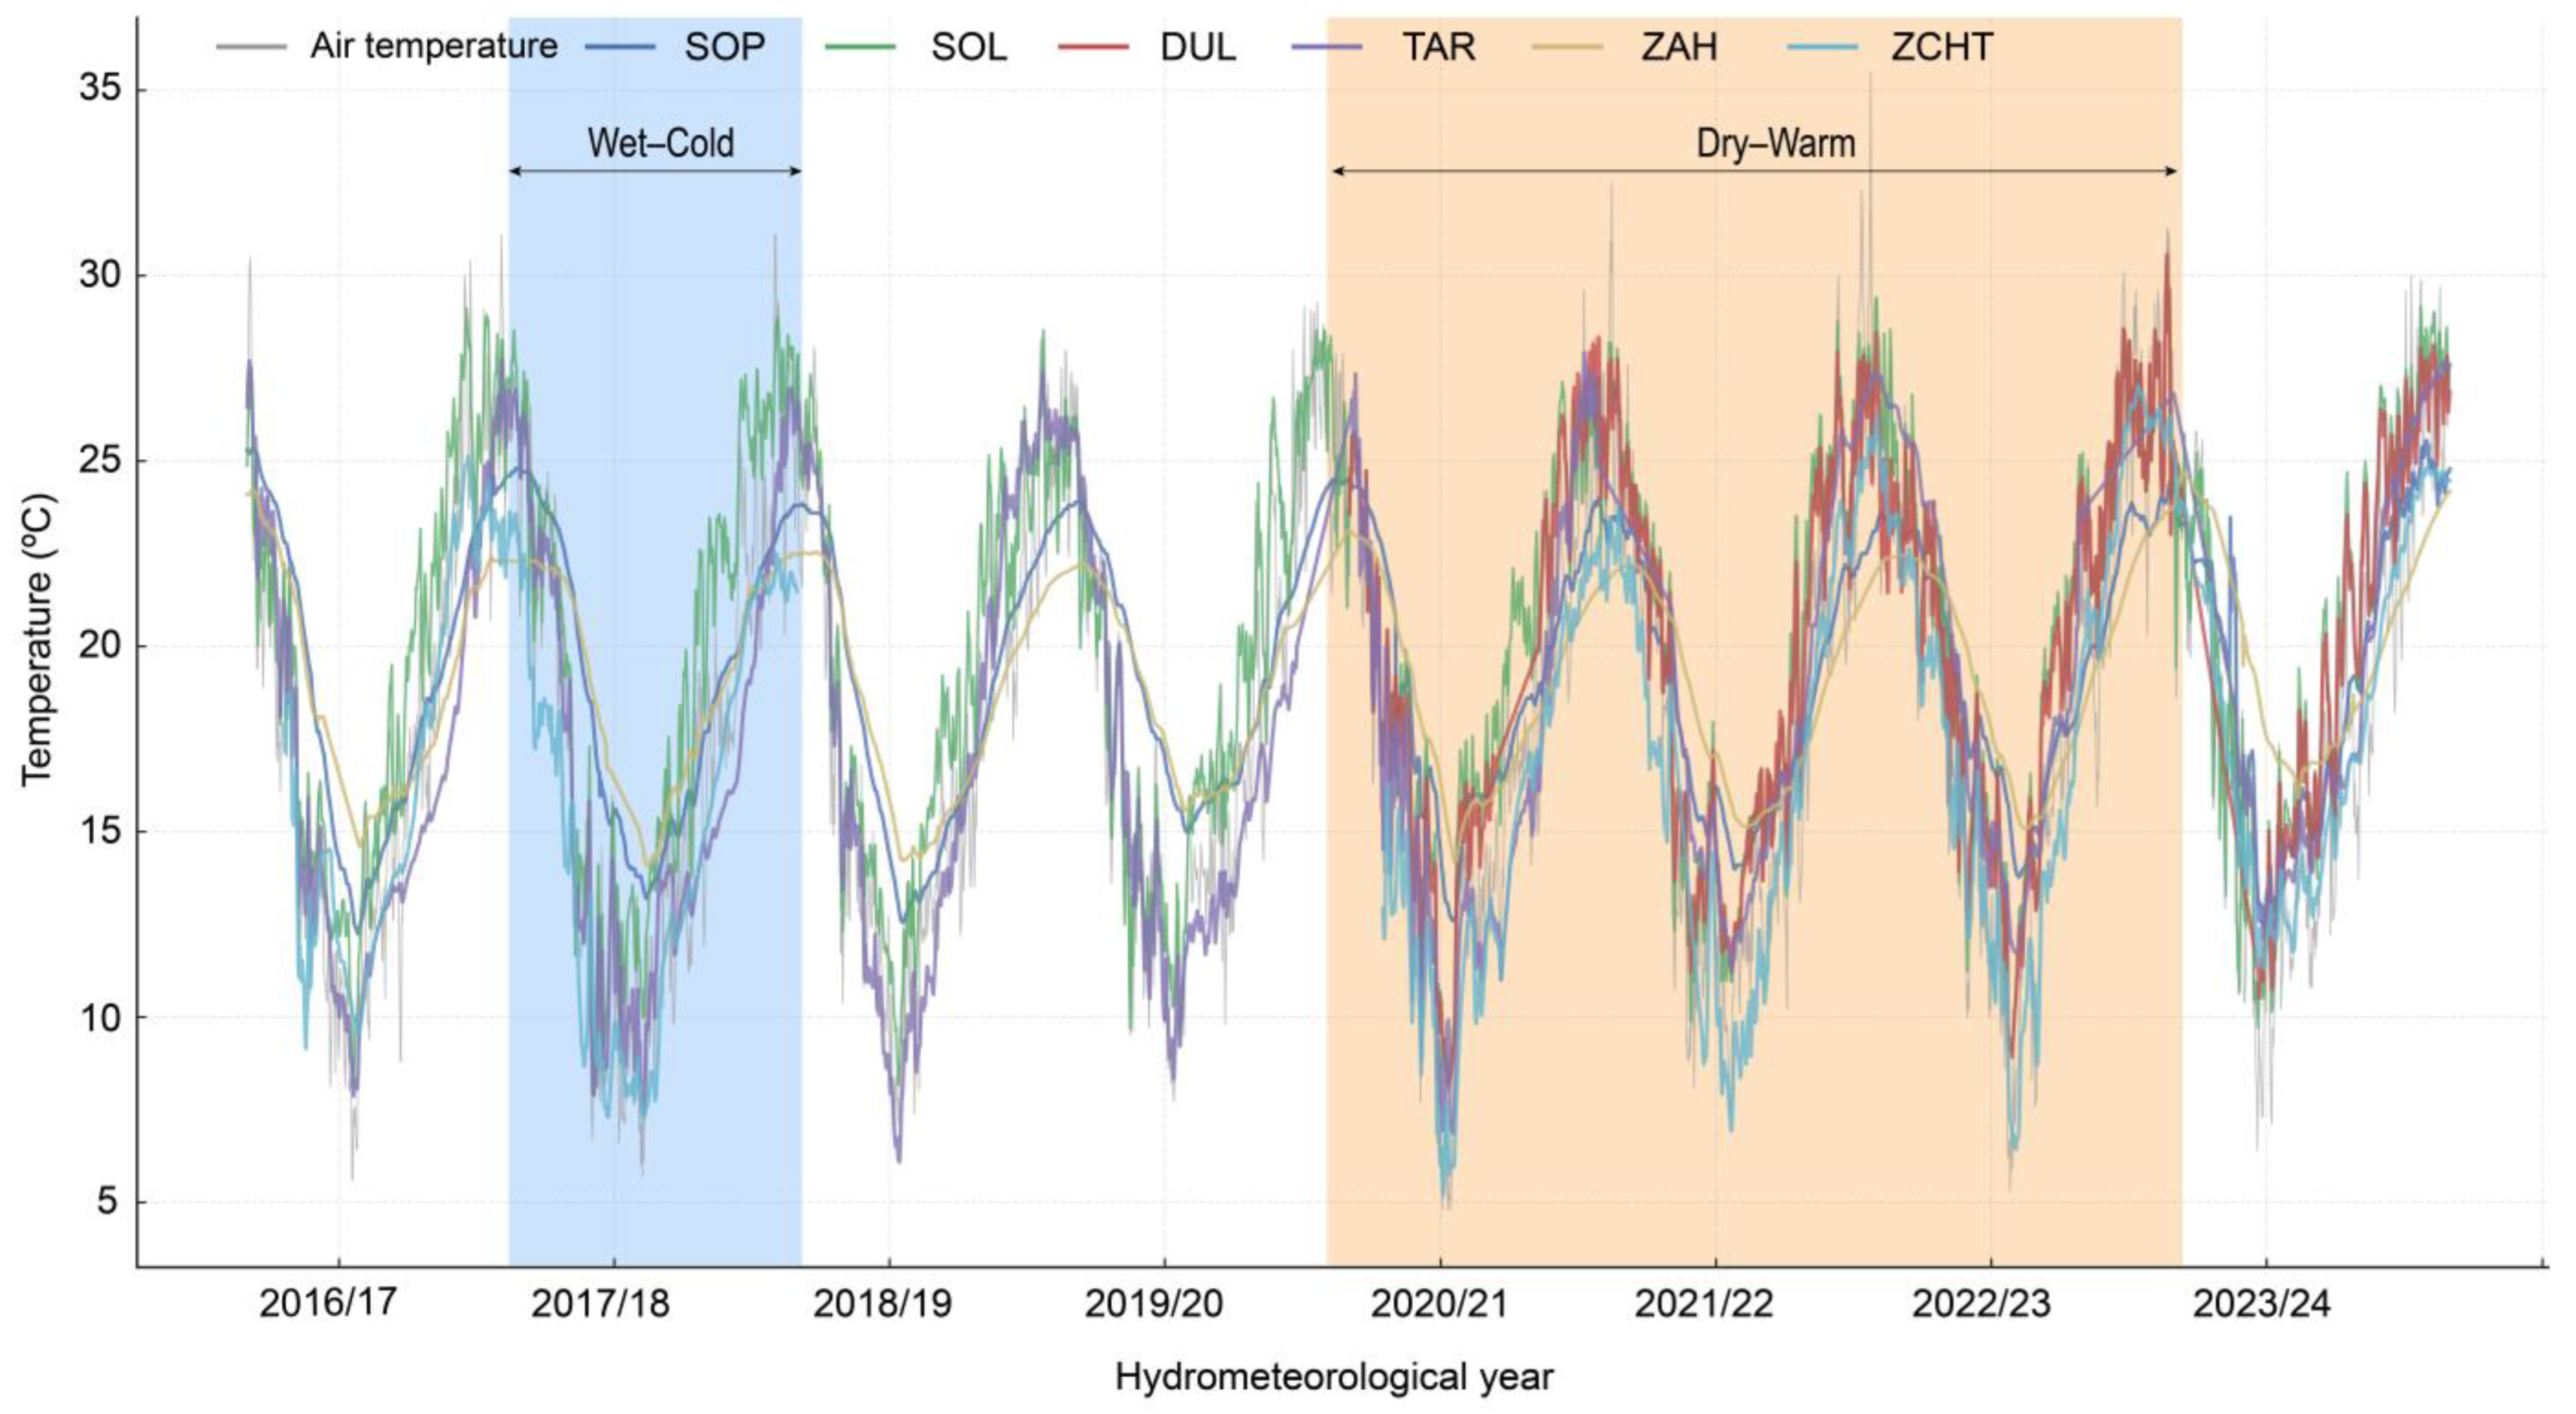
The daily mean temperature in the surface and subsurface waters (at depths of less than 2 m) over the study period is presented in Figure 4. This figure also shows the mean air temperature recorded at the Almonte meteorological station during the same period (pale grey).
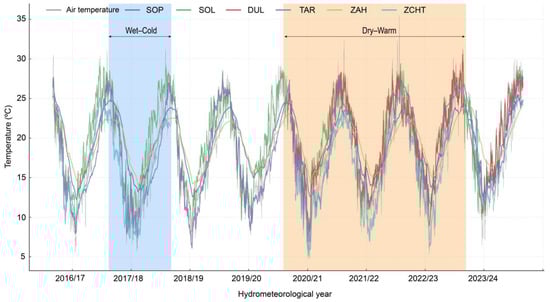
Figure 4.
Daily mean temperature of surface and subsurface water for the hydrometeorological years from 2016/17 to 2023/24. SOP: Sopetón pond; SOL: Santa Olalla pond; DUL: Dulce pond; TAR: Taraje pond; ZAH: Zahíllo pond; ZCHT: Zacallón Charco del Toro. Wet–cold and dry–warm years are indicated with shaded color band.
Graphically, the variation in the water temperature in the ponds closely mirrors that of the air temperature, following a seasonal intra-annual evolution with maximum average temperatures in summer (July–August) and minimums in winter (December–January). However, the water temperature shows a degree of attenuation in extreme temperatures, both daily and seasonal. This attenuation is particularly pronounced in the Sopetón and Zahíllo ponds, where subsurface water temperatures were recorded.
Table 2 provides a statistical summary of the water temperature data recorded at each monitoring point during the study period, enabling the characterization of the thermal regime of each system. In addition, air temperature statistics from the Almonte weather station are shown.
Table 2.
Statistical summary of temperature data for surface and subsurface water (less than 2 m), groundwater, and air. n: number of daily mean temperature measurements; mean: average temperature (°C); SD: standard deviation; min: minimum temperature; 25%, 50%, and 75%: first, second (median), and third quartiles; max: maximum temperature. SOP: Sopetón pond; SOL: Santa Olalla pond; DUL: Dulce pond; TAR: Taraje pond; ZAH: Zahíllo pond; ZCHT: Zacallón del Charco del Toro. PSOP: Sopetón pond piezometer; PSOLW: western piezometer at Santa Olalla pond; PDUL: Dulce pond piezometer; S10: borehole 10.
The average temperature of surface and subsurface waters is approximately 19 °C. The Santa Olalla and Dulce ponds show the highest mean temperatures of 19.85 °C and 19.8 °C, respectively (Table 2). In contrast, the Taraje pond and the Zacallón del Charco del Toro exhibit the lowest mean temperatures, with the Zacallón water falling below 17 °C. The standard deviation reveals that the variability in the surface water temperature is similar to that in the air temperature (approx. 5 °C). The Santa Olalla and Dulce ponds closely align with the maximum air temperature values, with maximum water temperatures exceeding 30 °C. In contrast, in the Taraje pond and ZCHT, the maximum water temperature values are attenuated, resulting in lower average temperatures.
In the case of subsurface water, temperatures recorded in the Sopetón and Zahíllo ponds, while the mean temperature is similar to that of surface water, extreme values are significantly attenuated, as indicated by the lower standard deviation (Table 2).
4.3. Thermal Regime of Groundwater
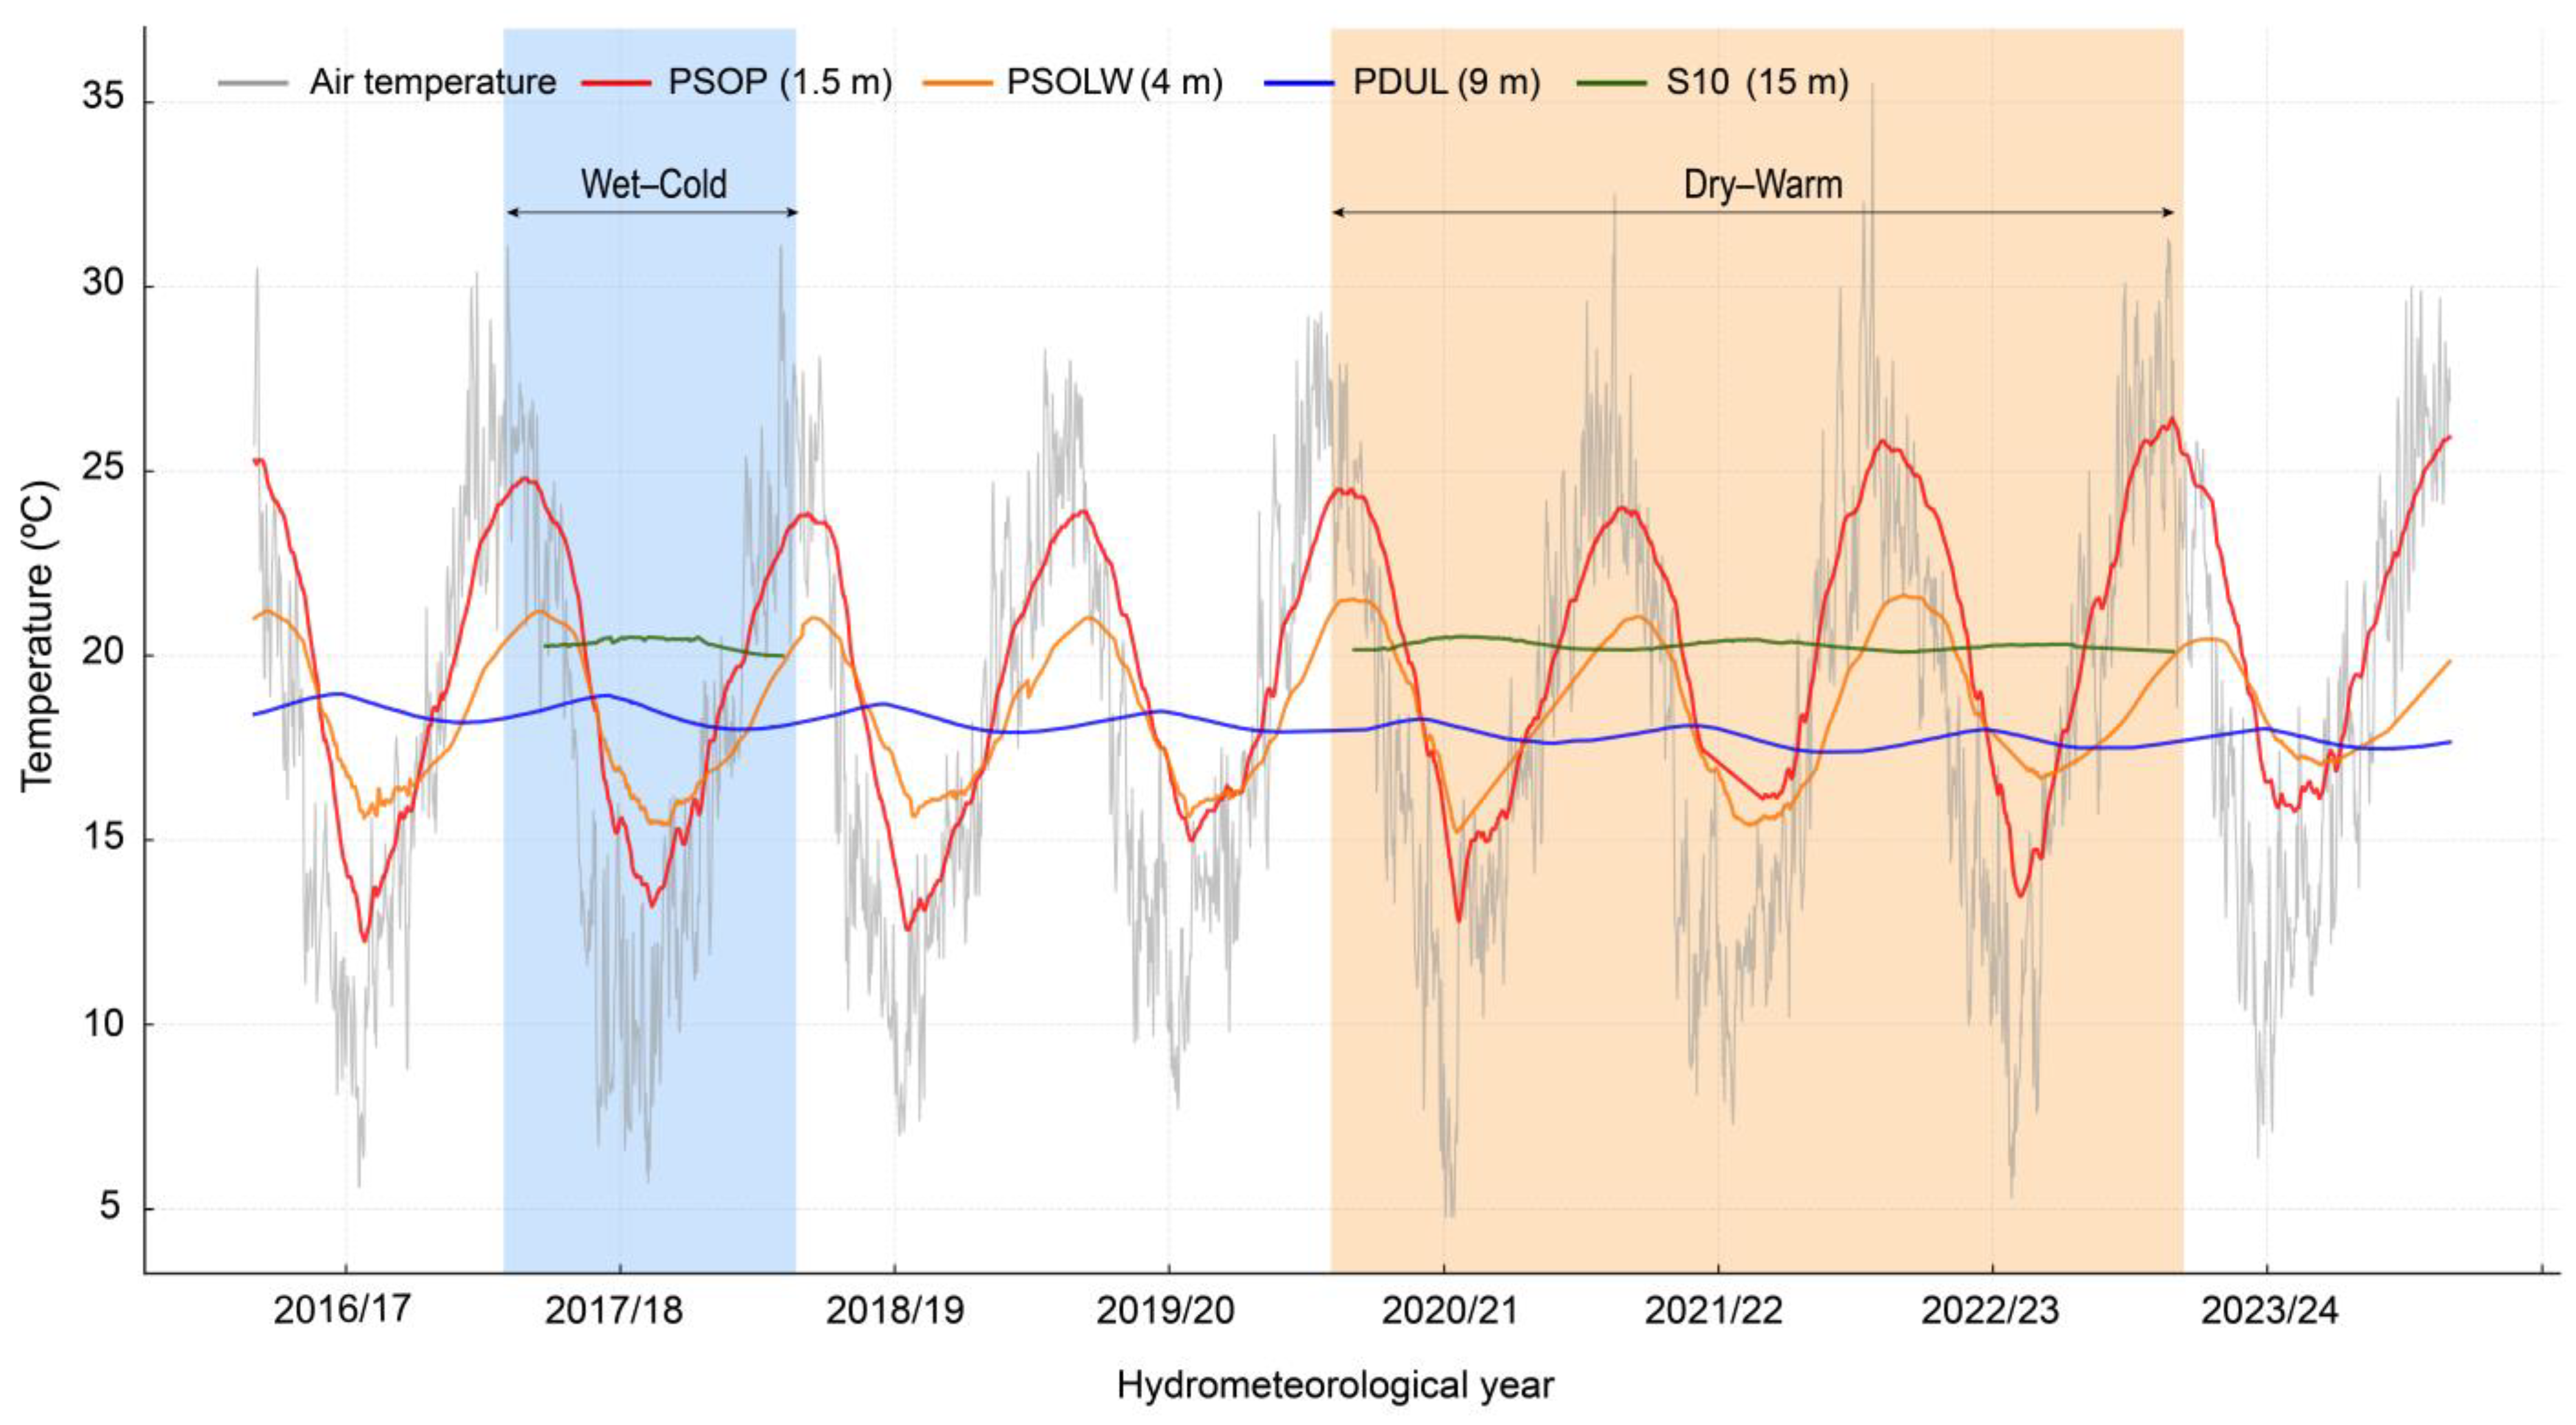
Figure 5 depicts the daily mean groundwater temperature evolution measured at the four piezometers over the study period, along with the daily mean air temperature recorded at the Almonte weather station. For borehole 10 (S10), the data are limited due to the exclusion of records from hydrometeorological years when this borehole was more extensively used.

Figure 5.
Daily mean temperature of groundwater for the hydrometeorological years from 2016/17 to 2023/24. PSOP: Sopetón piezometer; PSOLW: Santa Olalla piezometer; PDUL: Dulce piezometer; S10, borehole 10. The depth at which the temperature has been monitored inside the piezometer is indicated in parentheses. Wet–cold and dry–warm years are indicated with shaded color band.
Groundwater temperature follows a seasonal intra-annual cycle influenced by air temperature variability, but these cycles are significantly attenuated (Figure 5). In shallower piezometers, particularly the PSOP (~1.5 m), the thermal signal follows a similar trend to air temperature, although with slightly reduced amplitude. Figure 5 graphically shows how the amplitude of water thermal variability decreases progressively in depth. The greatest stability in temperatures is observed at the deepest levels.
According to Table 2, the average groundwater temperature at the PSOP is 19.79 °C, similar to surface and subsurface water temperatures. This temperature decreases slightly with depth, reaching 18.44 °C at the PSOLW (~4 m) and 18.04 °C at the PDUL (~9 m). However, at S10 (~15 m), the mean temperature increases to 20.26 °C, even surpassing the average surface water temperatures. In terms of thermal variability, as can also be observed in Figure 5, the standard deviation decreases with depth: the PSOP has a standard deviation of 3.71 °C, like subsurface systems, while the PSOLW and PDUL exhibit lower standard deviations of 1.81 °C and 0.39 °C, respectively, reflecting greater thermal stability. S10, with a standard deviation of 0.16 °C, exhibits the highest thermal stability among all analyzed piezometers.
The vertical temperature profiles shown illustrate how the attenuation of air temperature influence on groundwater temperature diminishes with depth (Figure 6). The profiles reveal that the shallow groundwater temperatures closely align with the air temperature recorded on the day the temperature profiles were taken (i.e., approximately 25 °C in October 2024). The groundwater temperature progressively decreases with depth, until it stabilizes at a depth of 12 m. Below this depth, the temperature remains constant at around 17.7 °C. This stratification in groundwater temperature defines two distinct zones: a shallow heterothermal zone extending to about 12 m and a deeper homothermal zone below this depth (Figure 6).
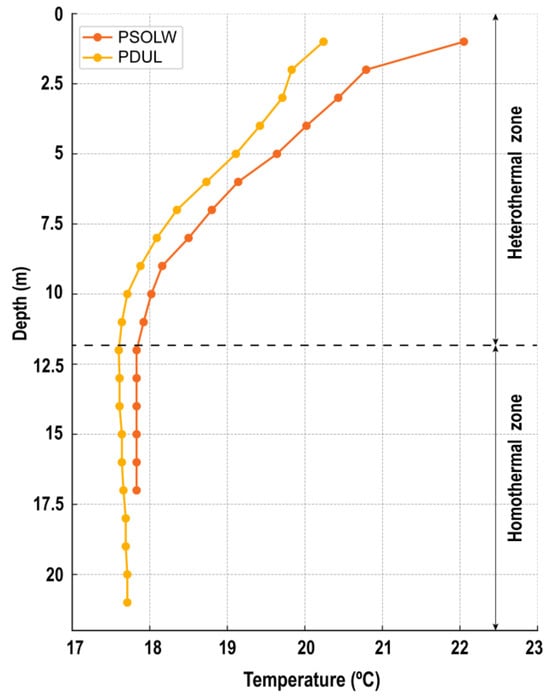
Figure 6.
Vertical temperature profiles measured in the PSOLW and PDUL piezometers, highlighting the heterothermal and homothermal zones along the depth gradient.
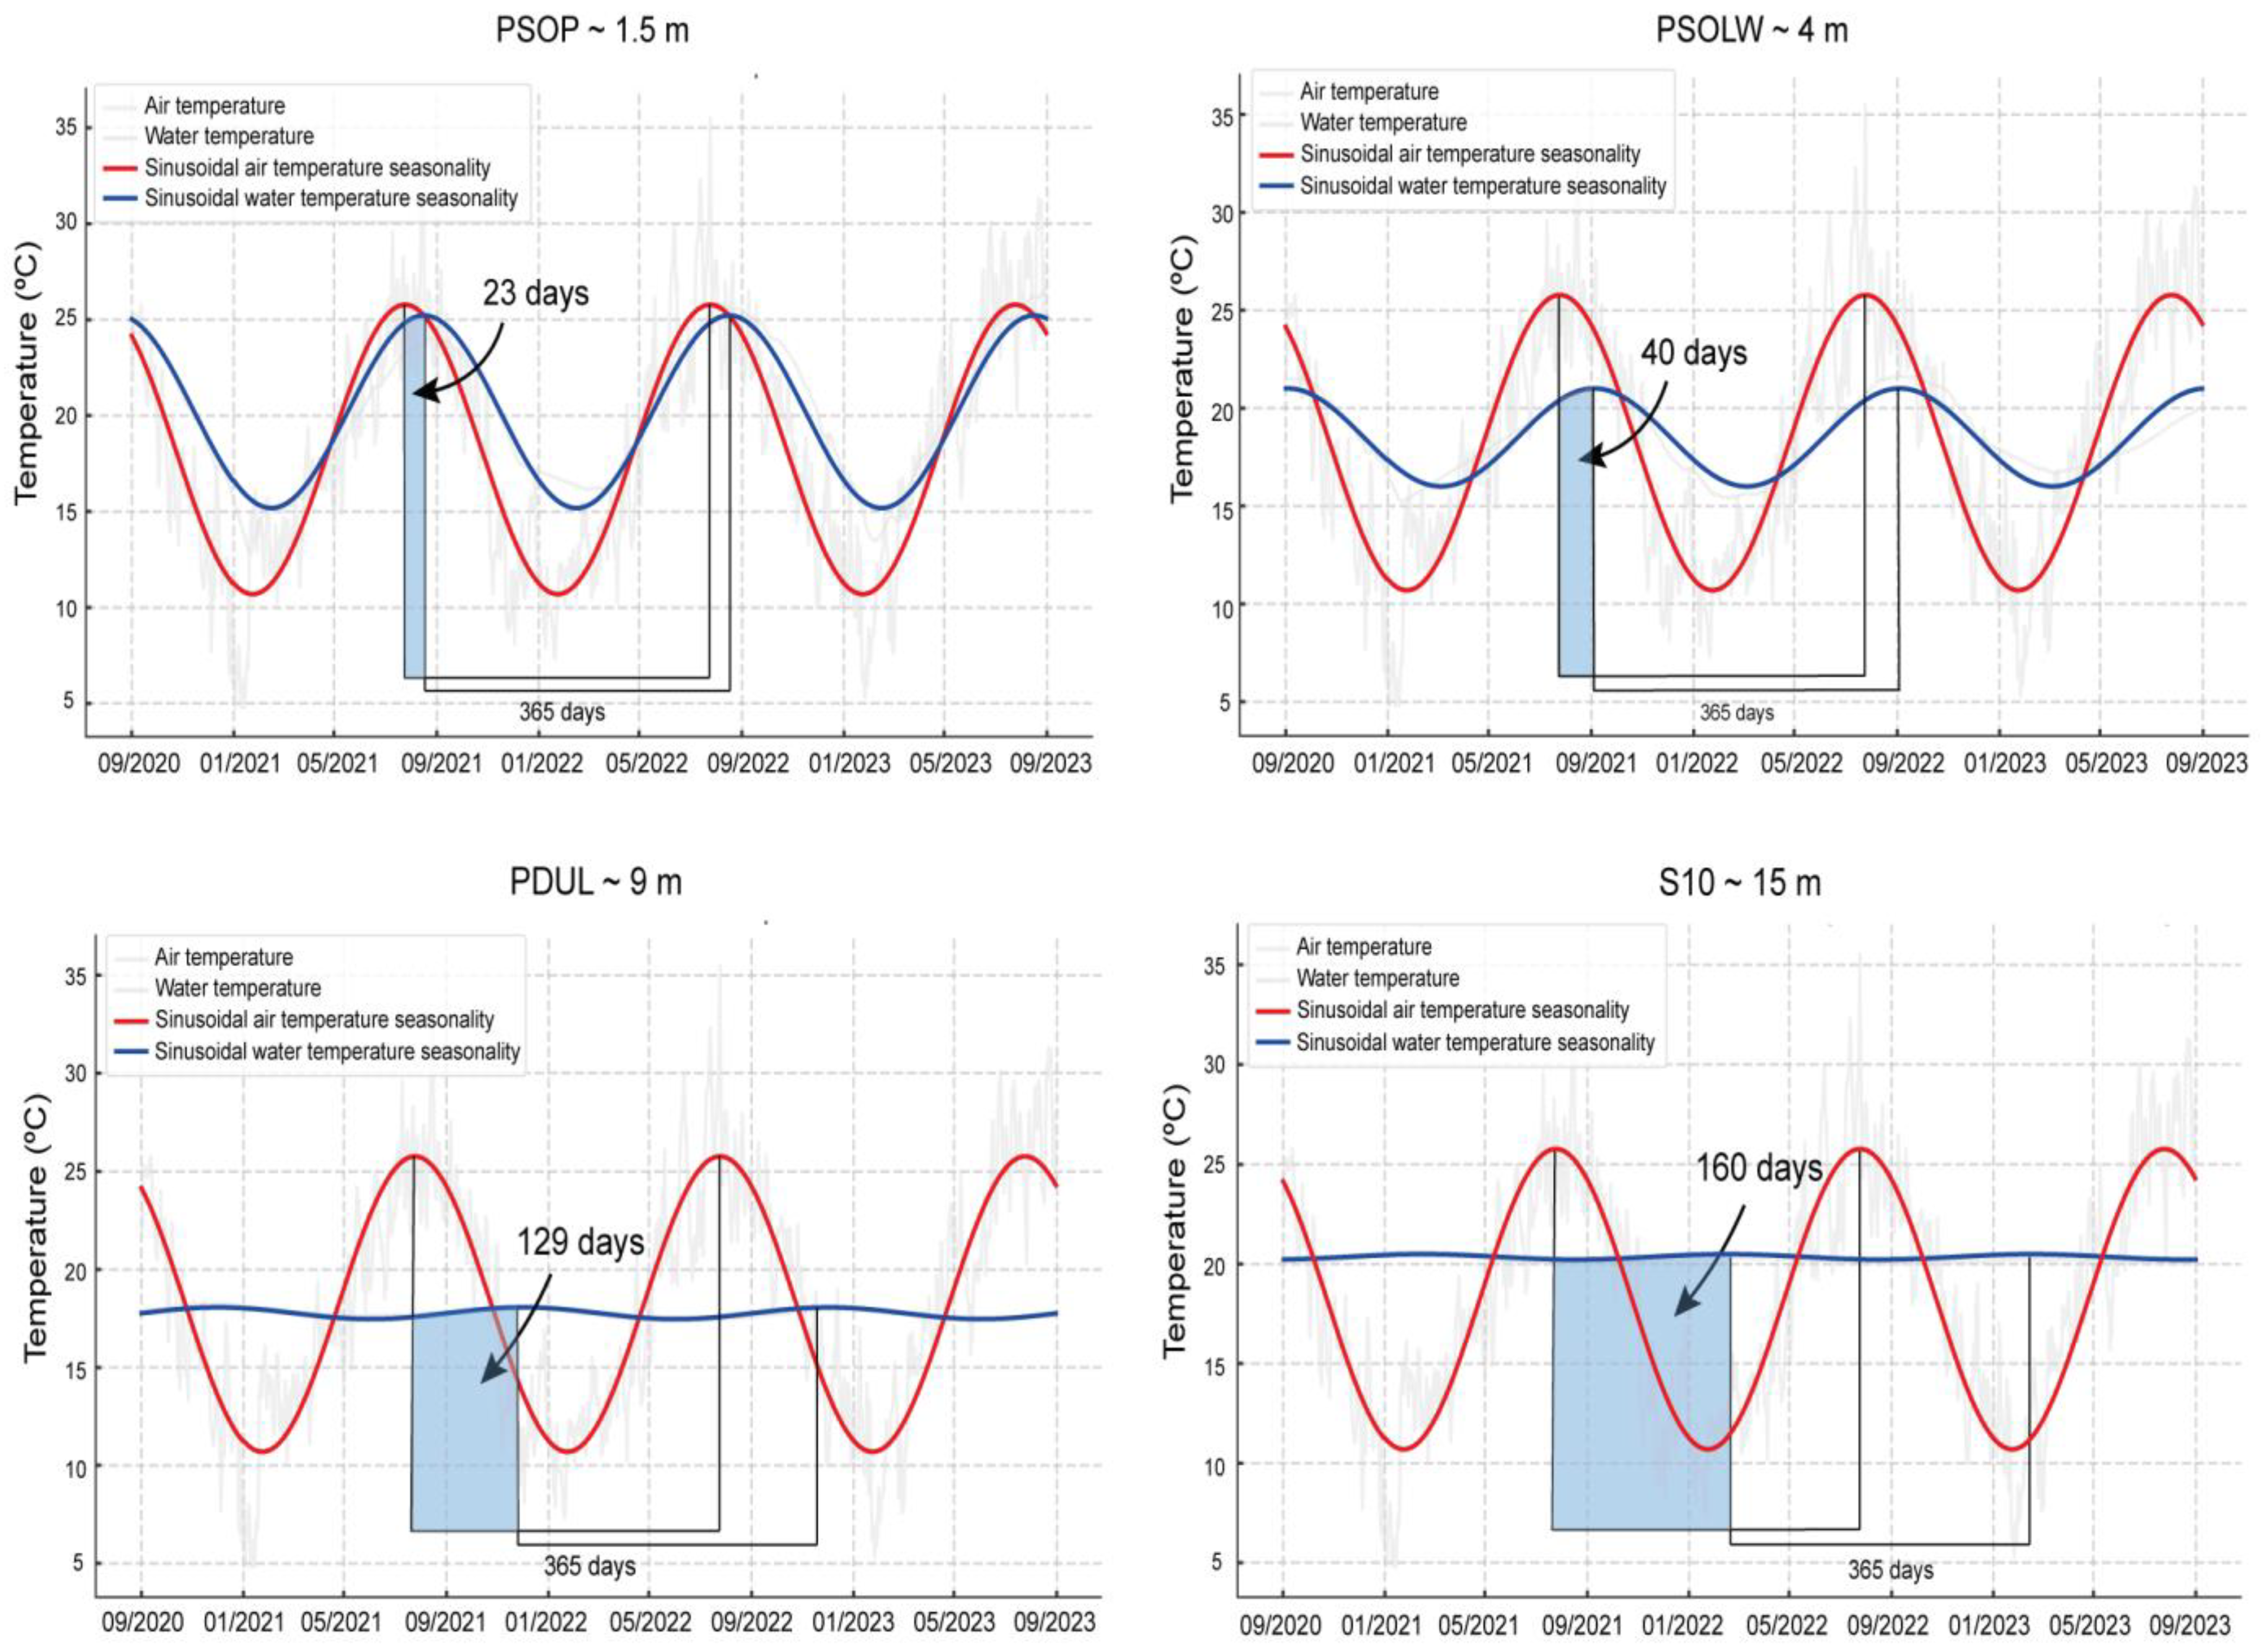
In addition to attenuation of thermal signal amplitude with depth, a temporal lag is observed in the annual temperature cycles of groundwater relative to air temperature. Figure 7 illustrates the sinusoidal function representing the variability in air and groundwater temperatures for each piezometer. In reference to the annual cycle, extreme groundwater temperatures occur with a delay relative to air temperature extremes, and this lag increases with depth. At the PSOP, the lag is 23 days, while at the PSOLW, it is 40 days. For the PDUL, the lag extends to 129 days, and at S10 (15 m depth), it reaches 160 days, indicating a complete inversion of the annual temperature cycle. Thus, in deeper piezometers, maximum groundwater temperatures are typically recorded in the winter, while minimum temperatures are observed in the summer.
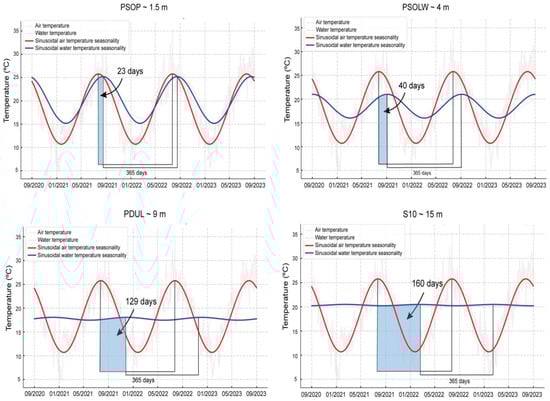
Figure 7.
Seasonal variation in air and water temperatures across different monitoring depths (both air and water temperatures are plotted in pale grey).
4.4. Water Temperature Trend
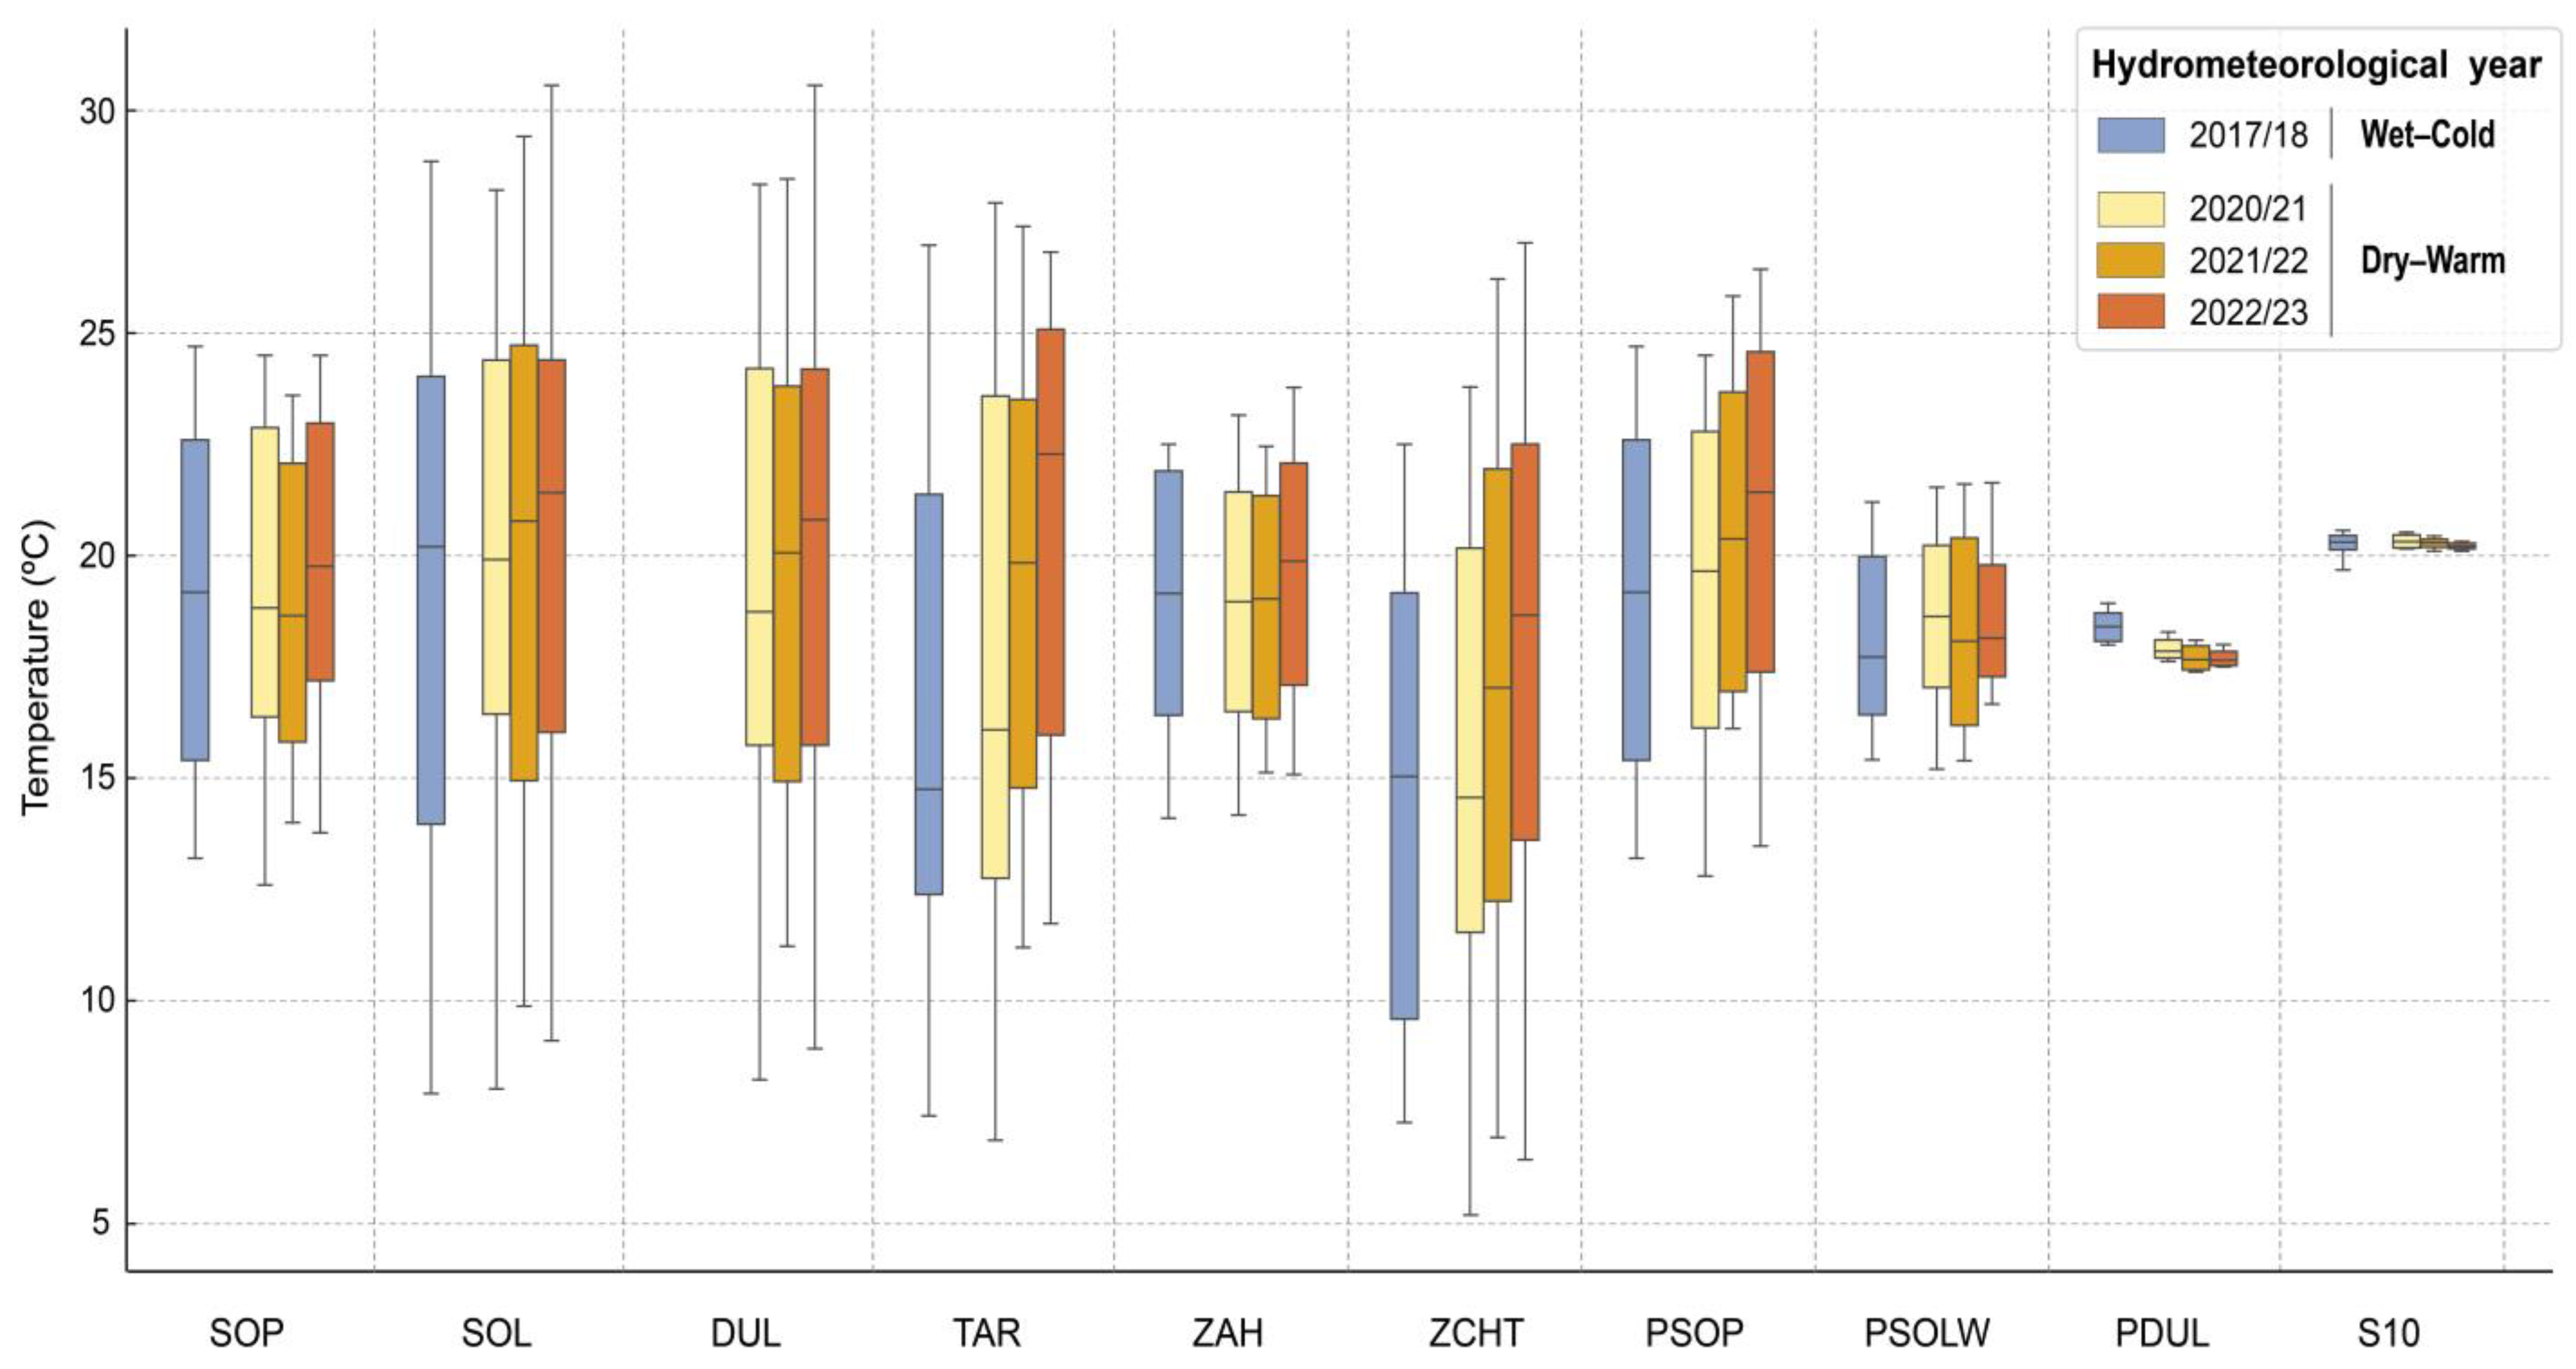
The trend analysis references the climatic context during the monitoring period outlined in the Climate Setting Section (see Section 4.1). Figure 8 displays the annual water temperature in three dry–warm hydrometeorological years (2020/21 to 2022/23) compared to one wet–cold year (2017/18).
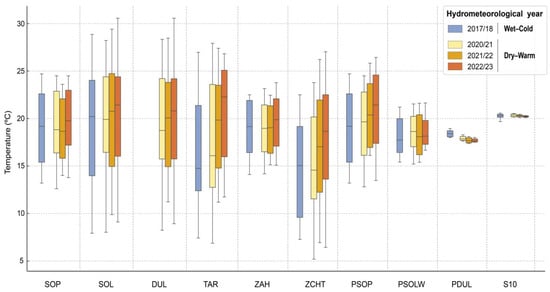
Figure 8.
Boxplot of water temperature distributions across monitoring points during the wet–cold (2017/18) and dry–warm (2020–2023) periods. SOP (Sopetón pond), SOL (Santa Olalla pond), DUL (Dulce pond), TAR (Taraje pond), ZAH (Zahíllo pond), ZCHT (Zacallón del Charco del Toro), PSOP (Sopetón pond piezometer), PSOLW (western piezometer at Santa Olalla pond), PDUL (Dulce pond piezometer), and S10 (borehole 10).
Surface and subsurface waters experienced an increase in the annual mean water temperature during the dry–warm period of 2020–2023 (Figure 8). This rise was particularly pronounced in the Taraje pond and Zacallón del Charco del Toro, while it was lower in systems where subsurface water temperatures were recorded, such as the Zahíllo and Sopetón ponds. Most systems also experienced greater intra-annual water temperature variability because the minimum maintained and maximum temperatures increased. An analysis of variance comparing the mean water temperatures at the end of the dry–warm period (2022/23) with those from the wet–cold year (2017/18) revealed a significant increase (p > 0.05) in the mean water temperature during the dry–warm period. Specifically, for Laguna Taraje and Zacallón, the increase was 3.88 °C and 3.14 °C, respectively. For the Dulce and Santa Olalla ponds, the increase was more moderate, around 1.2 °C, while subsurface water systems showed a smaller increase of 0.5 °C.
For groundwater, the trend in the annual mean water temperature during the dry–warm period varies with the depth of temperature recording. In the shallowest piezometer, the PSOP, the trend is similar to that of surface and subsurface waters, with a significant increase in the water temperature (Figure 8). However, in deeper piezometers, the PDUL and S10, a significant downward trend (p > 0.05) in the water temperature has been observed, accompanied by reduced intra-annual variability. This reduction is particularly evident in the PDUL, where a notable decrease of more than 1 °C in the water temperature has been recorded between 2017/18 and 2022/23. In S10, the decrease was only 0.1 °C, but both cases show remarkable cooling considering the expected thermal stability at these depths. For the PSOLW, no statistically significant trend has been identified for the dry–warm period, although a slight decrease in the average temperature was observed (Figure 8).
5. Discussion
The statistical analysis of the extensive thermal record obtained from hydrological monitoring in the most important sand-dune ponds of the DNP has enabled the characterization of the thermal regime of the surface water, subsurface water, and groundwater. The results indicate that this regime is primarily influenced by the extent to which air temperature variability influences water temperature. Nevertheless, there are significant differences between surface water (ponds) and shallow groundwater (PSOP, PDUL, PSOLW), on the one hand, and deeper groundwater (S10), on the other.
5.1. Surface Water and Shallow Groundwater Temperature
Air temperature determines the intra-annual seasonal pattern in the surface water, characterized by maximum temperatures in the summer and minimums in the winter (Figure 4). The average surface water temperature is approximately 19 °C, slightly higher than the average air temperature during the monitoring period (~18 °C). The lower standard deviation values in the surface water indicate some attenuation of extreme environmental values (Table 2). However, given that the sensors are located in the deepest areas of ponds, the seasonal temperature pattern suggests that, due to the shallowness of these ponds, the temperature oscillations are not buffered, as in the case of deeper lakes [33,34], and it does not suggest that ponds sustain prolonged water column stratification. This implies that the water temperature in the studied ponds is heavily influenced by air thermal oscillation, with rapid heating and cooling of the entire mixing water column. This is a typical phenomenon in shallow lakes [33,35,36]. Thus, the characterization of these thermal dynamics is crucial because they influence the rates of chemical and biological processes [33,36,37] and determine their vulnerability to climate changes [26,34].
Although the pronounced influence of air temperature is consistent across all the monitored surface waters, some differences emerge, likely due to local heterogeneity in factors affecting the water temperature in shallow lakes, such as solar exposure and the presence of vegetation [38]. For instance, the Taraje pond and the Zacallón del Charco del Toro exhibit lower temperatures compared to other surface waters, likely due to reduced solar exposure caused by the surrounding vegetation. This could explain why the minimum temperatures in these systems are similar to the minimum air temperature (~5 °C, Table 2), yet their maximum temperatures are significantly lower than the environmental maximum (~27 °C versus 35 °C). Conversely, ponds without dense vegetation cover, such as Santa Olalla and Dulce, show less buffered maximum temperatures.
At the Santa Olalla pond, the only permanent pond, some progress had already been made in describing local-scale groundwater flow using temperature as a tracer, as indicated in the Introduction. A specific study was conducted between 2016 and 2018, which utilized thermal data obtained during the project [10]. This study contributed to understanding surface water–groundwater interactions in this pond system. The results allowed for the estimation of groundwater discharge rates of 0.36 hm3/year during high water levels (February–May 2017) and significantly lower rates of 0.05 hm3/year during low water levels (October–March 2018), which included periods of recharge processes from the pond to the aquifer.
In the Zahíllo and Sopetón ponds, the sensor was located in the hyporheic zone, recording subsurface water temperatures in the pond beds. In these cases, as reflected by the lower standard deviation of the water temperature (Table 2), the seasonal cycle is more attenuated (Figure 4), consistent with subsurface water dynamics [10,39]. This highlights the effect of soil on heat conduction within the unsaturated soil zone, even just a few centimeters below ground.
In fact, the soil’s buffering effect is even more evident in the groundwater temperature records, particularly at greater depths (Table 2 and Figure 5). In the shallowest piezometer, the PSOP (~1.5 m), the thermal signal follows a seasonal trend similar to that of subsurface water. As the depth increases, the groundwater thermal regime shows a progressive attenuation of seasonal variability (Figure 5), as seen in deeper piezometers like the PDUL (~9 m) and S10 (~15 m), where temperatures are more stable and standard deviations significantly lower (Table 2). This results in a groundwater temperature stratification, with a heterothermal zone in shallow layers, where groundwater is more exposed to seasonal variations, and a homothermal zone below 12 m depth (Figure 6), where temperatures are nearly constant (~17.7 °C), irrespective of external climatic conditions.
This groundwater temperature stratification pattern, although common in detrital aquifers, varies significantly depending on the local factors affecting heat transport within the subsurface, e.g., [19] and references therein. While it is true that in our study we only present two vertical temperature profiles conducted in the autumn (Figure 6), our findings are consistent with the vertical temperature profiles described for the Almonte-Marismas aquifer in [16]. These profiles are valuable for characterizing the depth of the homothermal zone within this context.
In addition to the climatic impact on the temperature of shallow groundwater, ref. [16] modeled the long-term impact of anthropogenic influences, such as groundwater extraction, land-use changes, and agricultural practices, on the thermal regime of the entire Almonte-Marismas aquifer. Our results provide valuable insights into their localized effects on sand-dune ponds. The thermal record provided in our study for the sand-dune pond area is relevant for assessing the impacts described in [16] on the thermal regime of this part of the aquifer. However, although in recent years the climatic impact appears to have prevailed over these anthropogenic influences, it is crucial to continue detailed temperature monitoring to detect thermal changes associated with anthropogenic impacts.
Regardless of this, these conditions largely determine the sensitivity of surface and groundwater to environmental changes. Shallow groundwater and surface water exhibit rapid responses to prevailing climatic conditions, as observed during the dry–warm period (2020–2023). During this period, the average annual surface and subsurface water temperatures increased significantly, with more pronounced rises in systems like Zacallón del Charco del Toro and the Taraje pond, where temperatures rose by over 3 °C compared to the cool–wet year of 2017/18 (Figure 8). This increase is substantially greater than the air temperature anomalies (~1 °C, Figure 2) recorded during the same period. Given their proximity to Matalascañas town, where hydrological alterations due to water extractions for human use have been documented [9,14,40], the recorded temperature increases are likely a result of a combination between environmental and anthropogenic factors. The decreasing water levels observed in recent years [31] may have contributed to faster warming in systems with greater water volume reductions, such as in the Taraje pond.
5.2. Deep Groundwater Temperature
Unlike the surface and subsurface temperature trends, groundwater responses varied with depth (Figure 8). In the PSOP (~1.5 m), the thermal trend mirrored subsurface water, with a significant rise in the average annual temperature during the dry–warm period. However, in deeper piezometers like the PDUL (~9 m) and S10 (~15 m), an opposite trend was observed, with a significant reduction in the average annual temperature.
For deeper piezometers, this variability might be linked to aquifer recharge and discharge processes rather than air temperature fluctuations. Recharge processes can influence the temperature in the superficial zone of the aquifer and contribute to more efficient heat transport to deeper zones via convective heat transfer through vertical recharge flow [16,19]. In the Doñana aquifer, this phenomenon is particularly notable due to the aquifer’s hydrogeological characteristics (see Section 2). As previously mentioned, although the Doñana aquifer is a multilayer system, it can be considered to consist of a shallow layer of fine–medium sands, where water flow is nearly vertical, and a deeper layer of gravel and coarse sands, where flow is predominantly horizontal. It can be assumed that temperature is controlled from above (ground surface) and below (coarse layer), as modeled by [16]. In this way, a thermal gradient is present but attenuates when convective transport carries heat to deeper zones during recharge or elevates it from deeper zones in discharge areas. Thus, the thermal gradient reflects the dominance of convective heat transport in shallow layers, where groundwater flow is vertical, while in deeper zones, conduction prevails, leading to a more stable thermal regime. This distinction explains the progressive attenuation of temperature variability with depth (Figure 6).
These flows could explain why the maximum groundwater temperatures in the PDUL and S10 occur in the winter months (Figure 6), when aquifer recharge and discharge processes are more active. They also account for the highest annual average temperature recorded at the PDUL during the wettest, coolest hydrometeorological year (2017/18, Figure 8). Similarly, a cessation of heat transport due to reduced recharge flow would result in an increased thermal gradient by cooling in deeper levels. Thus, the significant temperature decline detected in the PDUL could be attributed to the reduction in recharge that has occurred in recent years. This cooling at deeper levels during drought periods was previously described theoretically by [16]. Our findings could empirically confirm this model.
However, the temperature variability observed in S10 does not seem to be associated with recharge flow, as the average water temperature at this point (20.26 °C, Table 2) does not correspond to what would be expected at the depth where the sensor is located (15 m). This anomaly may stem from different causes: (1) borehole pumping, as it is the only one in the study area; (2) borehole depth, as it is the deepest piezometer (~170 m); and (3) proximity to the coast.
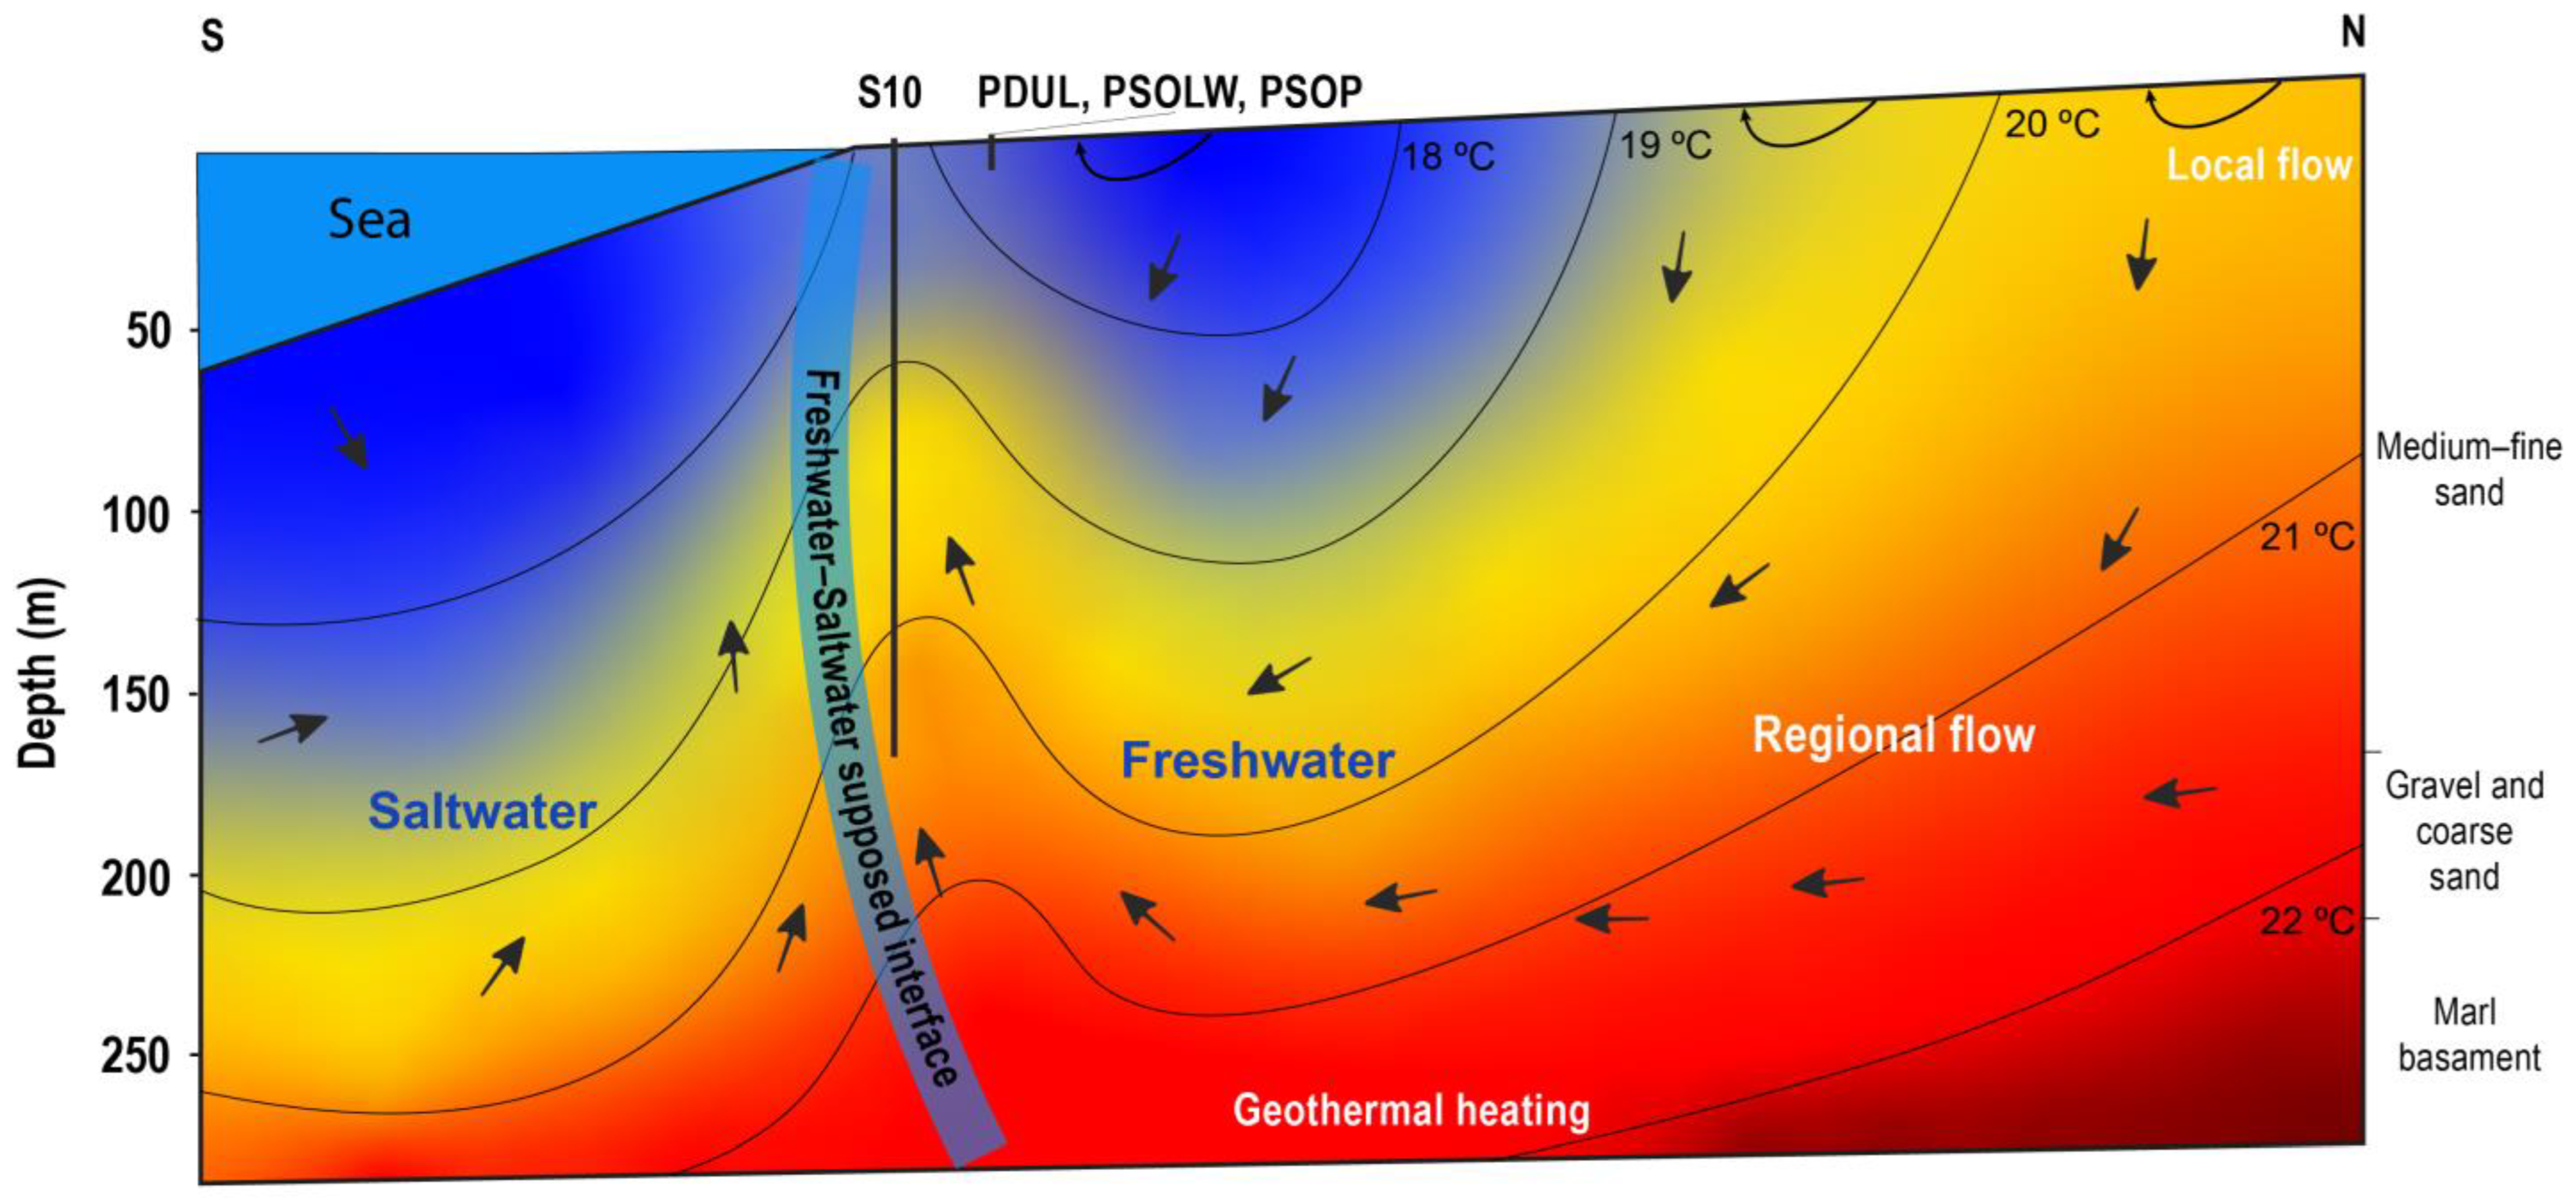
Indeed, as stated by [16], the coastline acts as an abrupt thermal transition zone between the continent and the sea. This phenomenon could cause lower temperatures in the underlying area, generating a thermal gradient that extends towards zones farther from the coast. Consequently, the average temperature at S10 might even be lower than that of the PDUL. Figure 9 presents a hypothetical heat transport schematic in the Almonte-Marismas aquifer, based on previous models of heat transport in coastal detrital aquifers [16,19,20], which could explain the thermal regime and trends observed in groundwater temperature, as described in this study.

Figure 9.
Simplified schematic of temperature distribution in Almonte-Marismas aquifer, based on water thermal records obtained in this study, along with models developed by [16,19]. Colors represent the temperature gradient defined by isotherms, while arrows indicate the direction of groundwater flow.
According to this schematic, both the variability in the water temperature at S10 and its average temperature could be linked to regional flow originating from zones farther inland, facilitated by horizontal transport in the deeper, coarser unit of the aquifer, where the bottom of S10 is located and where the majority of boreholes in the Almonte-Marismas aquifer takes groundwater from [41]. In this scenario, it would need to be assumed that no temperature stratification occurs within the borehole itself, possibly because occasional pumping homogenizes the entire water column. The inability to conduct vertical temperature profiles at this point has prevented confirmation of this assumption. Nonetheless, a similar scenario to that modeled for the Motril-Salobreña aquifer by [21], also schematically represented in Figure 9, cannot be ruled out. In this case, deep regional flow could be influenced by the geothermal gradient, forcing heat to ascend near the saline interface, which could raise temperatures to shallower levels and reduce the expected thermal gradient in these zones (Figure 9). However, the exact position of the saline interface in the Doñana aquifer has yet to be identified, and a combined effect of these scenarios is also a possibility.
In any of these cases, this flow schematic (Figure 9) would explain the observed temperature decline at S10 and the reduced variability in the water temperature which can be attributed to a lower hydraulic gradient and changes in regional flow during the driest period. To confirm or rule out these scenarios, vertical temperature profiles in boreholes with similar characteristics to S10, but without any exploitation throughout the year, would be necessary.
Although the temperature data monitored at S10 and the PDUL carry a high degree of uncertainty due to the thermal disturbance caused by piezometer-based measurements, the observed temperature trends during drought periods provide insight into the variability in the dynamics of local and regional groundwater flows under these conditions. These trends also suggest a strong interconnection among the different aquifer levels, highlighting the complex interactions within the multilayered Almonte-Marismas aquifer system.
6. Conclusions
In this study, water temperature data recorded in several sand-dune ponds in Doñana National Park reveal an increase (e.g., >3 °C in the Taraje pond between 2017/18 and 2022/23) in the surface water temperature which is significantly higher than the increase in the air temperature (~1 °C) recorded during the same period. Water temperature dynamics in the different ponds are influenced by local factors such as depth, hydraulic connectivity with the aquifer, and exposure to climate influences. In the case of groundwater, temperature monitoring has allowed the characterization of water temperature trends at different depths. These trends are likely associated with local and regional groundwater flows, and a decrease in recharge rates during the dry periods could be behind the temperature drop (<1 °C) recorded in piezometers near the ponds. Despite the high degree of uncertainty involved, analyzing these trends allows for tracing these flows and provides a foundation for developing a heat flow and transport model for the Almonte-Marismas aquifer.
Moreover, the combined characterization of the water temperature regime of surface water and groundwater can aid at identifying and quantifying the influence of regional flow on the sand-dune ponds located farther from Matalascañas town, such as Dulce, Santa Olalla, and Sopetón. Considering that water extraction for Matalascañas town supply occurs at deep levels and agricultural extractions take place in areas distant from the ponds, outside the National Park boundaries, this characterization is crucial for assessing the degree of impact of these extractions on the ponds. It will help enable informed decision-making regarding groundwater resource management.
Author Contributions
Conceptualization, J.L.Y., M.R.-R. and A.J.-B.; methodology, J.L.Y., M.R.-R. and A.J.-B.; investigation, J.L.Y., M.R.-R., A.F.-A., A.J.-B. and M.M.-C.; resources, M.R.-R. and A.F.-A.; data curation, J.L.Y., M.M.-C. and A.J.-B.; writing—original draft preparation, J.L.Y.; writing—review and editing, J.L.Y., A.J.-B., A.F.-A.and M.R.-R.; supervision, J.L.Y., M.R.-R. and A.J.-B.; project administration, M.R.-R. All authors have read and agreed to the published version of the manuscript.
Funding
This work was possible thanks to the collaboration agreement between the Guadalquivir Hydrographic Confederation and the Pablo de Olavide University: “Study of hydrological monitoring and modeling of the pond-aquifer relationship in the Doñana aquifer” (BOE-A-2023-13925).
Data Availability Statement
All data supporting the results of this study are available upon request from any of the authors.
Acknowledgments
The logistical and technical support of the Singular Scientific–-Technical Infrastructure of the Doñana Biological Reserve (DBR-ICTS) is gratefully acknowledged.
Conflicts of Interest
The authors declare no conflicts of interest.
References
- Zorrilla-Miras, P.; Palomo, I.; Gomez-Baggethun, E.; Martín-López, B.; Lomas, P.L.; Montes, C. Effects of land-use change on wetland ecosystem services: A case study in the Doñana marshes (SW Spain). Landsc. Urban Plan. 2014, 122, 160–174. [Google Scholar] [CrossRef]
- Green, A.J.; Guardiola-Albert, C.; Bravo-Utrera, M.A.; Bustamante, J.; Camacho, A.; Caro, J.; Casado, A.; González-Arbáez, E.; Espinar, J.L.; Teles da Gama, F.; et al. Groundwater abstraction has caused extensive ecological damage to the Doñana World Heritage Site, Spain. Wetlands 2024, 44, 20. [Google Scholar] [CrossRef]
- De Felipe, M.; Amat, J.A.; Arroyo, J.L.; Rodríguez, R.; Díaz-Paniagua, C. Habitat changes at the local scale have major impacts on waterfowl populations across a migratory flyway. Glob. Change Biol. 2024, 30, e17600. [Google Scholar] [CrossRef]
- Rodríguez-Rodríguez, M.; Aguilera, H.; Guardiola-Albert, C.; Fernández-Ayuso, A. Climate influence vs. anthropogenic drivers in surface water-groundwater interactions in eight ponds of Doñana Natural Area (southern Spain). Wetlands 2021, 41, 25. [Google Scholar] [CrossRef]
- García-Bravo, N.; Guardiola-Albert, C. Upgrading aquifer test interpretations with numerical axisymmetric flow models using MODFLOW in the Doñana area (Spain). Boletín Geológico Min. 2012, 123, 41–54. [Google Scholar]
- Green, A.J.; Bustamante, J.; Janss, G.F.E.; Fernández-Zamudio, R.; Díaz-Paniagua, C. Doñana Wetlands (Spain). In The Wetland Book; Finlayson, C., Milton, G., Prentice, R., Davidson, N., Eds.; Springer: Dordrecht, The Netherlands, 2018; pp. 1–10. [Google Scholar] [CrossRef]
- Manzano, M.; Custodio, E.; Iglesias, M.; Soler, A. Groundwater resources and ecological impacts in Doñana National Park. Hydrol. Process. 2001, 15, 1431–1450. [Google Scholar] [CrossRef]
- Díaz-Paniagua, C.; Fernández-Zamudio, R.; Green, A.J.; Bustamante, J. The impacts of climate variability on temporary ponds in Doñana National Park. Wetl. Res. Lett. 2024, 12, 56–70. [Google Scholar]
- De Felipe, M.; Aragonés, D.; Díaz-Paniagua, C. Thirty-four years of Landsat monitoring reveal long-term effects of groundwater abstractions on a World Heritage Site wetland. Sci. Total Environ. 2023, 880, 163329. [Google Scholar] [CrossRef]
- Rodriguez-Rodriguez, M.; Fernández-Ayuso, A.; Hayashi, M.; Moral-Martos, F. Using Water Temperature, Electrical Conductivity, and pH to Characterize Surface–Groundwater Relations in a Shallow Ponds System (Doñana National Park, SW Spain). Water 2018, 10, 1415. [Google Scholar] [CrossRef]
- Fernández-Ayuso, A.; Rodríguez-Rodríguez, M.; Benavente, J. Assessment of the hydrological status of Doñana dune ponds: A natural World Heritage Site under threat. Hydrol. Sci. J. 2018, 63, 2048–2059. [Google Scholar] [CrossRef]
- Fernández-Ayuso, A.; Aguilera, H.; Guardiola-Albert, C.; Rodríguez-Rodríguez, M.; Heredia, J.; Naranjo-Fernández, N. Unraveling the hydrological behavior of a coastal pond in Doñana National Park (Southwest Spain). Ground Water 2019, 57, 895–906. [Google Scholar] [CrossRef]
- Treviño, J.; Rodríguez-Rodríguez, M.; Montes-Vega, M.J.; Aguilera, H.; Fernández-Ayuso, A.; Fernández-Naranjo, N. Wavelet Analysis on Groundwater, Surface-Water Levels andWater Temperature in Doñana National Park (Coastal Aquifer in Southwestern Spain). Water 2023, 15, 796. [Google Scholar] [CrossRef]
- Dimitriou, E.; Mousoulis, E.; Díaz-Paniagua, C.; Serrano, L. Hydrodynamic numerical modelling of the water level decline in four temporary ponds of the Doñana National Park (SW Spain). J. Arid. Environ. 2017, 147, 92–100. [Google Scholar] [CrossRef]
- Kuryluk, B.L.; Irvine, D.J.; Bense, V.F. Theory, tools, and multidisciplinary applications for tracing groundwater fluxes from temperature profiles. Water 2018, 5, e1299. [Google Scholar] [CrossRef]
- Custodio, E.; Manzano, M.; Iglesias, M. Análisis térmico preliminar de los acuíferos de Doñana. IV SIAGA 1996, II, 57–87. [Google Scholar]
- Tamburini, A.; Menichetti, M. Groundwater temperature as a natural tracer to characterize hydraulic behaviour and geometry of carbonate aquifers: Mt. Nerone karst system, central Italy. Rend. Online Soc. Geol. Ital. 2019, 47, 121–125. [Google Scholar] [CrossRef]
- Gruszczyński, T.; Szostakiewicz-Hołownia, M.; Zaszewski, D. Interpretation of spring-water temperature variability based on continuous monitoring and numerical modelling of heat transport and water mixing: Case study of Czarny Potok spring, Pieniny Mountains, southern Poland. Hydrogeol. J. 2023, 31, 1–12. [Google Scholar] [CrossRef]
- Blanco-Coronas, A.M.; Duque, C.; Calvache, M.L.; López-Chicano, M. Temperature distribution in coastal aquifers: Insights from groundwater modeling and field data. J. Hydrol. 2021, 603, 126912. [Google Scholar] [CrossRef]
- Blanco-Coronas, A.M.; Calvache, M.L.; López-Chicano, M.; Martín-Montañés, C.; Jiménez-Sánchez, J.; Duque, C. Salinity and temperature variations near the freshwater-saltwater interface in coastal aquifers induced by ocean tides and changes in recharge. Water 2022, 14, 2807. [Google Scholar] [CrossRef]
- Guardiola-Albert, C.; Jackson, C.R. Potential impacts of climate change on groundwater supplies to the Doñana wetland, Spain. Wetlands 2011, 31, 907–920. [Google Scholar] [CrossRef]
- Naranjo-Fernández, N.; Guardiola-Albert, C.; Montero, E. Applying 3D geostatistical simulation to improve the groundwater management modelling of sedimentary aquifers: The case of Doñana (Southwest Spain). Water 2018, 11, 39. [Google Scholar] [CrossRef]
- Blanco Coronas, Á.M. Coastal Aquifers and Processes Related to Global Change: Wetlands, Heat Transport and Floodings. Ph.D. Thesis, Universidad de Granada, Granada, Spain, 2023. Available online: https://hdl.handle.net/10481/82172 (accessed on 17 February 2025).
- Jiménez-Bonilla, A.; Rodríguez-Rodríguez, M.; Yanes, J.L.; Gázquez, F. Impact of climate change on permanent lakes in a semiarid region: Southwestern Mediterranean basin (S Spain). Sci. Total Environ. 2025, 961, 178305. [Google Scholar] [CrossRef] [PubMed]
- Erostate, M.; Huneau, F.; Garel, E.; Ghiotti, S.; Vystavna, Y.; Garrido, M.; Pasqualini, V. Groundwater dependent ecosystems in coastal Mediterranean regions: Characterization, challenges and management for their protection. Water Res. 2020, 172, 115461. [Google Scholar] [CrossRef]
- Montes-Vega, M.J.; Guardiola-Albert, C.; Rodríguez-Rodríguez, M. Calculation of the SPI, SPEI, and GRDI Indices for Historical Climatic Data from Doñana National Park: Forecasting Climatic Series (2030–2059) Using Two Climatic Scenarios RCP 4.5 and RCP 8.5 by IPCC. Water 2023, 15, 2369. [Google Scholar] [CrossRef]
- Naranjo-Fernández, N.; Guardiola-Albert, C.; Aguilera, H.; Serrano-Hidalgo, C.; Rodríguez-Rodríguez, M.; Fernández-Ayuso, A.; Ruiz-Bermudo, F.; Montero-González, E. Relevance of spatio-temporal rainfall variability regarding groundwater management challenges under global change: Case study in Doñana (SW Spain). Stoch. Environ. Res. Risk Assess. 2020, 34, 1289–1311. [Google Scholar] [CrossRef]
- Salvany, J.M.; Custodio, E. Características litoestratigráficas de los depósitos plio-cuaternarios del entorno de Doñana: Implicaciones hidrogeológicas. Rev. Soc. Geol. Esp. 1995, 8, 2–31. [Google Scholar]
- Custodio, E.; Manzano, M.; Montes, C. Las aguas subterráneas en Doñana. In Aspectos Ecológicos y Sociales; Junta de Andalucía: Sevilla, Spain, 2009; p. 243. [Google Scholar]
- Instituto Geológico y Minero de España. Encomienda de Gestión para la Realización de Trabajos Científico-Técnicos de Apoyo a la Sostenibilidad y Protección de las Aguas Subterráneas: Demarcación Hidrográfica 051 Guadalquivir, Masa de Agua Subterránea 051.051 Almonte-Marismas del Guadalquivir; Ministerio de Ciencia e Innovación, Ministerio de Medio Ambiente y Medio Rural y Marino, Dirección General del Agua: Madrid, Spain, 2024.
- Yanes, J.L.; Rodríguez-Rodríguez, M.; Montes-Vega, M.J.; Jiménez-Bonilla, A.; Moral, F. Monitorización hidrológica de las lagunas peridunares de los mantos eólicos de Doñana en el periodo 2020–2023. Geogaceta 2024, 76, 55–58. [Google Scholar] [CrossRef]
- R Core Team. R: A Language and Environment for Statistical Computing; R Foundation for Statistical Computing: Vienna, Austria, 2024; Available online: https://www.R-project.org/ (accessed on 17 September 2024).
- Martinsen, K.T.; Andersen, M.R.; Sand-Jensen, K. Water temperature dynamics and the prevalence of daytime stratification in small temperate shallow lakes. Hydrobiologia 2018, 830, 87–103. [Google Scholar] [CrossRef]
- Woolway, R.I.; Jennings, E.; Shatwell, T.; Golub, M.; Pierson, D.C.; Maberly, S.C. Lake heatwaves under climate change. Nature 2021, 589, 402–407. [Google Scholar] [CrossRef]
- Christensen, J.P.A.; Sand-Jensen, K.; Staehr, P.A. Fluctuating water levels control water chemistry and metabolism of a charophyte-dominated pond. Freshw. Biol. 2013, 58, 1353–1365. [Google Scholar] [CrossRef]
- Holgerson, M.A.; Richardson, D.C.; Roith, J.; Bortolotti, L.E.; Finlay, K.; Hornbach, D.J.; Gurung, K.; Ness, A.; Andersen, M.R.; Bansal, S.; et al. Classifying mixing regimes in ponds and shallow lakes. Water Resour. Res. 2022, 58, e2022WR032522. [Google Scholar] [CrossRef]
- Yvon-Durocher, G.; Caffrey, J.M.; Cescatti, A.; Dossena, M.; Giorgio, P.D.; Gasol, J.M.; Montoya, J.M.; Pumpanen, J.; Staehr, P.A.; Trimmer, M.; et al. Reconciling the temperature dependence of respiration across timescales and ecosystem types. Nature 2012, 487, 472–476. [Google Scholar] [CrossRef] [PubMed]
- Andersen, M.R.; Sand-Jensen, K.; Woolway, R.I.; Jones, I.D. Profound daily vertical temperature variation and mixing in a small, shallow, wind-exposed lake with submerged macrophytes. Aquat. Sci. 2017, 79, 395–405. [Google Scholar] [CrossRef]
- Keery, J.; Binley, A.; Crook, N.; Smith, J.W.N. Temporal and spatial variability of groundwater–surface water fluxes: Development and application of an analytical method using temperature time series. J. Hydrol. 2007, 336, 1–16. [Google Scholar] [CrossRef]
- Montes-Vega, M.J.; Rodríguez-Rodríguez, M. Análisis del hidroperiodo de tres lagunas de la Reserva Biológica de Doñana (2018–2020). Geogaceta 2021, 70, 43–46. [Google Scholar] [CrossRef]
- Acreman, M.; Casier, R.; Salathé, T. Evidence-based risk assessment of ecological damage due to groundwater abstraction: The case of Doñana Natural Space, Spain. Wetlands 2022, 42, 63. [Google Scholar] [CrossRef]


Disclaimer/Publisher’s Note: The statements, opinions and data contained in all publications are solely those of the individual author(s) and contributor(s) and not of MDPI and/or the editor(s). MDPI and/or the editor(s) disclaim responsibility for any injury to people or property resulting from any ideas, methods, instructions or products referred to in the content. |
© 2025 by the authors. Licensee MDPI, Basel, Switzerland. This article is an open access article distributed under the terms and conditions of the Creative Commons Attribution (CC BY) license (https://creativecommons.org/licenses/by/4.0/).