
Impact of Land Cover and Meteorological Attributes on Soil Fertility, Temperature, and Moisture in the Itacaiúnas River Watershed, Eastern Amazon

 , ,
, ,  ,
,  ,
,  , , and
Abstract
1. Introduction
2. Material and Methods
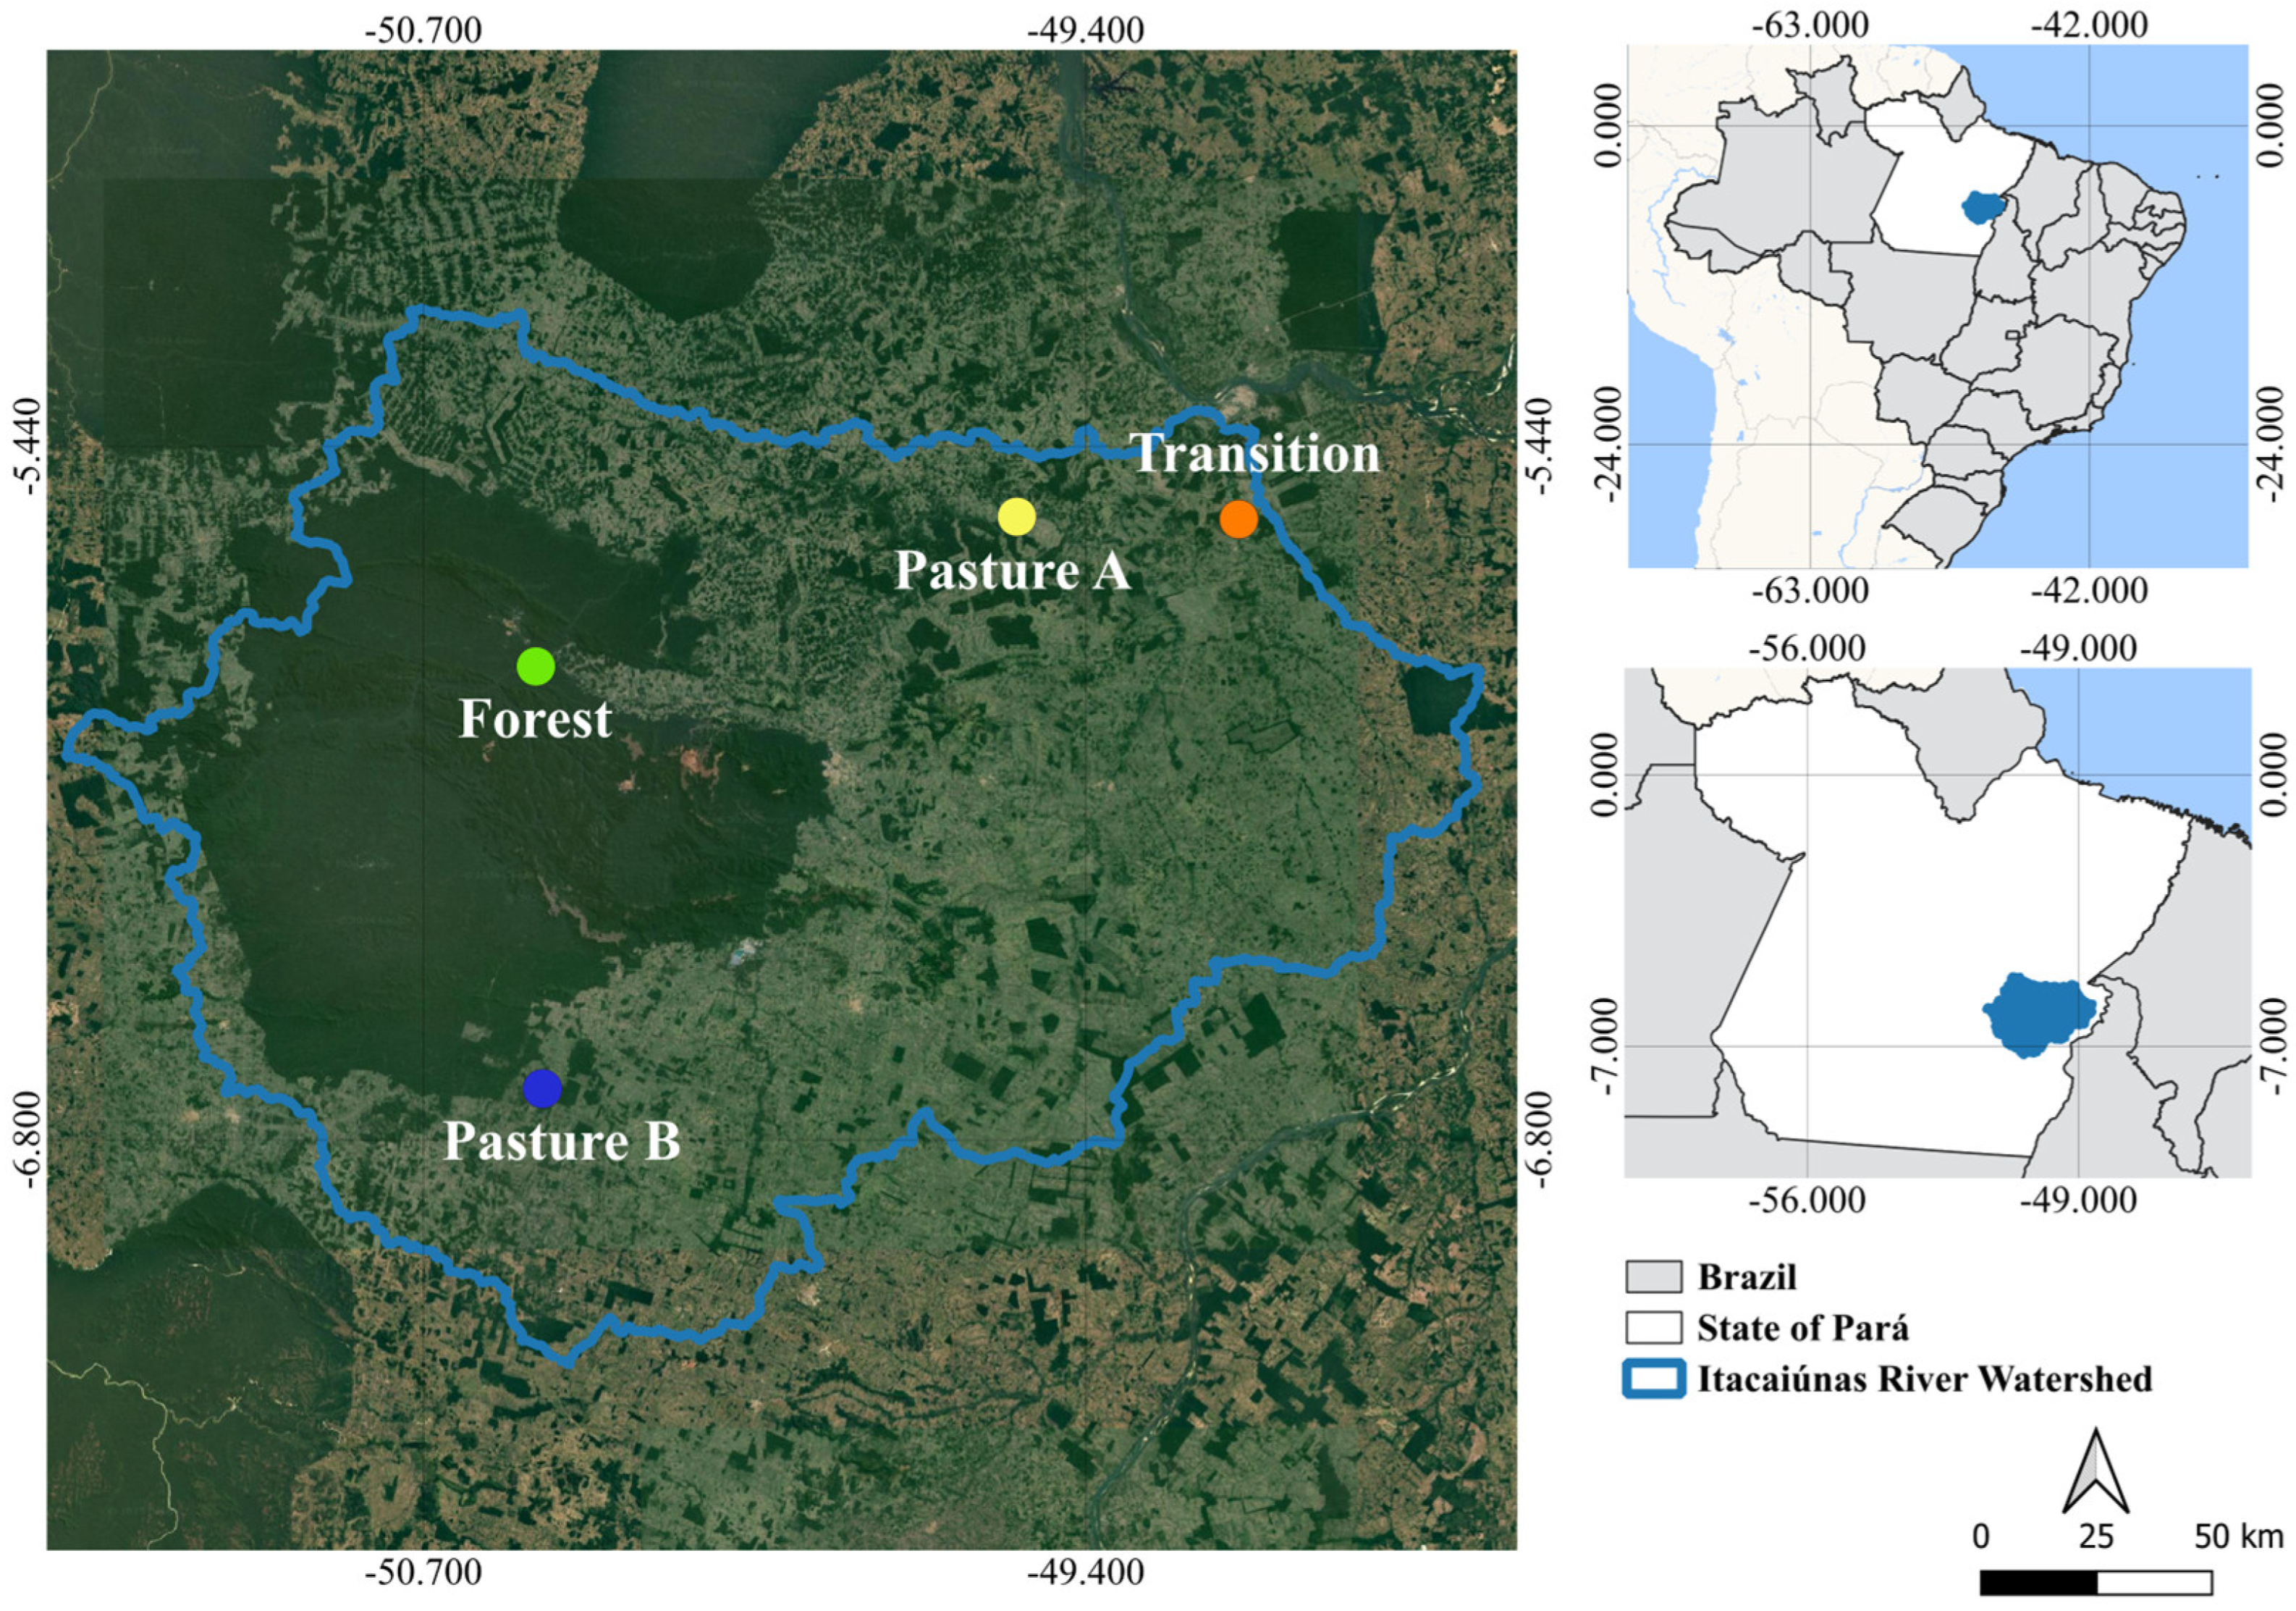
2.1. Study Area
2.2. Studied Variables
2.2.1. Meteorological Variables
2.2.2. Soil Variables
2.3. Statistical Analysis
3. Results and Discussion
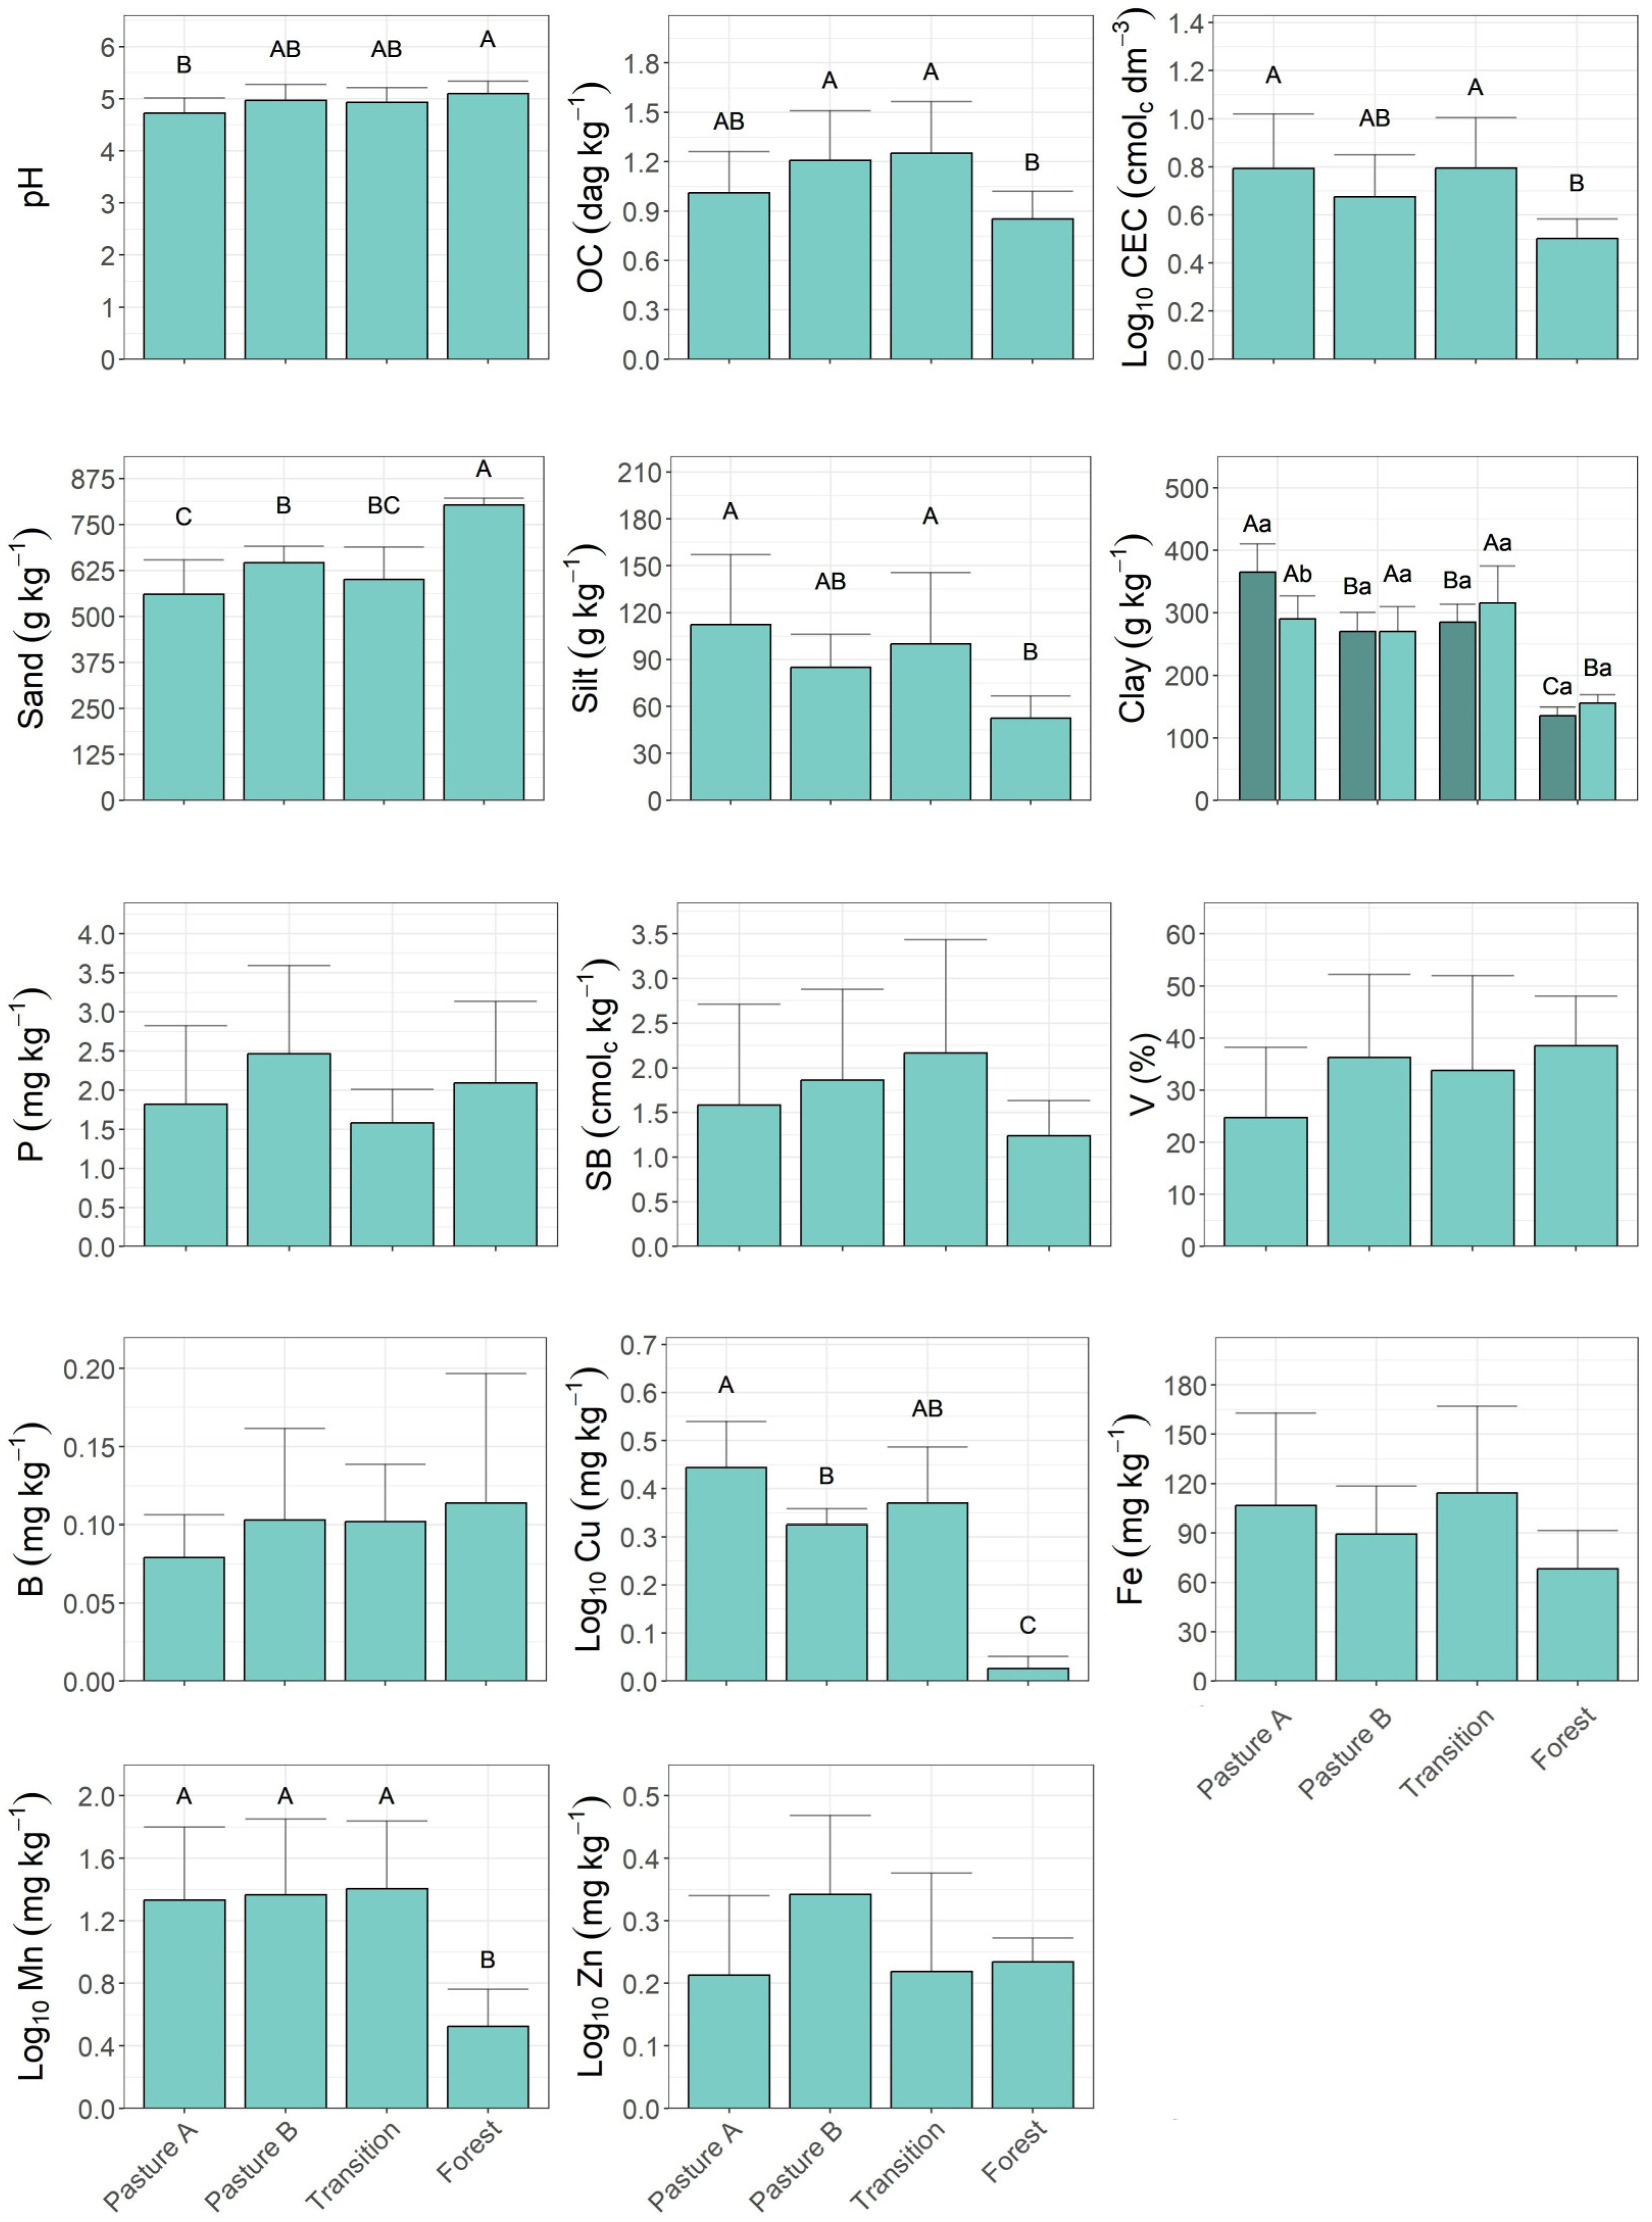
3.1. Soil Physical and Chemical Properties
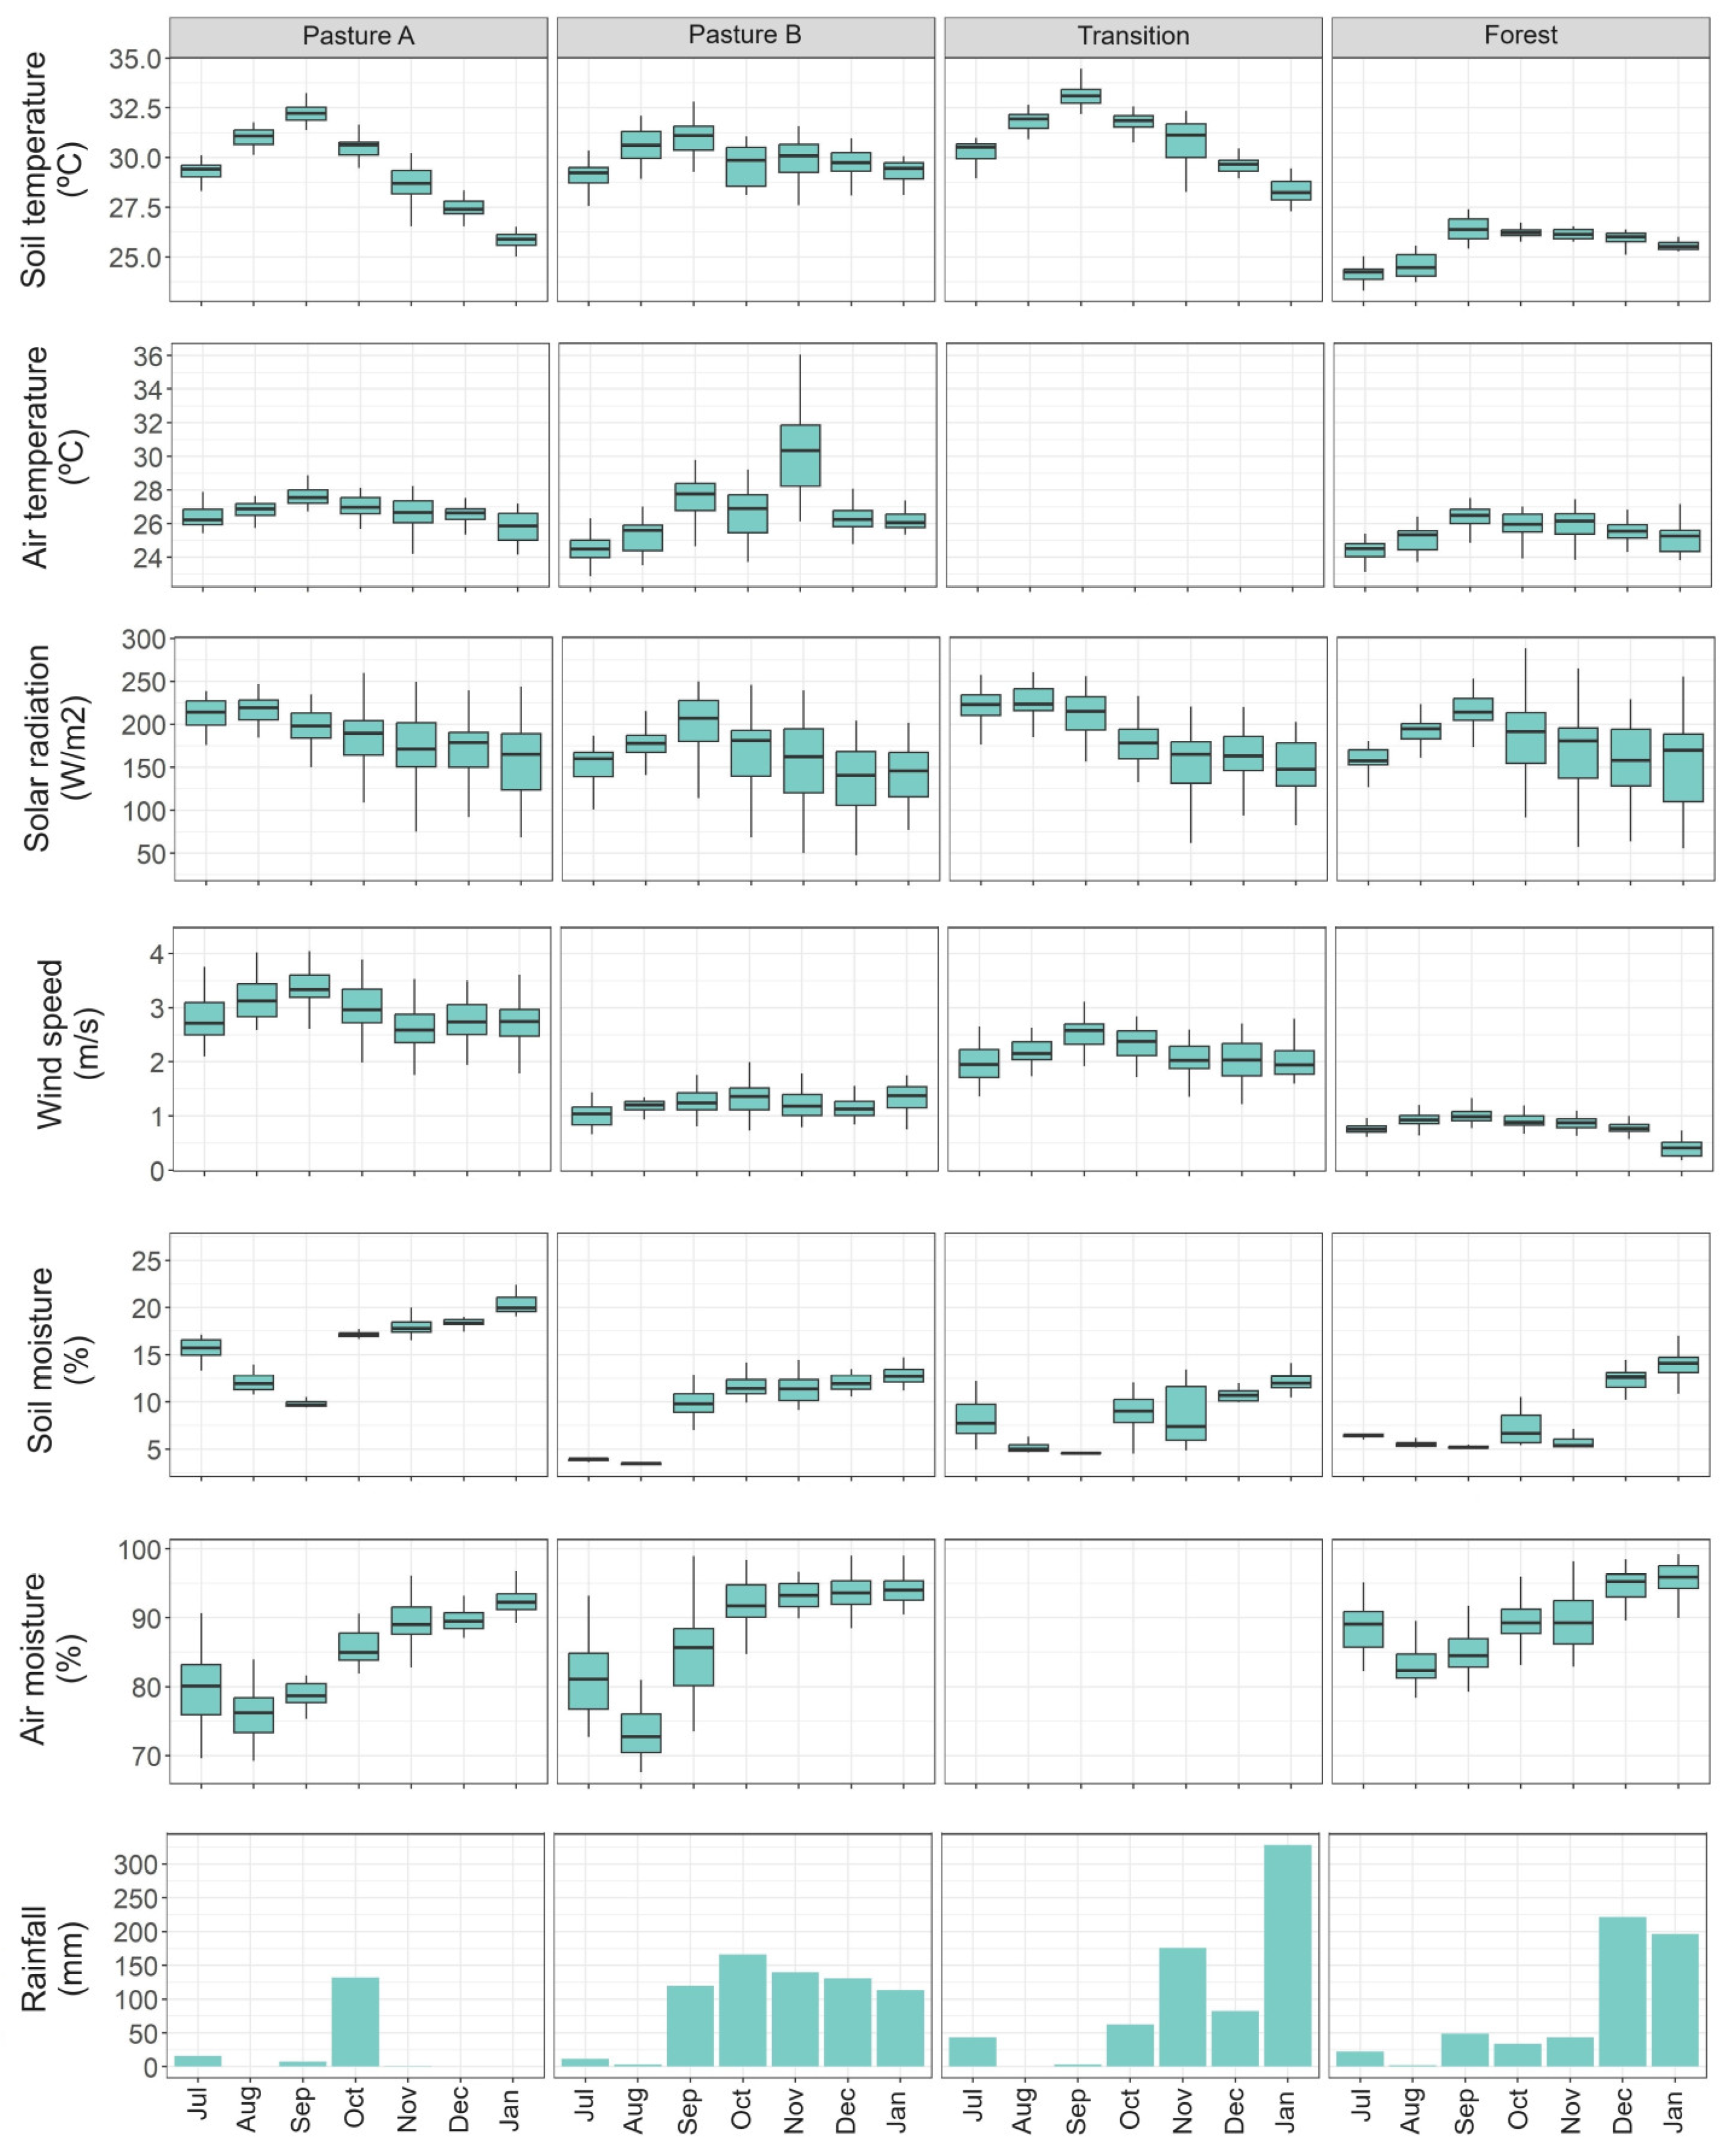
3.2. Soil Temperature and Soil Moisture and Meteorological Attributes
3.3. Relationship Between Attributes
3.3.1. Soil Temperature and Moisture and Physical-Chemical Attributes
3.3.2. Soil Temperature and Moisture Between Depths
3.3.3. Soil Temperature and Moisture and Meteorological Variables
4. Conclusions
Supplementary Materials
Author Contributions
Funding
Data Availability Statement
Acknowledgments
Conflicts of Interest
References
- Baudena, M.; Tuinenburg, O.A.; Ferdinand, P.A.; Staal, A. Effects of Land-use Change in the Amazon on Precipitation Are Likely Underestimated. Glob. Change Biol. 2021, 27, 5580–5587. [Google Scholar] [CrossRef]
- Feitosa, T.B.; Fernandes, M.M.; Santos, C.A.G.; Silva, R.M.D.; Garcia, J.R.; Araujo Filho, R.N.D.; Fernandes, M.R.D.M.; da Cunha, E.R. Assessing Economic and Ecological Impacts of Carbon Stock and Land Use Changes in Brazil’s Amazon Forest: A 2050 Projection. Sustain. Prod. Consum. 2023, 41, 64–74. [Google Scholar] [CrossRef]
- Doblas-Rodrigo, Á.; Gallejones, P.; Artetxe, A.; Rosa, E.; del Hierro, Ó.; Merino, P. Grassland Contribution to Soil Organic Carbon Stock under Climate Change Scenarios in Basque Country (Spain). Reg. Environ. Chang. 2022, 22, 34. [Google Scholar] [CrossRef]
- Cavalcante, R.B.L.; Pontes, P.R.M.; Souza-Filho, P.W.M.; de Souza, E.B. Opposite Effects of Climate and Land Use Changes on the Annual Water Balance in the Amazon Arc of Deforestation. Water Resour. Res. 2019, 55, 3092–3106. [Google Scholar] [CrossRef]
- Rizzo, R.; Garcia, A.S.; Vilela, V.M.D.F.N.; Ballester, M.V.R.; Neill, C.; Victoria, D.C.; da Rocha, H.R.; Coe, M.T. Land Use Changes in Southeastern Amazon and Trends in Rainfall and Water Yield of the Xingu River during 1976–2015. Clim. Change 2020, 162, 1419–1436. [Google Scholar] [CrossRef]
- Melo, V.F.; Barros, L.S.; Silva, M.C.S.; Veloso, T.G.R.; Senwo, Z.N.; Matos, K.S.; Nunes, T.K.O. Soil Bacterial Diversities and Response to Deforestation, Land Use and Burning in North Amazon, Brazil. Appl. Soil Ecol. 2021, 158, 103775. [Google Scholar] [CrossRef]
- Silva-Olaya, A.M.; Mora-Motta, D.A.; Cherubin, M.R.; Grados, D.; Somenahally, A.; Ortiz-Morea, F.A. Soil Enzyme Responses to Land Use Change in the Tropical Rainforest of the Colombian Amazon Region. PLoS One 2021, 16, e0255669. [Google Scholar] [CrossRef]
- Soares, M.D.R.; de Souza, Z.M.; Campos, M.C.C.; da Silva, R.B.; Esteban, D.A.A.; Noronha, R.L.; dos Santos Gomes, M.G.; da Cunha, J.M. Land-Use Change and Its Impact on Physical and Mechanical Properties of Archaeological Black Earth in the Amazon Rainforest. CATENA 2021, 202, 105266. [Google Scholar] [CrossRef]
- Damian, J.M.; Durigan, M.R.; Cherubin, M.R.; Maia, S.M.F.; Ogle, S.M.; de Camargo, P.B.; Ferreira, J.N.; de Oliveira Júnior, R.C.; Cerri, C.E.P. Deforestation and Land Use Change Mediate Soil Carbon Changes in the Eastern Brazilian Amazon. Reg. Environ. Chang. 2021, 21, 64. [Google Scholar] [CrossRef]
- Feng, H. Individual Contributions of Climate and Vegetation Change to Soil Moisture Trends across Multiple Spatial Scales. Sci. Rep. 2016, 6, 32782. [Google Scholar] [CrossRef]
- Wang, X.; Chen, R.; Han, C.; Yang, Y.; Liu, J.; Liu, Z.; Guo, S.; Song, Y. Soil Temperature Change and Its Regional Differences under Different Vegetation Regions across China. Int. J. Climatol. 2021, 41. [Google Scholar] [CrossRef]
- Deng, Y.; Wang, S.; Bai, X.; Luo, G.; Wu, L.; Chen, F.; Wang, J.; Li, C.; Yang, Y.; Hu, Z.; et al. Vegetation Greening Intensified Soil Drying in Some Semi-Arid and Arid Areas of the World. Agric. For. Meteorol. 2020, 292–293, 108103. [Google Scholar] [CrossRef]
- Wang, Y.; Yang, J.; Chen, Y.; Fang, G.; Duan, W.; Li, Y.; De Maeyer, P. Quantifying the Effects of Climate and Vegetation on Soil Moisture in an Arid Area, China. Water 2019, 11, 767. [Google Scholar] [CrossRef]
- Lozano-Parra, J.; Schnabel, S.; Pulido, M.; Gómez-Gutiérrez, Á.; Lavado-Contador, F. Effects of Soil Moisture and Vegetation Cover on Biomass Growth in Water-limited Environments. L. Degrad. Dev. 2018, 29, 4405–4414. [Google Scholar] [CrossRef]
- Su, B.; Shangguan, Z. Decline in Soil Moisture Due to Vegetation Restoration on the Loess Plateau of China. L. Degrad. Dev. 2019, 30, 290–299. [Google Scholar] [CrossRef]
- Lozano-Parra, J.; Pulido, M.; Lozano-Fondón, C.; Schnabel, S. How Do Soil Moisture and Vegetation Covers Influence Soil Temperature in Drylands of Mediterranean Regions? Water 2018, 10, 1747. [Google Scholar] [CrossRef]
- Yu, L.; Liu, Y.; Bu, K.; Wang, W.J.; Zhang, S. Soil Temperature Mitigation Due to Vegetation Biophysical Feedbacks. Glob. Planet. Change 2022, 218, 103971. [Google Scholar] [CrossRef]
- Ma, T.; Nan, X.; Wu, R.; Yan, H.; Wu, N.; She, J.; Bao, Z. Quantifying the Impact of Canopy Structural Characteristics on Soil Temperature Variations in Different Bamboo Communities. Atmosphere 2023, 14, 445. [Google Scholar] [CrossRef]
- Ni, J.; Cheng, Y.; Wang, Q.; Ng, C.W.W.; Garg, A. Effects of Vegetation on Soil Temperature and Water Content: Field Monitoring and Numerical Modelling. J. Hydrol. 2019, 571, 494–502. [Google Scholar] [CrossRef]
- Lima, M.W.D.; Pereira, W.V.D.S.; Souza, E.S.D.; Teixeira, R.A.; Palheta, D.D.C.; Faial, K.D.C.F.; Costa, H.F.; Fernandes, A.R. Bioaccumulation and Human Health Risks of Potentially Toxic Elements in Fish Species from the Southeastern Carajás Mineral Province, Brazil. Environ. Res. 2022, 204, 112024. [Google Scholar] [CrossRef]
- Silva-Júnior, R.O.D.; Souza-Filho, P.W.M.E.; Salomão, G.N.; Tavares, A.L.; Santos, J.F.D.; Santos, D.C.; Dias, L.C.; Silva, M.S.D.; Melo, A.M.Q.D.; Costa, C.E.A.D.S.; et al. Response of Water Balance Components to Changes in Soil Use and Vegetation Cover Over Three Decades in the Eastern Amazon. Front. Water 2021, 3. [Google Scholar] [CrossRef]
- Souza-Filho, P.W.M.; de Souza, E.B.; Silva Júnior, R.O.; Nascimento, W.R.; Versiani de Mendonça, B.R.; Guimarães, J.T.F.; Dall’Agnol, R.; Siqueira, J.O. Four Decades of Land-Cover, Land-Use and Hydroclimatology Changes in the Itacaiúnas River Watershed, Southeastern Amazon. J. Environ. Manage. 2016, 167, 175–184. [Google Scholar] [CrossRef]
- Tavares, A.L.; Da Silva, R.O.; Do Carmo, A.M.C.; Martins, G.C.; Nascimento, W.D.R.; Ferreira, D.B.D.S.; Da Silva, M.S.; Costa, C.E.A.D.S.; Pontes, P.R.; Tedeschi, R.G. Analysis of the Wind Regime at High Spatial-Temporal Resolution in the Itacaiúnas River Watershed, Eastern Amazon. Front. Earth Sci. 2023, 10. [Google Scholar] [CrossRef]
- Alvares, C.A.; Stape, J.L.; Sentelhas, P.C.; de Moraes Gonçalves, J.L.; Sparovek, G. Köppen’s Climate Classification Map for Brazil. Meteorol. Zeitschrift 2013, 22, 711–728. [Google Scholar] [CrossRef]
- Sahoo, P.K.; Dall’Agnol, R.; Salomão, G.N.; da Silva Ferreira Junior, J.; Silva, M.S.; e Souza Filho, P.W.M.; Powell, M.A.; Angélica, R.S.; Pontes, P.R.; da Costa, M.F.; et al. High Resolution Hydrogeochemical Survey and Estimation of Baseline Concentrations of Trace Elements in Surface Water of the Itacaiúnas River Basin, Southeastern Amazonia: Implication for Environmental Studies. J. Geochemical Explor. 2019, 205, 106321. [Google Scholar] [CrossRef]
- Silva Junior, R.O.D.; Tavares, A.L.; Silva, M.S.D.; Martins, G.C.; Costa, C.E.A.D.S.; Melo, A.M.Q.D.; Nascimento Júnior, W.D.R. Installation and Calibration of Sensors for Analysis of Soil Humidity and Temperature in Eastern Amazon Areas. J. Environ. Anal. Prog. 2023, 8, 086–098. [Google Scholar] [CrossRef]
- Alizamir, M.; Kisi, O.; Ahmed, A.N.; Mert, C.; Fai, C.M.; Kim, S.; Kim, N.W.; El-Shafie, A. Advanced Machine Learning Model for Better Prediction Accuracy of Soil Temperature at Different Depths. PLoS One 2020, 15, e0231055. [Google Scholar] [CrossRef] [PubMed]
- Manual de Métodos de Análise de Solo, 3rd ed.; Teixeira, P.C., Donagemma, G.K., Fontana, A., Teixeira, W.G., Eds.; Embrapa Solos: Brasília, Brazil, 2017; ISBN 978-85-7035-771-7. [Google Scholar]
- Silva, C. Manual de Análises Químicas de Solos, Plantas e Fertilizantes, 2nd ed.; Embrapa Informação Tecnológica: Brasília, DF, Brazil, 2009. [Google Scholar]
- R Core Team R: A Language and Environment for Statistical Computing, Vienna, Australia. 2024. Available online: https://cran.r-project.org/doc/manuals/r-release/fullrefman.pdf (accessed on 29 January 2025).
- Venegas, V.H.A.; Novais, R.F.; Barros, N.F.; Cantarutti, R.B.; LOPES, A.S. Interpretation of Soil Analysis Results. In Recommendations for the use of correctives and fertilizers in Minas Gerais; Comissão de Fertilidade do Solo do Estado de Minas Gerais: Viçosa, Brazil, 1999; pp. 25–32. [Google Scholar]
- de Lima, A.F.L.; Campos, M.C.C.; Martins, T.S.; Silva, G.A.; Brito, W.B.M.; dos Santos, L.A.C.; de Oliveira, I.A.; da Cunha, J.M. Soil Chemical Attributes in Areas under Conversion from Forest to Pasture in Southern Brazilian Amazon. Sci. Rep. 2022, 12, 22555. [Google Scholar] [CrossRef]
- Ramos, S.J.; Gastauer, M.; Martins, G.C.; Guedes, R.S.; Caldeira, C.F.; Souza-Filho, P.W.M.; Siqueira, J.O. Changes in Soil Properties during Iron Mining and in Rehabilitating Minelands in the Eastern Amazon. Environ. Monit. Assess. 2022, 194, 256. [Google Scholar] [CrossRef]
- Sekaran, U.; Kumar, S.; Luis Gonzalez-Hernandez, J. Integration of Crop and Livestock Enhanced Soil Biochemical Properties and Microbial Community Structure. Geoderma 2021, 381, 114686. [Google Scholar] [CrossRef]
- Ghosh, A.; Kumar, R.V.; Manna, M.C.; Singh, A.K.; Parihar, C.M.; Kumar, S.; Roy, A.K.; Koli, P. Eco-Restoration of Degraded Lands through Trees and Grasses Improves Soil Carbon Sequestration and Biological Activity in Tropical Climates. Ecol. Eng. 2021, 162, 106176. [Google Scholar] [CrossRef]
- de Oliveira, D.C.; Maia, S.M.F.; Freitas, R.D.C.A.; Cerri, C.E.P. Changes in Soil Carbon and Soil Carbon Sequestration Potential under Different Types of Pasture Management in Brazil. Reg. Environ. Change 2022, 22, 87. [Google Scholar] [CrossRef]
- Ge, N.; Wei, X.; Wang, X.; Liu, X.; Shao, M.; Jia, X.; Li, X.; Zhang, Q. Soil Texture Determines the Distribution of Aggregate-Associated Carbon, Nitrogen and Phosphorous under Two Contrasting Land Use Types in the Loess Plateau. CATENA 2019, 172, 148–157. [Google Scholar] [CrossRef]
- Santos, H.G.D.; Jacomine, P.K.T.; Anjos, L.H.C.D.; Oliveira, V.D.Á.; Lumbreras, J.F.; Coelho, M.R.; Almeida, J.A.D.; Araújo Filho, J.C.D.; Oliveira, J.B.D.; Cunha; et al. Sistema Brasileiro de Classificação de Solos, 5th ed.; Empresa Brasileira de Pesquisa Agropecuária-Embrapa Solos: Brasília, DF, Brazil, 2018. [Google Scholar]
- Souza, E.S.D.; Fernandes, A.R.; De Souza Braz, A.M.; Oliveira, F.J.D.; Alleoni, L.R.F.; Campos, M.C.C. Physical, Chemical, and Mineralogical Attributes of a Representative Group of Soils from the Eastern Amazon Region in Brazil. SOIL 2018, 4, 195–212. [Google Scholar] [CrossRef]
- Ramos, F.T.; Dores, E.F.G.D.C.; Weber, O.L.D.S.; Beber, D.C.; Campelo, J.H.; Maia, J.C.D.S. Soil Organic Matter Doubles the Cation Exchange Capacity of Tropical Soil under No-till Farming in Brazil. J. Sci. Food Agric. 2018, 98, 3595–3602. [Google Scholar] [CrossRef]
- Wagai, R.; Kajiura, M.; Asano, M. Iron and Aluminum Association with Microbially Processed Organic Matter via Meso-Density Aggregate Formation across Soils: Organo-Metallic Glue Hypothesis. SOIL 2020, 6, 597–627. [Google Scholar] [CrossRef]
- Chen, Y.; Shi, J.; Dong, J.; Wu, Y.; Li, C.; Ye, Y.; Tian, X.; Wang, Y. Synergistic Improvement of Soil Organic Carbon Storage and Wheat Grain Zinc Bioavailability by Straw Return in Combination with Zn Application on the Loess Plateau of China. CATENA 2021, 197, 104920. [Google Scholar] [CrossRef]
- Jin, M.; Mullens, T. A Study of the Relations between Soil Moisture, Soil Temperatures and Surface Temperatures Using ARM Observations and Offline CLM4 Simulations. Climate 2014, 2, 279–295. [Google Scholar] [CrossRef]
- Akter, M.; Miah, M.A.; Hassan, M.M.; Mobin, M.N.; Baten, M.A. Textural Influence on Surface and Subsurface Soil Temperatures under Various Conditions. J. Environ. Sci. Nat. Resour. 2015, 8, 149–153. [Google Scholar]
- Marengo, J.A. Interdecadal Variability and Trends of Rainfall across the Amazon Basin. Theor. Appl. Climatol. 2004, 78. [Google Scholar] [CrossRef]
- Ronchail, J.; Cochonneau, G.; Molinier, M.; Guyot, J.-L.; De Miranda Chaves, A.G.; Guimarães, V.; de Oliveira, E. Interannual Rainfall Variability in the Amazon Basin and Sea-Surface Temperatures in the Equatorial Pacific and the Tropical Atlantic Oceans. Int. J. Climatol. 2002, 22, 1663–1686. [Google Scholar] [CrossRef]
- da Rocha, H.R.; Manzi, A.O.; Cabral, O.M.; Miller, S.D.; Goulden, M.L.; Saleska, S.R.; R.-Coupe, N.; Wofsy, S.C.; Borma, L.S.; Artaxo, P.; et al. Patterns of Water and Heat Flux across a Biome Gradient from Tropical Forest to Savanna in Brazil. J. Geophys. Res. Biogeosciences 2009, 114, 1–8. [Google Scholar] [CrossRef]
- Bastable, H.G.; Shuttleworth, W.J.; Dallarosa, R.L.G.; Fisch, G.; Nobre, C.A. Observations of Climate, Albedo, and Surface Radiation over Cleared and Undisturbed Amazonian Forest. Int. J. Climatol. 1993, 13, 783–796. [Google Scholar] [CrossRef]
- von Randow, C.; Manzi, A.O.; Kruijt, B.; de Oliveira, P.J.; Zanchi, F.B.; Silva, R.L.; Hodnett, M.G.; Gash, J.H.C.; Elbers, J.A.; Waterloo, M.J.; et al. Comparative Measurements and Seasonal Variations in Energy and Carbon Exchange over Forest and Pasture in South West Amazonia. Theor. Appl. Climatol. 2004, 78, 5–26. [Google Scholar] [CrossRef]
- McBeath, T.M.; McLaughlin, M.J.; Kirby, J.K.; Armstrong, R.D. Dry Soil Reduces Fertilizer Phosphorus and Zinc Diffusion but Not Bioavailability. Soil Sci. Soc. Am. J. 2012, 76, 1301–1310. [Google Scholar] [CrossRef]
- Prendin, A.L.; Normand, S.; Carrer, M.; Bjerregaard Pedersen, N.; Matthiesen, H.; Westergaard-Nielsen, A.; Elberling, B.; Treier, U.A.; Hollesen, J. Influences of Summer Warming and Nutrient Availability on Salix Glauca L. Growth in Greenland along an Ice to Sea Gradient. Sci. Rep. 2022, 12, 3077. [Google Scholar] [CrossRef]
- Qian, Z.; Zhuang, S.; Gao, J.; Tang, L.; Harindintwali, J.D.; Wang, F. Aeration Increases Soil Bacterial Diversity and Nutrient Transformation under Mulching-Induced Hypoxic Conditions. Sci. Total Environ. 2022, 817, 153017. [Google Scholar] [CrossRef]
- Zhang, Z.; Pan, Z.; Pan, F.; Zhang, J.; Han, G.; Huang, N.; Wang, J.; Pan, Y.; Wang, Z.; Peng, R. The Change Characteristics and Interactions of Soil Moisture and Temperature in the Farmland in Wuchuan County, Inner Mongolia, China. Atmosphere (Basel) 2020, 11, 503. [Google Scholar] [CrossRef]
- Jian, J.; Steele, M.K.; Zhang, L.; Bailey, V.L.; Zheng, J.; Patel, K.F.; Bond-Lamberty, B.P. On the Use of Air Temperature and Precipitation as Surrogate Predictors in Soil Respiration Modelling. Eur. J. Soil Sci. 2022, 73. [Google Scholar] [CrossRef]
- Zhou, Q.; Sun, Z.; Liu, X.; Wei, X.; Peng, Z.; Yue, C.; Luo, Y. Temporal Soil Moisture Variations in Different Vegetation Cover Types in Karst Areas of Southwest China: A Plot Scale Case Study. Water 2019, 11, 1423. [Google Scholar] [CrossRef]
- Tang, C.; Chen, D. Interaction between Soil Moisture and Air Temperature in the Mississippi River Basin. J. Water Resour. Prot. 2017, 9, 1119–1131. [Google Scholar] [CrossRef] [PubMed]
- Silva Júnior, R.O.; Queiroz, J.C.B.; Ferreira, D.B.S.; Tavares, A.L.; Souza-Filho, P.W.M.; Guimarães, J.T.F.; Rocha, E.J.P. Estimativa de Precipitação e Vazões Médias Para a Bacia Hidrográfica Do Rio Itacaiúnas (BHRI), Amazônia Oriental, Brasil (Estimation of Precipitation and Average Flows for the Itacaiúnas River Watershed (IRW) - Eastern Amazonia, Brazil). Rev. Bras. Geogr. Física 2017, 10, 1638. [Google Scholar] [CrossRef]
- Gevaert, A.I.; Miralles, D.G.; de Jeu, R.A.M.; Schellekens, J.; Dolman, A.J. Soil Moisture-Temperature Coupling in a Set of Land Surface Models. J. Geophys. Res. Atmos. 2018, 123, 1481–1498. [Google Scholar] [CrossRef] [PubMed]
- Dembélé, M.; Schaefli, B.; van de Giesen, N.; Mariéthoz, G. Suitability of 17 Gridded Rainfall and Temperature Datasets for Large-Scale Hydrological Modelling in West Africa. Hydrol. Earth Syst. Sci. 2020, 24, 5379–5406. [Google Scholar] [CrossRef]
- Mao, Y.; Liu, S.; Nahar, J.; Liu, J.; Ding, F. Soil Moisture Regulation of Agro-Hydrological Systems Using Zone Model Predictive Control. Comput. Electron. Agric. 2018, 154, 239–247. [Google Scholar] [CrossRef]

| Area | Month | Depth | |||
|---|---|---|---|---|---|
| 0–10 cm | 10–20 cm | 20–30 cm | 30–40 cm | ||
| Pasture A | Jul | 30.53 (0.66) αAc | 29.41 (0.49) αBc | 29.39 (0.39) αBc | 29.52 (0.40) αBc |
| Aug | 32.44 (0.58) αAb | 31.08 (0.53) αBb | 31.04 (0.48) αβBb | 31.07 (0.51) αBb | |
| Sep | 33.70 (0.63) αAe | 32.22 (0.49) αBe | 32.05 (0.41) αBe | 32.10 (0.34) αBe | |
| Oct | 31.86 (0.61) αAb | 30.63 (0.46) αBb | 30.58 (0.41) αBb | 30.74 (0.37) αBb | |
| Nov | 29.90 (1.19) αAc | 28.71 (0.90) αBc | 28.91 (0.72) αBc | 29.22 (0.66) αBc | |
| Dec | 28.17 (0.62) αAd | 27.40 (0.44) αBd | 27.60 (0.43) αBd | 27.97 (0.36) αAd | |
| Jan | 26.59 (0.61) αAa | 25.88 (0.44) αBa | 26.13 (0.30) αCa | 26.60 (0.26) αAa | |
| Pasture B | Jul | 29.51 (0.60) βABa | 29.24 (0.43) αAb | 29.39 (0.33) αAb | 29.75 (0.25) αBb |
| Aug | 30.99 (1.14) βAc | 30.62 (0.99) αAd | 30.68 (0.94) αAd | 30.94 (0.95) αAde | |
| Sep | 31.16 (1.11) βAc | 31.11 (0.89) βAd | 31.23 (0.70) βAd | 31.57 (0.53) βAe | |
| Oct | 30.11 (1.61) βABab | 29.85 (1.36) βAac | 30.03 (1.03) βABac | 30.46 (0.87) αBac | |
| Nov | 30.23 (1.30) αβABb | 30.09 (0.99) βAc | 30.39 (0.81) βABc | 30.77 (0.64) βBcd | |
| Dec | 30.00 (0.78) βAab | 29.75 (0.78) βAac | 30.06 (0.54) βAc | 30.50 (0.51) βBc | |
| Jan | 29.64 (0.64) βAa | 29.45 (0.60) βAab | 29.68 (0.52) βAab | 30.17 (0.49) βBab | |
| Transition | Jul | 30.85 (0.55) αAc | 30.51 (0.42) βBc | 29.86 (0.31) βCd | 30.57 (0.22) βABd |
| Aug | 32.52 (0.59) αAb | 31.94 (0.46) βBb | 31.25 (0.45) βCb | 32.02 (0.39) βBb | |
| Sep | 33.69 (0.87) αAe | 33.11 (0.54) χBe | 32.35 (0.54) αCe | 33.13 (0.46) χABe | |
| Oct | 31.88 (0.92) αABb | 31.86 (0.43) χAb | 31.26 (0.36) χCb | 32.05 (0.34) βBb | |
| Nov | 31.15 (1.52) βAc | 31.12 (1.10) χABc | 30.63 (0.90) βBc | 31.51 (0.85) βAc | |
| Dec | 29.59 (0.47) βAd | 29.65 (0.42) βAd | 29.08 (0.32) χBd | 29.90 (0.28) χCd | |
| Jan | 28.40 (1.14) χABa | 28.22 (0.74) χAa | 27.72 (0.49) χCa | 28.55 (0.43) χBa | |
| Forest | Jul | 23.99 (0.48) χAd | 24.23 (0.41) χABd | 24.40 (0.33) χBc | 24.28 (0.34) χABc |
| Aug | 24.65 (1.05) χAd | 24.45 (0.85) χAd | 24.48 (0.64) χAc | 24.28 (0.47) χAc | |
| Sep | 26.74 (0.93) χAb | 26.38 (0.76) δABc | 26.23 (0.70) χBCb | 25.90 (0.68) δCb | |
| Oct | 26.32 (0.33) χAb | 26.21 (0.21) δAbc | 26.16 (0.15) δAb | 25.98 (0.12) χBb | |
| Nov | 26.14 (0.58) χAbc | 26.13 (0.34) δAbc | 26.12 (0.26) χAb | 25.93 (0.16) χBb | |
| Dec | 25.93 (0.32) χABc | 26.02 (0.34) χAb | 26.06 (0.26) δAb | 25.86 (0.21) δBb | |
| Jan | 25.36 (0.45) δAa | 25.53 (0.23) αABa | 25.57 (0.17) δBa | 25.52 (0.12) δBa | |
| Area | Month | Depth | |||
| 0–10 cm | 10–20 cm | 20–30 cm | 0–10 cm | ||
| Pasture A | Jul | 2.77 (0.78) αAc | 15.7 (1.19) αBd | 21.2 (0.40) αCd | 20.6 (0.16) αDd |
| Aug | 1.63 (0.16) αAd | 11.9 (0.16) αBe | 17.5 (0.54) αCe | 18.7 (0.33) αDe | |
| Sep | 1.46 (0.05) αAe | 9.66 (0.22) αBf | 16.6 (0.25) αCf | 18.3 (0.11) αDf | |
| Oct | 4.72 (0.29) αAb | 17.1 (0.31) αBb | 22.4 (0.27) αCb | 21.4 (0.21) αDb | |
| Nov | 5.05 (0.54) αAb | 17.8 (0.78) αBc | 23.5 (0.35) αCc | 22.2 (0.37) αDc | |
| Dec | 5.36 (0.60) αAb | 18.4 (0.47) αBc | 24.0 (0.34) αCc | 22.3 (0.29) αDc | |
| Jan | 7.08 (0.73) αAa | 19.9 (0.72) αBa | 25.0 (0.37) αCa | 23.1 (0.31) αDa | |
| Pasture B | Jul | 2.68 (0.31) αAc | 3.94 (0.10) βBc | 3.52 (0.22) βCc | 4.34 (0.39) βDc |
| Aug | 2.18 (0.14) βAd | 3.47 (0.10) βBd | 3.17 (0.05) βCd | 3.93 (0.03) βDd | |
| Sep | 7.95 (1.65) βABe | 9.78 (1.44) αCe | 7.50 (0.81) βAe | 8.77 (0.62) βBe | |
| Oct | 9.97 (0.99) βAb | 11.4 (0.95) βBb | 8.67 (0.72) βCab | 10.3 (0.88) βAab | |
| Nov | 10.4 (1.54) βAb | 11.4 (1.70) βBb | 8.12 (0.99) βCb | 9.25 (1.11) βAb | |
| Dec | 10.5 (1.20) βAab | 11.9 (1.08) βBab | 8.68 (0.41) βCab | 10.1 (0.47) βAab | |
| Jan | 11.3 (1.35) βAa | 12.7 (0.98) βχBa | 9.00 (0.46) βCa | 10.7 (0.54) βDa | |
| Transition | Jul | 1.39 (0.39) βAb | 7.75 (2.25) χBb | 9.74 (2.81) χCc | 10.9 (2.90) χCbc |
| Aug | 0.87 (0.09) χAd | 4.97 (0.38) χBd | 6.76 (0.24) χCe | 7.52 (0.21) χDe | |
| Sep | 0.77 (0.02) χAe | 4.56 (0.04) βBe | 6.57 (0.01) χCf | 7.35 (0.01) χDf | |
| Oct | 1.94 (0.50) χAb | 9.00 (1.90) χBb | 11.0 (1.77) χCbc | 11.6 (1.68) βCb | |
| Nov | 1.93 (1.26) χAb | 7.38 (3.52) χBbc | 9.70 (4.11) χCbd | 10.8 (4.23) βCc | |
| Dec | 3.15 (0.52) χAc | 10.7 (0.80) χBc | 13.0 (0.92) χCd | 14.2 (0.76) χDd | |
| Jan | 5.25 (1.10) χAa | 12.0 (0.83) βBa | 13.9 (0.69) χCa | 15.1 (0.58) χDa | |
| Forest | Jul | 4.44 (0.48) χAb | 6.50 (0.14) χBb | 14.4 (0.26) δCb | 19.0 (0.22) δDb |
| Aug | 3.53 (0.40) δAc | 5.45 (0.30) δBc | 12.6 (0.48) δCc | 17.4 (0.58) δDc | |
| Sep | 3.41 (0.44) δAc | 5.16 (0.09) χBd | 12.1 (0.06) δCd | 16.8 (0.05) δDd | |
| Oct | 5.14 (1.45) αAb | 6.66 (1.63) χBb | 13.9 (1.75) δCb | 18.4 (1.34) χDb | |
| Nov | 4.50 (0.76) αAb | 5.35 (0.21) δBc | 12.5 (0.23) χCc | 17.2 (0.21) χDc | |
| Dec | 11.4 (1.85) βAa | 12.6 (1.47) βAa | 21.2 (1.35) δBa | 26.1 (1.36) δCa | |
| Jan | 13.6 (2.46) βAa | 14.1 (1.44) χAa | 23.3 (1.34) δBa | 28.0 (1.05) δCa | |
| Area | Variable | T1 | T2 | T3 | T4 | U1 | U2 | U3 | U4 | Tair | Uair | WS | SR |
|---|---|---|---|---|---|---|---|---|---|---|---|---|---|
| Pasture A (n = 276–281) | T2 | 0.99 | |||||||||||
| T3 | 0.98 | 1 | |||||||||||
| T4 | 0.97 | 0.99 | 1 | ||||||||||
| U1 | −0.8 | −0.8 | −0.8 | −0.8 | |||||||||
| U2 | −0.8 | −0.8 | −0.8 | −0.8 | 0.92 | ||||||||
| U3 | −0.9 | −0.9 | −0.9 | −0.9 | 0.9 | 0.96 | |||||||
| U4 | −0.9 | −0.9 | −0.9 | −0.9 | 0.93 | 0.96 | 0.98 | ||||||
| Tair | 0.67 | 0.6 | 0.56 | 0.53 | −0.5 | −0.5 | −0.5 | −0.6 | |||||
| Uair | −0.8 | −0.8 | −0.8 | −0.8 | 0.78 | 0.81 | 0.86 | 0.86 | −0.6 | ||||
| WS | 0.37 | 0.38 | 0.39 | 0.39 | −0.2 | −0.4 | −0.4 | −0.3 | 0.18 | −0.4 | |||
| SR | 0.45 | 0.37 | 0.31 | 0.28 | −0.4 | −0.4 | −0.4 | −0.5 | 0.64 | −0.6 | 0.2 | ||
| Rainfall | −0.3 | −0.3 | −0.3 | −0.3 | 0.55 | 0.4 | 0.36 | 0.45 | −0.4 | 0.34 | - | −0.3 | |
| Pasture B (n = 177–211) | T2 | 0.97 | |||||||||||
| T3 | 0.91 | 0.98 | |||||||||||
| T4 | 0.84 | 0.94 | 0.99 | ||||||||||
| U1 | −0.3 | −0.2 | −0.2 | - | |||||||||
| U2 | −0.2 | −0.2 | −0.1 | - | 0.99 | ||||||||
| U3 | −0.2 | −0.2 | −0.1 | - | 0.98 | 0.99 | |||||||
| U4 | −0.3 | −0.2 | −0.2 | - | 0.96 | 0.98 | 0.99 | ||||||
| Tair | 0.42 | 0.41 | 0.41 | 0.42 | 0.36 | 0.37 | 0.39 | 0.37 | |||||
| Uair | −0.5 | −0.4 | −0.3 | −0.2 | 0.86 | 0.84 | 0.84 | 0.84 | - | ||||
| WS | 0.2 | 0.23 | 0.25 | 0.25 | 0.17 | 0.17 | 0.17 | 0.15 | - | - | |||
| SR | 0.58 | 0.42 | 0.3 | 0.23 | −0.2 | −0.2 | −0.2 | −0.2 | 0.25 | −0.5 | - | ||
| Rainfall | −0.3 | −0.2 | - | - | 0.41 | 0.39 | 0.36 | 0.34 | - | 0.44 | 0.2 | −0.4 | |
| Transition (n = 257–488) | T2 | 0.98 | |||||||||||
| T3 | 0.96 | 1 | |||||||||||
| T4 | 0.95 | 0.99 | 1 | ||||||||||
| U1 | −0.9 | −0.9 | −0.9 | −0.9 | |||||||||
| U2 | −0.9 | −0.9 | −0.9 | −0.9 | 0.91 | ||||||||
| U3 | −0.9 | −0.9 | −0.9 | −0.9 | 0.9 | 1 | |||||||
| U4 | −0.9 | −0.9 | −0.9 | −0.9 | 0.9 | 0.99 | 1 | ||||||
| Tair | nd | nd | nd | nd | nd | nd | nd | nd | |||||
| Uair | nd | nd | nd | nd | nd | nd | nd | nd | nd | ||||
| WS | 0.47 | 0.48 | 0.48 | 0.49 | −0.3 | −0.3 | −0.3 | −0.3 | nd | nd | |||
| SR | 0.51 | 0.41 | 0.35 | 0.3 | −0.4 | −0.4 | −0.4 | −0.4 | nd | nd | 0.1 | ||
| Rainfall | −0.4 | −0.4 | −0.4 | −0.3 | 0.56 | 0.47 | 0.45 | 0.43 | nd | nd | 0.1 | −0.5 | |
| Forest (n = 261–265) | T2 | 0.96 | |||||||||||
| T3 | 0.92 | 0.99 | |||||||||||
| T4 | 0.88 | 0.98 | 1 | ||||||||||
| U1 | - | - | 0.14 | 0.2 | |||||||||
| U2 | - | - | 0.13 | 0.18 | 0.98 | ||||||||
| U3 | - | - | - | 0.16 | 0.97 | 0.99 | |||||||
| U4 | - | - | - | 0.17 | 0.96 | 0.98 | 1 | ||||||
| Tair | 0.82 | 0.66 | 0.58 | 0.52 | −0.3 | −0.2 | −0.2 | −0.2 | |||||
| Uair | - | 0.18 | 0.25 | 0.31 | 0.82 | 0.8 | 0.8 | 0.79 | −0.4 | ||||
| WS | 0.2 | - | - | - | −0.8 | −0.8 | −0.8 | −0.8 | 0.31 | −0.7 | |||
| SR | 0.38 | 0.18 | - | - | −0.3 | −0.3 | −0.3 | −0.3 | 0.68 | −0.6 | 0.4 | ||
| Rainfall | - | - | - | - | 0.58 | 0.57 | 0.48 | 0.43 | −0.3 | 0.43 | −0.3 | −0.4 |
| Area | Equation | R2 |
|---|---|---|
| Pasture B | T2 = 18.2 + 0.71Tair–0.08U2 + 0.02Rainfall + 0.71WS − 0.06Uair–0.007SR | 0.62 |
| Forest | T2 = −3.13 + 0.82Tair + 0.08Uair + 0.97WS–0.003SR | 0.73 |
Disclaimer/Publisher’s Note: The statements, opinions and data contained in all publications are solely those of the individual author(s) and contributor(s) and not of MDPI and/or the editor(s). MDPI and/or the editor(s) disclaim responsibility for any injury to people or property resulting from any ideas, methods, instructions or products referred to in the content. |
© 2025 by the authors. Licensee MDPI, Basel, Switzerland. This article is an open access article distributed under the terms and conditions of the Creative Commons Attribution (CC BY) license (https://creativecommons.org/licenses/by/4.0/).
Share and Cite
Silva Júnior, R.O.d.; Morais, T.B.S.S.; Pereira, W.V.d.S.; Martins, G.C.; Ribeiro, P.G.; Melo, A.M.Q.d.; Silva, M.S.d.; Ramos, S.J. Impact of Land Cover and Meteorological Attributes on Soil Fertility, Temperature, and Moisture in the Itacaiúnas River Watershed, Eastern Amazon. Environments 2025, 12, 98. https://doi.org/10.3390/environments12040098
Silva Júnior ROd, Morais TBSS, Pereira WVdS, Martins GC, Ribeiro PG, Melo AMQd, Silva MSd, Ramos SJ. Impact of Land Cover and Meteorological Attributes on Soil Fertility, Temperature, and Moisture in the Itacaiúnas River Watershed, Eastern Amazon. Environments. 2025; 12(4):98. https://doi.org/10.3390/environments12040098
Chicago/Turabian StyleSilva Júnior, Renato Oliveira da, Tatiane Barbarelly Serra Souza Morais, Wendel Valter da Silveira Pereira, Gabriel Caixeta Martins, Paula Godinho Ribeiro, Adayana Maria Queiroz de Melo, Marcio Sousa da Silva, and Sílvio Junio Ramos. 2025. "Impact of Land Cover and Meteorological Attributes on Soil Fertility, Temperature, and Moisture in the Itacaiúnas River Watershed, Eastern Amazon" Environments 12, no. 4: 98. https://doi.org/10.3390/environments12040098
APA StyleSilva Júnior, R. O. d., Morais, T. B. S. S., Pereira, W. V. d. S., Martins, G. C., Ribeiro, P. G., Melo, A. M. Q. d., Silva, M. S. d., & Ramos, S. J. (2025). Impact of Land Cover and Meteorological Attributes on Soil Fertility, Temperature, and Moisture in the Itacaiúnas River Watershed, Eastern Amazon. Environments, 12(4), 98. https://doi.org/10.3390/environments12040098