Article

Method Validation: Extraction of Microplastics from Organic Fertilisers

1
Institut de Recherche Dupuy de Lôme (IRDL), Université Bretagne Sud, UMR CNRS 6027, 56100 Lorient, France
2
OrgaNeo, 57000 Metz, France
3
RITTMO Agroenvironnement, 68000 Colmar, France
4
Labocéa, 29280 Plouzané, France
5
Agence de la Transition Ecologique (ADEME), 49004 Angers, France
*
Author to whom correspondence should be addressed.
Environments 2025, 12(5), 143; https://doi.org/10.3390/environments12050143
Submission received: 13 March 2025 / Revised: 18 April 2025 / Accepted: 20 April 2025 / Published: 26 April 2025
(This article belongs to the Special Issue Editorial Board Members’ Collection Series: Plastic Contamination)

Abstract

:
It has been demonstrated that organic fertilisers could be a source of microplastics (MPs) in agricultural soils. These organic fertilisers comprise a diverse array of matrices including organic waste and by-products. Currently, there is no established methodology for the extraction of MP from these matrices. The present article aims to validate a standardised protocol for the extraction of MPs from a diverse range of complex, organic-rich samples. The protocol has been developed to ensure a high recovery of MPs, to preserve their integrity, and to eliminate organic particles that interfere with FTIR analyses. Spiked MPs sized 315–5000 µm were subjected to a two-step process involving chemical digestion (H2O2, 30% (w/v), 53 °C) and density separation (NaI, >1.60 g·cm−3). This resulted in a mean extraction rate exceeding 95%, with undigested matter remaining below 5%. No evidence of fragmentation was observed. Furthermore, the chemical nature of spiked microplastics is still perfectly interpretable from the FTIR spectra despite the different chemical treatments undergone. These findings thus validate the method for the microplastic range 315–5000 µm. However, a new method for reanalysing the project’s data produced contrasting results, suggesting a significant drop in recovery rates for size ranges below 250 µm. This reanalysis approach constitutes the second innovation of this protocol, and enables a more critical analysis of the results obtained in publications on microplastics.

1. Introduction

Within the paradigm of a circular economy, the promotion of bio-waste recycling with the objective of restoring soil is accompanied by an increase in the use of organic fertilisers [1,2,3]. Organic amendments are defined as a range of complex, solid or semi-liquid, organic-rich matrices, which are employed to enhance crop growth and yields. This is achieved by improving soil organic matter content, fertility, or microbial activity [3,4,5,6]. Organic soil improvers are frequently classified into two principal categories. The first encompasses organic soil improvers such as composts, digestates, manures, sewage sludges and green waste. The second category comprises the inputs necessary for manufacturing organic soil improvers, including deconditioning pulps. In order to ensure the optimal quality of matrices for use on agricultural soils, it is essential to avoid the presence of contaminants and undesirable elements, such as persistent organic pollutants (POPs), heavy metals or plastics. The issue of plastic pollution in terrestrial environments has gained significant attention and study since the 2010s [7,8,9,10,11]. This has resulted in a growing understanding of the role of organic fertilisers in the accumulation of microplastics (plastic particles < 5 mm) in soils [2,6,12,13,14,15]. At this juncture, the most prevalent polymers observed in these matrices are conventional polymers such as polyethylene (PE), polypropylene (PP), polyvinyl chloride (PVC), and polyesters such as polyethylene terephthalate (PET). However, it is also of interest to monitor certain biodegradable polymers, such as those based on Poly (lactic acid)–Poly (butylene adipate-co-terephthalate) (PLA-PBAT) blends, due to their emerging presence in a number of economic activities, as well as their susceptibility to being found in organic waste products at the end of their use cycle. For example, they are currently employed as plastic mulching materials in agriculture and are beginning to be used in the packaging sector. The issue of microplastic pollution from plastic mulching has been highlighted in several publications [14,16,17,18], whereas the subject of compostable bags remains relatively understudied [19,20].
A more nuanced comprehension of the nature, sources and concentrations of microplastics present in organic fertilisers will facilitate a more precise evaluation of the impact of processes, the estimation of flows to cultivated land and the identification of potential intervention points to reduce these flows. This necessitates the generation of sufficient data for statistical analysis, which in turn requires the analysis of a large number of samples. Nevertheless, the detection of MPs poses a considerable challenge, necessitating the differentiation of plastic from natural particles [21]. The removal of organic matter from complex matrices is therefore imperative, and the procedure is pivotal in facilitating the extraction and isolation of the MPs. In the absence of such organic matter removal, residual components such as vegetation persist, thereby prolonging the duration of optical and spectral analysis [21]. The development of a relevant, rapid and straightforward methodology for the extraction and characterisation of microplastics in solid matrices is therefore a pressing necessity. However, the extraction of microplastics (MP) from organic fertilisers is challenging and time-consuming, and requires significant human input [22,23,24]. A number of microplastic extraction protocols have been proposed in the scientific literature, drawing upon former research studies conducted in wider areas such as in seawater, soil or sediment. A variety of techniques are employed for the purpose of digesting organic matter. The selection of the technique is dependent upon the context, and each has its own advantages and disadvantages [21]. Acid methods have been shown to be effective in the digestion of organic animal matter; however, they are not as efficacious when it comes to the digestion of organic matter of plant origin. Nevertheless, for certain plastics, such as PET, these methods can be overly aggressive. Conversely, alkaline methods exhibit reduced effectiveness in the presence of plastics when compared to acidic methods; however, they are effective in the treatment of organic matrices. It should also be noted that the presence of organic residues, such as humic acids, can compromise the effectiveness of these processes. Enzymatic attacks are known for their effectiveness in digesting organic matter without affecting plastics. However, these enzymes are typically specific to the material being digested and can often be expensive to implement. Finally, oxidative methods are very effective in treating complex organic matrices, but often take time to take effect. There is a paucity of data on the impact of oxidative methods on biodegradable polymers such as PLA-PBAT blends.
A consensus on a standardised methodology has yet to be reached. However, a number of similarities can be identified among the various protocols, and the processing is commonly divided into four main steps, which address the issues related to complex organo-mineral matrices. These steps include sample preparation by sieving, density separation, and organic matter removal, followed by MP identification [11,12,25,26]. A key benefit of this approach is the removal of organic matter, which has been shown to reduce interferences during particle analysis (e.g., Fourier transform infrared spectroscopy (FTIR), pyrolysis gas chromatography/mass spectrometry (GC/MS)). The efficacy of hydrogen peroxide (H2O2) and Fenton’s reaction in organic matter elimination is frequently highlighted, particularly in the context of soil and sludge remediation [27]. The effectiveness of these reagents in eliminating organic content and enhancing MP extraction in solid environmental matrices has been demonstrated [27]. The National Oceanic and Atmospheric Administration (NOAA) has recently endorsed the hydrogen peroxide method [21].
In 2020, the French Agency for Ecological Transition (ADEME) initiated a substantial research initiative with the objective of examining the contamination of organic waste products by microplastics. The primary objective of this project is to evaluate the presence of microplastics in diverse categories of organic waste products, with the overarching aim of determining the extent of microplastic flows towards French soils. The initial stage of the project involved the validation of an extraction protocol. In order to facilitate the intercomparison of the results, the protocol must permit the extraction and analysis of microplastics by focal-plane array (FPA) FTIR from complex organic matrices of a disparate nature [28]. Moreover, the protocol should facilitate the extraction and analysis of biodegradable polymers. Finally, the protocol should enable the study of approximately 180 subsamples within the allotted timeframe of 30 months. The principal objective of the present study is therefore to evaluate a protocol for extracting microplastics in order to ascertain whether it meets the specifications defined in 2020. The work is divided into two main areas. The first concerns the a priori analysis of the protocol, that is, tests on the protocol to check its effectiveness prior to the main work of analysing the matrices. The second area, which is one of the original features of the proposed approach, involves the a posteriori analysis of the protocol based on the results obtained during the project. The combination of these two approaches has yielded a nuanced and precise understanding of the protocol’s strengths and weaknesses.

2. Materials and Methods

2.1. Origin of the Organic Waste Products (OWP)

As part of the sampling campaign, a total of 83 samples were collected from 70 industrial sites. The samples were collected between 5 March 2021 and 13 July 2022. Of these, 20 matrices from as many industrial or agricultural sites across mainland France were selected for use in the microplastics extraction method testing based on spiking (Supplementary Materials, Table S1). These 20 matrices represent a broad spectrum of organic matter sources, compositions and production processes. To mitigate the potential for experimenter bias, the identities of the sampling sites and the precise nature of the samples were anonymised. Each sample was assigned a unique identification number, ensuring both its anonymity and its traceability.

2.2. Sampling Methods

The sampling protocol was developed in accordance with French standards as outlined in NF U44-108 (1982) and NF EN 12579 (2013), which respectively concern sewage sludge and organic amendments or growing media [29,30]. For each final matrix, i.e., a homogeneous and finished product ready for spreading (e.g., a mature compost), an overall sample was derived. This sample was collected from storage tanks, post-fermentation or storage silos by different methods according to its shape. For liquid matrices, a multi-sampling technique was employed, utilising a stainless-steel sampling cane to constitute a homogeneous 5 L final sample. For solid matrices, several samples were taken and mixed after windrow opening to form a final homogeneous 5 kg sample using a stainless-steel divider or the quartage method. The sampling dates ranged from March 2021 to June 2022, encompassing ten French administrative regions. The final samples were stored in glass jars and refrigerated immediately after sampling. Depending on the process involved, the samples were divided into six general categories: digestate, compost, wastewater treatment plant (WWTP or sewage) sludge, livestock manure, greenwaste and deconditioning pulp. There were seven samples in the digestate category, seven in the compost category, and two samples in each of the sewage sludge and livestock manure categories. Only one sample was a greenwaste, and the same applied for deconditioning pulp.
It is important to note that the experimental procedures were conducted on matrices that were contaminated with varying quantities of microplastics. In order to locate the spiked plastic particles, the experiment had to be based on morphologically recognisable microplastics.

2.3. Microplastics Preparation and Extraction Protocol

2.3.1. Spiked Microplastics

Three polymers of differing chemical natures were selected for the experimentsZ—polyvinyl chloride (PVC), polyethylene (PE), and a polylactic acid (PLA)-poly(butylene adipate-co-terephthalate) (PBAT) blend. The selection of these three different polymers was made according to the following criteria: easily observable colours (light grey for PVC, bright red for PE, deep black for PLA-PBAT) and different densities (about 1.38 g/cm3 for PVC, between 0.88 and 0.96 g/cm3 for PE, and 1.25 g/cm3 for the PLA-PBAT blend). The choice of polymers was also informed by their differing morphologies (rigid fragments of PVC and PE, and very thin flexible films (thickness between 10–14 µm) of PLA-PBAT from plastic mulching, as illustrated in the Supplementary Materials, Table S2). PE and PVC are widely used polymers, particularly in the packaging, mulching and building sectors, and are commonly observed in the environment [31]. PVC is also relatively dense in comparison to other common polymers, a property that renders it more difficult to extract during the density separation phase (Supplementary Materials, Table S2). The biodegradable agricultural film was composed of PLA-PBAT, which is known to be more sensitive to degradation than conventional polymers. Consequently, the digestion step is more likely to degrade this kind of polymer. The reference spectra of the three polymers were obtained by Fourier transformed infrared spectroscopy, which attenuated total reflectance (ATR-FTIR; Bruker Vertex 70v spectrometer, OPUS v6.5 software). Then, microplastics were produced in the laboratory by the cryogenic grinding of commercial plastics (i.e., material not exposed to environmental conditions, additive composition not controlled) with liquid nitrogen or manual cutting with a stainless-steel blade. These methodologies yielded particles of varying sizes and shapes. The MP sizes were between 315 µm and 5 mm, thereby ensuring the protocol’s applicability to large microplastics.
Self-made MPs were spiked manually in organic fertiliser sub-samples (i.e., 20 organic matrices, with one replicate each). To facilitate data statistics and analysis, as well as to observe trends with a realistic workload, 33 particles of each polymer were added into each sub-sample, making a total of 99 MP/sample of 10 g dry weight. The spiked plastic particles utilised in these experiments were readily identifiable by colour (bright red for PE; light grey for PVC) or shape (film for PLA-PBAT). Following the completion of the extraction process, this methodology enabled the spiked microplastics to be distinguished from those initially present in the organic matrix, sometimes at extremely high levels. Consequently, the challenge was sometimes to locate the spiked microplastics within a multitude of microplastics—ranging from tens to hundreds—that were initially present in the sample.

2.3.2. Sample Pre-Treatment

Sample Storage and Drying

Liquid or wet samples (e.g., liquid sludge, catering waste pulp, liquid fraction of digestate, bovine and porcine slurry) were stored within a refrigerator set at a temperature of 4 °C ± 2 °C to limit microbial development. Conversely, solid or dry samples (e.g., compost, green waste mesh, solid digestate, bovine and porcine faeces), which are less fermentable, were stored at ambient temperatures. Given the substantial number and volume of samples requiring drying, it was determined that oven drying represented the optimal solution. This approach facilitates the concurrent drying of multiple samples. Consequently, we dismissed alternative technical methodologies, including freeze-drying, which, while highly effective, necessitates a sample-by-sample approach. The experimental design involved the collection of approximately 5 kg per sample, followed by blending and drying in a laboratory oven set at 53 °C ± 1 °C (UN110, Memmert, Germany). This temperature was selected to ensure optimal drying while minimising damage to biodegradable plastics (i.e., the glass transition temperature of PLA is 60 °C) [32]. Samples were then left to dry under these conditions until the weight stabilised (i.e., one week to five or six weeks for the most water-rich ones).

Dry and Wet Sieving

Once the drying process was complete, a dry sieving procedure was carried out on a Ø 200 mm stainless steel sieve column with mesh sizes of 2 mm and 50 µm. The 2–5 mm sieve fraction was preserved for direct analysis under a binocular loupe. The sieve fraction under 50 µm was retained but was not analysed as part of this study. The fraction between 50 µm and 2 mm was divided into quarters to constitute a homogenised subsample of 10 g, as is traditionally used in method publications [25,33]. A wet sieving procedure was then carried out to remove clays and silts. The subsample was then dried again in the oven at 53 °C ± 1 °C, in order to avoid dilution of reagents during chemical digestion.

Chemical Digestion

The density of organic matter, especially soil organic matter (SOM), is comparable to that of most of plastic polymers (density range: 0.9–1.6 g·cm−3) [34,35]. Thus, density separation is only capable of removing a portion of the organic matter, necessitating an additional step of organic matter (OM) digestion [36]. To purify the subsamples and facilitate microplastic observation and characterisation, chemical digestion was performed [27,37]. This step involved the removal of organic matter using hydrogen peroxide (H2O2, 30% (w/v) in water, Fisher Chemical™, Pittsburgh, PA, USA). The subsample was heated (53 °C) and agitated (between 120 and 200 rpm) (Isotemp™ hot plate with magnetic stirrer; Fisherbrand™, Waltham, MA, USA), and the reagent was regularly added to the solution for 48 h. The volume of reagent utilised was an average of 147 ± 35 mL for 10 g d.w. of matrix. Then, the subsample underwent vacuum filtration to remove water, reagent residues, and any residuals from the finest fraction of organic matter (under 50 µm). The chemical digestion was carried out twice. The subsample was finally recovered in a 50 mL centrifuge tube (Falcon™, Thermo Scientific™, Waltham, MA, USA) and dried until the mass stabilised (a few days).

2.3.3. MP Extraction

Density Separation and MP Recovery

Once the subsample was dry, a solution of sodium iodide (NaI, Sodium Iodide, 99+%, Extra Pure, SLR, Fisher Chemical™, Pittsburgh, PA, USA) with a minimal density of 1.60 g·cm−3 was added into each Falcon™, vortexed for 15 s, and left to decant for a minimum of 12 h. This step was challenging due to the density similarity between soil organic matter (SOM, 1.0 < ρ < 1.6 g·cm−3) and the tested polymers’ density (0.88–1.38 g·cm−3) [11,25,34,36]. The duration required for the microplastic to reach the surface was found to vary between half a day and several days. After this step, the Falcon™ tube was placed in a laboratory freezer set at −80 °C ± 1 °C for a duration of 3 to 4 h, with the objective of achieving complete solidification.
The NaI ice surface was then melted by applying a gentle spray of distilled water, and deposited into a Büchner funnel (vacuum-filtration system, Welch diaphragm pump 8 mbar). To ensure a maximum MP recovery, the steps of vortexing, decanting, and extraction were repeated twice for each subsample.

Microplastics Extraction Rate

Petri dishes containing MP were photographed under HAVOX® LED lighting (HPB-40XD photo studio; HAVOX, Vendome, France) with a D850 Nikon® camera (AF-S VR Micro-Nikkor 105 mm f/2.8 G IF-ED lens; Nikon, Tokyo, Japan) coupled with digiCamControl software v2.1.6. PVC, PE and PLA-PBAT particles were then counted for every sample. The following equation was used to calculate the microplastic extraction rate:
M P   e x t r a c t i o n   r a t e = n b   M P   r e c o v e r e d n b   M P   a d d e d 100
U n d i g e s t e d   m a t e r i a l = m f i n a l m i n i t i a l 100
The extraction rate was calculated for each type of polymer and for all subsamples. The results were then summarised in terms of chemical nature (i.e., PE, PVC, PLA/PBAT) and matrix types (i.e., digestate, compost, WWTP sludge, livestock manure, greenwaste, and pulp).

2.4. Microplastics Identification and Characterisation

The surface and shape of laboratory plastics were characterised by photographing in order to assess MP integrity. At the microparticle scale, the surfaces of nine microplastics (three each from PVC, PE and PLA-PBAT, selected randomly for each matrix type) were initially analysed under a binocular magnifier (Motic SMZ-171 with an integrated camera Moticam 1080, coupled with Motic Image Plus v3.0 software; Motic, Xiamen, China), and then analysed using scanning electron microscopy (SEM JSM-IT500HR, JEOL, Tokyo, Japan).
To observe changes induced by the protocol in the infrared spectrum, chemical identification was achieved with a Fourier transformed infrared spectroscope with an attenuated total reflectance prism (ATR-FTIR Vertex70v; Bruker, Billerica, MA, USA). Thus, PVC, PE and PLA-PBAT spiked particles (i.e., 1960 microp Completed according to available data lastics) were characterised before and after treatment. All spectra were recorded in the 4000–600 cm−1 region in the absorption mode with a resolution of 4 cm−1 and 16 scans. Each piece of plastic was placed onto the germanium crystal (ATR Golden Gate; Bruker, Billerica, MA, USA). After each analysis, the sample holder was meticulously cleaned with ethanol. The spectral baseline was corrected with Spectragryph© v1.2 software.
R 4.3.1 software was used for data processing and statistical analysis. Kruskal−Wallis tests and Dunn’s tests were performed to identify potentially significant differences (significance level of 0.05) in extraction rates or residual matter recovery as a function of the organic waste products [38,39]. The design of these figures was finalized using Adobe Illustrator CS6.

2.5. Contamination Prevention

The sampling tools employed in this study were fabricated from materials such as glass, metal, wood and cotton. This approach was adopted with the objective of minimising the contamination of the samples by plastic particles. Additionally, the first 20 centimetres of matrix depth were excluded from sampling in order to prevent any airborne contamination. In an effort to mitigate the occurrence of cross-contamination, all plastic containers were banned from the protocol. In their stead, glassware and stainless-steel utensils were employed, with the exception of Falcon™ centrifuge tubes, which were utilised for the purpose of density separation. Prior to use, laboratory materials were subjected to a cleaning process involving compressed air, while following use, they were washed with distilled water and a stainless-steel sponge. Glass conservation boxes (for drying) and beakers containing samples were coated with aluminium foils wherever possible. The majority of the protocol steps were carried out under the protection of a laboratory extractor hood. Moreover, the experimenter wore a cotton laboratory coat to avoid contamination by textile fibers (polyester, polyamide…). Laboratory blanks (distilled water) accompanied the subsamples groups, from sieving to the microplastics’ final extraction, in order to check for potential plastic contamination. Finally, those blanks were analysed using FPA-FTIR (Perkin Elmer Spotlight 400 imaging system). The results obtained revealed an average contamination level of 1.8 ± 1.4 particles per 50 g sample analysed, i.e., contamination of the order of 35.2 ± 27.1 MP/kg DW. Of these particles, 80% were identified as PET fibres, with an average length of 704 µm. It is important to note that these blank values, which are frequently several orders of magnitude lower than the abundance of microplastics present in the matrices, have not been subtracted from the results presented in the a posteriori analysis section.

2.6. A Posteriori Analysis

2.6.1. Materials

This a posteriori analysis was carried out using data that were available at the conclusion of the project. These consist of multiple sets of data relating in particular to the abundance in number, mass and chemical nature of microplastics, the implications of which will be presented subsequently in a separate publication. Nevertheless, without going into detail, it is possible to use the abundance in number to estimate recovery rates a posteriori. These data were obtained from duplicates of the 83 samples (N = 166 subsamples). This methodology enables the enhancement of results obtained by spiking, through the augmentation of the studied matrices’ variety and the incorporation of duplicates. The extraction and analysis method broadly follows that presented above, with the difference that sub-samples of 50 g rather than 10 g were studied. The a posteriori analysis is predicated on the data regarding the identification of a total of 45,620 microplastics (FPA-FTIR Perkin Elmer Spotlight 400 imaging system; Database: SIMPLE; raw data: Supplementary Data). It is important to note that these microplastics are not spiked microplastics; these microplastics were present in the matrices at the time of the sampling.

2.6.2. Recovery Rate

Given the exponential increase in the number of particles with decreasing size, a problem arises when comparing abundance or concentration data for microplastics obtained over different size ranges. Based on a large amount of high-quality data, a new approach to correcting this type of bias has been developed in recent years [40,41]. This approach involves the calculation of an adimensional correction factor (CF). This correction factor is then multiplied by the measured number abundance (Cmeas) to calculate the rescaled abundance (Cenv) for a given microplastic size range,
C e n v = C F × C m e a s
As part of our work, we propose to use this concept for the estimation of extraction rates. This proposal is based on the hypothesis that for specific size classes, the extraction and identification rates approach 100%. In the context of the present study, the experimental findings on spiking demonstrated that for the size classes ranging 500–1000 and 1000–2000 µm, extraction and identification rates did indeed approach this condition. Based on these two size classes, the dimensionless correction factor (CF) was first calculated,
C F = x 2 D 1 α L x 1 D 1 α L x 2 M 1 α L x 1 M 1 α L
Here, x1D = 50 µm, x2D = 5000 µm, and x1M and x2M are, respectively, the lower and upper values of a given size range (e.g., x1M = 1000 and x2M = 2000 µm for the 1000–2000 µm). For αL, a value of 2.54 was calculated for sewage sludges by Kooi and colleagues [41]. From our data set (all categories combined), a value of 2.34 was obtained. Nevertheless, the calculation method used (by successive iteration) was less robust than that employed by Kooi and colleagues. Finally, as these two values of αL were relatively close, the one determined by Kooi and colleagues was deemed more suitable for our calculations. This approach enabled the determination of CF[500–1000] = 52.8, and CF[1000–2000] = 153.5 (Table 1). From these coefficients, two estimates of corrected abundance (Cenv) for the size range 50–5000 µm were then calculated for each chemical category using Equation (4). For all organic waste products (OWPs), the mean value of the ratio of the two Cenv estimates obtained was 1.06 ± 0.33. This finding suggests that, for these two size categories, the model proposed by Koelmans and colleagues offers an effective approximation of the measured abundances (Cmeas). Finally, the CF of each size range was divided by the Cenv value for each OWP category. The distribution of microplastic abundance according to different size classes, based on the distribution law proposed by Koelmans and colleagues, was thus determined for each of the OWP categories. These theoretical distributions were then compared with those recovered, and the extraction rate (in %) was deduced.

2.7. Confidence Interval

In the case of studies on microplastics, the confidence interval (CI) is used, for example, to determine the interval within which the proportion (p) of a given polymer within a population of microplastics (N) is contained. This CI is generally expressed as follows:
C I α 2 = p ± u 1 α 2 p 1 P n N n N 1
In the context of the present study, the number (N) of microplastics present in the samples was not known. The proportions of chemical natures (p) were estimated on the basis of a sub-population of size (n) corresponding to the number of microplastics recovered (i.e., extracted and analysed). As the calculations were carried out within a general framework, a value of p = 0.5 was used in order to calculate the most conservative CI values possible. Considering all these aspects, it was possible to simplify the equation as follows:
C I α 2 = p ± u 1 α 2 0.25 n
Here, u 1 α 2 is the fractal of order α of the standardized normal law. It is common to take 95% as the degree of confidence (i.e., α = 0.05; u 1 α 2 = 1.96 ). CI results were then expressed as a percentage.

3. Results

3.1. Spiked Microplastics: Extraction Rate and Organic Matter Recovery

The average MP recovery rate was 97.9 ± 3.7%, with all samples and matrices combined (Figure 1A). It was observed that half of the samples had an extraction rate of 99.0% or more. Among the 20 samples, the minimum overall extraction rate was 84.9% (deconditioning pulp), and the maximum (100%) rate was achieved for over a third of them (8 samples). The MP recovery rate reached 100%—or was close to—for three types of matrix: green waste (100%), manure (100%) and sewage sludge (99.5 ± 0.7%) (Figure 1B). For compost category, the average extraction rate was 98.7 ± 1.4%. For this latter, one compost sample exceeded 100%, reaching 102.0% (35 PLA-PBAT microparticles instead of 33), which could be indicative of either particle degradation or the recovery of foreign microplastics. In the digestate category, the extraction rate was found to be 97.4 ± 2.9%. Despite these observed differences, statistical tests indicated no statistically significant differences (p = 0.23).
On average, for all samples combined, the amount of matrix (i.e., organic and inorganic particles and microplastics present prior to sample spiking) remaining on filters after the entire treatment process was 4.2%. Thus, approximatively 95.8% of the initial matrix was eliminated during the experiment, thanks to both the chemical digestion and the density separation steps (Figure 1C). Half of the sample showed less than 3.3% residual material remaining, which may include organic and mineral content. However, two outliers appeared, with approximatively 10.7% and 13.1% of undigested material remaining in two samples—one compost and one digestate. The digestion protocol was found to be the most effective for the green waste category, with a residual material proportion of about 1.34%, indicating that almost all the organic matter was discarded (Figure 1D). The sample purification protocol also proved to be highly effective for manure samples, with a recovery of approximatively 2% of residual material, and for sewage sludge and bio-waste unpackaging pulps, with a recovery of around 4%. The compost and digestate categories exhibited more variable results, involving a greater number of samples (n = 7 for each category). The analysis of the compost samples indicated that they constituted the most challenging matrix to digest, with an average value that was the highest among all categories. In particular, it was noted that half of the samples exhibited between 5% and 10.7% of undigested material remaining subsequent to chemical digestion. However, no statistically significant difference was observed (p = 0.29).

3.2. Evaluation of the Degradation of the Spiked Micoplastics

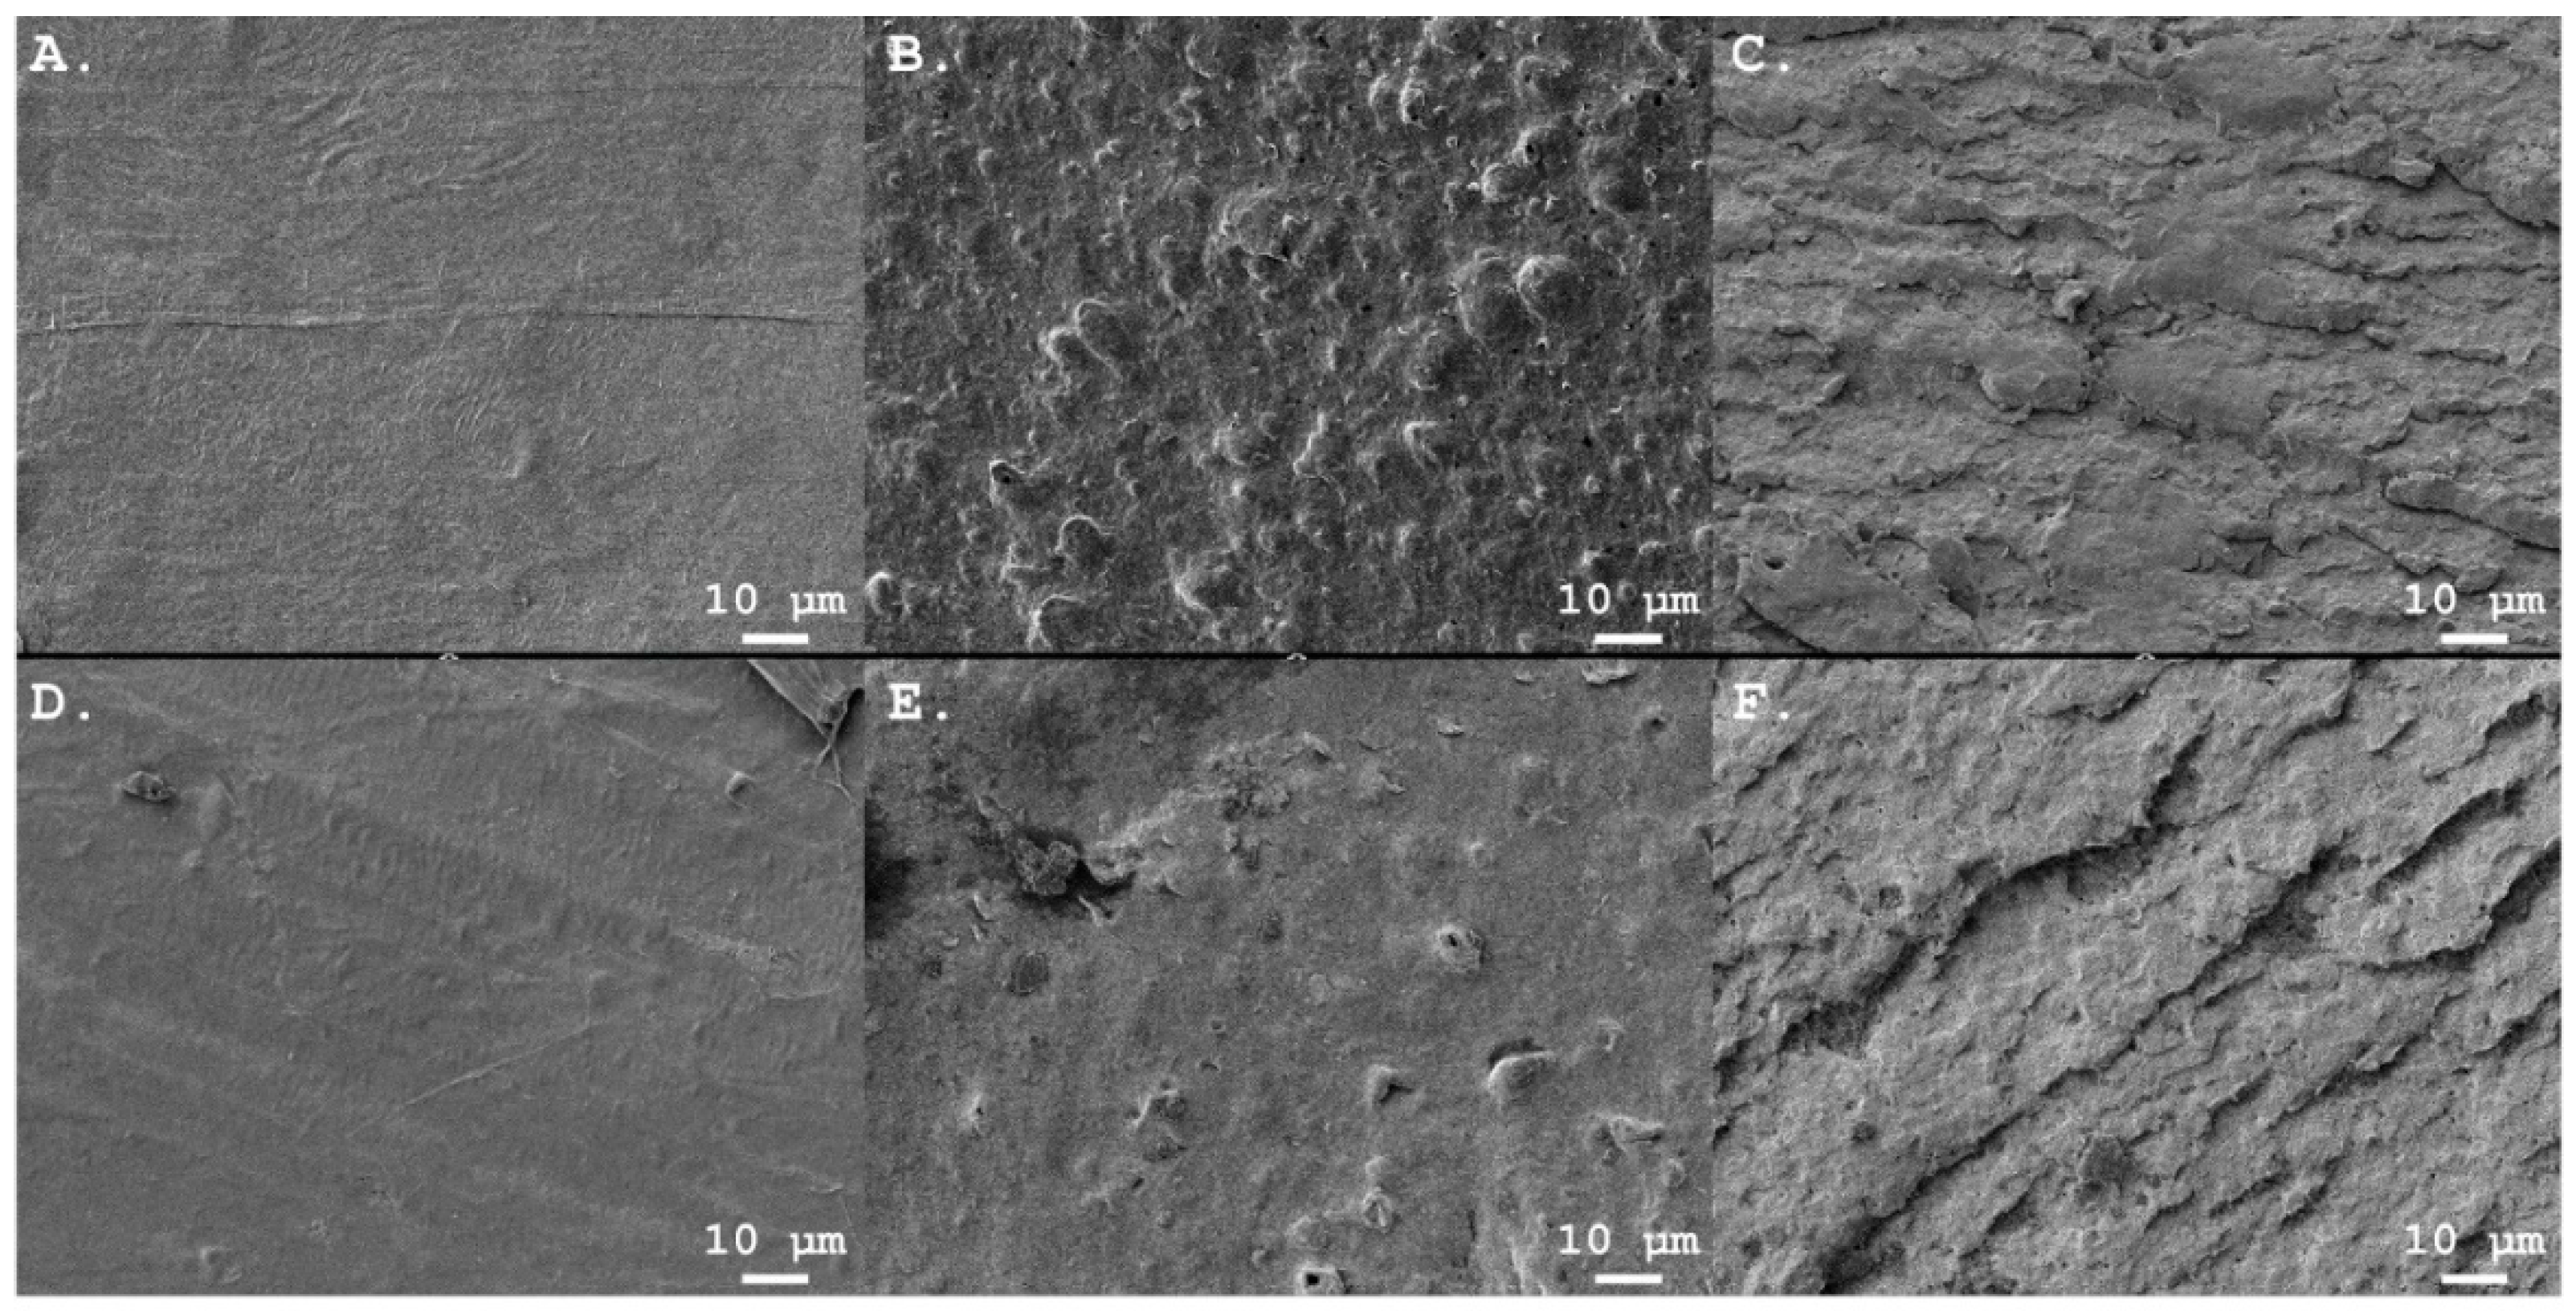
3.2.1. Microplastic Shape and Surface

Prior to chemical treatment, certain surface microstructures, including very thin filaments, were observed during cryo-grinding procedures performed on PE microplastics (Supplementary Materials, Figure S1). Hand-cut PLA-PBAT particles exhibited a stretched appearance, accompanied by tapered or even ripped edges. Additionally, shredding marks and tiny filaments or debris were also observed on the surfaces of PVC microplastics. Following treatment, minor alterations in MP appearance were documented. Nevertheless, the majority of the smallest debris and filaments disappeared from the surfaces of PE and PVC particles during handling. In contrast, PLA-PBAT mulch films exhibited cleaner, smoother edges. Additionally, these films exhibited a propensity for self-rolling. It was observed that some PVC microplastics underwent a slight discolouration; however, this phenomenon was not systematically recorded. A small amount of organic matter was frequently observed on the surface of the spiked MP. PE, PVC and PLA-PBAT microplastics were identifiable, and seemed to keep the same overall shape, size and colour following chemical treatment.
With regard to the surface of the particles, no holes or cracks were observed in SEM images of the surfaces of spiked microplastics before treatment (Figure 2). The surfaces of PE particles were found to be notably smooth (Figure 2A), smoother than PVC particles (Figure 2C). Some irregular structures were observed on the surfaces of PLA-PBAT films (Figure 2B). After treatment, no cracks or holes were observed on any of the surfaces of the three polymers. For PE particles, a more stretched or irregular appearance was reported in this photograph, but these subtle modifications were not systematic (Figure 2D). Minor changes were also observed for the SEM images of PLA-PBAT microplastics, which exhibited a slightly smoother surface (Figure 2E). In the case of PVC, no discernible change was observed, and the surface structures remained indistinguishable from those of spiked PVC (Figure 2F). Consequently, after analysing these results, there was no evidence of major microplastic degradation following the protocol applied in this study, even for biodegradable plastic.

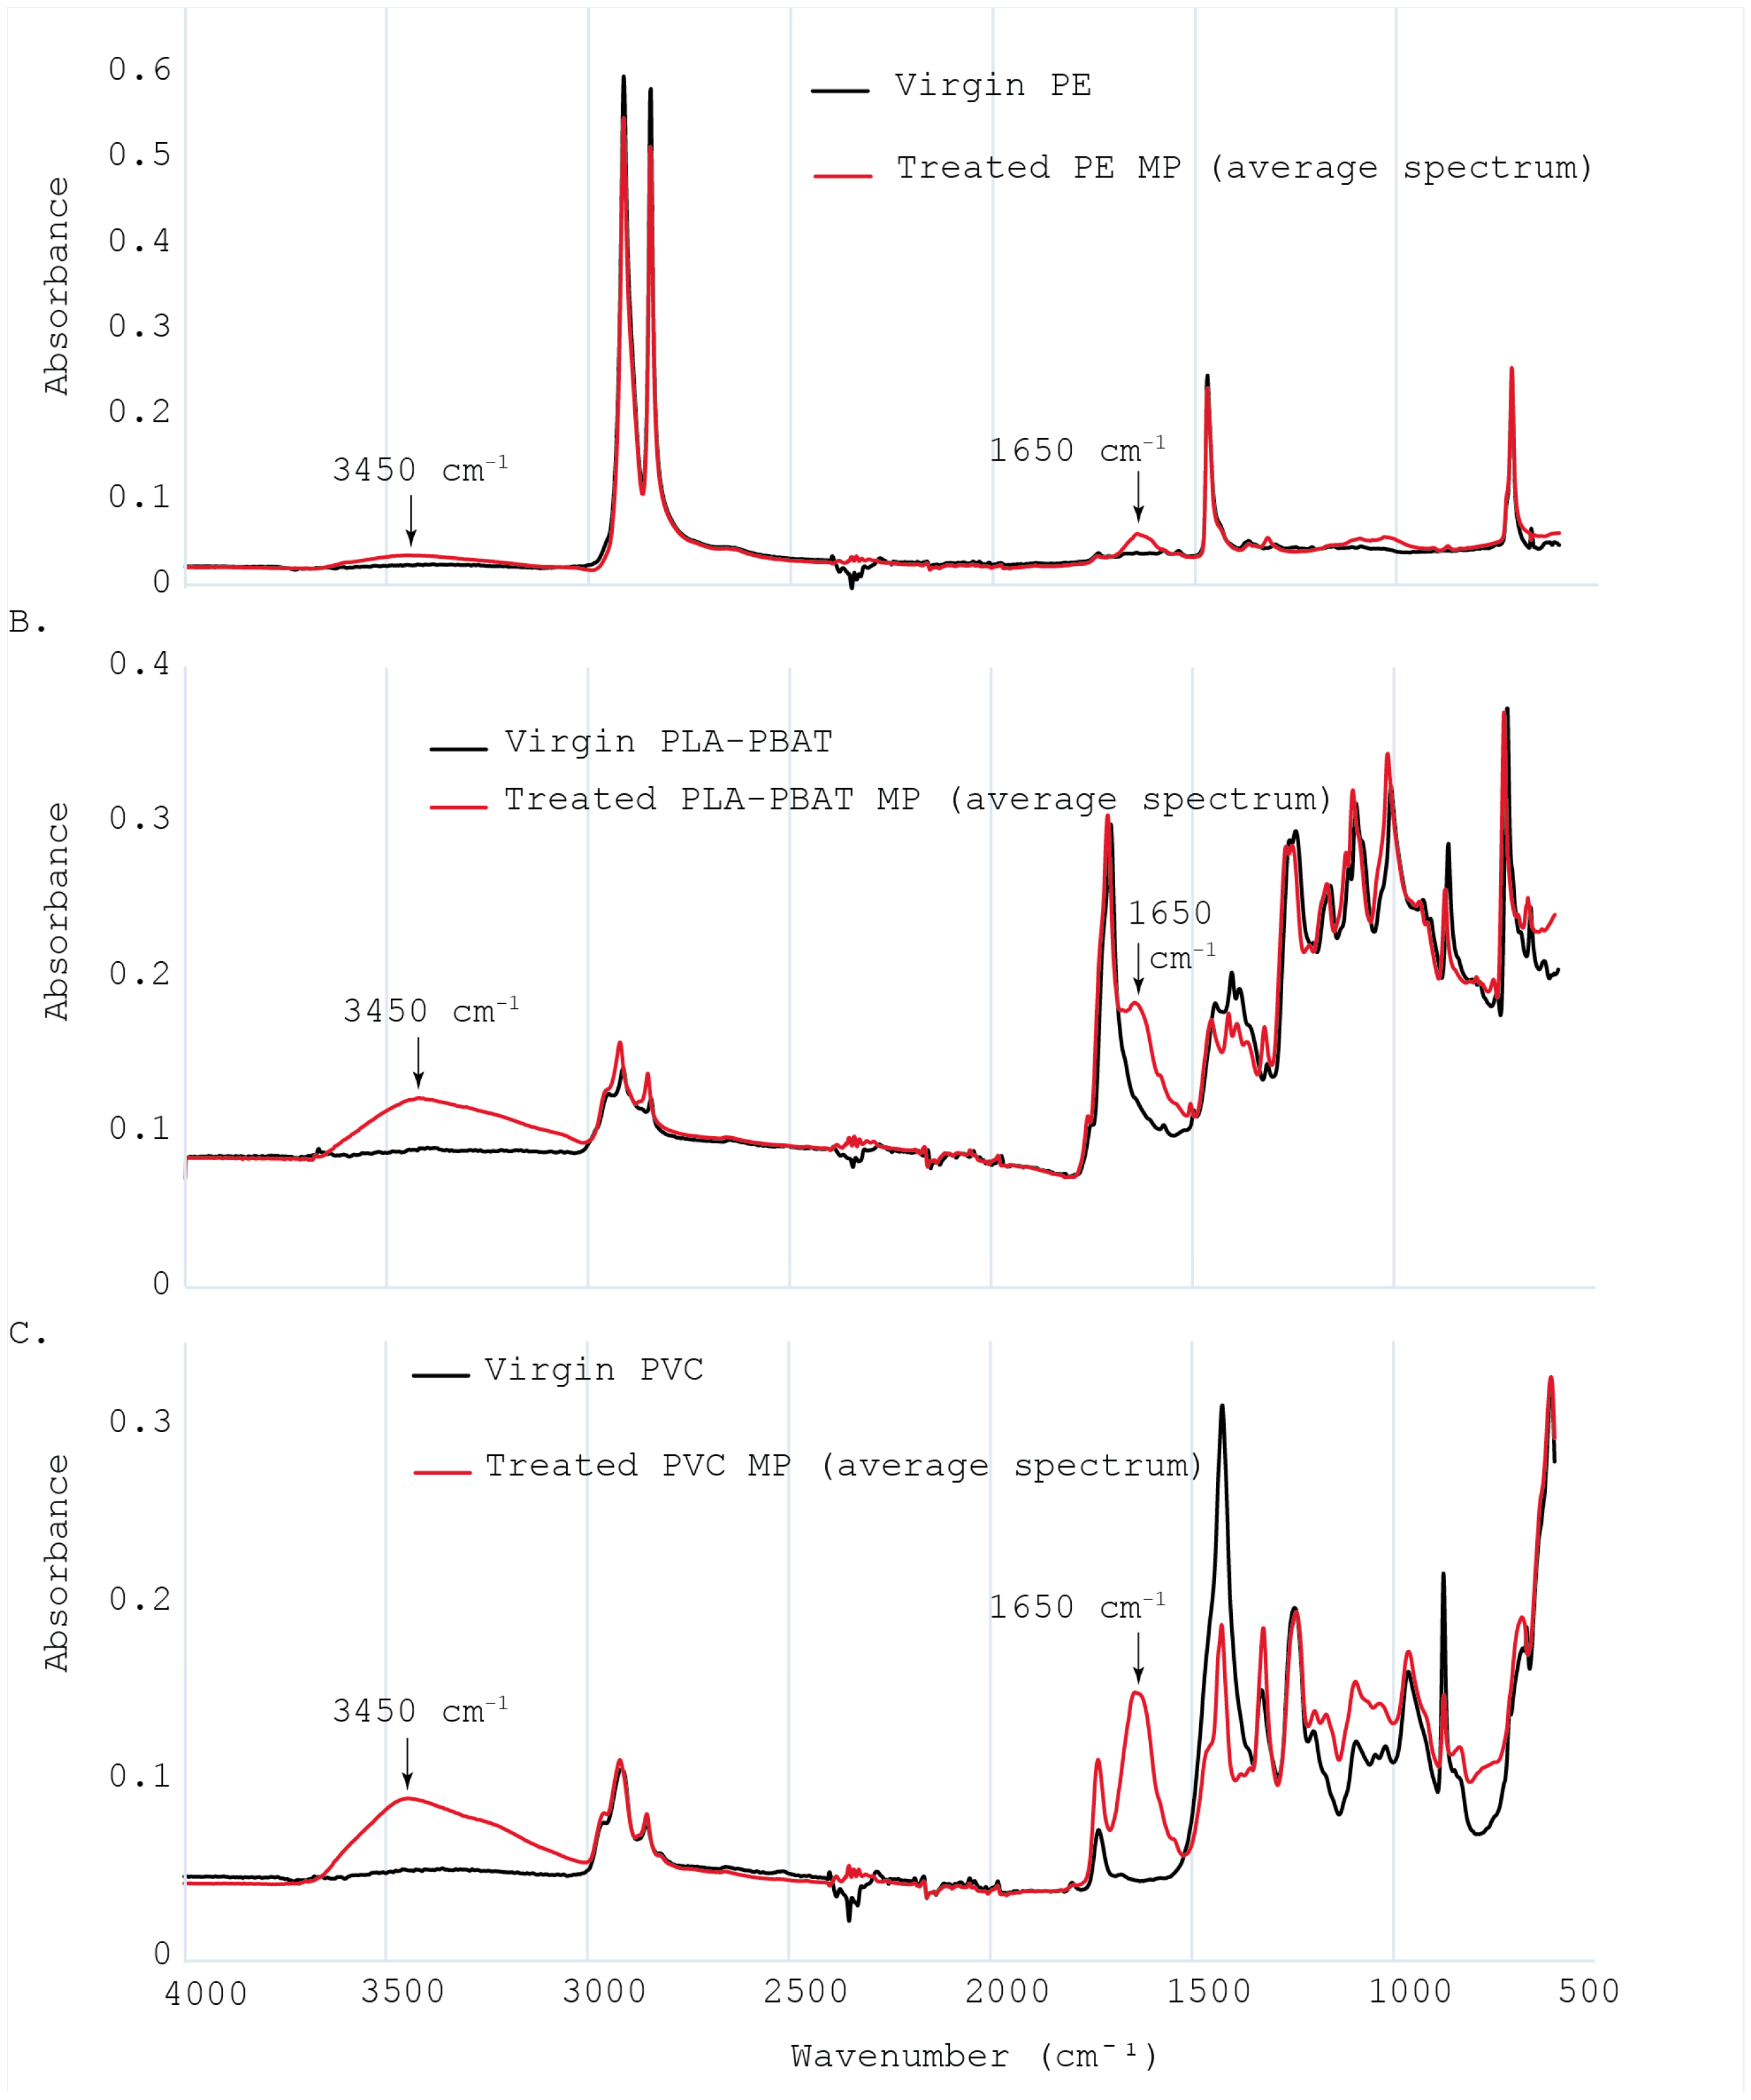
3.2.2. Microplastics Chemical Analysis

Slight chemical modifications of the polymers could be identified by FTIR after the extraction step (Figure 3), as illustrated by the appearance of two new main bands (3450 cm−1, 1650 cm−1). These two bands were assigned to oxygen groups (e.g., OH bonds) [42]. The potential mechanisms behind this include MP oxidation during H2O2 treatment and the presence of OM on the surface of the microplastics. In the case of PVC, signal intensity attenuations were observed for two peaks (1430 cm−1 and 880 cm−1). This finding suggests a more substantial alteration of the polymer chains on the surfaces of the PVC samples. Nevertheless, despite these slight modifications to the FTIR spectra, they remained largely interpretable, and the chemical nature of the microplastics could be readily identified.

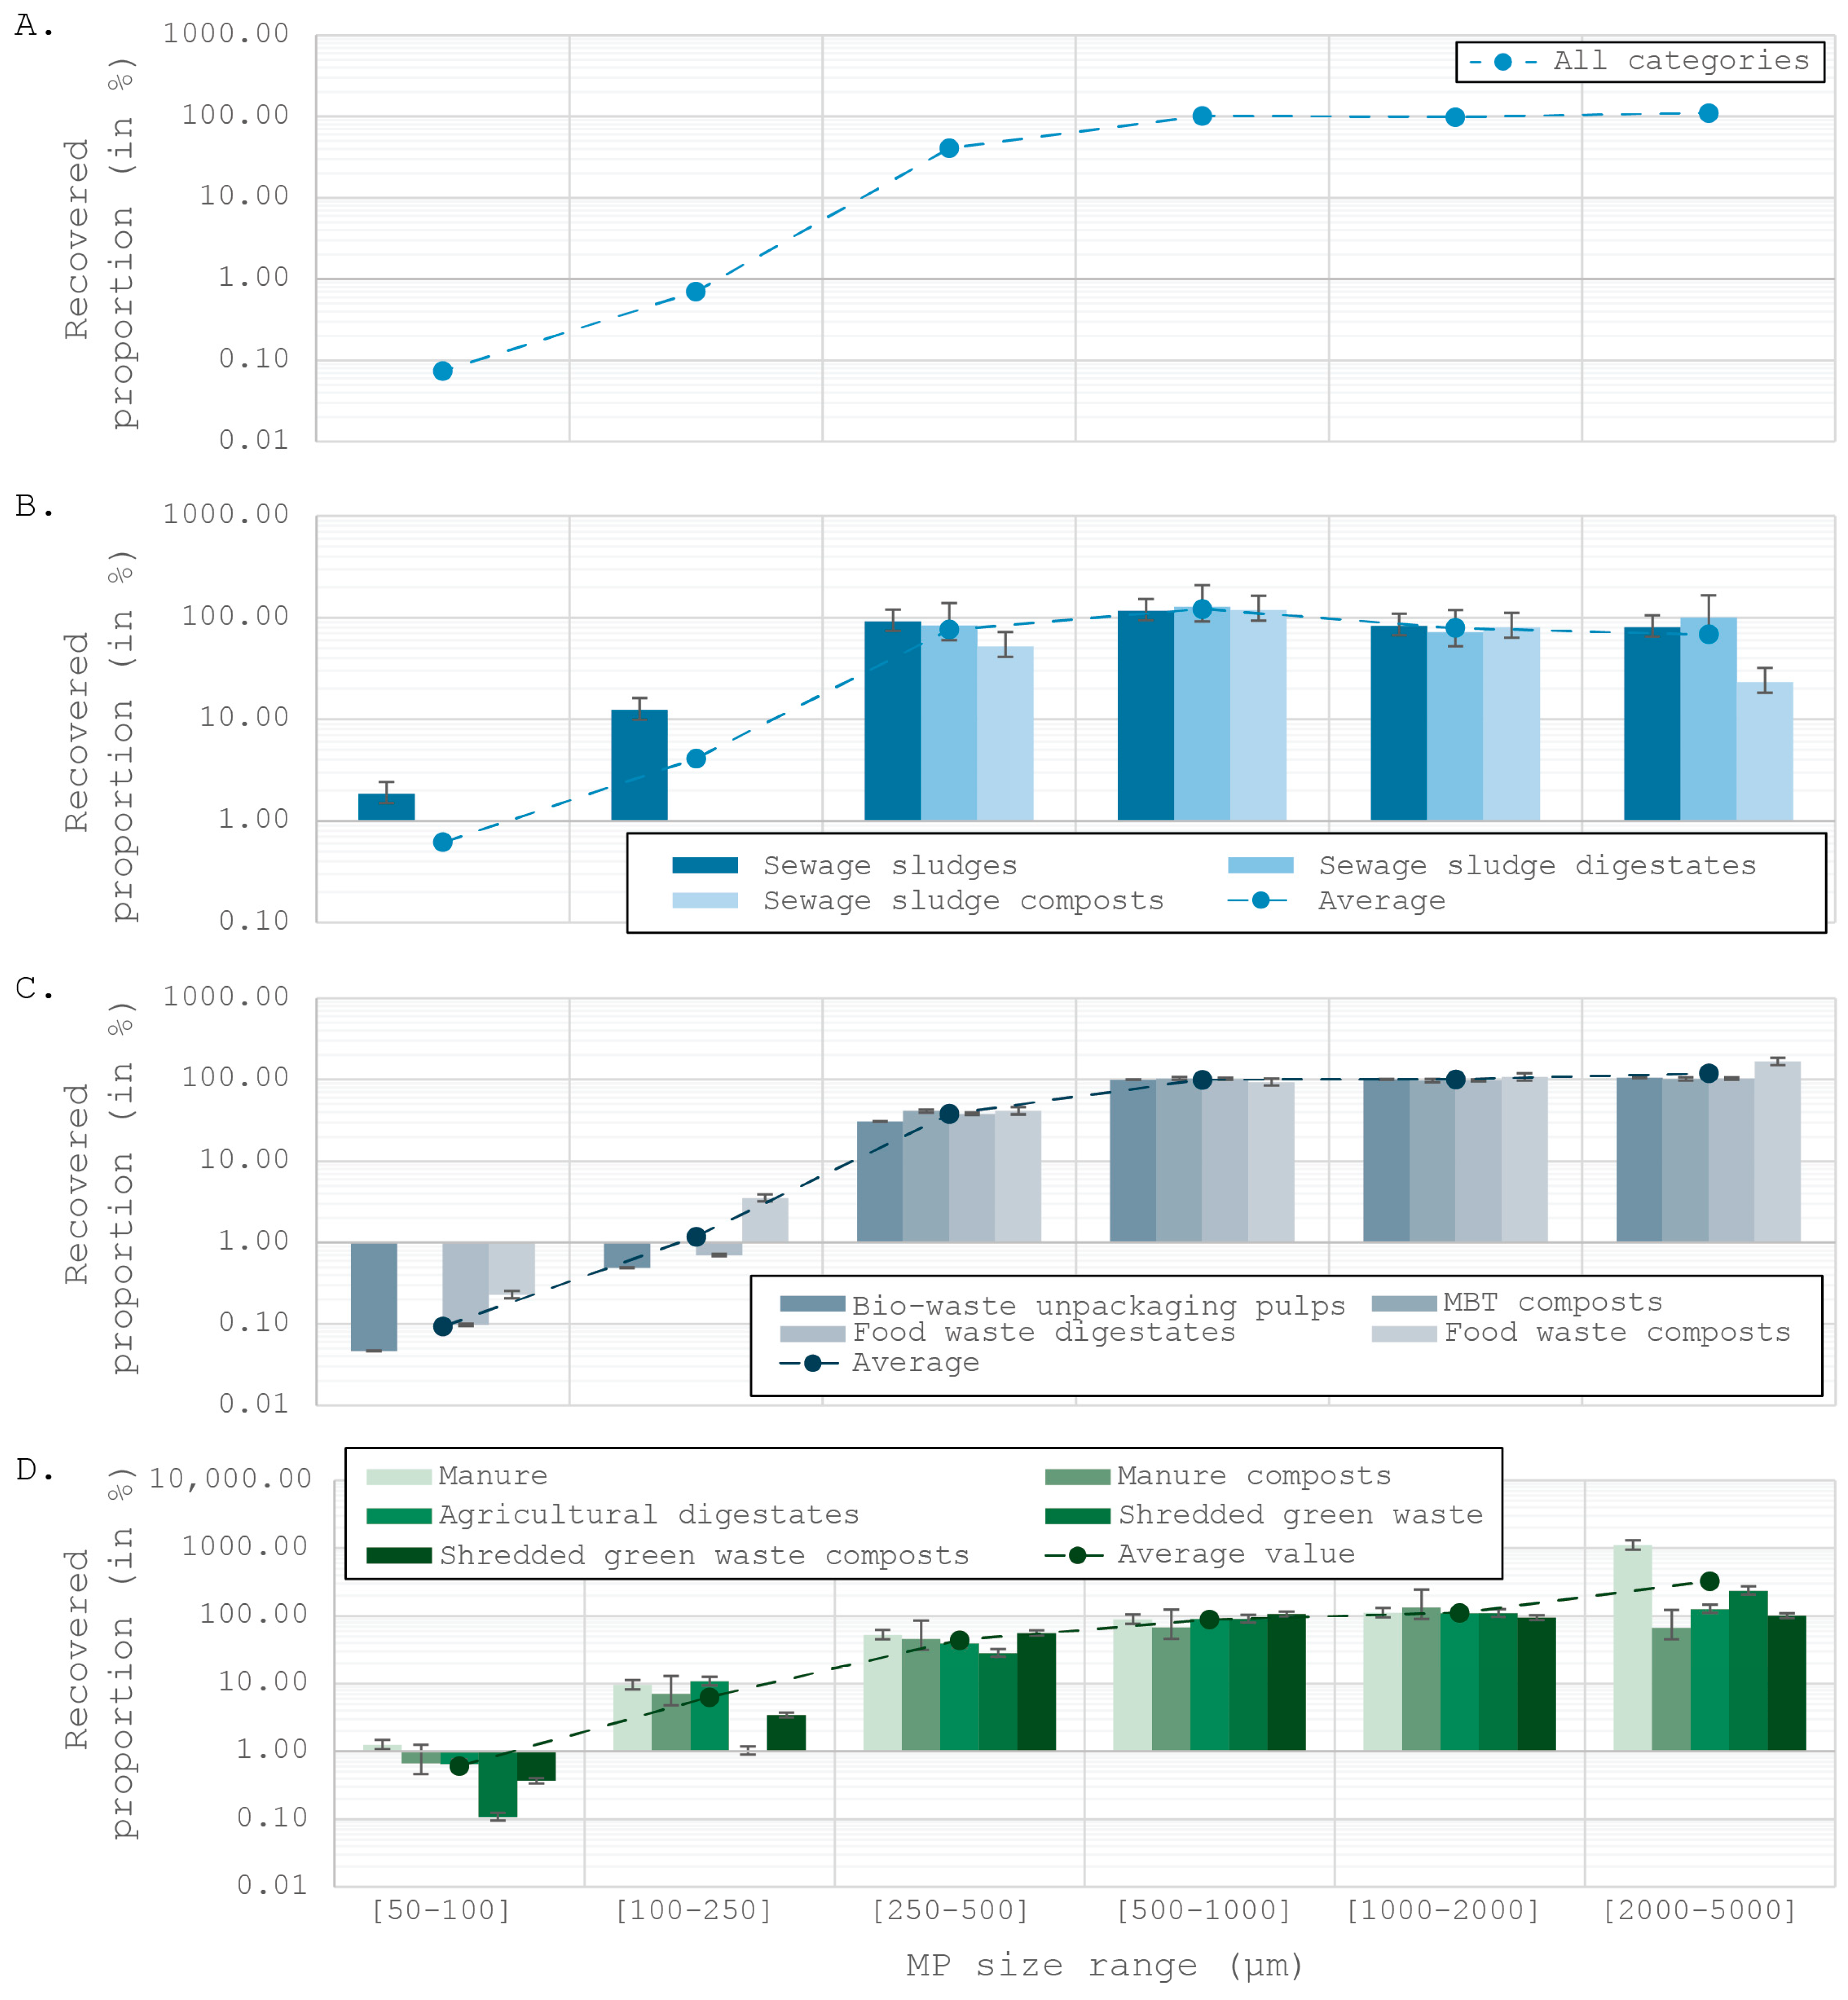
3.3. A Posteriori Analysis of Results

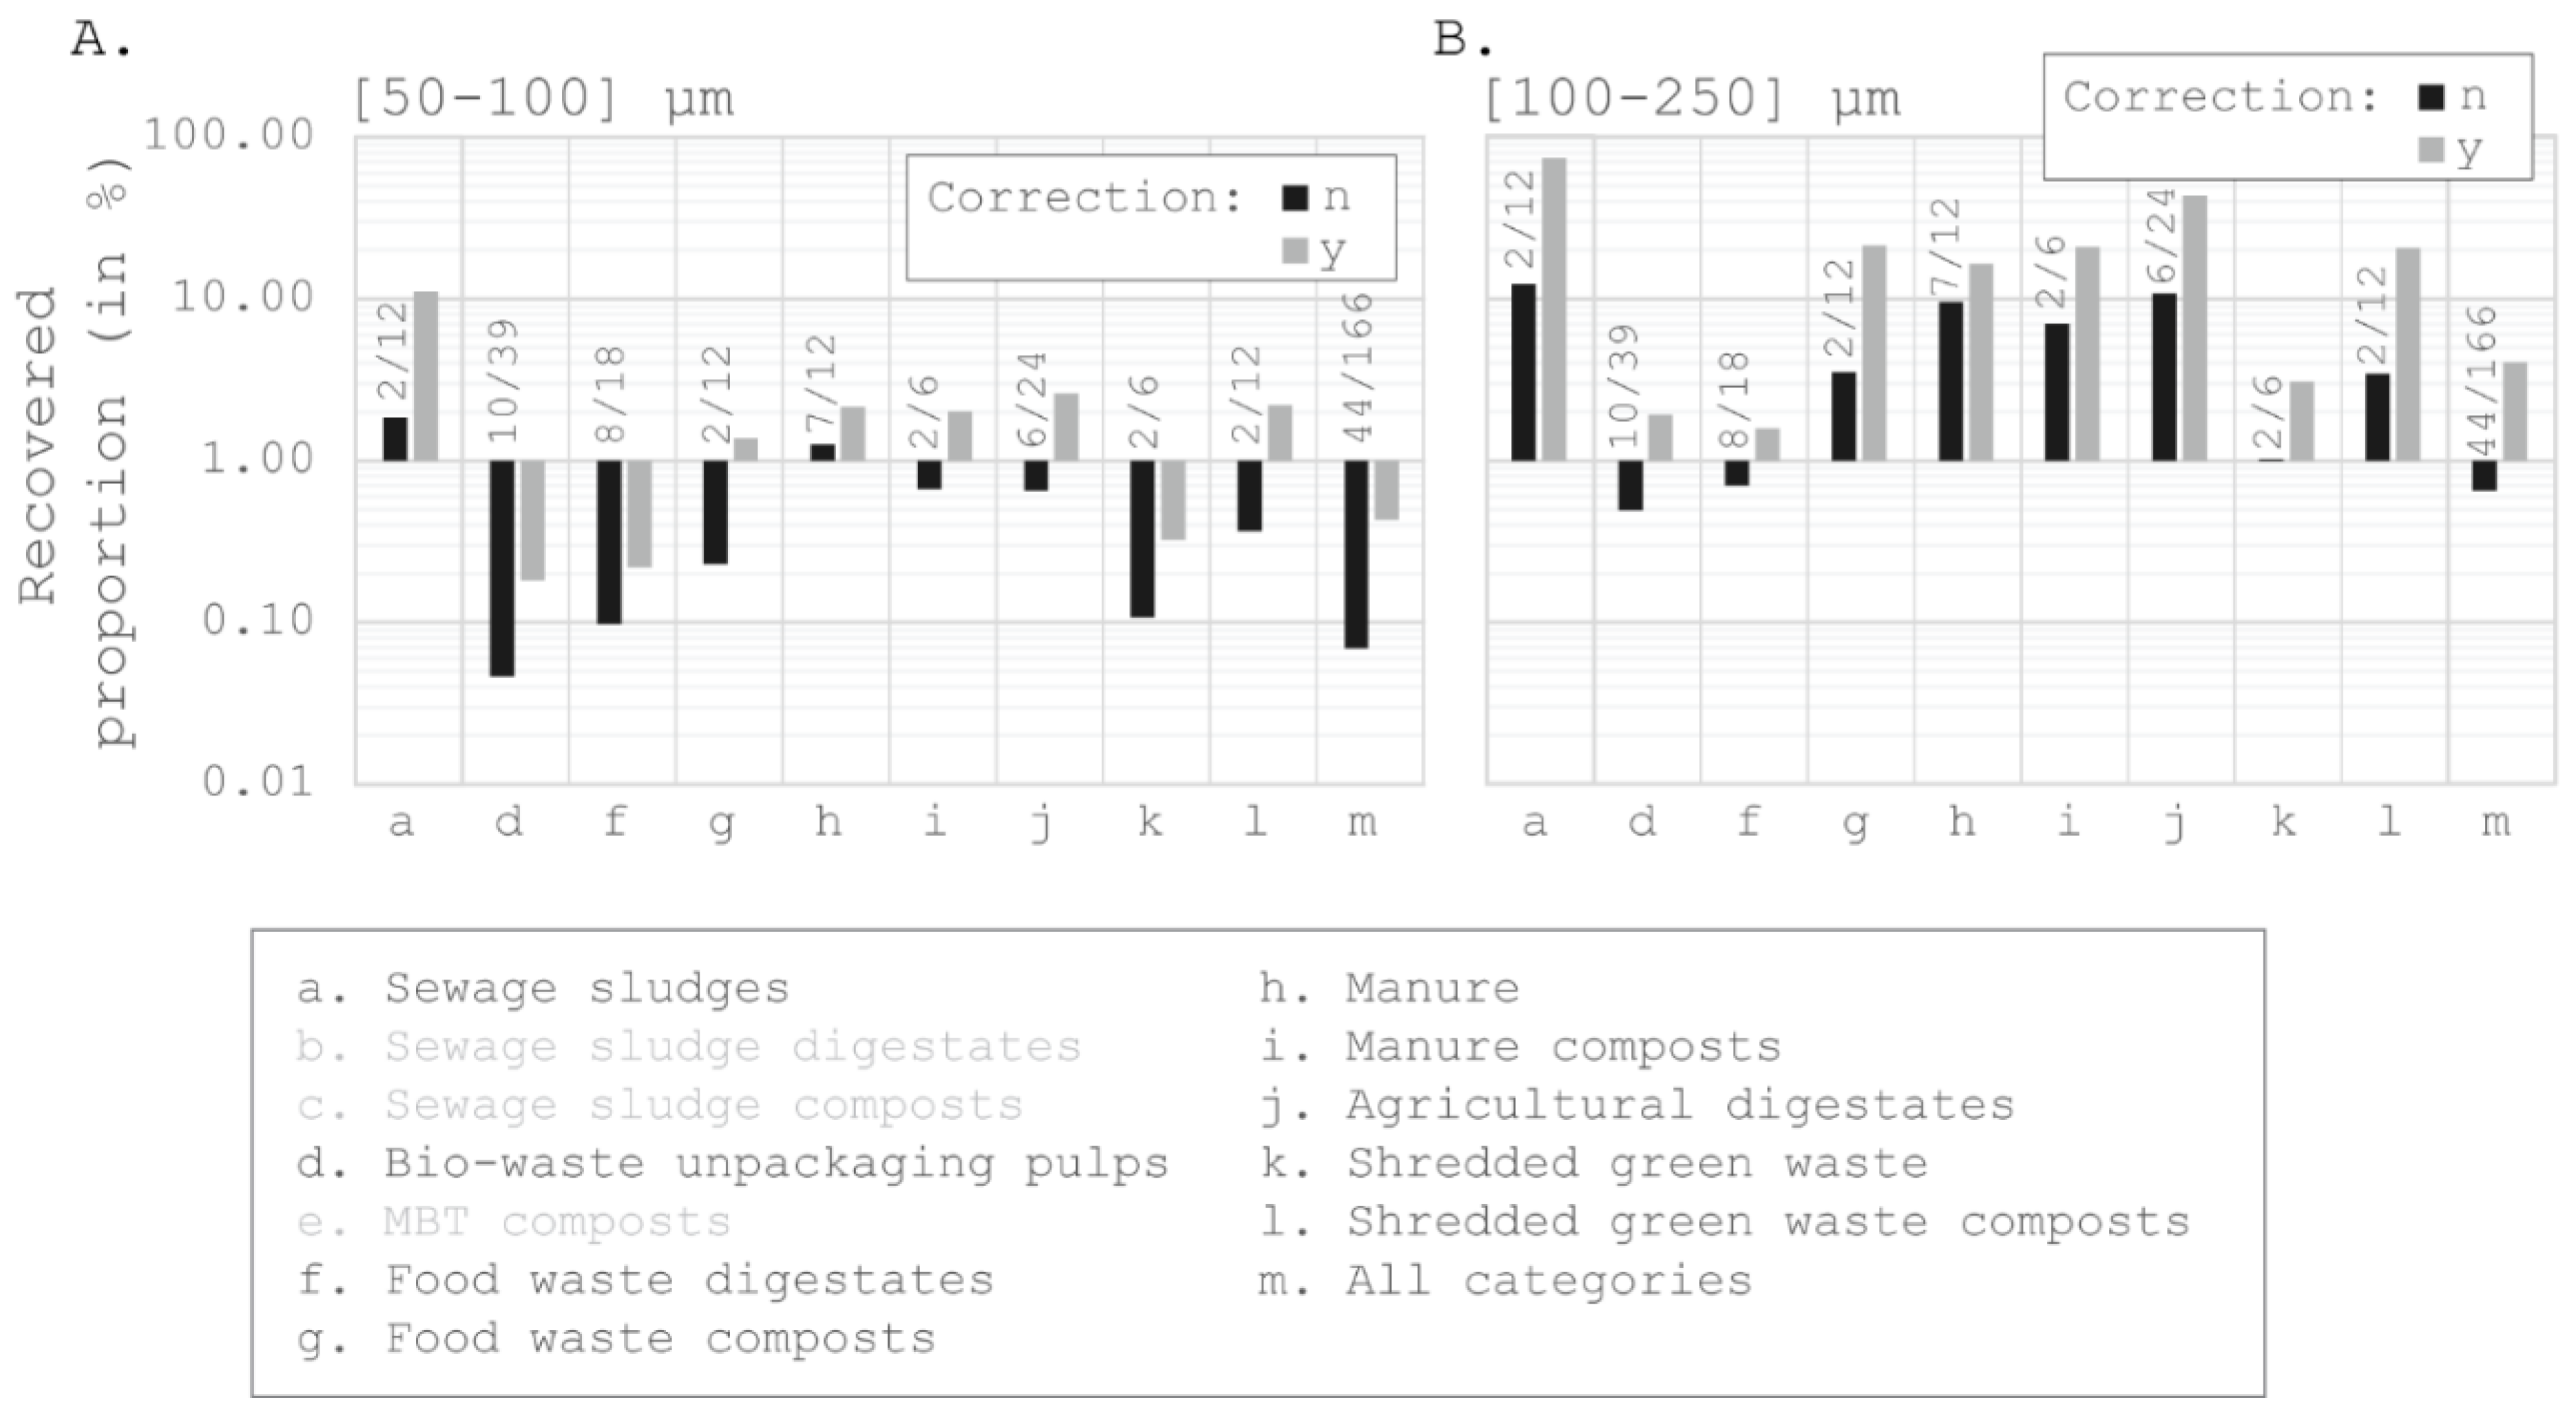
Estimating the Microplastic Recovery

The results for the proportion of recovery as a function of MP size categories all demonstrate the same pattern overall (Figure 4; Table S3). First, for the size categories 500–1000, 1000–2000 and 2000–5000 µm and whatever the OWP category, the recovered proportion values approached 100%. This observation is in line with theoretical expectations, since the two size categories 500–1000 and 1000–2000 µm were used as a reference for calculating the distribution of microplastics. However, the extraction rate decreased rapidly from the 250–500 µm size category onwards, with a recovered proportion of merely 37.9%. Finally, for the 50–100 and 100–250 µm size categories, the recovered proportions were only 0.07% and 0.7%, respectively. Despite the observed similarity in the patterns across the different OWP categories (i.e., theoretical recovered proportion close to 100 between 500 and 5000 µm, with a significant decrease below 250 µm), when looking closely, a contrasting situation was observed (Figure 4A). For the WWTP sludge category, recovery was notably higher than the overall average, with rates of approximatively 1.9% (50–100 µm), 12.3% (100–250 µm) and 91.7% (250–500 µm) (Figure 4B). Conversely, digestates and composts from WWTP sludge, as well as MBT composts, did not facilitate the recovery of MP for the 50–100 and 100–250 µm size categories (Figure 4A,C). Finally, it can be noted that the recovered proportions were slightly better overall for OWP of agricultural origin (Figure 4D) in comparison to OWP from treated sewage sludge (Figure 4B) or from food waste (Figure 4C).
Obviously, in instances where the analysis of filters was not feasible for of the 50–100 and 100–250 µm size ranges, the enumeration of microplastics in these two size ranges was necessarily underestimated. For these two size ranges, 88 filters out of 332 were analysed by FPA-FTIR (Figure 5). In detail, for sewage sludge, 4 filters out of 24 were analysed. For food waste samples, 20 filters out of 78 from bio-waste packaging pulps, 16 filters out of 36 from food waste digestates and 4 filters out of 24 from food waste composts were analysed. Finally, in the case of samples relating to agricultural waste, for example, 14 filters out of 24 were analysed for raw manure samples, and 12 out of 48 filters in the case of agricultural digestate samples.
The analysis of the smallest fraction filters proved challenging, primarily due to the substantial presence of particles (i.e., microplastics and undigested organic matter) at the filter’s surface. This discrepancy between the theoretical values calculated according to the equations of Koelmans et al. and the values measured by FPA-FTIR is partly explained by this factor. In this context, it is interesting to note that when employing proportionality, it is possible to propose a correction that approximates the number of microplastics if all the filters could have been analysed (on the sole condition that at least one filter per size category was analysed). The calculations carried out increased the recovered proportion from 0.6 to 2.5% for the 50–100 µm size category (Figure 5A) and from 5.4% to 22.56% for the 100–250 µm range (Figure 5B). Thus, although an important number of filters were impossible to study, this fact alone does not seem sufficient to explain the observed discrepancy between the findings of the present FPA-FTIR analysis results and the values calculated using the equation proposed by Koelmans and colleagues.
Notwithstanding the challenges encountered in the analysis of certain filters, over 45,000 microplastics, encompassing a wide range of sizes and OWP categories, were analysed by FPA-FTIR. The resulting confidence interval was calculated accordingly. For all aggregated data, the confidence interval was found to be less than p ± 0.5% (Figure 6A; Tables S4 and S5). When separated by size category, the confidence intervals range from p ± 0.8% (500–1000 µm) to p ± 3.8% (2000–5000 µm). The aggregated data for OWP related raw WWTP sludge, digestate and compost showed values of p ± 1.9%, p ± 2.6% and p ± 4.7%, respectively (Figure 6B). This phenomenon can be attributed to the enhanced rarity of microplastics within this size range. When the data were separated according to the different size ranges, it was not possible to achieve confidence interval values ≤ 5%. For the particle size category 1000–5000 µm, it was also not possible to ensure confidence intervals of p ≤ 10% (Figure 6C). For OWP derived from food waste, the confidence intervals for all size categories combined were between p ± 0.8% (MBT composts) and p ± 2.0% (food waste composts). When the calculations were separated according to the different size categories, it was confirmed that these results have a confidence interval of less than p ± 10% and sometimes even p ± 5% (bio-waste unpackaging pulps and MBT composts). Finally, for agricultural waste, the quantities of microplastics recovered were generally lower, resulting in generally higher interval values (Figure 6D). When all size categories were considered collectively, the confidence intervals ranged from p ± 2.6% (agricultural digestates) to p ± 7.2% (shredded green waste). It is important to note that the inclusion of size categories in the analysis led to increases in the confidence intervals, with values frequently exceeding p ± 10%, particularly in the categories of shredded green waste, shredded green waste composts, manure and manure composts.

4. Discussion

4.1. The Spiking Method: An a Priori Approach for Assessing Microplastic Extraction Rates

The selection of the reagent is a pivotal factor in both the prevention of microplastic degradation and the promotion of the removal of organic matter [25,26,33]. The use of H2O2 has been proposed as a possible approach in the scientific literature. However, the effectiveness of this approach in digesting a large number of categories of organic waste by rigorously following the same protocol remains to be elucidated. Furthermore, the potential for extracting biodegradable polymers based on PLA-PBAT, which is increasingly used in agriculture, remains to be elucidated.

4.1.1. Microplastic Recovery

A primary outcome of this research is the demonstration that an extraction rate of over 90% is achieved for microplastics with a diameter greater than 300 µm and for the majority of the matrices examined. Of the three plastics tested, PLA-PBAT appears to be the most challenging to extract from the diverse matrices used in this study. This type of polymer demonstrates minimal alteration in response to degradation, as evidenced by experiments with matrices such as sewage sludge or soils employing digestion protocols analogous to those utilized in our study [43,44]. Contrary to our initial hypothesis, the observed difficulty in extracting this biodegradable polymer was not attributable to MP fragmentation during the digestion step. The results suggest that the shape of the particles, rather than their chemical nature, is a more significant factor in this regard. This represents a novel development, as the majority of tests on plastic particles are conducted on fragments rather than films [45]. The PLA-PBAT tested in this study was a plastic mulch film with a thickness of 14 µm, and it was particularly flexible. The ability of PLA-PBAT fragments to roll up on themselves has been observed, and this phenomenon could contribute to a lower extraction efficiency, as a reduced surface area would allow them to pass through the sieve mesh.
In general, microplastic degradation during the digestion stage is minimal, and is even undetectable with the analysis techniques used in our study for microplastics larger than 300 µm. The potential impact of a broader spectrum of microplastic chemical compositions on the heterogeneity of degradation levels warrants further investigation. For instance, in loamy soils, it has been documented that of the polymers tested, PS and PA fragments were the most sensitive to 1-day H2O2 treatment [25]. However, these findings were obtained at higher temperatures than those used in our protocol (i.e., 60 °C and 70 °C compared to a maximum of 53 °C in our case). Finally, damage to non-laboratory microplastics may also be underestimated in the present protocol, due to the higher sensitivity of aged MP caused by weathering [25,37,46,47]. Consequently, it is conceivable that PLA-PBAT films present in compost, for instance, could undergo substantially greater alterations during the extraction process. Finally, residues of organic matter did not exert a detrimental influence on the efficacy of the extraction process or the identification’s success. With regard to the latter, the microplastic spectra were still well identified and well characterised after the whole chemical treatment process, including heating, stirring and reagent stages.

4.1.2. Residues from the Matrix

The residual material at the end of the digestion process was generally of the order of 4% of the initial sample mass, which is consistent with the findings reported in the extant scientific literature [46]. For loamy soil, Hurley and colleagues reported an organic matter removal rate between 96 and 108% with H2O2 treatment for one day at temperatures of 60 °C and 70 °C, respectively [25]. In the case of organic soil improvers, an organic matter removal rate of between 80 and 87% was reported with H2O2 treatment for one day on sewage sludges at 60 °C and 70 °C, respectively [25]. For sewage sludges, an organic matter recovery efficiency of 87% and 84% was achieved by digesting sludge with H2O2 treatment at room temperature (overnight) and 50 °C (24 h), respectively [33].
The residues consisted mainly of organic matter and native microplastics (i.e., present in the matrix at the time of sampling). For natural organic residues, it is well established in the scientific literature that certain organic materials commonly found in complex environmental matrices, such as chitin, cannot be completely degraded by H2O2 treatment [23]. In some cases, such as unpackaging pulps, the amount of residue was higher than 10%, partly due to the large amount of native microplastics in these matrices. The presence of these native microplastics was expected, as the aim of the project was to quantify them in order to estimate stocks and flows. Nevertheless, the extent of the contamination in certain matrices was significantly underestimated, thereby introducing a recovery bias. Consequently, the loss of spiked microplastics can be partly attributed to their inability to be distinguished from the substantial number of native microplastics also extracted.

4.1.3. Consequences of These Results for the Project

The main original features of the study included the evaluation of a diverse array of complex organic matrices and the investigation of the extractability of biodegradable polymers under these conditions. These tests were necessary before carrying out the study of stocks and flows of microplastics. The a priori experimental results were deemed adequate to justify the systematic implementation of this protocol throughout the project. However, during the course of the project, certain difficulties were encountered with smaller fractions (between 50 µm and 250 µm). The majority of the filters were reported to be clogged with organic matter, resulting in poorer recovery and an underestimation of small microplastics. While the a priori analysis of recovery rates provides clear results for microplastics larger than 250 µm, the a posteriori analysis of project data also furnished highly complementary information. This a posteriori estimation of extraction rates is the second major contribution of this study.

4.2. An Original Approach: A Posteriori Estimation of Extraction Rates

4.2.1. An Underestimated Number of Microplastics

For fractions exceeding 250 µm, no discernible distinction was observed between the various OWP categories. The reliability of the extraction rates is evident in both spiking tests and in the reanalysis of results obtained at the project’s conclusion, irrespective of the OWP category analysed. Consequently, the extraction protocol appears to be more dependent on the size range studied than on the nature of the matrix. Conversely, for size ranges below 250 µm, the a posteriori analysis of the results reveals a divergent trend. Organic matrices derived from agricultural products (e.g., manure, agricultural digestates, green waste) appear to be more readily extractable than those derived from food waste (e.g., food waste digestates and composts, biowaste unpackaging pulps, MBT composts). The latter category demonstrates a high degree of variability with regard to organic matter sources, in terms of both type and proportion, across different sites and over time. This variability could be a contributing factor in relation to the observed decrease in extraction efficiency. Consequently, it is necessary to concentrate effort on enhancing the protocol for these fractions. Conventional solutions, such as the implementation of enzymatic attacks, hold considerable potential in overcoming the limitations identified in this study. However, the constraints inherent in our project (the large number of samples needed to develop a protocol that is as uniform as possible for all samples) did not allow us to improve the digestion of this residual material.
Whatever the matrix studied, the general pattern remains broadly the same, exhibiting a decline in the 50–100 and 100–250 µm size ranges. At this juncture, three explanations seem possible. Firstly, it is possible that the smallest microplastics were destroyed during the digestion phase. However, this hypothesis appears improbable when considering the experimental results and extant scientific literature, which indicate that polymers are highly resistant to digestion [48,49]. This hypothesis should not be discounted, as different types of alterations can occur in microplastics during the various stages of on-site treatment of organic waste. These alterations are likely to render the microplastics more brittle. It is also conceivable that this loss of microplastics is related to problems inherent in the FPA-FTIR method for detecting microplastics. For example, the overlapping of microplastics by other particles or the presence of adjacent particles of the same chemical nature are cases in which the analytical tools reach their limits. Finally, it is possible that the smallest size fractions deviate from the theoretical model. However, at this stage, there is no evidence to support this proposition. Although it is challenging to determine the relative contributions of these different factors, it is plausible that they may have varied degrees of influence on the observed discrepancy.

4.2.2. Implications of This Gap

The question must therefore be posed: is this a serious problem? To some extent, yes, as these results imply that a significant amount of information concerning the smallest microplastics, particularly with regard to their number, is being lost. However, this information can be estimated using the equations developed by Koelmans and colleagues. This approach is predicated on the assumption that the recovery rate for the largest size fractions (i.e., 500–5000 µm) has been verified, as was the case in our study. This loss of information does not necessarily have an impact when studying the chemical nature of the polymer. The reliability of the findings regarding these parameters depends on the absolute number of microplastics analysed. In the context of our study, this number of particles is generally sufficient to ensure the attainment of results with confidence intervals of typically less than 10%, and in certain instances, even less than 5%. This implies that for the smallest size ranges, where the number of microplastics analysed is very high (i.e., often several hundred to several thousand), it is possible to obtain reliable results on the chemical nature despite a low recovery rate. These statistical approaches, which are relatively simple to implement, could help to obtain more homogeneous data sets despite heterogeneous protocols, and also facilitate the comparison of different protocols based on the re-analysis of existing data sets.

5. Conclusions

The present study evaluated a protocol for extracting microplastics of various natures (bio and non-biodegradable polymers), shapes and sizes from different organic waste products. The a priori approach yielded a microplastic extraction rate of 98% (size range: 300–5000 µm), along with a 96% rate for OM removal. It was observed that the extraction process did not result in any substantial damage to the microplastics. The minor alterations observed in the FTIR spectra did not compromise polymer identification using an ATR-FTIR spectroscope. Subsequently, the extraction protocol was applied to a set of over 180 samples. An original a posteriori analysis was applied to these results. This analysis revealed that, in comparison with the selected model, the recovery rate exhibited a pronounced decline for microplastics with a diameter less than 250 µm. While this is a drawback, it does not prevent the use of the results obtained.
In conclusion, at the end of the project, the protocol evaluated met most of the the project’s expectations. Notably, the protocol enabled the comprehensive investigation of all samples within the stipulated project timeline. It also allowed the observation of biodegradable polymers in certain samples. Conversely, the efficacy of the extraction protocol for microplastics is more equivocal. The method appears to be optimally suited to the study of microplastics with a diameter of up to 250 µm; however, its efficacy is reduced for particles smaller than this threshold. Consequently, the extraction protocol efficiency would be less matrix-dependent than size-dependent. Finally, this work also highlights the value of the a posteriori analysis of recovery rates. This approach will now be used routinely in our future research on organic waste products to estimate potential gaps in microplastics extraction.

Supplementary Materials

The following supporting information can be downloaded at: https://www.mdpi.com/article/10.3390/environments12050143/s1, Table S1: Metadata of the 20 samples; Table S2: General physico-chemical characteristics of the polymers used in the study; Table S3: Estimation of the quantified proportion by matrix category and by particle size range; Table S4: Number of microplastics analyzed during the project by matrix category and by particle size range; Table S5: Confidence intervals by matrix category and size range; Figure S1: Shape and surface details of some PE (red), PLA-PBAT (black), and PVC (grey) virgin microplastics before treatment (A) and after treatment (B and C).

Author Contributions

Conceptualization, D.C.B. and M.K.; methodology, M.K.; software, M.K.; validation, D.C.B. and M.K.; formal analysis, D.C.B. and M.K.; investigation, D.C.B., M.S., A.M., V.Y., G.D., S.G., A.C., A.E., S.M. and Z.Y.-C.; resources, N.M., N.T. and D.C.B.; data curation, D.C.B.; writing—original draft preparation, D.C.B., M.S. and M.K.; writing—review and editing, S.B., A.C., N.T. and N.M.; visualization, D.C.B., M.S. and M.K.; supervision, M.K.; project administration, N.M., N.T., A.C. and M.K.; funding acquisition, I.D. All authors have read and agreed to the published version of the manuscript.

Funding

This work was supported by the French Ecological Transition Agency (ADEME) [PRO project, grant n° 2020MA000106].

Data Availability Statement

The datasets presented in this article are not readily available because the data are part of an ongoing study. Requests to access the datasets should be directed to Mikaël Kedzierski (Corresponding author).

Conflicts of Interest

The authors declare no conflicts of interest.

References

  1. Dignac, M.-F.; Houot, S.; Francou, C.; Derenne, S. Pyrolytic Study of Compost and Waste Organic Matter. Org. Geochem. 2005, 36, 1054–1071. [Google Scholar] [CrossRef]
  2. Braun, M.; Mail, M.; Heyse, R.; Amelung, W. Plastic in Compost: Prevalence and Potential Input into Agricultural and Horticultural Soils. Sci. Total Environ. 2021, 760, 143335. [Google Scholar] [CrossRef] [PubMed]
  3. Braun, M.; Mail, M.; Krupp, A.E.; Amelung, W. Microplastic Contamination of Soil: Are Input Pathways by Compost Overridden by Littering? Sci. Total Environ. 2023, 855, 158889. [Google Scholar] [CrossRef]
  4. Hargreaves, J.; Adl, M.; Warman, P. A Review of the Use of Composted Municipal Solid Waste in Agriculture. Agric. Ecosyst. Environ. 2008, 123, 1–14. [Google Scholar] [CrossRef]
  5. Diacono, M.; Montemurro, F. Long-Term Effects of Organic Amendments on Soil Fertility. A Review. Agron. Sustain. Dev. 2010, 30, 401–422. [Google Scholar] [CrossRef]
  6. Weithmann, N.; Möller, J.N.; Löder, M.G.J.; Piehl, S.; Laforsch, C.; Freitag, R. Organic Fertilizer as a Vehicle for the Entry of Microplastic into the Environment. Sci. Adv. 2018, 4, eaap8060. [Google Scholar] [CrossRef]
  7. Rillig, M.C. Microplastic in Terrestrial Ecosystems and the Soil? Environ. Sci. Technol. 2012, 46, 6453–6454. [Google Scholar] [CrossRef] [PubMed]
  8. Steinmetz, Z.; Wollmann, C.; Schaefer, M.; Buchmann, C.; David, J.; Tröger, J.; Muñoz, K.; Frör, O.; Schaumann, G.E. Plastic Mulching in Agriculture. Trading Short-Term Agronomic Benefits for Long-Term Soil Degradation? Sci. Total Environ. 2016, 550, 690–705. [Google Scholar] [CrossRef]
  9. Horton, A.A.; Walton, A.; Spurgeon, D.J.; Lahive, E.; Svendsen, C. Microplastics in Freshwater and Terrestrial Environments: Evaluating the Current Understanding to Identify the Knowledge Gaps and Future Research Priorities. Sci. Total Environ. 2017, 586, 127–141. [Google Scholar] [CrossRef]
  10. Ng, E.-L.; Huerta Lwanga, E.; Eldridge, S.M.; Johnston, P.; Hu, H.-W.; Geissen, V.; Chen, D. An Overview of Microplastic and Nanoplastic Pollution in Agroecosystems. Sci. Total Environ. 2018, 627, 1377–1388. [Google Scholar] [CrossRef]
  11. Bläsing, M.; Amelung, W. Plastics in Soil: Analytical Methods and Possible Sources. Sci. Total Environ. 2018, 612, 422–435. [Google Scholar] [CrossRef] [PubMed]
  12. Watteau, F.; Dignac, M.-F.; Bouchard, A.; Revallier, A.; Houot, S. Microplastic Detection in Soil Amended With Municipal Solid Waste Composts as Revealed by Transmission Electronic Microscopy and Pyrolysis/GC/MS. Front. Sustain. Food Syst. 2018, 2, 81. [Google Scholar] [CrossRef]
  13. Crossman, J.; Hurley, R.R.; Futter, M.; Nizzetto, L. Transfer and Transport of Microplastics from Biosolids to Agricultural Soils and the Wider Environment. Sci. Total Environ. 2020, 724, 138334. [Google Scholar] [CrossRef] [PubMed]
  14. Van Schothorst, B.; Beriot, N.; Huerta Lwanga, E.; Geissen, V. Sources of Light Density Microplastic Related to Two Agricultural Practices: The Use of Compost and Plastic Mulch. Environments 2021, 8, 36. [Google Scholar] [CrossRef]
  15. Yang, L.; Zhang, Y.; Kang, S.; Wang, Z.; Wu, C. Microplastics in Soil: A Review on Methods, Occurrence, Sources, and Potential Risk. Sci. Total Environ. 2021, 780, 146546. [Google Scholar] [CrossRef] [PubMed]
  16. Huang, Y.; Liu, Q.; Jia, W.; Yan, C.; Wang, J. Agricultural Plastic Mulching as a Source of Microplastics in the Terrestrial Environment. Environ. Pollut. 2020, 260, 114096. [Google Scholar] [CrossRef]
  17. Steinmetz, Z.; Löffler, P.; Eichhöfer, S.; David, J.; Muñoz, K.; Schaumann, G.E. Are Agricultural Plastic Covers a Source of Plastic Debris in Soil? A First Screening Study. SOIL 2022, 8, 31–47. [Google Scholar] [CrossRef]
  18. Khalid, N.; Aqeel, M.; Noman, A.; Fatima Rizvi, Z. Impact of Plastic Mulching as a Major Source of Microplastics in Agroecosystems. J. Hazard. Mater. 2023, 445, 130455. [Google Scholar] [CrossRef]
  19. Accinelli, C.; Saccà, M.L.; Mencarelli, M.; Vicari, A. Deterioration of Bioplastic Carrier Bags in the Environment and Assessment of a New Recycling Alternative. Chemosphere 2012, 89, 136–143. [Google Scholar] [CrossRef]
  20. Accinelli, C.; Abbas, H.K.; Bruno, V.; Khambhati, V.H.; Little, N.S.; Bellaloui, N.; Shier, W.T. Field Studies on the Deterioration of Microplastic Films from Ultra-Thin Compostable Bags in Soil. J. Environ. Manag. 2022, 305, 114407. [Google Scholar] [CrossRef]
  21. Rani, M.; Ducoli, S.; Depero, L.E.; Prica, M.; Tubić, A.; Ademovic, Z.; Morrison, L.; Federici, S. A Complete Guide to Extraction Methods of Microplastics from Complex Environmental Matrices. Molecules 2023, 28, 5710. [Google Scholar] [CrossRef] [PubMed]
  22. Kedzierski, M.; Le Tilly, V.; César, G.; Sire, O.; Bruzaud, S. Efficient Microplastics Extraction from Sand. A Cost Effective Methodology Based on Sodium Iodide Recycling. Mar. Pollut. Bull. 2017, 115, 120–129. [Google Scholar] [CrossRef]
  23. Primpke, S.; Christiansen, S.H.; Cowger, W.; De Frond, H.; Deshpande, A.; Fischer, M.; Holland, E.B.; Meyns, M.; O’Donnell, B.A.; Ossmann, B.E.; et al. Critical Assessment of Analytical Methods for the Harmonized and Cost-Efficient Analysis of Microplastics. Appl. Spectrosc. 2020, 74, 1012–1047. [Google Scholar] [CrossRef] [PubMed]
  24. Primpke, S.; Cross, R.K.; Mintenig, S.M.; Simon, M.; Vianello, A.; Gerdts, G.; Vollertsen, J. Toward the Systematic Identification of Microplastics in the Environment: Evaluation of a New Independent Software Tool (siMPle) for Spectroscopic Analysis. Appl. Spectrosc. 2020, 74, 1127–1138. [Google Scholar] [CrossRef]
  25. Hurley, R.R.; Lusher, A.L.; Olsen, M.; Nizzetto, L. Validation of a Method for Extracting Microplastics from Complex, Organic-Rich, Environmental Matrices. Environ. Sci. Technol. 2018, 52, 7409–7417. [Google Scholar] [CrossRef] [PubMed]
  26. Prata, J.C.; da Costa, J.P.; Girão, A.V.; Lopes, I.; Duarte, A.C.; Rocha-Santos, T. Identifying a Quick and Efficient Method of Removing Organic Matter without Damaging Microplastic Samples. Sci. Total Environ. 2019, 686, 131–139. [Google Scholar] [CrossRef]
  27. Li, X.; Chen, L.; Ji, Y.; Li, M.; Dong, B.; Qian, G.; Zhou, J.; Dai, X. Effects of Chemical Pretreatments on Microplastic Extraction in Sewage Sludge and Their Physicochemical Characteristics. Water Res. 2020, 171, 115379. [Google Scholar] [CrossRef] [PubMed]
  28. Primpke, S.; Lorenz, C.; Rascher-Friesenhausen, R.; Gerdts, G. An Automated Approach for Microplastics Analysis Using Focal Plane Array (FPA) FTIR Microscopy and Image Analysis. Anal. Methods 2017, 9, 1499–1511. [Google Scholar] [CrossRef]
  29. AFNOR. French Standard—NF U44-108—Boues Des Ouvrages de Traitement Des Eaux Usées Urbaines—Boues Liquides—Échantillonnage En Vue de l’estimation de La Teneur Moyenne d’un Lot (Sludge from Urban Wastewater Plant—Liquid Sludge—Sampling Method for Estimating Average Content of a Production Batch). 1982. Available online: https://www.boutique.afnor.org/en-gb/standard/nf-u44108/fluid-sludge-from-treatment-of-urban-sewage-sampling-for-estimating-the-ave/fa017118/13727 (accessed on 2 February 2021).
  30. AFNOR. French Standard—NF EN 12579—Amendements Organiques et Supports de Culture—Échantillonnage (Organic Amendment and Growing Media- Sampling Method). 2013. Available online: https://www.boutique.afnor.org/en-gb/standard/nf-en-12579/soil-improvers-and-growing-media-sampling/fa164455/42577 (accessed on 2 February 2021).
  31. Plastics Europe. Plastics—The Facts 2021. Plastics Europe. 2021. Available online: https://plasticseurope.org/knowledge-hub/plastics-the-facts-2021/ (accessed on 2 February 2021).
  32. Pyda, M.; Wunderlich, B. Reversing and Nonreversing Heat Capacity of Poly(Lactic Acid) in the Glass Transition Region by TMDSC. Macromolecules 2005, 38, 10472–10479. [Google Scholar] [CrossRef]
  33. Maw, M.M.; Boontanon, N.; Fujii, S.; Boontanon, S.K. Rapid and Efficient Removal of Organic Matter from Sewage Sludge for Extraction of Microplastics. Sci. Total Environ. 2022, 853, 158642. [Google Scholar] [CrossRef]
  34. Cerli, C.; Celi, L.; Kalbitz, K.; Guggenberger, G.; Kaiser, K. Separation of Light and Heavy Organic Matter Fractions in Soil—Testing for Proper Density Cut-off and Dispersion Level. Geoderma 2012, 170, 403–416. [Google Scholar] [CrossRef]
  35. Enders, K.; Lenz, R.; Ivar do Sul, J.A.; Tagg, A.S.; Labrenz, M. When Every Particle Matters: A QuEChERS Approach to Extract Microplastics from Environmental Samples. MethodsX 2020, 7, 100784. [Google Scholar] [CrossRef]
  36. Li, Q.; Wu, J.; Zhao, X.; Gu, X.; Ji, R. Separation and Identification of Microplastics from Soil and Sewage Sludge. Environ. Pollut. 2019, 254, 113076. [Google Scholar] [CrossRef]
  37. Thomas, D.; Schütze, B.; Heinze, W.M.; Steinmetz, Z. Sample Preparation Techniques for the Analysis of Microplastics in Soil—A Review. Sustainability 2020, 12, 9074. [Google Scholar] [CrossRef]
  38. R Core Team. R: A Language and Environment for Statistical Computing. 2023. Available online: https://www.scirp.org/reference/referencespapers?referenceid=3582659 (accessed on 23 May 2023).
  39. Patil, I. statsExpressions: R Package for Tidy Dataframes and Expressions with Statistical Details. J. Open Source Softw. 2021, 6, 3236. [Google Scholar] [CrossRef]
  40. Beltrán, M.; Marcilla, A. Fourier transform infrared spectroscopy applied to the study of pvc decomposition. Eur. Polym. J. 1997, 33, 1135–1142. [Google Scholar] [CrossRef]
  41. Pfohl, P.; Roth, C.; Meyer, L.; Heinemeyer, U.; Gruendling, T.; Lang, C.; Nestle, N.; Hofmann, T.; Wohlleben, W.; Jessl, S. Microplastic Extraction Protocols Can Impact the Polymer Structure. Microplast. Nanoplast. 2021, 1, 8. [Google Scholar] [CrossRef]
  42. Hu, H.; Qiang, L.; Xu, J.; Li, G.; Cheng, J.; Zhong, X.; Zhang, R. Enhanced Microplastic Retrieval Efficiency from Cultivated Soil Samples through Optimized Pre-Treatment in Density-Based Extraction. Soil Tillage Res. 2024, 242, 106134. [Google Scholar] [CrossRef]
  43. Schrank, I.; Möller, J.N.; Imhof, H.K.; Hauenstein, O.; Zielke, F.; Agarwal, S.; Löder, M.G.J.; Greiner, A.; Laforsch, C. Microplastic Sample Purification Methods—Assessing Detrimental Effects of Purification Procedures on Specific Plastic Types. Sci. Total Environ. 2022, 833, 154824. [Google Scholar] [CrossRef]
  44. Zhang, Z.; Liu, W.; Gao, Q.; Huang, F.; Kang, Y.; Pan, Y.; Luo, G.; Zhou, X.; Fan, L.; Wang, A.; et al. Microplastics Extraction from Wastewater Treatment Plants: Two-Step Digestion Pre-Treatment and Application. Water Res. 2023, 230, 119569. [Google Scholar] [CrossRef]
  45. Savino, I.; Campanale, C.; Trotti, P.; Massarelli, C.; Corriero, G.; Uricchio, V.F. Effects and Impacts of Different Oxidative Digestion Treatments on Virgin and Aged Microplastic Particles. Polymers 2022, 14, 1958. [Google Scholar] [CrossRef] [PubMed]
  46. Vermeiren, P.; Muñoz, C.; Ikejima, K. Microplastic Identification and Quantification from Organic Rich Sediments: A Validated Laboratory Protocol. Environ. Pollut. 2020, 262, 114298. [Google Scholar] [CrossRef] [PubMed]
  47. Al-Azzawi, M.S.M.; Funck, M.; Kunaschk, M.; Der Esch, E.V.; Jacob, O.; Freier, K.P.; Schmidt, T.C.; Elsner, M.; Ivleva, N.P.; Tuerk, J.; et al. Microplastic Sampling from Wastewater Treatment Plant Effluents: Best-Practices and Synergies between Thermoanalytical and Spectroscopic Analysis. Water Res. 2022, 219, 118549. [Google Scholar] [CrossRef] [PubMed]
  48. Pfeiffer, F.; Fischer, E.K. Various Digestion Protocols Within Microplastic Sample Processing—Evaluating the Resistance of Different Synthetic Polymers and the Efficiency of Biogenic Organic Matter Destruction. Front. Environ. Sci. 2020, 8, 263. [Google Scholar] [CrossRef]
  49. Tan, M.; Sun, Y.; Gui, J.; Wang, J.; Chen, X.; Wu, D. The Efficiency of Different Digestion and Separation Methods for Extracting Microplastics in Typical Organic Solid Waste. Int. J. Environ. Res. 2022, 16, 16. [Google Scholar] [CrossRef]
Figure 1. MP extraction rate (blue) and residual matter quantity (yellow) after full extraction process. This figure presents MP extraction rate (as a percentage of the number of spiked microplastics) after full treatment, with all samples combined (A) and depending on the sample’s matrix categories (B), as well as the average of the mass of residual materials (microplastics present before spiking in the matrix and organic residues) expressed as a percentage of the initial mass; all samples taken together (C) and as a function of the nature of the organic waste product (D).
Environments 12 00143 g001
Figure 2. Scanning electron microscopy (SEM) photos (1000×) for PE (A,D), PLA-PBAT (B,E) and PVC (C,F) microplastics before (AC) and after treatment (DF).
Environments 12 00143 g002
Figure 3. Comparison of virgin MP spectrum (before treatment, black) and average (n = 3) MP spectrum (after treatment, all samples combined, red) for PE (A), PLA-PBAT (B) and PE (C).
Environments 12 00143 g003
Figure 4. Estimated recovered proportions of the OWP categories. Recovered proportions for all OWP categories combined (A), and for OWP related to sewage sludge (B), to food waste (C), and to agricultural waste (D).
Environments 12 00143 g004
Figure 5. Presentation of the recovered proportion before (n) and after correction by proportionality (y) to take account of the fact that for the 50–100 µm (A) and 100–250 µm (B) size categories, not all the filters could be analysed by FPA-FTIR. The pale grey OWP categories (b,c,e) show the OWP categories for which no filters could be analysed, and therefore for which the correction calculations were not carried out.
Environments 12 00143 g005
Figure 6. Confidence intervals for the different OWP categories. (A) Confidence intervals for all OWP categories combined. Confidence intervals for results relating to raw and treated samples of sewage sludge (B), food waste (C) and agricultural waste (D). The values in brackets correspond to the minimum and maximum numbers of microplastics analysed (n; Equation (6)) collected for a given MP size and OWP category.
Environments 12 00143 g006
Table 1. Calculated values of the dimensionless correction factors (CF) as a function of the size range.
50–100 µm100–250 µm250–500 µm500–1000 µm1000–2000 µm2000–5000 µm
CF1.53.818.252.8153.5387.5
1/CF0.660.260.060.020.0070.003
Disclaimer/Publisher’s Note: The statements, opinions and data contained in all publications are solely those of the individual author(s) and contributor(s) and not of MDPI and/or the editor(s). MDPI and/or the editor(s) disclaim responsibility for any injury to people or property resulting from any ideas, methods, instructions or products referred to in the content.

