Article

Factors Influencing AI Chatbot Adoption in Government Administration: A Case Study of Sri Lanka’s Digital Government

by
Arjuna Srilal Rathnayake
1,*,
Truong Dang Hoang Nhat Nguyen
2 and
Yonghan Ahn
3,*
1
Department of Applied Artificial Intelligence, Hanyang University, Erica Campus, Ansan-si 15588, Republic of Korea
2
Center for AI Technology in Construction, Hanyang University, Erica Campus, Ansan-si 15588, Republic of Korea
3
Department of Architecture and Architectural Engineering, Hanyang University, Erica Campus, Ansan-si 15588, Republic of Korea
*
Authors to whom correspondence should be addressed.
Adm. Sci. 2025, 15(5), 157; https://doi.org/10.3390/admsci15050157
Submission received: 27 February 2025 / Revised: 27 March 2025 / Accepted: 3 April 2025 / Published: 25 April 2025
(This article belongs to the Special Issue Challenges and Future Trends in Digital Government)

Abstract

:
This study investigates the factors in acceptance of artificial intelligence (AI)-based chatbot application in Sri Lanka’s government administration services, which can be applied to developing countries, using an extended technology acceptance model (extended TAM) as a new research framework by adding external constructs such as trust, application design/appearance, and social influence to the technology acceptance model (TAM). Considering the sustainable implementation of AI, it is critical to understand user perspectives given the expanding and intricate integration of AI technology in government operations. Based on previous research, this study provides a structured survey to find out respondents’ thoughts on using AI chatbots to enhance government service delivery. With a valid sample size of 207 responses obtained from Sri Lanka, the data were analyzed using a covariance-based structural equation model (CB-SEM) to test the hypothesized relationships. The findings revealed that social influence (SI) has a positive and significant impact on trust (TR). Also, trust and application design (AD) have a positive and significant impact on perceived ease of use (PE), which in turn positively influenced perceived usefulness (PU) and then PE positively influenced attitude (AT) toward behavioral intention (BI) to accept AI chatbot applications in government administrative services. Therefore, this new model proved the effect of new external factors and highlights the importance of those factors in policy implementations for future AI-driven digital government initiatives.

1. Introduction

Artificial intelligence technologies, especially chatbots, are being used more and more in the government and private sectors to enhance operational efficiency and service delivery to support sustainable government administration. With the use of these modern technologies, agencies are able to manage high volumes of external enquiries, offer 24/7 support, and enhance user experiences by instantly replying to enquiries (Chen et al., 2023). To meet citizens’ expectations for effective government administration and further digital government initiatives in Sri Lanka, it is imperative that AI be integrated into government organizations. AI is transforming governments by optimizing decision making procedures, boosting customer satisfaction, and cutting down on administrative work. Governments use AI technologies to examine enormous volumes of data, spot trends, and decide on policies that will better serve the interests of the populace (Chiancone, 2023). This skill is essential for solving complicated societal issues since artificial intelligence might provide insights that conventional analytical techniques can be lacking. AI has a wide range of possible uses, from public safety and traffic management to healthcare, where it can speed up drug discovery and greatly improve operational efficiency and response to citizen requirements.
On the other hand, the use of AI in government functions raises significant ethical, accountability, and transparency issues. Organizations in the government sector must negotiate the challenges of ethically implementing AI technologies while guaranteeing that these platforms preserve principles like equity and inclusivity. Governments may automate repetitive questions, improve citizen interactions, and streamline internal procedures for employees by utilizing generative AI. But to reduce challenges and direct the moral use of AI in e-government initiatives, success depends on creating strong frameworks, educating staff, and establishing governance standards. Setting responsible practices as a top priority will be essential to building public trust and optimizing the advantages of these game-changing technologies as the role of AI in the government developments.
When it comes to government sector organizations adopting AI chatbots, putting new technologies into practice can be quite difficult and expensive (Hillemann, 2023). Many governments are struggling with to achieve the advantages that AI technology and e-government initiatives are expected to yield (Medaglia & Tangi, 2022; Mikalef et al., 2023). Significant financial losses have been caused by unsuccessful technological implementations, especially in the government sector, underscoring the need for predicting organizational and user needs. Low adoption of e-government solutions, like AI chatbots, is still a major obstacle, limiting both the physical and intangible benefits, even with the potential for development (Chen et al., 2023). The successful adoption of these technologies relies heavily on user approval and acceptance. User input, which is frequently restricted in its ability to assess technological viability, aids in the improvement of AI systems. The possibility of successful adoption can also be increased by gathering additional information and projections. It is possible to determine if a certain technology, such as AI chatbots, will be successfully incorporated into government sector operations by examining user attitudes and behavioral intents (Yigitcanlar et al., 2024).
Over the last decade, there has been substantial development in understanding user adoption of new information technologies, particularly with the help of the TAM (F. D. Davis, 1989). As a reliable framework for evaluating user adoption of developing technologies, this model has received both theoretical and experimental confirmation. For better explaining technology adoption, several scholars have expanded on TAM and proposed extended models that include further variables. These improved models give technical teams directions to optimize system design and allow decision-makers to assess new technical services. Despite its American origins, TAM has been shown in numerous studies (Alalwan et al., 2018; Alenazy et al., 2019; Hsu & Lu, 2004; Saif et al., 2024) to be a valid model for describing the relationship between users and technology acceptance in a variety of scenarios.
Though TAM has been identified as the most suitable theoretical foundation to identify the significance of user behavior and acceptance of modern technologies, the lack of extended TAM applications in government AI adoption can be explained as one of identified research gaps. Most of the existing studies on technology adoption in e-government rely on TAM or Unified Theory of Acceptance and Use of Technology (UTAUT) models without incorporating additional constructs (Venkatesh & Bala, 2008). However, emerging research suggests that factors like trust, application design/appearance, and social influence are critical in AI-based applications (Kelly et al., 2023; Omrani et al., 2022). So, this study extends TAM by incorporating these factors, addressing this theoretical gap. Also, there are many research studies that have been carried out on chatbot adoption in private sectors such as e-commerce, healthcare, and banking. In addition, similar research studies focusing on government sectors remain less common or none existent (Zuiderwijk et al., 2021). Government sector AI adoption differs due to factors such as administrative structures, regulatory limitations, and citizen confidence concerns. Therefore, this research study is trying to fill this gap by focusing specifically on AI chatbot adoption within Sri Lanka’s digital government services. Furthermore, most of those previous studies on AI chatbot adoption are focused on developed countries and technologically advanced environments (Huang & Rust, 2018; Kasilingam & Krishna, 2022). There is a lack of empirical research on AI adoption in developing countries, particularly in South Asia. Therefore, this study provides a Sri Lankan perspective, contributing specific insights and addressing the gap in non-developed, minimum technologically advanced countries in e-government adoption studies.
The following studies have extended TAM to explore technology adoption in e-government. However, these studies often focus on general e-government services, rather than AI-based e-government chatbots. An article on AI chatbot adoption (Gopinath & Kasilingam, 2023) focused on the commercial sector and it was not in a government administration context. Another study (Shareef et al., 2011) focused on general e-government services, not AI chatbots in the context of e-government services. An (Sharma & Agarwal, 2024) article on AI chatbot adoption focused on the education sector, and it did not consider application design. Additionally, an article on AI chatbots in customer service (Kunz & Wirtz, 2023) examined private sector chatbots, not government sector ones.
Our study suggests a unique TAM extension by integrating trust, application design/appearance, and social influence in the context of AI chatbots for public administration services in Sri Lanka to analyze and understand how the users’ perceptions of the acceptance of AI chatbot applications in government organizations influence their satisfaction with the use of these AI technologies. To achieve this objective, a structural equation modeling approach was applied, a statistical technique that allows the simultaneous evaluation of multiple relationships between unobservable latent variables. This approach is effective for exploring how the mentioned factors affect user intentions to use AI chatbots in government administration services. By focusing on how the newly identified external constructs influence user behavior and focusing on actual AI chatbot acceptance, this study aims to offer a new model that can guide governments and government policy makers to design a sustainable technology acceptance plan for successful e-government service delivery for developing countries.

Current Availability of E-Government Services in Sri Lanka

Sri Lanka has succeeded in making considerable progress in the implementation of e-government services over the past ten years. The Sri Lankan government has recognized the potential of digital transformation to enhance government efficiency, effectiveness, and improve citizens’ access to day-to-day services. However, the intensity of digital environment adoption and the availability of e-services vary across different government sector organizations and services. The Sri Lankan government has initiated some e-government platforms to provide e-services to citizens. One of the key initiatives is the Sri Lanka Government Portal, which serves as a central hub for accessing various e-services. Key services such as tax filing, vehicle revenue licensing, online appointment reservation, and payment of utility bills are available through these digital platforms. However, the use of AI chatbots in public administration is still in its nascent stages, and no government agencies have fully implemented these e-systems to support administrative services to citizens.
When we consider the actual usage and citizen adoption for those e-services, it varied based on the geographical and development area. Urban and developed areas, where access to the internet service and digital infrastructure is better, have seen sophisticated usage compared to rural areas, where there are issues such as limited internet service connectivity and digital literacy. Traditional methods such as in-person visits to government offices and paper-based document processing are continuing to lead in many government offices in undeveloped rural areas. Although the Sri Lankan government put efforts to digitalize government services, some citizens and public sector employees are either unfamiliar, resistant to change, or lack of trust in e-government platforms, resulting in lower usage and adoption of e-services.

2. Theoretical Framework and Hypotheses Development

The acceptance of AI technological application is complicated due to its structure, and the TAM alone cannot be a comprehensive tool for this. TAM needs to be merged with other significant constructs that guide the plan to a new model, compatible with latest AI technological aspects such as chatbot applications. In this study, evolving and accumulating a comprehensive list of customer behavior determinants of sustainable AI technology acceptance is to assess the impact of these indicators. The customer can decide whether to take the right interventions or not to maximize the effective utilization of the new transaction technology. However, the AI chatbot application is new and has complicated characteristics in terms of adoption and development in government sector organizations. Three identified constructs may play direct and indirect roles in the sustainable adoption of AI chatbot application, remarkably in the government administration service initiatives in the Sri Lankan context (trust, application design/appearance, and social influence).

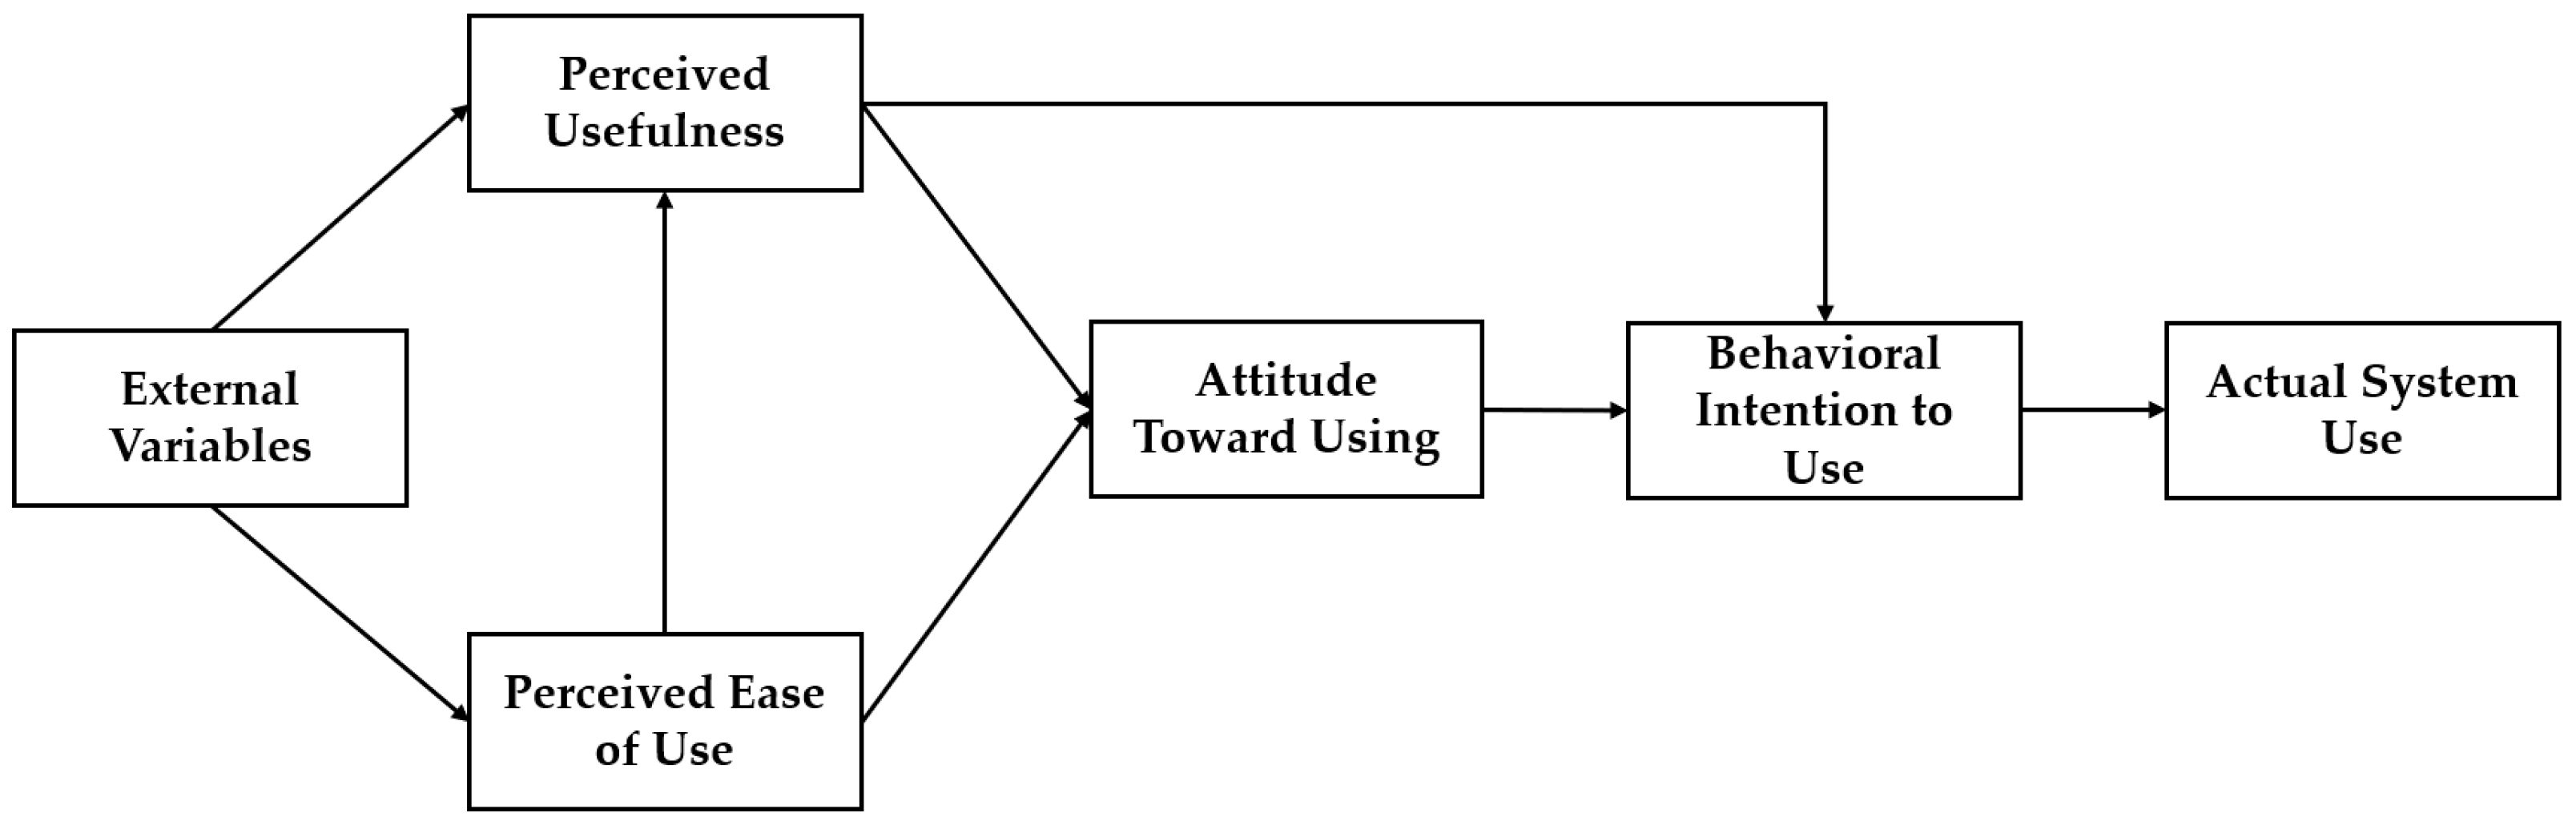
2.1. Technology Acceptance Model (TAM)

The TAM (Figure 1) has been used in research to explore the acceptance of new technology or new services (F. D. Davis, 1989; F. D. Davis & Venkatesh, 1996). TAM is one of the most effective contributions of Ajzen and Fishbein’s theory of reasoned action (TRA). Davis’s technology acceptance model, TAM (F. D. Davis, 1989; F. D. Davis & Venkatesh, 1996), is the most widely utilized model of acceptance and usage of innovative technology by users.
Users’ perceptions about the actual utility of technology (actual system use) were found to be related to their attitude and behavioral intention to use the technology. Perceived usefulness exhibits a more harmonious association with utilization than the other model variables. As a result, this study decides to incorporate perceived usefulness and perceived ease of use into a new study paradigm. Perceived usefulness is defined as the extent to which a user believes that adopting a certain system will improve work performance. Perceived ease of use is the degree to which a user believes that utilizing a specific system will be effortless and easily adopted.

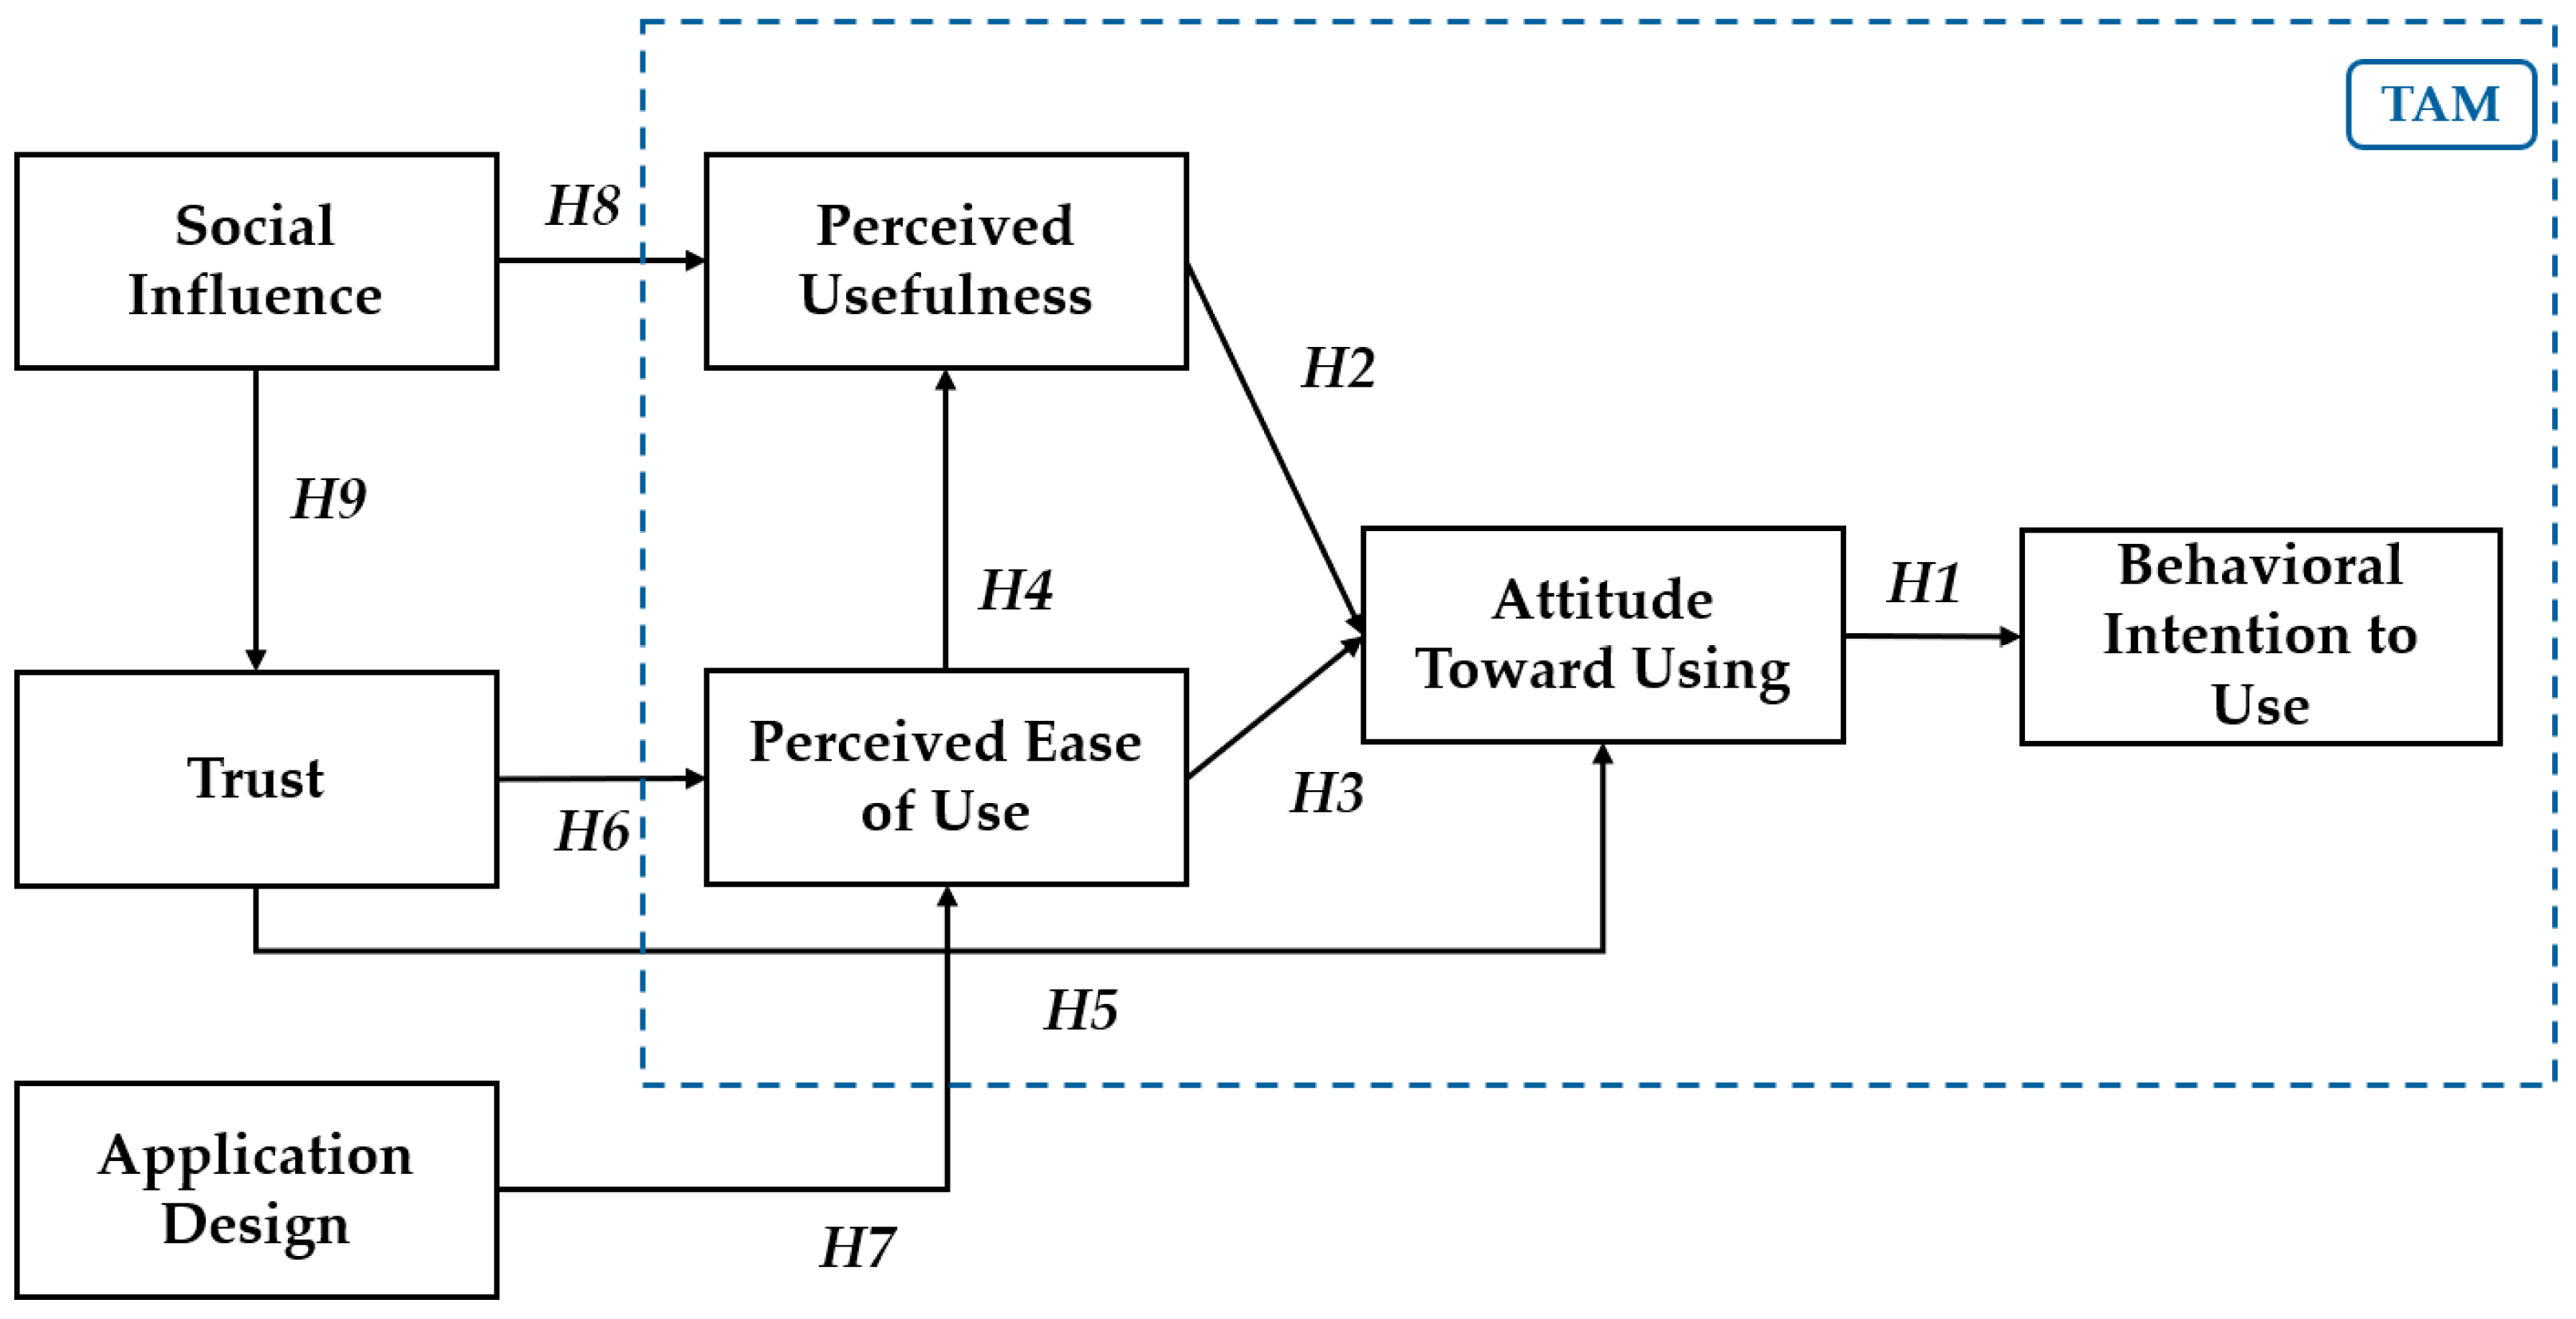
2.2. Hypothesis and Model Development

According to the proven literature, TAM has yielded good results for calculating the behavioral intention to use the new technology (Edo et al., 2023; Ikhsan et al., 2025; Natasia et al., 2022; Saif et al., 2024). However, there is a lack of a TAM to obtain good results that value the acceptance of the latest advanced technologies, and the development of this extended TAM is required to achieve this approach. Furthermore, we identified three new factors that are not explained in the TAM (trust, application design/appearance, social influence). Also, these factors are considered important according to many experts in AI technology and the characteristics and unique structure of this technology.
This paper will introduce a new research model with two parts and will explain them in detail with each hypothesis: first, the fundamental TAM constructs (behavior intention, attitude, perceived usefulness, perceived ease of use) and second, external constructs (trust, application design/appearance, and social influence).

2.2.1. TAM-Fundamental Constructs

Behavior Intention (BI)

According to behavioral psychology, user behavior is influenced by intentionality, it also relates to the user’s perceived possibility or probability that they will engage in a specific behavior, in this case, experiencing the new technology (Malhotra & Galletta, 1999). Behavioral intention aids in the identification of well-formed measures of user acceptance early in the system development life cycle. Furthermore, it assists clients in accepting helpful innovations or rejecting wrong and harmful ones, hence reducing the danger of giving inferior technologies prior to rejection (F. Davis et al., 1989; F. D. Davis, 1989).
Another study suggested that the Perceived usefulness of a technology directly influences users’ behavioral intention to use it (Ilyas et al., 2023). Specifically, when users perceive technology as more beneficial, they are more likely to accept and utilize it. Behavioral intention refers to a user’s subjective motivations for performing a behavior on a system. The intention to use such a system is driven by user purpose behavior (Warshaw & Davis, 1985). Also, another author found that perceived moral values act as a unique performance of behavioral intention (Ajzen & Fishbein, 1970). Perhaps the user influences behavioral intentions based on their attitudes and values in such a morality scenario (Gorsuch & Ortberg, 1983). Another article indicated that habit was a more potent predictor of classroom behavior than intentions. However, a post-research analysis supported the idea that intentions become important when the habit component can be suppressed (Landis et al., 1978). The attitude and intention relationship was attenuated when the extent of past behavior was included as an explanatory variable. Similarly, past behavior lessened the impact of intentions on behavior (Bagozzi, 1981). There is evidence linking several dimensions to behavior, and there is a correlation between cognitive and behavioral measurements, which were defined more by chance than by formal logic (Warshaw, 1980). Another author revealed that additional study is required to examine PU and PE from a broad perspective in order to calculate the impact of outside variables on these internal behavioral findings (F. D. Davis, 1989). Intentionality in behavior is the ultimate objective. As mentioned above, numerous studies have identified measures of attitude and then calculated how closely they correlate with behavior. A more logical course of action would be to concentrate on behavior measurement and prediction, which would lead to the identification of the primary factors and characteristics influencing consumers’ behavioral intention to embrace AI chatbot technology. Therefore, the user behavioral intention to accept AI chatbot application in the Sri Lankan e-government movement needs to be identified and weighted when analyzing such enhanced model.

Attitude (AT)

Regarding intentionality, the term “attitude” describes how a user feels about the new technology, whether positively or negatively (F. Davis et al., 1989; F. D. Davis, 1989). The theory of reasoned action (TRA) (Fishbein & Ajzen, 1975) led researchers to find that the actual behavior, an attitude towards utilizing and investigating objects such a technological system, is referred to as the user belief system. When determining their behavioral intentions, people consider their attitudes towards each of the available options. It seems that the attitude towards similar choice processes does not reveal how an individual forms their opinions about whether or not to carry out several tasks (Sheppard et al., 1988). Considering desires and the causes of the urge could affect the salient result of the goal behavior. The normative beliefs and attitude values can be merged under the average of anticipation (F. Davis, 1985; F. Davis et al., 1989). According to several studies, one’s attitude can influence and be influenced by the attitudes of others (Ajzen & Fishbein, 2000, 2005). It has been assumed that social influence processing is crucial to a new system’s acceptability (Ajzen & Fishbein, 2005). Furthermore, the use of new technology itself may cause attitudes towards it to shift, which could directly affect organizational structure, communication styles, and working locations (Cuel & Ferrario, 2009; Rice & Aydin, 1991).
Also, another study shows that the attitude and behavioral intention toward a specific application is determined by the usefulness perception, while its usefulness is influenced by several external factors (Prabowo & Nugroho, 2019; Wang et al., 2023). Similarly, a strong correlation between attitude and user behavior links is guaranteed when appropriate measurement execution is used (Ajzen & Fishbein, 1977). As a result, the TAM and further study findings have validated the association and consequences between attitude and behavioral intention. Based on those validated concepts, it can be stated that the attitude of citizens toward the acceptance of AI chatbots will influence their behavioral intention to use these e-government systems in the future. A positive attitude is necessary for adoption, as it reflects a willingness to engage with the new technology. In Sri Lanka, the adoption of digital initiatives in government services has been slow due to concerns about efficiency and trustworthiness. However, as AI-powered chatbots promise to streamline government services, citizens’ positive attitudes towards the perceived benefits can increase their intention to use these services. Citizens who find the chatbot useful and easy to interact with are more likely to adopt it. Therefore, the following hypothesis is made:
Hypothesis 1 (H1):
Attitude has a positive and significant impact on behavioral intention toward AI chatbot application adoption in government administration services.

Perceived Usefulness (PU)

The extent to which a user feels that utilizing the new technology will improve his or her performance is known as perceived usefulness (F. Davis, 1985; F. D. Davis, 1989). This author discovered that the targeted partial intervention could affect attitudes and beliefs (F. D. Davis, 1989). Perceived usefulness is strongly influenced by intention, but attitude has a limited correlation with perceived usefulness (Maria & Sugiyanto, 2023). This was clarified in his writings which surveyed the topic of people who wish to use helpful technology despite having a negative attitude towards it. Theoretically, PU is a positive aspect; users are more likely to support an application based on its performance capabilities and abilities than on how easy or hard the system is to use, which affects service adoption (F. Davis et al., 1989). This suggests that the characteristics of perceived usefulness are connected and affect the degree of use (Adams et al., 1992).
User PU can be caused by a variety of variables, such as environmental factors, that have the potential to significantly alter consumer perceptions (Banjarnahor, 2017). It is suggested that the contextual factors of perceived environmental uncertainty and decentralization will affect the PU of aggregated data. The benefits of the prior integration of PU in things like technology systems are explained by certain discoveries (Saade & Bahli, 2005). From another perspective, another study found that PU and enjoyment had a comparable effect on the frequency and time of use; the effect of computer anxiety was more about enjoyment than perceived usefulness (Igbaria et al., 1994). Since many components of the system environment and PU had a major impact on PE for the technology system, there was a direct impact on the information technology system, particularly on perceived ease of use (Karahanna & Straub, 1999).
Considering those previous studies, the suggestion is that the usefulness of AI chatbots will shape citizens’ attitudes toward their use. Sri Lankan citizens often experience inefficiency in public service delivery. If the chatbot application is seen as improving service delivery and addressing government service challenges, users are more likely to gain a positive attitude towards accepting it. A useful chatbot that reduces waiting times, provides instant feedback, and manages routine tasks effectively will generate a positive attitude toward its adoption. Then, the citizens will motivate themself to use the chatbot if they perceive it as an effective solution to current service shortcomings. Therefore, the following hypothesis is made:
Hypothesis 2 (H2):
Perceived usefulness has a positive and significant impact on attitudes towards AI chatbot application adoption in government administration services.

Perceived Ease of Use (PE)

The degree to which people believe that utilizing the new technology would be effortless is known as perceived ease of use (F. Davis, 1985; F. Davis et al., 1989). PE in the TAM is one of the primary constructs. This construct has two direct constructive effects on PU and AT (F. Davis et al., 1989). Numerous studies have endorsed and employed TAM theory to estimate consumer behavior with new technologies (F. Davis, 1985; F. Davis et al., 1989). PE is the likelihood that users will expect the intended system to be effortless (Granić & Marangunić, 2019; Mathieson, 1991). In construction, PE is the degree to which the user anticipates and thinks that utilizing this service or technical system will be effortless (F. Davis et al., 1989; Nakisa et al., 2023). When attempting to convey the emotions and aspirations of the clients to the service providers, creating a system that is simple, responsive, easy to use, easy to manage, and adaptable is crucial to achieving our really challenging objectives (Gould & Lewis, 1985).
PE was taken into consideration by many researchers to determine user acceptance. Additionally, even though all but a few of these researchers received the anticipated results regarding PE, the TAM was widely used in practice in this field (Venkatesh, 2000). The significance of firsthand experience in locating the PE was validated by the findings of earlier user acceptance studies that focused on actual use (Calisir & Calisir, 2004; Gefen & Straub, 2000; Hackbarth et al., 2003; Saade & Bahli, 2005; Venkatesh & Davis, 1996).
The PE of AI chatbots will influence citizens’ attitudes toward them. If users find the system easy to use, their attitude towards using it will be more positive. In Sri Lanka, digital literateness is an important factor in the acceptance of modern technology. Most suburban Sri Lankans may not have sound technical skills, so a chatbot that is simple and user-friendly will positively build their attitudes toward using it. As AI technology is still new to many areas, ensuring ease of use can improve technological concerns, leading to a more favorable perception of the system. Also, if the chatbot is easier to use, it will be more useful. Then, citizens will find that the chatbot is more efficient and easier and will be more likely to believe in it and use it in government services. Ease of use is critical aspect in a developing country like Sri Lanka. Because a considerable percentage of the population has limited access to modern technological tools. If government chatbot applications are simple to experience, users will perceive it as a useful tool for engaging with Sri Lankan e-government services. Therefore, the following hypotheses are made:
Hypothesis 3 (H3):
Perceived ease of use has a positive and significant impact on attitude toward AI chatbot application adoption in government administration services.
Hypothesis 4 (H4):
Perceived ease of use has a positive and significant impact on perceived usefulness toward AI chatbot application adoption in government administration services.

2.2.2. External Constructs

The following external constructs are adopted according to environmental and technology characteristics. Moreover, some studies that have ensured these definitions and relationships are shown in Table 1.

Trust (TR)

Trust is the degree to which consumers feel secure, at ease, and confident when utilizing technology (Jarvenpaa et al., 2000; McCloskey, 2006). Factors that either directly or indirectly motivate individuals to adopt technology include trust, security, and privacy (Matemba & Li, 2017). A trustworthy system that adjusts to the unavoidable changes in trust can manage the way social interactions change over time (Golbeck & Kuter, 2009). Individuals with positive opinions about a given technology may be more open to trust and feel more secure about it than those with unfavorable sentiments. When trust is taken into account, this demonstrates strong partial correlations between risk and acceptance (Eiser et al., 2006). Also, another research study indicated that e-commerce chatbots enhance trust and accessibility, encouraging users to become less willing to take chances and better protecting them against the likelihood of untrustworthiness situations (Celik et al., 2022). In the case of new technology-based applications, trust should be high, and the risk probability should be reduced. Both mindset and the PE of the available technology are directly impacted by trust. Trust is the key element of this study, and this factor shows a significant indirect effect on customer behavior. Trust has the power to influence a customer’s choice of technology or even service (Kesharwani & Bisht, 2012).
From the perspective of AI chatbots in public administration services, trust plays a fundamental role in influencing user acceptance. Government sector applications require higher levels of trust due to interests over data protection, privacy, accuracy, and reliability (Gefen et al., 2003). Studies on e-government and AI adoption (Alzahrani et al., 2017; Wirtz et al., 2019) have described that trust significantly impacts users’ readiness to engage with e-services. Therefore, it can be taken as a relevant construct in chatbot adoption. Trust has been identified as the focal point of successful human–chatbot interaction by another study (Przegalinska et al., 2019). According to another study (Mostafa & Kasamani, 2022), initial trust in chatbots improves the intention to use chatbots and promotes customer engagement. Also, trust was positively correlated with satisfaction as well as students’ probability of responding to the chatbot according to Pesonen (2021). Another study explained valuable insights for managers on how they can leverage chatbot trust to enhance customer interaction with their products (Alagarsamy & Mehrolia, 2023). Likewise, another research study was conducted to discover the hedonic characteristics of consumer trust in text chatbots by integrating the social and emotional aspects of this interaction (Ltifi, 2023). Its results show that the chatbot’s task complexity and disclosure partially affect the empathy–trust relationship and the usability–trust relationship.
Citizens’ confidence in the government and its digital applications is essential for e-government adoption in Sri Lanka. The use of the chatbot system can be positively influenced by a high degree of trust, particularly regarding data security and privacy. Citizens’ perceptions may be impacted, and adoption may be impeded by concerns about data exploitation or security breaches in government platforms. Trust in the AI system will influence how easy it is to use. Trust in the chatbot’s will may make users feel more comfortable in using it and improve their perception of ease of use. Trust is a fundamental concept for user acceptance in Sri Lanka. Data privacy concerns can hinder the adoption of digital tools. If citizens feel confident that their personal data will be protected with those chatbot solutions, they are more likely to find the chatbot easy to use and safe. Therefore, the trust factor will be taken into account in this study, and the following hypotheses are made:
Hypothesis 5 (H5):
Trust has a positive and significant impact on attitude toward AI chatbot application adoption in government administration services.
Hypothesis 6 (H6):
Trust has a positive and significant impact on perceived ease of use toward AI chatbot application adoption in government administration services.

Application Design and Appearance (AD)

Application design is the study of how technology features like layout, look, and navigation affect consumers’ propensity to utilize a system (Zhou et al., 2009). Since use of a mobile application is now a part of everyday life, its design influences user behavior positively and has the power to alter expectations. The probability that expectation can affect a technical system’s future success was thoroughly studied by DeLone and McLean (Delone & McLean, 2003). The authors suggested that quality measurements, which have a big impact on the success of IT implementation and application design quality requirements, could have an impact on the system and information quality (Delone & McLean, 1992, 2003). Despite the widespread use of the internet, there are still a lot of reasons why individuals are reluctant to adopt new technology, like slow reaction times and slow hardware/software speed.
Additionally, a complex website design may result in high traffic and inaccessible systems (Slovic et al., 1985). Additionally, developers should consider the website’s design to boost the system’s acceptability and usability, which are influenced by positive attitudes and experience; it should have an insightful user interface (Hsu & Lu, 2004). Furthermore, PE towards AI chatbot application is impacted by responsiveness, speed, friendly interfaces, and decent design.
Another research study suggested that visually appealing applications are perceived as more user-friendly. Therefore, those findings can be aligned with TAM’s perceived ease of use factor (Kurosu & Kashimura, 1995). Prior research (Venkatesh & Davis, 1996) considered improved interface design for increasing user acceptance. Similarly, that will affect AI chatbot adoption, justifying its addition in this study model. A recent study (Alam & Saputro, 2022) showed that the user interface in the Dana Syariah application, which is assessed in terms of consistency, personality, layout, and control and affordances, could be said to make it easy for users young and old. A published article called “Development of Questionnaire to Measure User Acceptance Towards User Interface Design” (Baharum et al., 2017) considered and discussed developing a sustainable web design, particularly in focusing on user-centric websites and user acceptance. Findings from another study underscore the significance of these design elements in not only enhancing the user experience of interactive platforms but also in improving user engagement and user satisfaction levels (Lun et al., 2024). That clearly explains that users’ satisfaction and engagement will increase when solutions are easy to use.
The application design and appearance and user experience of the AI chatbot will influence how easy it is to use. E-government applications are more popular with users if they come with perfect user interfaces. User experience is crucial for the success of e-government tools in Sri Lanka. Also, easy navigation and multi-language support will enhance the perceived ease of use. Hence, if the chatbots are simple, clear, and visually friendly, it will encourage citizens for adoption, especially among less tech-savvy citizens. Therefore, application design and appearance have been taken into consideration in this study, and the following hypothesis is made:
Hypothesis 7 (H7):
Application design/appearance has a positive and significant impact on perceived ease of use.

Social Influence (SI)

Social influence is the term used to describe how a person’s norms, roles, affiliations, and ideals effect users’ thinking patterns regarding what they have to do. (Chaouali et al., 2016). Another study of successful online services has explained that the social impact factor (social influence) effects a customer’s loyalty to the company or technology while enabling them to engage with the platform in time to gain sufficient experience (Chaouali et al., 2016; Malhotra & Galletta, 1999). Furthermore, social influence is a special construct since it truly affects technology and reflects the degree of faith in it (Chaouali et al., 2016). When choosing whether or not to use this service, the client was urged to investigate, assess the degree of danger, and have faith in these interactions and communication contexts (Chaouali et al., 2016). Therefore, an understanding of consumer behavior towards the new technology and the anticipated benefits of its use will be possibly evaluated with the estimation of the impact of social influence on AI chatbot application adoption. Social factors have a big impact on how people think and use new technologies. Numerous studies and approaches suggest that social impact is crucial in describing the behavioral intention of customers (Chaouali et al., 2016; Hsu & Lu, 2004; Malhotra & Galletta, 1999).
According to a social media study, technology’s utility and usefulness are positively impacted by social factors. Additionally, social elements improve teamwork to foster a positive belief on system (Alenazy et al., 2019). According to the TRA model (Ajzen & Fishbein, 1977), both attitude and subjective norms can have an impact on a user’s behavioral intention (F. Davis et al., 1989). Previous studies discovered that a social environment that transcends IT characteristics and consumer decisions significantly influences user decisions and behaviors (Chaouali et al., 2016; Fulk et al., 1995; Fulk & Yuan, 2017; Malhotra & Galletta, 1999). Social impact is used to anticipate people’s use of a system based on their perceptions and trust that the system could improve their life and work performance (Venkatesh, 2000). On the other hand, social impact may be found in a lot of public environmental categories that support people’s involvement in the IT ecosystem. Information technology use can be made easier with the help of these social and organizational impacts (Venkatesh & Bala, 2008).
Additionally, Mathieson has clarified the requirement for additional resources to aid in understanding the connection between social influence and technological acceptance behavior (Mathieson, 1991). It is widely anticipated that the majority of workers will encourage others to use technology in the workplace by promoting its favorable social impacts (Venkatesh & Davis, 2000). Social influences from friends, family, coworkers, and well-respected public figures buffer how people react to risks. Risk perception frequently develops later on as a result of an individual’s behavior (Slovic, 1987). When people engage with one another, share information, and communicate through the IT system, social influences are observed, according to the research findings of Chin and His (Hsu & Lu, 2004). Family members or friends who endorse the extent of use of the new goods or services provide the trust, which boosts both trust and the use of them (Chaouali et al., 2016). Customers of AI chatbot applications and the underlying apps are impacted by social influence. The public’s expectations of its political leaders and government agencies’ performance in terms of their commitments, actions, and fulfillment of their duties are referred to as trust in government (Mansoor, 2021).
A study (Bonn et al., 2016) explained how norms and beliefs influence students’ perceptions of ease of use and usefulness. Also, it expressed the importance of understanding how social influences shape perceived usefulness. The results of another study show a positive and significant impact of social influence on perceived usefulness, attitudes, and behavioral intentions towards the usage of NPIs. Therefore, social forces can be considered relevant when understanding the adoption of new technology (Haverila et al., 2023). The findings of another study (Faqih, 2020) demonstrate the relationship of perceived usefulness and social influence with behavioral intention to adopt e-learning systems. Similarly, some studies have been conducted to analyze the effect and correlation between perceived usefulness and social influence (Effendy et al., 2021; Kurniawan et al., 2022; Prastiawan et al., 2021).
Similarly, on the topic of trust, it was identified that social influence and initial trust contributed the most in explaining whether users would accept automated vehicles or not, according to a research study (Zhang et al., 2020). The results of empirical study on the adoption of COVID-19 tracing apps found that social influence and trust in government foster the adoption process (Oldeweme et al., 2021).
Sri Lanka has a highly social, democratic society, and its people are more influenced by social networks when making decisions. If community leaders or trusted figures endorse the use of AI chatbots in government services, citizens are more likely to trust the technology and adopt it. Hence, social influence will positively impact trust in AI chatbots. Moreover, social influence will shape citizens’ perceptions of the usefulness of AI chatbots. If influencers in the community recommend the chatbot as a valuable tool of government service delivery, citizens will be more likely to perceive it as useful. In Sri Lanka, commendations from individuals respected in society or well-known government officials can greatly impact on public vision on usefulness. If citizens see leaders endorsing AI chatbots, they are more likely to perceive these tools as useful in improving their interactions with government services. Therefore, social influence has been taken into account in this study, and the following hypotheses are presented:
Hypothesis 8 (H8):
Social influence has a positive and significant impact on perceived usefulness.
Hypothesis 9 (H9):
Social influence has a positive and significant impact on trust.
A more comprehensive framework for assessing user behavior and enhancing technological integration can be made possible by these constructs, which can better account for the unique potential and constraints of deploying chatbots in organizational contexts. Also, this type of research can be identified as the most reliable and allowing immediate application due to the ability to achieve valid research results (Cohen et al., 2017). To evaluate their influence on the adoption of AI chatbots in the government administration services, several external user behavior indicators were identified for this study. The acceptance and effectiveness of AI technology are directly affected by these indicators, which help to figure out whether residents or government employees will decide to interact with chatbots. Several factors influence users’ decisions to use AI chatbots in government administration services, including perceived utility for enhancing service delivery, simplicity of use, responsiveness, and confidence and trust in the system.
Moreover, the adoption of AI chatbots application in government administration is influenced by the above-mentioned three key external constructs: trust, application design/appearance, and social influence. Trust is critical, as users must feel confident in the system’s security and accuracy. Social influence shapes user behavior, as individuals are more likely to adopt AI chatbots if they observe their peers using them. The application design/appearance of the chatbot must be intuitive and appealing to foster engagement. These external constructs reflect the environmental factors that, along with contextual factors, influence the adoption and acceptance of innovative technologies. The suggested conceptual model (extended TAM) for sustainable AI chatbot adoption in government administration services in Sri Lanka (Figure 2) shows how TAM is integrated with important external constructs, including trust, application design/appearance, and social influence.

3. Research Methods

3.1. Questionnaire Development and Pilot Study

In this study, all the questions in the developed questionnaire were presented with the same wording and order to guarantee the consistency of the constructs and measurement items. The measurement items for TAM-fundamental constructs (behavior intention, attitude, perceived usefulness, perceived ease of use) were thoroughly operationalized based on established scales from (F. D. Davis, 1989). Also, the measurement items for trust, application design/appearance, and social influence were thoroughly operationalized based on established scales from prior validated studies (Chaouali et al., 2016; Jarvenpaa et al., 2000; Zhou et al., 2009). Moreover, most questions were designed using a Likert scale, unless otherwise stated. A five-point Likert scale was selected. The structured online questionnaire consisted of four main sections, and two sets of Likert scale descriptors were mainly used, namely from 1 “Strongly Disagree/Strongly Agree” to 5. Descriptions of each part in the questionnaire are provided below:
Section 1: Brief introduction about this research and information for respondents.
Section 2: Respondents required to provide their personal information. This includes their gender, age, highest level of education, job/service category, computer experience and skills, and online/mobile application usage or experience (public/private sector).
Section 3: Respondents required to indicate the extent of various external influencing constructs on AI chatbot adoption in government administration services.
Section 4: Respondents required to indicate the extent of influencing constructs with TAM on AI chatbot adoption in government administration services.
We performed a pilot study with a small sample of 30 respondents, representing both ordinary residents and personnel of the public sector, prior to conducting full-scale data collection. The purpose of the pilot study was to evaluate the questionnaire items’ comprehensiveness, relevance, and clarity. A preliminary reliability analysis (Cronbach’s alpha) was conducted to guarantee the internal consistency of the scales, and item wording and format were improved based on feedback from the pilot. Minor adjustments were made based on the pilot study outcomes to enhance clarity and guarantee that the scales appropriately represented the structures in our study.
Various ethical considerations were considered to ensure the participants’ safety. Participants were informed about confidentiality, anonymity, and the protection of their privacy. Also, participation was entirely voluntary, and informed consent was collected from all participants prior to starting the survey response.

3.2. Data Collection
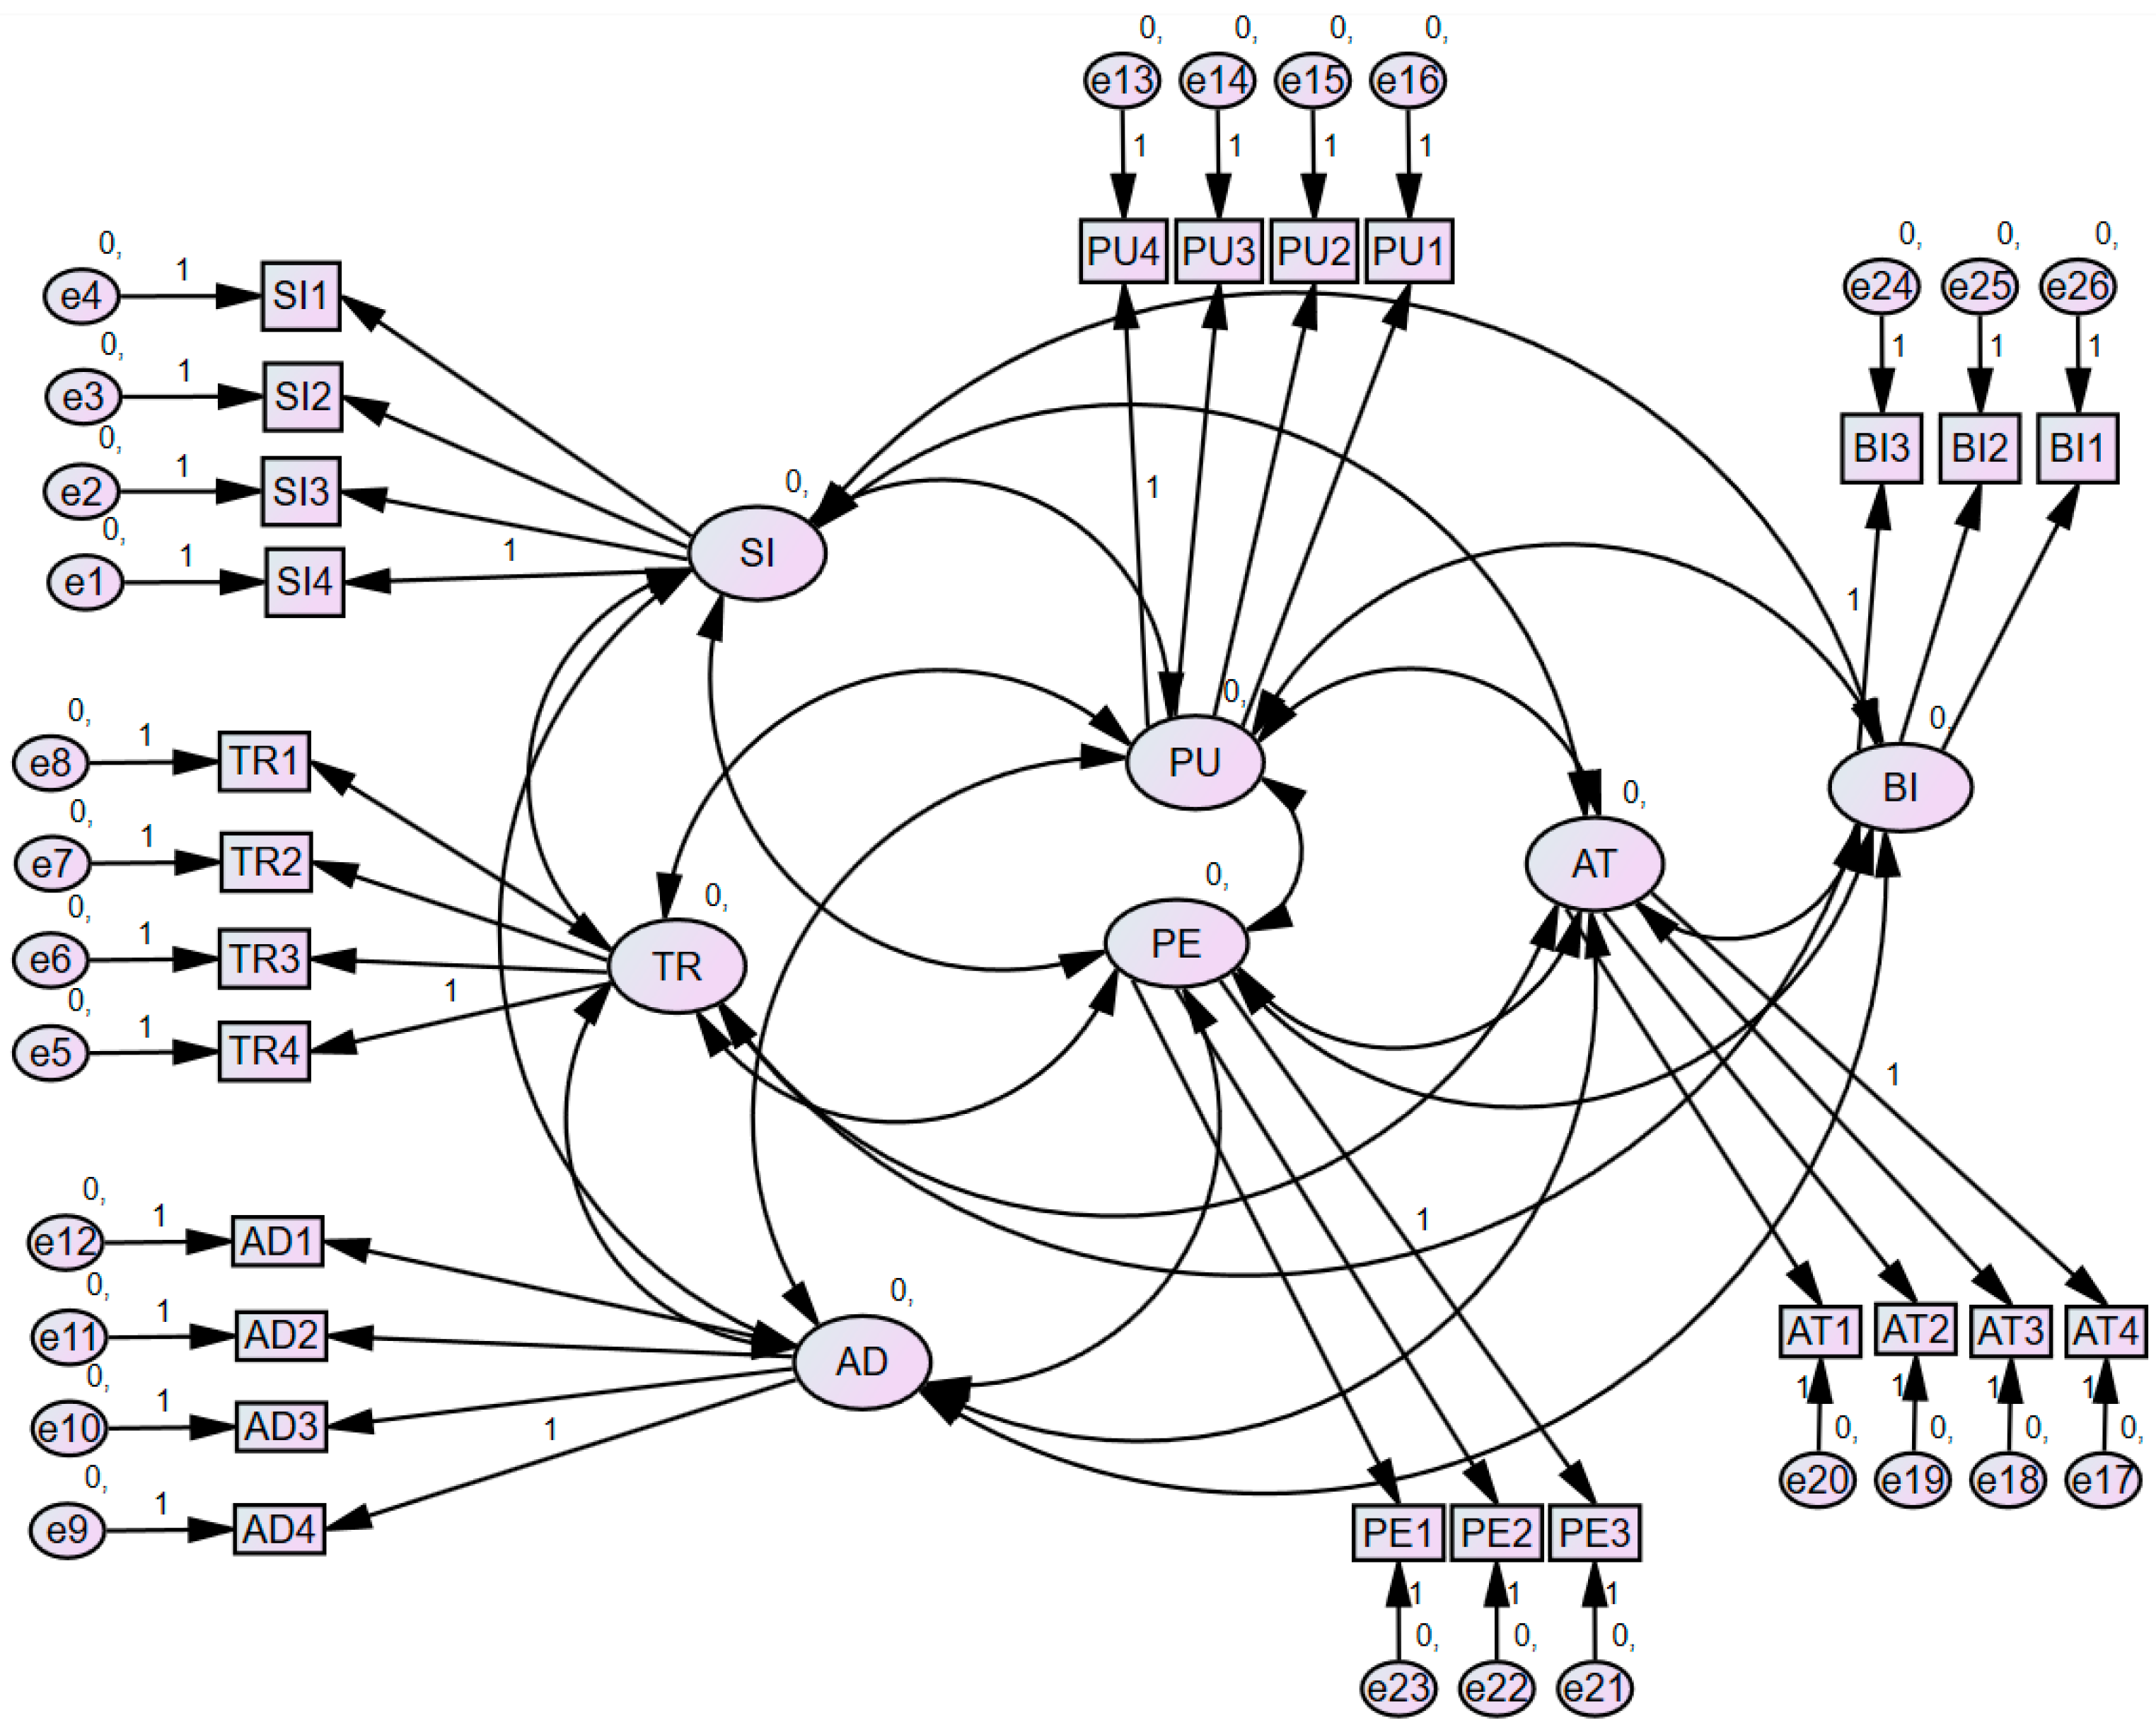
Data collection was performed using an online Google form for a three-month duration. A total of 207 respondents from government administration service users were included in this analysis. The sample mainly consisted of public sector employees because they could interact with AI chatbots as both employees and citizens, while private sector users were included to ensure broader applicability of findings to Sri Lanka’s entire digital population. By incorporating both groups, the study ensures that chatbot acceptance is evaluated from both an institutional and a public-user perspective, capturing a comprehensive adoption picture. Table 2 presents the composition of the sample, with the user intention on the acceptance of AI chatbot in government sector organizations in Sri Lanka. The observation shows that males constituted (46.40%) of the respondents while only (53.60%) were females. Also, it shows the age comparison of respondents: below 20 (0.50%), 20–29 (10.10%), 30–39 (50.70%), 40–49 (27.50%), 50 and above (11.10%).
Furthermore, most of their occupations fell into the category of the public sector (72.50%); private sector workers made up only 24.20% and 3.40% were unemployed. In addition, the highest educational level of the respondents was represented by 51.21% of graduate first degree holders, followed by 29.95% of Masters’ or higher degree holders; however, high school survey takers only represented 18.84%. The frequencies of IT usability and knowledge of the respondents were none (1.45%), very limited (1.45%), some experience (45.41%), quite a lot (36.71%), and extensive (14.98%). This clearly shows that most of the respondents have enough IT usability knowledge to use such modern technology. Moreover, the frequencies of mobile application use experience of the respondents were none (1.93%), very limited (1.93%), some experience (39.61%), quite a lot (37.74%), and extensive (18.84%). This demonstrates unequivocally that most respondents have sufficient experience using mobile applications to make use of such cutting-edge technological solutions.

3.3. Data Analysis

A rigorous process of development and validation was used for the construction of the study and the choice of measurement instruments. An exhaustive literature review was conducted to select and validate the most extensively accepted measurement items for the study. Several analyses were conducted to check the reliability and validity of each construct. The covariance-based structural equation model (CB-SEM) approach was used to estimate the theoretical model since this study is theory-driven and involves hypothesis testing. CB-SEM is ideal for validating well-established theories and relationships among constructs. Also, it confirms how well the model aligns with theoretical expectations. Moreover, it is required to confirm strong theoretical validation since the findings will be used for government public policy implications. The reliability and validity of the constructs were assessed through a measurement model utilizing a Confirmatory Factor Analysis (CFA) with IBM SPSS AMOS (V23).
The methodological technique involved evaluating both measurement and structural models. The structural model examined latent variable associations, whereas the measurement model assessed reliability and validity. The reflective measurement model was evaluated based on indicator loadings, internal consistency reliability (Cronbach’s alpha and composite reliability), convergent validity (average variance extracted), and discriminant validity (Fornell–Larcker criterion). Meanwhile, the structural model was evaluated using path coefficients and p-values.

4. Results

The theoretical model of this research was based on the use of a covariance-based structural equation modeling approach. The data analyzed in IBM SPSS AMOS (V.23) resulted in two models: a measurement model (see Figure 3), which evaluates the reliability of the constructs, validity, and model fit and a structural model, which addresses the hypotheses, direct-indirect-total effects related to the successful AI chatbot adoption in government administration services in Sri Lanka.

4.1. Measurement Model Assessment—Reliability, Validity, and Cross Loadings

Every measurement item needs to have its validity, reliability, and factor loading assessed. A measure’s consistency is its reliability. When a measure yields consistent results under consistent circumstances, it is deemed trustworthy (J. Hair et al., 2022). For each item loading to be deemed reliable, the value must be equal to or greater than (0.5). Cronbach’s alpha (α) and composite reliability (CR) ratings were used to assess the construct’s internal consistency. Cronbach’s alpha, with recommended values of 0.7 to 0.8, measures how well a set of objects represents a unidimensional latent concept. Cronbach’s alpha values for all constructs exceeded the commonly accepted threshold of 0.70, indicating satisfactory internal consistency. Composite reliability, with recommended values greater than 0.7, assesses the dependability of indicators connected with a specific element. While both metrics reflect internal consistency, CR is preferable to Cronbach’s alpha for construct-level assessments in structural equation modeling analysis. In this study, Cronbach’s alpha values ranged from 0.765 to 0.923, and CR values ranged from 0.850 to 0.946 for all constructs, confirming that they exhibit acceptable internal consistency.
Then, construct validity was assessed using a convergent validity technique; the average variance extracted (AVE), which is the grand mean value of the squared loadings of the items relevant to the construct, is the typical metric for proving convergent validity. Validity is the degree to which a construct’s indicators jointly measure. To this extent, a latent construct explains the variation in its indicators. When the AVE value is 0.5 or higher, it indicates that the construct explains over half of the variation in its elements (J. Hair et al., 2016). As described in Table 3, all AVE values are greater than 0.5. This proves that the convergent validity of the constructs of this study is satisfied.
For further analysis of construct validity, the discriminant validity technique will be used in this study. Discriminant validity uses the uniformity and validity of concentration to confirm whether each component is important on its own without interfering with other factors. The Fornell and Larcker approach is used to evaluate discriminant validity, which is a crucial aspect of measurement model reliability and validity (Fornell & Larcker, 1981). This method compares the square root of the AVE of a construct to the correlations between other constructs. The diagonal value must be bigger than the correlations between other constructs. According to Table 4, the AVE for each construct exceeds the correlations between that construct and any other construct in this study model. For example, TR exhibited a square root of AVE of 0.767, which is significantly higher than its correlations with other constructs. It indicates that the constructs explain more variance in their respective items than they share with other constructs. Therefore, even beyond the standard AVE values, the Fornell and Larcker criterion confirms that this measurement model has strong discriminant validity.
Also, Variance Inflation Factor (VIF) values were computed utilizing Squared Multiple Correlations (SMC) acquired from AMOS to evaluate multicollinearity among the latent components. The findings show that all constructs’ VIF values (TR = 1.25, PE = 1.57, PU = 1.65, AT = 1.63, BI = 1.22) are significantly below the suggested cutoff of 5. VIF values less than 5 indicate that multicollinearity is not an issue (J. F. Hair et al., 2019). As a result, the constructs in this study are independent, guaranteeing the objectivity of the structural model’s prediction correlations.
To estimate the cross-loading, the loading of each indicator should be higher than the loadings of its corresponding variables’ indicators. According to Table 5, the cross-loading criterion is perfect; most of the items have values more than (0.7) and their highest value is when compared with other items.

4.2. Model Fit Measures

The model fit was assessed through eight indices: CMIN/DF, Root Mean Square Error of the Approximation (RMSEA), Comparative Fit Index (CFI), Normed Fit Index (NFI), Tucker-Lewis Index (TLI), Incremental Fit Index (IFI), Parsimony- Goodness Measures (PGFI), Goodness-of-Fit Index (GFI). Therefore, this study confirms the model fit (Table 6) validity according to J. F. Hair et al. (2017).
According to the above values, the overall fit indices indicate that the model has a good fit for the data. The CMIN/DF and RMSEA values fall within the acceptable range, and the incremental measures (CFI, NFI, TLI, IFI), along with the parsimony-adjusted measures (PGFI, GFI), all meet or exceed the recommended thresholds. This comprehensive set of indices confirms that the proposed model is strong enough and provides an adequate representation of the study data.

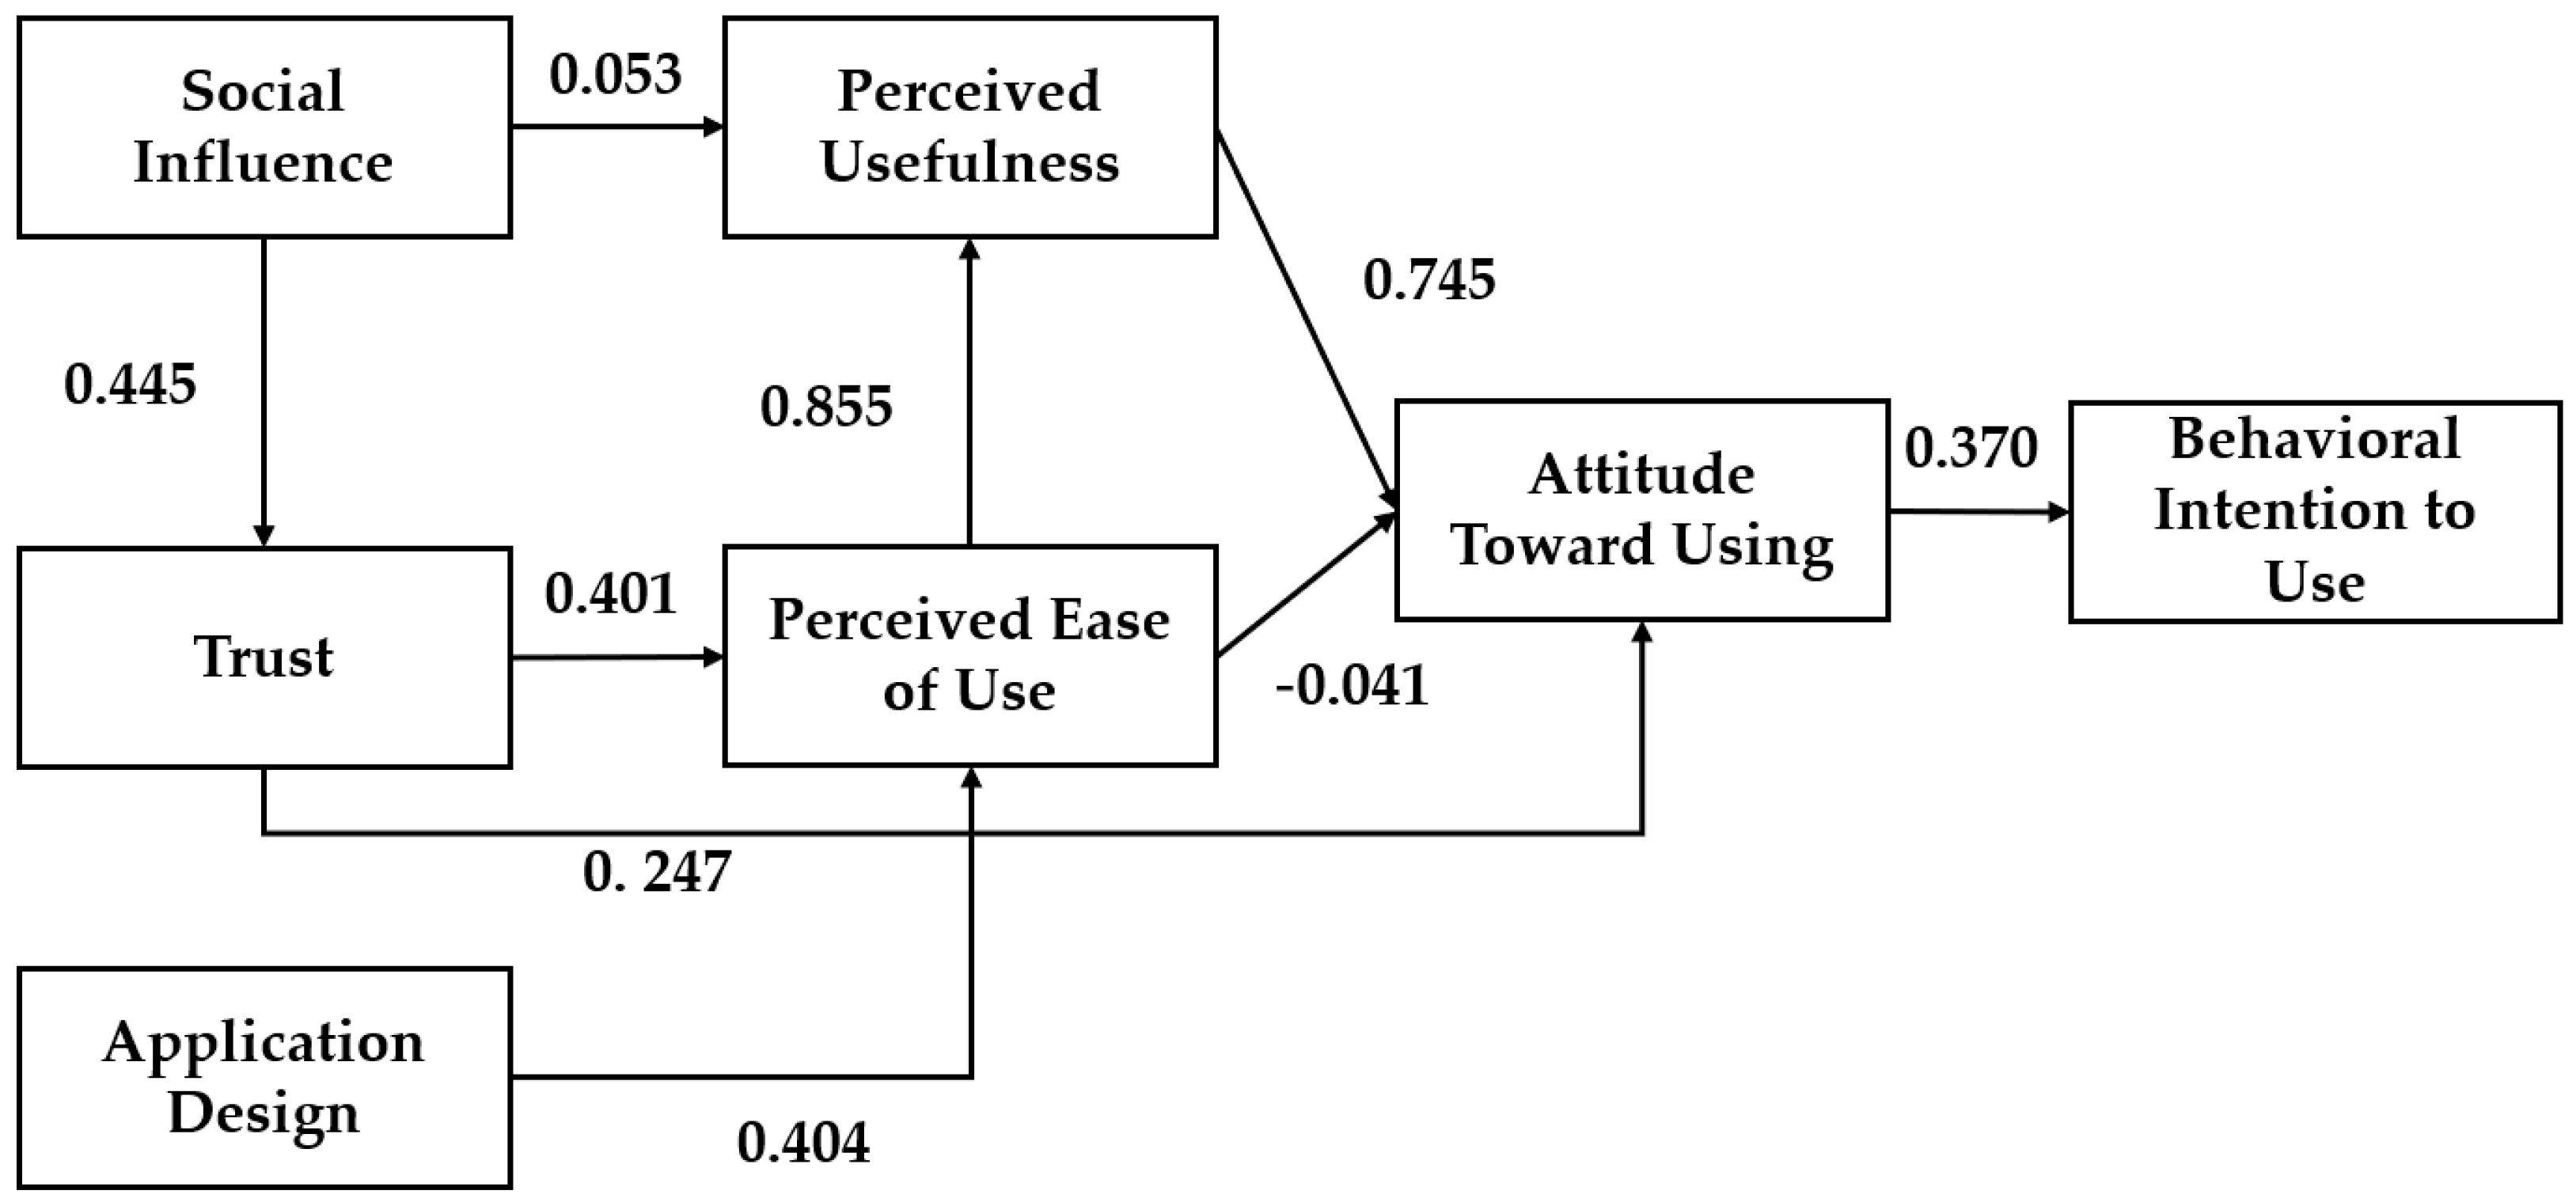
4.3. Structural Model Assessment

The structural model was evaluated by calculating the disparity between dependent variables. According to the overall model fit indices, the indication is that the structural model has a good fit for the data. The CMIN/DF = 2.033 and RMSEA = 0.071 confirms that those values fall within the acceptable range and the incremental measures (CFI = 0.929, NFI = 0.908, TLI = 0.907, IFI = 0.931), along with the parsimony-adjusted measures (PGFI = 0.787, GFI = 0.909), all meet or exceed the recommended thresholds. This comprehensive set of indices confirms that the proposed structural model is strong enough and provides an adequate representation of the study data. Also, it is estimated primarily by path coefficients. A path coefficient in a structural model is a number that shows how two variables are related to one another. It shows how the value of one variable changes by one standard deviation unit when the value of another variable changes. Typically, path coefficients fall between −1 and 1, where values nearer −1 signify a strong negative link and values nearer 1 indicate a strong positive relationship. Therefore, it can clearly explain that the constructs of the proposed model have almost strong positive relationships.
According to the path analysis (see Figure 4), Table 7 found each hypothesis by estimating the p-values and the path coefficients. It can be noted that six hypotheses are supported, while the remaining three are not supported, which in turn indicates that most of the paths are significant between the independent and dependent variables.
The results of this paper found that AT (β = 0.370, CR = 5.481, p < 0.001) has a positive and significant impact on BI, suggesting that Hypothesis 1 is supported in this analysis (see Table 7). It clearly describes how attitude has been found to have a significant favorable impact on the behavioral intention of users who plan to utilize AI chatbot applications in the government sector in Sri Lanka.
Also, PU (β = 0.745, CR = 5.865, p < 0.001) has a positive and significant impact on AT, supporting Hypothesis 2. On the other hand, PE (β = −0.041, CR = −0.228, p = 0.820) has a negative and not satisfactory impact on AT, not supporting Hypothesis 3. The three constructs of PU, PE, and TR show mixed effects on the user attitude toward sustainable AI chatbot application adoption in government administration services. These effects are related to the user’s trust and beliefs. User attitude is important in influencing the right behavior and action. The three constructs affect different attitudes. High trust will increase with ease of use, and ease of use will increase usefulness, and then usefulness will increase user attitude positively and motivate them to act positively to use AI chatbot applications in the Sri Lanka government sector.
PE (β = 0.855, CR = 6.22, p < 0.001) has a positive and significant impact on PU, supporting Hypothesis 4. It explains the path between PE and PU. The relation between these two constructs is very strong; it is the core reason for the user’s attitude toward AI chatbot application adoption. PE positively influences the users’ PU; minimizing the technology complexity increases the belief that AI-based applications are efficient to use and helpful for government administration services.
TR (β = 0.247, CR = 1.777, p = 0.076) has a positive impact on AT, though this result is not statistically significant, thus not supporting Hypothesis 5. The relationship between TR and PE is also positive and significant (β = 0.401, CR = 4.03, p < 0.001), supporting Hypothesis 6. This explains the relationship between perceived ease of use and trust. According to this study, trust is a crucial concept that influences other concepts and influences the choices made by consumers. Risk and trust are inversely correlated; as trust rises, the estimated risk falls. Building trust is the key to boosting confidence in modern technology and its ability to be used more effectively with less effort. Perceived ease of use is a primary component of this model that characterizes the degree of complexity of AI chatbot applications for use in the government sector.
With respect to PE, AD (β = 0.404, CR = 4.829, p < 0.001) has a positive and not significant impact on PE, supporting Hypothesis 7. This outlines the relationship between perceived ease of use and application design and appearance. The results demonstrate that the application design has a favorable impact on PE for the AI chatbot application; a well-designed chatbot application enhances user satisfaction through positive interaction and use. SI (β = 0.053, CR = 0.56, p = 0.575) has a positive and not satisfactory impact on PU, not supporting Hypothesis 8. However, SI (β = 0.445, CR = 4.217, p < 0.001) has a positive and significant impact on TR, supporting Hypothesis 9. These results describe the path between social influence and PE and trust. This path shows the positive effect of social influence on PU and trust, which explains that social factors have a relationship with modern technological applications and services (positive or negative) in the government sector. The relations and communications between people on social media, in work, in the markets, or any other place can significantly impact and motivate people to trust and use new technological applications in government sector organizations.

4.4. Direct Effect, Indirect Effect, and Total Effect

The significance of the mediated effect is accessed by a bootstrapping method. It was employed to derive the direct, indirect, and total effects in this model. The results (Table 8) show that TR indirectly influences PU (β = 0.343, p < 0.01) and BI (β = 0.18, p < 0.01), confirming its mediating role in AI chatbot adoption. Additionally, SI has a strong effect on TR (β = 0.445, p < 0.01) and indirectly influences PU (β = 0.153, p < 0.01), AT (β = 0.256, p < 0.01), and BI (β = 0.095, p < 0.01). Furthermore, AD enhances PE (β = 0.404, p < 0.01) and PU (β = 0.345, p < 0.01), which indirectly contribute to attitude formation and adoption intention. These findings highlight that trust, social influence, and application design significantly shape the acceptance of AI chatbots in public administration services in Sri Lanka.

5. Discussion

In recent years, the integration of artificial intelligence, particularly chatbot applications, has surged within the government sector, offering innovative solutions for enhancing citizen engagement and streamlining public services. However, the adoption of these technologies has faced significant challenges, as many users exhibit resistance to interacting with AI-driven chatbots. This paper evaluated the usability of chatbot technology and identified the factors influencing user acceptance in a government administration service delivery context-based chatbot application in a Sri Lankan context and designed and validated a new research model (extended TAM) for successful AI technological adoption which can be used for future initiatives in many developing countries. Given the increasing prevalence of AI tools and the limited existing research to guide this inquiry, the development of a new model seeks to provide fresh insights and support the broader acceptance of AI chatbot applications. A survey was conducted among a diverse group of government administration service users, employing the SEM approach to analyze the collected data.
In the context of social sciences, these results reaffirm the necessity of integrating technological tools in both the public and private sectors and adjusting to the swift advancements in technology to promote the long-term sustainable adoption of AI technology. However, we contend that developing sustainable AI technological initiatives in the government administration service necessitates more than just implementing the newest technologies; rather, it calls for a thorough and calculated integration that considers social factors, application design and appearance, and trust in the solution of challenging issues. These components must be considered by policy professionals who can handle today’s issues, protect the public interest, and continue government organizations’ service delivery to the public by effectively utilizing contemporary technological initiatives.
The survey results revealed that several new factors significantly influence users’ behavioral intentions towards AI chatbot application in government administration service delivery. According to research (Matemba & Li, 2017), TR factor can motivate individuals to adopt technology. Also, strong partial correlations between risk and acceptance can be demonstrated based on research (Eiser et al., 2006). Similarly, the findings of this study highlight that TR has a strong direct impact on PE, while PE directly impacts PU, which positively impacts user AT and decision making, ultimately leading to a change users’ BIs to an acceptance of AI chatbots in government service delivery. Also, a group of researchers (Chaouali et al., 2016) found that social influence truly affects technology and reflects the degree of faith in it. Similarly, some studies discovered that the social environment and consumer decisions significantly influence user decisions and behaviors (Chaouali et al., 2016; Fulk et al., 1995; Fulk & Yuan, 2017; Malhotra & Galletta, 1999). Additionally, the results of this study indicate that the new external construct, SI, has a strong impact on TR and plays a crucial role in fostering trust. Respondents largely expressed confidence in their safety and trustworthiness when interacting with these AI-driven systems in government sector in Sri Lanka based on the social recommendations. Also, AD positively influences PE when focused on the adoption of an acceptance of the use of AI chatbot applications in government sector organizations. Therefore, it confirms the importance of application design/appearance and considering the multi-national language environment in Sri Lankan society.
Moreover, this research makes a significant contribution by demonstrating that TAM (F. Davis, 1985; F. D. Davis, 1989) is sufficient to explain how we can extend the model with external factors such as TR, SI, and AD to identify the adoption of the latest technology in different environments. The new research model was built around nine hypotheses and focused on analyzing the relationships between the mentioned external factors and existing TAM core factors. The results prove that most of the hypotheses proposed are evidence of the positive influence of trust, application design and appearance, and social influence on several constructs focused on behavioral intention regarding the acceptance of AI chatbot applications in government administration services for sustainability.
However, Hypotheses H3, H5, and H8 were not accepted according to the results of this study. Hypothesis H3 explains the relationship between PE to AT. The technology acceptance model (F. Davis, 1985) suggests that PE significantly influences AT towards technology. Therefore, we hypothesized that if a technology is perceived as easy to use, users would develop a more favorable attitude toward adopting it. The failure to prove this correlation may exhibit the nature of the government sector in Sri Lanka, where citizens might be less concerned with perceived ease of use due to a higher degree of trust on chatbots (e.g., accessing concurrent information services). Citizens may prioritize usefulness and trustworthiness over perceived ease of use due. Additionally, many government employees and citizens may already have experience with e-services from the private sector and, as a result, the perceived ease of use due factor might not be as influential on their attitude as originally expected in the Sri Lankan context. Enhancing capabilities/accuracy over ease of use and promoting utilities/abilities rather than ease of use can be introduced as alternative policy measures to enhance AI chatbot adoption in Sri Lanka’s public sector.
Similarly, Hypothesis H5 explains the relationship between TR and AT. According to prior research studies, trust in technology acceptance is essential, particularly when related to data privacy and security. It was identified as a fundamental determinant of users’ attitudes towards adopting new technologies. However, the results of this study interpret a non-significant relationship between trust and attitude, which could be due to the specific circumstances of Sri Lanka’s e-government environment. In a country where e-government services are still in the process of being integrated and treated, citizens may have developed practical attitudes toward the new technology, focusing more on accessibility and functionality than on trust factors. The reputation and history of service delivery of government organizations may also underestimate the role of trust in influencing citizens’ attitudes towards e-government solution acceptance. Also, some alternative policy measures can be taken based on trust to enhance AI chatbot adoption. Enhancing transparency and establishing strong data security must be taken with those policy measures to build citizens’ trust.
Finally, Hypothesis H8 describes the relationship between SI and PU. SI is a widely recognized factor in technology acceptance models. We hypothesized that social influence (e.g., recommendations from colleagues, elders, and leaders) would positively affect individuals’ perceptions of the usefulness of AI chatbots in government administration services. The lack of support for this hypothesis indicates that SI may have a lower direct impact on perceived usefulness in the context of government service adoption in Sri Lanka. This might happen because perceived usefulness in public sector technology adoption is more likely influenced by individual user experiences and task-oriented needs rather than external social pressures. From the perspective of Sri Lanka’s e-government, users might focus on the practical benefits of using AI chatbots such as ease of access and speedy service delivery rather than how others perceive these systems. Additionally, government employees and citizens might have minimal levels of perceived social influence to adopt new technologies such as AI chatbots, especially if they are still relatively modern and not extensively used so far. Some policy measures can be taken in this scenario, such as focusing on performance/benefits over the social popularity of AI chatbot applications.

6. Conclusions

6.1. Research Implications

As a developing country, the government of Sri Lanka and government policy makers should consider the results achieved in this study for the future sustainability in AI technological initiatives in government administration services. Initially, all AI-based digital government initiatives must be aligned with the long-term sustainability goals of Sri Lanka. The implementation of modern technological movements like AI-based chatbot applications should take consumers’ trust into consideration, supported by government regulation and customer experience. This means that the government must prioritize customer trust in all digital government applications. To build up people’s trust in digital interactions, governments may provide transparency by describing how chatbots operate, what data are gathered and protected, and how user privacy is maintained. The Sri Lankan government may implement strong cybersecurity measures to support and regulate the use of any AI-based applications and initiate suitable laws and regulations to control the usage, which will ultimately help to build user trust. In this scenario, the government can organize public awareness programs on such new digital technologies to emphasize their security and reliability regarding sensitive public data. Also, regular auditing methods, independent reviews, and public feedback systems can be implemented to ensure that AI chatbot systems remain ethical and effective at processing sensitive public related data, while preserving public trust.
Secondly, enhancing application design and appearance can improve user familiarity and adoption rates significantly. The government should make sure that AI chatbots have a simple, user friendly design with comfortable navigation. As described previously, to accommodate varied populations, accessibility features such as multilingual support in voice assistance and important possibilities for disabled users must be integrated. Also, consistency among different platforms should be maintained, especially on mobile applications, government websites and information portals, and social media networks, to support higher usability and acceptability of AI chatbot systems.
Finally, based on the outcomes of social influence, the government may take steps to promote AI chatbots actively through digital awareness promotions. Popular influencers and well-known government policy makers and officers can make endorsements on government AI solutions to build and enhance social confidence ultimately. Presenting real-world accomplishments can boost credibility and inspire wider AI solution adoption. Public engagement measures, such as dynamic chatbot exhibitions and incentives to encourage early adopters, can help to increase user interest. Governments can speed up the transition to AI-powered public service engagements by cultivating a culture that normalizes and encourages chatbot use in e-government services.
These recommendations can help guide policymakers and application designers in developing a strong, protected, and trustworthy framework for AI adoption in government services, supporting the sustainability of digital government initiatives in Sri Lanka.

6.2. Limitations and Future Research

This study is only designed to measure the intention of users, not the actual usage rate of such modern technology. This provides direction for future research to use actual usage data to support our findings. To strengthen the validity of this study’s findings, future research should move beyond user perception survey data and incorporate real-world adoption metrics. In that scenario, future researchers should monitor the usage information of AI chatbots in government portals over a reasonable time duration (preferably six months to one year). Then, pre-adoption expectations (survey data on user expectations) should be compared with actual post-adoption behaviors (actual usage statistics) to obtain validated conclusions. Also, it is recommended to check the usage patterns of different AI chatbot versions by different solution interfaces. This can be helpful to check the user behavior based on application design implications. Furthermore, it is important to note that the results of the study can be improved further by increasing the sample size for the users of the government administration services in Sri Lanka.

Author Contributions

Conceptualization, Y.A.; methodology, A.S.R.; software, A.S.R.; validation, Y.A. and T.D.H.N.N.; formal analysis, A.S.R.; investigation, A.S.R.; resources, A.S.R.; data curation, A.S.R.; writing—original draft preparation, A.S.R.; writing—review and editing, T.D.H.N.N.; visualization, A.S.R.; supervision, Y.A; project administration, Y.A.; funding acquisition, Y.A. All authors have read and agreed to the published version of the manuscript.

Funding

This research received no external funding.

Institutional Review Board Statement

Ethical review and approval were waived for this study due to Hanyang University Research Ethics Policy exemptions (https://irb.hanyang.ac.kr/02_guide/guide02.html, accessed on 13 March 2025).

Informed Consent Statement

Informed consent was obtained from all subjects involved in the study.

Data Availability Statement

The data presented in this study are available on request from the corresponding author due to privacy and ethical reasons.

Conflicts of Interest

The authors declare no conflict of interest.

References

  1. Adams, D. A., Nelson, R. R., & Todd, P. A. (1992). Perceived usefulness, ease of use, and usage of information technology: A replication. MIS Quarterly, 16, 227–247. [Google Scholar] [CrossRef]
  2. Ajzen, I., & Fishbein, M. (1970). The prediction of behavior from attitudinal and normative variables. Journal of Experimental Social Psychology, 6, 466–487. [Google Scholar] [CrossRef]
  3. Ajzen, I., & Fishbein, M. (1977). Attitude-behavior relations: A theoretical analysis and review of empirical research. Psychological Bulletin, 84, 888–918. [Google Scholar] [CrossRef]
  4. Ajzen, I., & Fishbein, M. (2000). Attitudes and the attitude-behavior relation: Reasoned and automatic processes. European Review of Social Psychology, 11, 1–33. [Google Scholar] [CrossRef]
  5. Ajzen, I., & Fishbein, M. (2005). The influence of attitudes on behavior. In The handbook of attitudes (Vol. 173, pp. 173–221). Lawrence Erlbaum Associates Publishers. [Google Scholar]
  6. Alagarsamy, S., & Mehrolia, S. (2023). Exploring chatbot trust: Antecedents and behavioural outcomes. Heliyon, 9(5), e16074. [Google Scholar] [CrossRef]
  7. Alalwan, A., Baabdullah, A., Rana, N., Tamilmani, K., & Dwivedi, Y. (2018). Examining adoption of mobile internet in Saudi Arabia: Extending TAM with perceived enjoyment, innovativeness and trust. Technology in Society, 55, 100–110. [Google Scholar] [CrossRef]
  8. Alam, A., & Saputro, I. A. (2022). A qualitative analysis of user interface design on a Sharia Fintech application based on technology acceptance model (TAM). Jurnal TAM (Technology Acceptance Model), 13(1), 9. [Google Scholar] [CrossRef]
  9. Alenazy, W., Al-Rahmi, W., & Khan, M. S. (2019). Validation of TAM model on social media use for collaborative learning to enhance collaborative authoring. IEEE Access, 7, 71550–71562. [Google Scholar] [CrossRef]
  10. Alzahrani, L., Al-Karaghouli, W., & Weerakkody, V. (2017). Analysing the critical factors influencing trust in e-government adoption from citizens’ perspective: A systematic review and a conceptual framework. International Business Review, 26(1), 164–175. [Google Scholar] [CrossRef]
  11. Bagozzi, R. (1981). Attitudes, intentions, and behavior: A test of some key hypotheses. Journal of Personality and Social Psychology, 41, 607–627. [Google Scholar] [CrossRef]
  12. Baharum, A., Amirul, S. M., Yusop, N. M. M., Halamy, S., Fabeil, N. F., & Ramli, R. Z. (2017, November 28–30). Development of questionnaire to measure user acceptance towards user interface design. Advances in Visual Informatics: 5th International Visual Informatics Conference, IVIC 2017, Bangi, Malaysia. Proceedings 5. [Google Scholar]
  13. Banjarnahor, L. (2017). Factors influencing purchase intention towards consumer-to-consumer e-commerce. Intangible Capital, 13, 948. [Google Scholar] [CrossRef]
  14. Bonn, M. A., Kim, W. G., Kang, S., & Cho, M. (2016). Purchasing wine online: The effects of social influence, perceived usefulness, perceived ease of use, and wine involvement. Journal of Hospitality Marketing & Management, 25(7), 841–869. [Google Scholar]
  15. Burke, C. S., Sims, D. E., Lazzara, E. H., & Salas, E. (2007). Trust in leadership: A multi-level review and integration. The Leadership Quarterly, 18(6), 606–632. [Google Scholar] [CrossRef]
  16. Calisir, F., & Calisir, F. (2004). The relation of interface usability characteristics, perceived usefulness, and perceived ease of use to end-user satisfaction with enterprise resource planning (ERP) systems. Computers in Human Behavior, 20, 505–515. [Google Scholar] [CrossRef]
  17. Celik, A., Huseyinli, T., & Can, M. (2022). What are the drivers of using chatbots in online shopping a cross-country analysis. Journal of Business Research—Turk, 14, 2201–2222. [Google Scholar] [CrossRef]
  18. Chaouali, W., Ben Yahia, I., & Souiden, N. (2016). The interplay of counter-conformity motivation, social influence, and trust in customers’ intention to adopt Internet banking services: The case of an emerging country. Journal of Retailing and Consumer Services, 28, 209–218. [Google Scholar] [CrossRef]
  19. Chen, T., Gascó-Hernandez, M., & Esteve, M. (2023). The adoption and implementation of artificial intelligence chatbots in public organizations: Evidence from U.S. state governments. The American Review of Public Administration, 54(3), 255–270. [Google Scholar] [CrossRef]
  20. Cheng, M., Li, X., & Xu, J. (2022). Promoting healthcare workers’ adoption intention of artificial-intelligence-assisted diagnosis and treatment: The chain mediation of social influence and human–computer trust. International Journal of Environmental Research and Public Health, 19(20), 13311. [Google Scholar] [CrossRef]
  21. Chiancone, C. (2023). Understanding the role of AI in government decision making. Available online: https://www.linkedin.com/pulse/understanding-role-ai-government-decision-making-chris-chiancone (accessed on 15 January 2025).
  22. Cohen, L., Manion, L., & Morrison, K. (2017). Research methods in education (8th ed.). Routledge. [Google Scholar] [CrossRef]
  23. Cuel, R., & Ferrario, R. (2009). The impact of technology in organizational communication. In Nursing and clinical informatics: Socio-technical approaches. IGI Global. [Google Scholar] [CrossRef]
  24. Davis, F. (1985). A technology acceptance model for empirically testing new end-user information systems [Doctoral dissertation, Massachusetts Institute of Technology]. [Google Scholar]
  25. Davis, F., Bagozzi, R., & Warshaw, P. (1989). User acceptance of computer technology: A comparison of two theoretical models. Management Science, 35, 982–1003. [Google Scholar] [CrossRef]
  26. Davis, F. D. (1989). Perceived usefulness, perceived ease of use, and user acceptance of information technology. MIS Quarterly, 13(3), 319–340. [Google Scholar] [CrossRef]
  27. Davis, F. D., & Venkatesh, V. (1996). A critical assessment of potential measurement biases in the technology acceptance model: Three experiments. International Journal of Human-Computer Studies, 45(1), 19–45. [Google Scholar] [CrossRef]
  28. Delone, W., & McLean, E. (1992). Information systems success: The quest for the dependent variable. Information Systems Research, 3, 60–95. [Google Scholar] [CrossRef]
  29. Delone, W., & McLean, E. (2003). The DeLone and McLean model of information systems success: A ten-year update. Journal of Management Information Systems, 19, 9–30. [Google Scholar] [CrossRef]
  30. Dhagarra, D., Goswami, M., & Kumar, G. (2020). Impact of trust and privacy concerns on technology acceptance in healthcare: An indian perspective. International Journal of Medical Informatics, 141, 104164. [Google Scholar] [CrossRef]
  31. Edo, O. C., Ang, D., Etu, E.-E., Tenebe, I., Edo, S., & Diekola, O. A. (2023). Why do healthcare workers adopt digital health technologies—A cross-sectional study integrating the TAM and UTAUT model in a developing economy. International Journal of Information Management Data Insights, 3(2), 100186. [Google Scholar] [CrossRef]
  32. Effendy, F., Hurriyati, R., & Hendrayati, H. (2021, August 8). Perceived usefulness, perceived ease of use, and social influence: Intention to use e-wallet. 5th Global Conference on Business, Management and Entrepreneurship (GCBME 2020), Bandung, Indonesia. [Google Scholar]
  33. Eiser, J., Miles, S., & Frewer, L. (2006). Trust, perceived risk, and attitudes toward food technologies. Journal of Applied Social Psychology, 32, 2423–2433. [Google Scholar] [CrossRef]
  34. Faqih, K. M. (2020). The influence of perceived usefulness, social influence, internet self-efficacy and compatibility ON USERS’INTENTIONS to adopt e-learning: Investigating the moderating effects of culture. IJAEDU-International E-Journal of Advances in Education, 5(15), 300–320. [Google Scholar] [CrossRef]
  35. Fishbein, M., & Ajzen, I. (1975). Belief, attitude, intention and behaviour: An introduction to theory and research. Addison-Wesley Publishing Company. [Google Scholar]
  36. Fornell, C., & Larcker, D. F. (1981). Evaluating structural equation models with unobservable variables and measurement error. Journal of Marketing Research, 18(1), 39–50. [Google Scholar] [CrossRef]
  37. Fulk, J., Schmitz, J., & Ryu, D. (1995). Cognitive elements in the social construction of communication technology. Management Communication Quarterly, 8, 259–288. [Google Scholar] [CrossRef]
  38. Fulk, J., & Yuan, Y. C. (2017). Social construction of communication technology. Academy of Management Journal, 36, 921–950. [Google Scholar] [CrossRef]
  39. Gefen, D., Karahanna, E., & Straub, D. W. (2003). Trust and TAM in online shopping: An integrated model. MIS Quarterly, 27, 51–90. [Google Scholar] [CrossRef]
  40. Gefen, D., & Straub, D. (2000). The relative importance of perceived ease of use in is adoption: A study of e-commerce adoption. Journal of the Association for Information Systems, 1, 8. [Google Scholar] [CrossRef]
  41. Golbeck, J., & Kuter, U. (2009). The ripple effect: Change in trust and its impact over a social network. In Computing with social trust. Human–computer interaction series (pp. 169–181). Springer. [Google Scholar] [CrossRef]
  42. Gopinath, K., & Kasilingam, D. (2023). Antecedents of intention to use chatbots in service encounters: A meta-analytic review. International Journal of Consumer Studies, 47(6), 2367–2395. [Google Scholar] [CrossRef]
  43. Gorsuch, R., & Ortberg, J. (1983). Moral obligation and attitudes: Their relation to behavioral intentions. Journal of Personality and Social Psychology, 44, 1025–1028. [Google Scholar] [CrossRef]
  44. Gould, J. D., & Lewis, C. H. (1985). Designing for usability: Key principles and what designers think. Commun. ACM, 28, 300–311. [Google Scholar]
  45. Granić, A., & Marangunić, N. (2019). Technology acceptance model in educational context: A systematic literature review. British Journal of Educational Technology, 50, 2572–2593. [Google Scholar] [CrossRef]
  46. Hackbarth, G., Grover, V., & Yi, M. (2003). Computer playfulness and anxiety: Positive and negative mediators of the system experience effect on perceived ease of use. Information & Management, 40, 221–232. [Google Scholar] [CrossRef]
  47. Hair, J., Hult, G. T. M., Ringle, C., & Sarstedt, M. (2016). A primer on partial least squares structural equation modeling (PLS-SEM) (2nd ed.). Sage Publications. [Google Scholar]
  48. Hair, J., Hult, G. T. M., Ringle, C., & Sarstedt, M. (2022). A primer on partial least squares structural equation modeling (PLS-SEM). Sage Publications. [Google Scholar]
  49. Hair, J. F., Hult, G. T. M., Ringle, C. M., Sarstedt, M., & Thiele, K. O. (2017). Mirror, mirror on the wall: A comparative evaluation of composite-based structural equation modeling methods. Journal of the Academy of Marketing Science, 45, 616–632. [Google Scholar] [CrossRef]
  50. Hair, J. F., Risher, J. J., Sarstedt, M., & Ringle, C. M. (2019). When to use and how to report the results of PLS-SEM. European Business Review, 31(1), 2–24. [Google Scholar] [CrossRef]
  51. Hasija, A., & Esper, T. (2022). In artificial intelligence (AI) we trust: A qualitative investigation of AI technology acceptance. Journal of Business Logistics, 43, 388–412. [Google Scholar] [CrossRef]
  52. Haverila, M. J., McLaughlin, C., & Haverila, K. (2023). The impact of social influence on perceived usefulness and behavioral intentions in the usage of non-pharmaceutical interventions (NPIs). International Journal of Healthcare Management, 16(1), 145–156. [Google Scholar] [CrossRef]
  53. Hillemann, D. (2023). Navigating the challenges of implementing artificial intelligence in the public sector: An in-depth analysis. Available online: https://dhillemann.medium.com/navigating-the-challenges-of-implementing-artificial-intelligence-in-the-public-sector-an-in-depth-cb714fe6616b (accessed on 15 January 2025).
  54. Hoehle, H., & Venkatesh, V. (2015). Mobile application usability. Conceptualization and instrument development. MIS Quarterly, 39(2), 435–472. Available online: https://www.jstor.org/stable/26628361 (accessed on 15 January 2025). [CrossRef]
  55. Hong, S. J. (2025). What drives AI-based risk information-seeking intent? Insufficiency of risk information versus (Un)certainty of AI chatbots. Computers in Human Behavior, 162, 108460. [Google Scholar] [CrossRef]
  56. Hsu, C.-L., & Lu, H.-P. (2004). Why do people play on-line games? An extended TAM with social influences and flow experience. Information & Management, 41, 853–868. [Google Scholar] [CrossRef]
  57. Huang, M.-H., & Rust, R. (2018). Artificial intelligence in service. Journal of Service Research, 21, 109467051775245. [Google Scholar] [CrossRef]
  58. Igbaria, M., Schiffman, S. J., & Wieckowski, T. J. (1994). The respective roles of perceived usefulness and perceived fun in the acceptance of microcomputer technology. Behaviour & Information Technology, 13, 349–361. [Google Scholar]
  59. Ikhsan, R. B., Fernando, Y., Prabowo, H., Yuniarty, Gui, A., & Kuncoro, E. A. (2025). An empirical study on the use of artificial intelligence in the banking sector of Indonesia by extending the TAM model and the moderating effect of perceived trust. Digital Business, 5(1), 100103. [Google Scholar] [CrossRef]
  60. Ilyas, M., ud din, A., Haleem, M., & Ahmad, I. (2023). Digital entrepreneurial acceptance: An examination of technology acceptance model and do-it-yourself behavior. Journal of Innovation and Entrepreneurship, 12(1), 15. [Google Scholar] [CrossRef]
  61. Jarvenpaa, S., Tractinsky, N., & Vitale, M. (2000). Consumer trust in an internet store. International Journal of Information Technology and Management—IJITM, 1, 45–71. [Google Scholar] [CrossRef]
  62. Karahanna, E., & Straub, D. W. (1999). The psychological origins of perceived usefulness and ease-of-use. Information & Management, 35, 237–250. [Google Scholar]
  63. Kasilingam, D., & Krishna, R. (2022). Understanding the adoption and willingness to pay for internet of things services. International Journal of Consumer Studies, 46(1), 102–131. [Google Scholar] [CrossRef]
  64. Kelly, S., Kaye, S.-A., & Oviedo-Trespalacios, O. (2023). What factors contribute to the acceptance of artificial intelligence? A systematic review. Telematics and Informatics, 77, 101925. [Google Scholar] [CrossRef]
  65. Kesharwani, A., & Bisht, S. (2012). The impact of trust and perceived risk on Internet banking adoption in India. International Journal of Bank Marketing, 30, 303–322. [Google Scholar] [CrossRef]
  66. Kunz, W. H., & Wirtz, J. (2023). AI in customer service: A service revolution in the making. In Artificial intelligence in customer service: The next frontier for personalized engagement (pp. 15–32). Springer. [Google Scholar]
  67. Kurniawan, I. A., Mugiono, M., & Wijayanti, R. (2022). The effect of perceived usefulness, perceived ease of use, and social influence toward intention to use mediated by Trust. Jurnal Aplikasi Manajemen, 20(1), 117–127. [Google Scholar] [CrossRef]
  68. Kurosu, M., & Kashimura, K. (1995, May 7–11). Apparent usability vs. inherent usability: Experimental analysis on the determinants of the apparent usability. Conference companion on Human factors in Computing Systems, Denver, CO, USA. [Google Scholar]
  69. Landis, D., Triandis, H., & Adamopoulos, J. (1978). Habit and behavioral intentions as predictors of social behavior. Journal of Social Psychology, 106, 227–237. [Google Scholar] [CrossRef]
  70. Ltifi, M. (2023). Trust in the chatbot: A semi-human relationship. Future Business Journal, 9(1), 109. [Google Scholar] [CrossRef]
  71. Lun, L., Zetian, D., Hoe, T. W., Juan, X., Jiaxin, D., & Fulai, W. (2024). Factors influencing user intentions on interactive websites: Insights from the technology acceptance model. IEEE Access, 12, 122735–122756. [Google Scholar] [CrossRef]
  72. Malhotra, Y., & Galletta, D. F. (1999, January 5–8). Extending the technology acceptance model to account for social influence: Theoretical bases and empirical validation. Proceedings of the 32nd Annual Hawaii International Conference on Systems Sciences, Maui, HI, USA. HICSS-32. Abstracts and CD-ROM of Full Papers. [Google Scholar]
  73. Mansoor, M. (2021). Citizens’ trust in government as a function of good governance and government agency’s provision of quality information on social media during COVID-19. Government Information Quarterly, 38, 101597. [Google Scholar] [CrossRef]
  74. Maria, V., & Sugiyanto, L. B. (2023). Perceived usefulness, perceived ease of use, perceived enjoyment on behavioral intention to use through trust. Indonesian Journal of Multidisciplinary Science, 3, 1–7. [Google Scholar] [CrossRef]
  75. Matemba, E., & Li, G. (2017). Consumers’ willingness to adopt and use WeChat wallet: An empirical study in South Africa. Technology in Society, 53, 55–68. [Google Scholar] [CrossRef]
  76. Mathieson, K. (1991). Predicting user intentions: Comparing the technology acceptance model with the theory of planned behavior. Information Systems Research, 2, 173–191. [Google Scholar] [CrossRef]
  77. McCloskey, D. (2006). The importance of ease of use, usefulness, and trust to online consumers: An examination of the technology acceptance model with older customers. Journal of Organizational and End User Computing, 18, 47–65. [Google Scholar] [CrossRef]
  78. Medaglia, R., & Tangi, L. (2022, October 4–7). The adoption of Artificial Intelligence in the public sector in Europe: Drivers, features, and impacts. ACM International Conference Proceeding Series, ICEGOV’22: Proceedings of the 15th International Conference on Theory and Practice of Electronic Governance, Guimarães, Portugal. [Google Scholar]
  79. Mikalef, P., Lemmer, K., Schaefer, C., Ylinen, M., Fjørtoft, S. O., Torvatn, H. Y., Gupta, M., & Niehaves, B. (2023). Examining how AI capabilities can foster organizational performance in public organizations. Government Information Quarterly, 40(2), 101797. [Google Scholar] [CrossRef]
  80. Mostafa, R. B., & Kasamani, T. (2022). Antecedents and consequences of chatbot initial trust. European Journal of Marketing, 56(6), 1748–1771. [Google Scholar] [CrossRef]
  81. Nakisa, B., Ansarizadeh, F., Oommen, P., & Kumar, R. (2023). Using an extended technology acceptance model to investigate facial authentication. Telematics and Informatics Reports, 12, 100099. [Google Scholar] [CrossRef]
  82. Natasia, S. R., Wiranti, Y. T., & Parastika, A. (2022). Acceptance analysis of NUADU as e-learning platform using the Technology Acceptance Model (TAM) approach. Procedia Computer Science, 197, 512–520. [Google Scholar] [CrossRef]
  83. Oldeweme, A., Märtins, J., Westmattelmann, D., & Schewe, G. (2021). The role of transparency, trust, and social influence on uncertainty reduction in times of pandemics: Empirical study on the adoption of COVID-19 tracing apps. Journal of Medical Internet Research, 23(2), e25893. [Google Scholar] [CrossRef]
  84. Omrani, N., Rivieccio, G., Fiore, U., Schiavone, F., & Agreda, S. G. (2022). To trust or not to trust? An assessment of trust in AI-based systems: Concerns, ethics and contexts. Technological Forecasting and Social Change, 181, 121763. [Google Scholar] [CrossRef]
  85. Pesonen, J. A. (2021). ‘Are you ok?’ Students’ trust in a Chatbot providing support opportunities. In International conference on human-computer interaction. Springer. [Google Scholar]
  86. Prabowo, G., & Nugroho, A. (2019). Factors that influence the attitude and behavioral intention of indonesian users toward online food delivery service by the go-food application. Atlantis Press. [Google Scholar] [CrossRef]
  87. Prastiawan, D. I., Aisjah, S., & Rofiaty, R. (2021). The effect of perceived usefulness, perceived ease of use, and social influence on the use of mobile banking through the mediation of attitude toward use. APMBA (Asia Pacific Management and Business Application), 9(3), 243–260. [Google Scholar] [CrossRef]
  88. Przegalinska, A., Ciechanowski, L., Stroz, A., Gloor, P., & Mazurek, G. (2019). In bot we trust: A new methodology of chatbot performance measures. Business Horizons, 62(6), 785–797. [Google Scholar] [CrossRef]
  89. Rice, R. E., & Aydin, C. E. (1991). Attitudes toward new organizational technology: Network proximity as a mechanism for social information processing. Administrative Science Quarterly, 36, 219. [Google Scholar] [CrossRef]
  90. Saade, R., & Bahli, B. (2005). The impact of cognitive absorption on perceived usefulness and perceived ease of use in online learning: An extension of the Technology Acceptance Model. Information & Management, 42, 317–327. [Google Scholar] [CrossRef]
  91. Saif, N., Khan, S. U., Shaheen, I., Alotaibi, F. A., Alnfiai, M. M., & Arif, M. (2024). Chat-GPT; validating Technology Acceptance Model (TAM) in education sector via ubiquitous learning mechanism. Computers in Human Behavior, 154, 108097. [Google Scholar] [CrossRef]
  92. Shareef, M. A., Kumar, V., Kumar, U., & Dwivedi, Y. K. (2011). e-Government Adoption Model (GAM): Differing service maturity levels. Government Information Quarterly, 28(1), 17–35. [Google Scholar] [CrossRef]
  93. Sharma, S., & Agarwal, M. (2024). Impact of AI-based chatbots on faculty performance in higher education institutions. In Innovation in the university 4.0 system based on smart technologies (pp. 83–100). Chapman and Hall/CRC. [Google Scholar]
  94. Sheppard, B., Hartwick, J., & Warshaw, P. (1988). The theory of reasoned action: A meta-analysis of past research with recommendations for modifications and future research. Journal of Consumer Research, 15, 325–343. [Google Scholar] [CrossRef]
  95. Slovic, P. (1987). Perception of risk. Science, 236, 280–285. [Google Scholar] [CrossRef]
  96. Slovic, P., Fischhoff, B., & Lichtenstein, S. (1985). Characterizing perceived risk. In Perilous progress: Managing the hazards of technology. Westview. ERN: Uncertainty & Risk Modeling (Topic). [Google Scholar]
  97. Venkatesh, V. (2000). Determinants of perceived ease of use: Integrating control, intrinsic motivation, and emotion into the technology acceptance model. Information Systems Research, 11, 342–365. [Google Scholar] [CrossRef]
  98. Venkatesh, V., & Bala, H. (2008). technology acceptance model 3 and a research agenda on interventions. Decision Sciences, 39, 273–315. [Google Scholar] [CrossRef]
  99. Venkatesh, V., & Davis, F. (2000). A theoretical extension of the technology acceptance model: Four longitudinal field studies. Management Science, 46, 186–204. [Google Scholar] [CrossRef]
  100. Venkatesh, V., & Davis, F. D. (1996). A model of the antecedents of perceived ease of use: Development and test. Decision Sciences, 27(3), 451–481. [Google Scholar] [CrossRef]
  101. Wang, C., Ahmad, S. F., Bani Ahmad Ayassrah, A. Y. A., Awwad, E. M., Irshad, M., Ali, Y. A., Al-Razgan, M., Khan, Y., & Han, H. (2023). An empirical evaluation of technology acceptance model for artificial intelligence in e-commerce. Heliyon, 9(8), e18349. [Google Scholar] [CrossRef]
  102. Warshaw, P. R. (1980). A new model for predicting behavioral intentions: An alternative to fishbein. Journal of Marketing Research, 17, 153–172. [Google Scholar] [CrossRef]
  103. Warshaw, P. R., & Davis, F. D. (1985). Disentangling behavioral intention and behavioral expectation. Journal of Experimental Social Psychology, 21, 213–228. [Google Scholar] [CrossRef]
  104. Wirtz, B. W., Weyerer, J. C., & Geyer, C. (2019). Artificial intelligence and the public sector—Applications and challenges. International Journal of Public Administration, 42(7), 596–615. [Google Scholar] [CrossRef]
  105. Yigitcanlar, T., David, A., Li, W., Fookes, C., Bibri, S. E., & Ye, X. (2024). Unlocking artificial intelligence adoption in local governments: Best practice lessons from real-world implementations. Smart Cities, 7, 1576–1625. [Google Scholar] [CrossRef]
  106. Zhang, T., Tao, D., Qu, X., Zhang, X., Zeng, J., Zhu, H., & Zhu, H. (2020). Automated vehicle acceptance in China: Social influence and initial trust are key determinants. Transportation Research Part C: Emerging Technologies, 112, 220–233. [Google Scholar] [CrossRef]
  107. Zhou, T., Lu, Y., & Wang, B. (2009). The relative importance of website design quality and service quality in determining consumers’ online repurchase behavior. Information Systems Management, 26(4), 327–337. [Google Scholar] [CrossRef]
  108. Zuiderwijk, A., Chen, Y.-C., & Salem, F. (2021). Implications of the use of artificial intelligence in public governance: A systematic literature review and a research agenda. Government Information Quarterly, 38(3), 101577. [Google Scholar] [CrossRef]
Figure 1. TAM.
Figure 1. TAM.
Admsci 15 00157 g001
Figure 2. Proposed research model (extended TAM).
Admsci 15 00157 g002
Figure 3. Measurement model.
Admsci 15 00157 g003
Figure 4. Path coefficient of structural model.
Admsci 15 00157 g004
Table 1. Definitions for external constructs.
External ConstructGeneral ConceptualizationSource(s)
TrustTrust involves the confidence that users place in a technology, believing that it can perform its functions reliably and will act in the users’ best interest. (Burke et al., 2007; Dhagarra et al., 2020; Hasija & Esper, 2022; Hong, 2025; Jarvenpaa et al., 2000)
Application Design/
Appearance
Application design and appearance refer to the visual and functional elements of technology that influence user perceptions, affecting usability, satisfaction, and acceptance.(Hoehle & Venkatesh, 2015; Zhou et al., 2009)
Social InfluenceSocial influence pertains to the impact that peers, family, and larger social networks have on individuals’ attitudes and behaviors toward adopting new technologies.(Chaouali et al., 2016; Cheng et al., 2022)
Table 2. Basic statistics of the sample.
CategoryFactorFrequencyPercentage
GenderMale9646.40%
Female11153.60%
AgeBelow 2010.50%
20–292110.10%
30–3910550.70%
40–495727.50%
50 and above2311.10%
OccupationPrivate Sector5024.20%
Public Sector15072.50%
Unemployed73.40%
EducationHigh School3918.84%
First Degree10651.21%
Masters or Higher6229.95%
IT usability/knowledgeNone31.45%
Very limited31.45%
Some experience9445.41%
Quite a lot7636.71%
Extensive3114.98%
Mobile application use experienceNone41.93%
Very limited41.93%
Some experience8239.61%
Quite a lot7837.74%
Extensive3918.84%
Table 3. Measurement model factor loadings, reliability, and internal consistency.
FactorCodeDescriptionLoadingAVEC.RC.A
TrustTR1Chatbot application is trustworthy0.7670.5890.850
TR2Chatbot application providers give the impression that they keep promises and commitments on information provided0.7520.765
TR3Chatbot application providers keep my best interests in mind.0.854
TR4Chatbot can address my issues0.686
Application Design/
Appearance
AD1I will accept this chatbots application if the design to be similar to other systems that I used or know of. 0.6980.7160.9090.864
AD2I will accept this chatbot application if the chatbots service application is simple to navigate.0.898
AD3I will accept this chatbot application if it clearly generates and shows my required response. 0.908
AD4I will accept this chatbot application if it operates effectively and free from technical issues.0.865
Social
Influence
SI1I will use this chatbot application if the service is widely used by people in my community.0.6580.7040.9030.858
SI2I think that I will adopt this chatbot application if my supervisors/seniors use it.0.862
SI3I think that I will adopt this chatbot application if my friends use it.0.921
SI4I will adopt this chatbot application if my family members/relatives use it. 0.889
Perceived Ease of UsePE1I think learning to operate the chatbot application would be easy for me 0.7890.6830.8660.767
PE2I believe it would be easy to get the chatbot application to accomplish what I want to do.0.841
PE3It is easy for me to become skillful at using this chatbot application.0.848
Perceived
Usefulness
PU1Using this chatbot application would improve the quality of public service.0.8610.7710.9310.900
PU2Using this chatbot application would increase my productivity.0.866
PU3Using this chatbot application would save time on getting government information and services.0.905
PU4I believe this chatbot application is useful for delivery of public services online to citizens.0.879
AttitudeAT1It is a good idea to use a chatbot application in the public sector.0.8890.8150.946 0.923
AT2It is wise to use a chatbot application in the public sector.0.907
AT3I like to use a chatbot application in the public sector.0.930
AT4It is pleasant to use a chatbot application in public sector.0.883
Behavioral
Intention
BI1If I have access to this chatbot application, I intend to use it.0.8780.7400.895 0.817
BI2If I have access to this chatbot application, I will use it.0.899
BI3I plan to use this chatbot application within the next 6 months.0.800
Note: AVE—average variance extracted; C.R—composite reliability; C.A—Cronbach’s alpha.
Table 4. Discriminant validity is based on Fornell and Lacker criterion.
TRADSIPEPUATBI
TR0.767
AD0.2230.846
SI0.3560.3410.839
PE0.4550.5160.2960.826
PU0.3230.4400.2270.6520.878
AT0.2150.2210.1660.3950.6000.903
BI0.2580.5530.2170.5440.6580.4010.860
Note. TR—trust; AD—application design/appearance; SI—social influence; PE—perceived ease of use; PU—perceived usefulness; AT—attitude; BI—behavioral intention.
Table 5. Cross-loading results.
TRADSIPEPUBIAT
TR10.761−0.0320.1230.0420.0580.1540.077
TR20.821−0.011−0.075−0.0860.2200.110−0.048
TR30.7860.1090.2060.268−0.0040.0230.068
TR40.5190.1970.2430.3740.056−0.1470.237
AD10.1050.6570.2980.0370.1430.034−0.045
AD2−0.0090.8650.1410.1210.0750.0810.140
AD30.0050.8450.0910.1870.2020.1880.014
AD40.0410.7940.0550.1890.0840.2440.087
SI10.0390.3090.5260.0110.1520.3070.233
SI20.1220.0930.862−0.022−0.0180.0230.055
SI30.0900.1390.8950.1330.0740.0540.039
SI40.0790.1250.8790.1220.0460.0030.009
PE10.0670.2520.1090.7410.0260.0500.253
PE20.1480.0830.0450.6890.3290.2370.092
PE30.0860.1720.0750.7420.3070.1590.046
PU10.1120.2180.0250.1330.7760.1200.248
PU20.1030.2190.0090.2530.6610.2650.303
PU30.1190.1190.0830.1920.8170.1770.237
PU40.0690.0700.1060.1270.7810.2410.299
BI10.0610.3130.0740.2210.1550.7360.216
BI20.0260.2820.0280.0840.3200.7400.174
BI30.1700.0520.0870.1010.2050.7850.032
AT10.0330.0500.0660.1390.2540.1020.827
AT20.0890.0320.1010.1120.2040.0150.862
AT3−0.0010.0780.0460.0350.2530.0560.894
AT40.0810.0520.0080.1210.1270.2160.844
Note: The bold values represent the loadings of each indicator on its corresponding variable.
Table 6. Model fit indices.
Measures of FitIndicesValuesRecommended Values
Discrepancy measurementsCMIN/DF1.860(<2)
(RMSEA)0.065(0–0.1)
Comparative Fit Index (CFI)0.923(0.9–1)
Incremental adjustment
measures
Normed Fit Index (NFI)0.902(0.9–1)
Tucker–Lewis Index (TLI)0.906(0.9–1)
Parsimony-adjusted and
related measures
Incremental Fit Index (IFI)0.925(0.9–1)
Parsimony-Goodness Measures (PGFI)0.757(0.5–1)
Goodness-of-Fit Index (GFI)0.914(0.9–1)
Table 7. Hypotheses test results.
Hypothesis PathStandard
Estimates
Standard
Error
Critical
Ratio
p-Value
H1BI ← AT0.3700.0685.481***
H2AT ← PU0.7450.1275.865***
H3AT ← PE−0.0410.179−0.2280.820
H4PU ← PE0.8550.1376.22***
H5AT ← TR0.2470.1391.7770.076
H6PE ← TR0.4010.1004.03***
H7PE ← AD0.4040.0844.829***
H8PU ← SI0.0530.0940.560.575
H9TR ← SI0.4450.1054.217***
Note: ***, p < 0.001.
Table 8. Results of total, indirect, and direct effect.
PathEstimates
TotalDirectIndirect
TR->PE0.4010.4010
TR->PU0.34300.343
TR->BI0.18000.180
SI->TR0.4450.4450
SI->PE0.17800.178
SI->AT0.25600.256
SI->BI0.09500.095
AD->PE0.4040.4040
AD->PU0.34500.345
AD->AT0.24100.241
AD->BI0.08900.089
Disclaimer/Publisher’s Note: The statements, opinions and data contained in all publications are solely those of the individual author(s) and contributor(s) and not of MDPI and/or the editor(s). MDPI and/or the editor(s) disclaim responsibility for any injury to people or property resulting from any ideas, methods, instructions or products referred to in the content.

