Abstract
The assurance of sustainability reports faces significant challenges that arise from the characteristics of sustainability information and the regulatory context in which it is developed. This recently growing service has favoured the creation of a rapidly evolving market, a complex professional field in its early stages of development and study. The aim of this paper is to analyse whether the use of international standards or the profile of the provider performing the service affects assurance process and quality. To this end, we applied a novel methodology for this field: a survey through written questionnaires. The use of a primary information source allows us to gain insight into the topic, beyond other visible aspects often used in previous literature (e.g., assurance statement contents). We tested our hypotheses on a sample of Spanish accounting and consulting firms. Our results show that neither the use of international standards nor the provider’s professional background has any effect on assurance process and assurance quality. However, the way the professional perceives the developed service does have an impact on quality.
Keywords:
assurance; sustainability reports; assurance providers; market; assurance process; quality 1. Introduction
In recent years, the assurance of sustainability reports (SR) has evolved (O’Dwyer et al. 2011; KPMG 2015) into an instrument that enhances credibility of corporate social responsibility (CSR) information (CorporateRegister.com 2012; Pflugrath et al. 2011; GRI 2013; Sierra et al. 2014; Darus et al. 2014; Herda et al. 2014). Consequently, a new market has arisen. Professionals from different areas see this situation as an opportunity to expand their business by offering services to this new market (Jones and Jonas 2011). The novelty of this market and its specific characteristics result in a limited understanding of the nature and scope of the supply and the demand side of the assurance service (Hasan et al. 2005; Perego 2009; Ackers and van Heerden 2015; Zorio-Grima et al. 2015). Despite some initiatives at the normative and institutional level that have derived in the development of international assurance standards, the lack of mandatory regulation implies the absence of legal requirements governing the procedures or delimiting the professionals who can fulfil this service. Previous literature states that the absence of regulation and the consequent diversity of standards and providers entail inconsistent assurance practices that hinder users’ understanding and reduce quality and credibility of the assurance service (Fonseca 2010; Ackers and Eccles 2015). Furthermore, the information contained in SR, characterized by the existence of qualitative and subjective indicators, besides the several stakeholders to which it is addressed, obstructs the assurance process (Wallage 2000; Adams and Evans 2004; Dillard 2011; Manetti and Toccafondi 2012). Thus, the emergence of an assurance market represents a research opportunity to better understand the development of this service and its related standards as well as a way to improve its public benefit (Simnett et al. 2016).
It is important to know how the assurance process is designed and carried out to reduce information asymmetry because credibility depends on it (Fuhrmann et al. 2017). As asserted by Junior et al. (2014), a greater understanding of the assurance process and the relationships emanating from it are required to support its effectiveness and increase its transparency towards stakeholders. Furthermore, assessing assurance quality is necessary to improve the services offered within the assurance market (Zorio et al. 2013). Previous literature on assurance quality considers key issues such as the performed procedures, the assuror’s independence and experience, the assurance scope and the contents and drafting of the assurance report (O’Dwyer and Owen 2005; Knechel et al. 2006; Hodge et al. 2009; Gillet 2012; Herda et al. 2014). However, the scarce literature on assurance practices and its quality assessment has approached this topic by applying the content analysis methodology to the assurance statements, the only visible part of the process (Deegan et al. 2006; Fonseca 2010; Zorio et al. 2013; Herda et al. 2014; Gürtürk and Hahn 2016; Sethi et al. 2017). This approach could be only partly accurate if we consider the great heterogeneity of assurance statements, in both format and content (Perego 2009; Jones et al. 2014; Rossi and Tarquinio 2017). Moreover, assurance quality largely depends on performed procedures (Fuhrmann et al. 2017) that may be inadequately specified in the assurance reports. For example, Gürtürk and Hahn (2016) analysed the content of the assurance statements in a sample of UK and German companies. They observed that the performed work differs in terms of the assuror’s professional background (accountant vs. non-accountant) and the applied assurance standards. However, the authors recognized the need to use other qualitative methods, such as interviews with suppliers, to provide more knowledge about the assurance process. To the best of our knowledge, literature scarcely analyses the assurance process and its quality through interviews with assurance providers.
This paper aims to shed light on the assurance market from the service-provider perspective. Specifically, it analyses whether the use of international standards or the characteristics of the assuror providing the service affects the assurance process and its quality. To perform this analysis, we distributed a written questionnaire to a sample of Spanish assurance providers. Our paper responds to the calls of O’Dwyer and Owen (2005) and Gürtürk and Hahn (2016) to further analyse the sustainability assurance process by considering the providers’ perspective. The analysis is set in Spain, a country with a worldwide leading position in CSR reporting, in terms of both quantity and quality of the disclosed information (KPMG 2011; Zorio-Grima et al. 2015). Therefore, we consider that this country has reached the required level of maturity to analyse the assurance service.
From the methodological point of view, our work contributes to literature in two ways. First, we used a novel methodology in the field that provides a primary source of information concerning assurance procedures and assuror’s perceptions. Second, based on qualitative and quantitative data collected by means of our questionnaire, we developed a composite index to assess the quality of the assurance service. In this way, we could overcome some limitations of other methodologies, such as lacking information or assurance report heterogeneity (Deegan et al. 2006).
Our results show that the assurance process is not affected by the use of international standards, regardless of whether the assurance provider is one of the four largest accounting firms (Big 4) or professionally considered an auditing service. We also found that assurance quality is affected neither by standardization nor professional background. However, the professional area in which providers frame the service has implications on its quality. These results suggest the need to reinforce standardization and rethink the traditional classifications of assurance providers (auditors vs. non-auditors and Big 4 vs. non-Big 4). In addition, our results evidence some weaknesses related to the stakeholder’s engagement that could have practical and negative implications for academics, standard-setters and practitioners when seeking to improve assurance quality and, consequently, assurors’ credibility.
The remainder of this paper is organised as follows. After the literature review, we propose our hypotheses, present the research methodology and describe the questionnaire design and how it is applied to the sample. Then, we present and discuss the results, and finish with our main conclusions.
2. Assurance of Sustainability Reports: Hypotheses Development
The assurance of SR has become a key element to increase the credibility of CSR information issued by companies (Darus et al. 2014; Herda et al. 2014). It reinforces users’ confidence through the assessment of an independent third party who obtains evidence that the information disclosed is both satisfactory and sufficient enough to set an opinion about its adequacy and veracity against established criteria (IAASB 2013). DeAngelo (1981, p. 186) defined the quality of the audit service as “the market-assessed joint probability that a given auditor will both (a) discover a breach in the client’s accounting system, and (b) report the breach.” We assume this definition and apply it to the assurance service. Some aspects of this service, such as procedures carried out, provider independence, and conclusions, are considered key issues to assess quality (O’Dwyer and Owen 2005; Herda et al. 2014). Likewise, with the expansion of assurance services to new areas, experience, objectivity and independence are considered highly relevant attributes for assessing such quality (Knechel et al. 2006; Hodge et al. 2009; Gillet 2012).
The need to increase stakeholder’s trust drove the development of international standard frameworks to strengthened assurance process. In this regard, the non-profit network AccountAbility (AA) issued the AccountAbility 1000 Assurance Standard (AA1000AS) in 2003 and the International Auditing and Assurance Standards Board (IAASB) issued the International Standard on Assurance Engagements 3000 (ISAE3000) in 2004. With an upward trend in use (Manurung and Basuki 2010; CorporateRegister.com 2013), these two standards are considered the most widespread guides for the assurance service (KPMG 2008; Manetti and Becatti 2009; Jones and Jonas 2011), Table 1 summarizes similarities and differences in key aspects characterizing the updated versions of ISAE3000 (IAASB 2013) and AA1000AS (AccountAbility 2008). Generally speaking, both assume that the purpose of an assurance engagement is to increase information credibility considering different assurance levels in function of the risk assumed: high or moderate in the AA1000AS, and reasonable or limited in the ISAE3000. They also structure the assurance process into four phases: acceptance, planning, implementation and reporting. However, while the IAASB is an accounting organization and therefore focuses on accountancy, AA focuses on sustainability. This causes approach differences in the approach to standards. In fact, the application of AA1000AS to the assurance is limited, while ISAE3000 may be applied to any type of non-financial information. According to AA1000AS, the assuror’s objective is to assure the information complies with materiality, comprehensiveness and accountability principles, based on stakeholder interests. The ISAE3000, however, prioritizes verifying that the information is free of material misstatements. In addition, while the ISAE3000 establishes more formal ethical requirements and control systems relying on existing regulation for the auditing profession, AA1000AS emphasizes the commitment to stakeholders and compliance with fundamental principles of CSR information.

Table 1.
Comparison of international assurance standards.
The development of international standards has important implications for professionals performing the assurance process. A clear, well-defined process guides the assuror in obtaining necessary evidence on the adequacy of the information that complies with user expectations. An appropriate design of the assurance process increases the trustworthiness of the service (Fuhrmann et al. 2017). As aforementioned, both AA100AS and ISAE3000 consider a structured sequence in the assurance process, similar to financial auditing. The existence of different standards triggers the issuance of different assurance statements (Deegan et al. 2006; Manetti and Becatti 2009). ISAE3000 provides the necessary formalism derived from its emphasis on ethical and formal requirements. Meanwhile, the AA1000AS leads to increased confidence in the assurance of SR by explicitly highlighting stakeholders’ importance, a key element of CSR and its communication. Both matters provide credibility to the assurance service (Figure 1). In fact, some authors consider that ISAE3000 and AA1000AS should be complementary to provide better results in the assurance process (Jones and Jonas 2011; Marx and van Dyk 2011). We therefore state that, among other issues, standardization may lead to a better quality service by considering assurance quality the ability to ensure information transparency and increase user confidence.
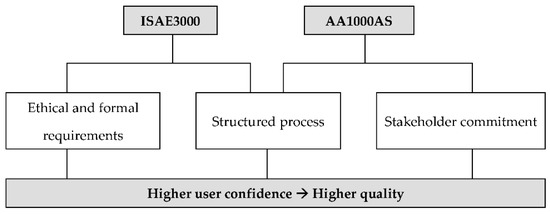
Figure 1.
The contribution of International Standards to assurance quality.
Based on this analysis, we expect the assurance process performed by providers and its quality to be influenced by the use of international assurance standards. Hence, we state the following hypotheses:
Hypothesis 1. (H.1)
The use (or not) of international assurance standards affects the performed assurance process.
Hypothesis 2. (H.2)
The use (or not) of international assurance standards affects assurance quality.
The presence of different professional bodies competing in the market of SR assurance fuels the debate on the characteristics of each supplier, the way they offer the service or the most appropriate profile for performing SR assurance. There is no consensus on who should conduct this service and what their competences should be (Deegan et al. 2006).
Given the traditional primacy of the four largest accounting firms (Big 4) in the assurance market of SR (O’Dwyer 2011; KPMG 2015), many researchers have compared this service with financial auditing and concluded on the influence of the latter on the assurance process (Wallage 2000; Adams and Evans 2004; Deegan et al. 2006). This is probably because the Big 4 firms leverage their network of auditing clients to provide SR assurance to those same clients (Fernandez-Feijoo et al. 2016). This behaviour assumes that the Big 4 exploit the techniques employed by financial audit processes to influence the SR assurance (Mock et al. 2007). Thus, just like in financial auditing, previous literature has considered that hiring a Big 4 for the SR assurance is an indicator of higher quality (Mock et al. 2007; Perego 2009; Fernández-Feijóo-Souto et al. 2012). Some authors believe that the higher quality of the Big 4 firms when assuring SR is owed to the formats and applied procedures (Perego 2009). Furthermore, international audit firms have specific divisions that can provide more diversified, specialized and qualified services by employing professionals from various fields to meet the changing needs of clients (Lee 2013). In this sense, Hodge et al. (2009) concluded that the users of assurance reports have more trust in large audit firms.
Therefore, we may expect Big 4 firms’ experience and reputation in the market of financial auditing to be transferred to the market of SR assurance. This fact might influence procedures and quality. Accordingly, we set the following hypotheses:
Hypothesis 3. (H.3)
The fact that the provider is a Big 4 affects the assurance process performed.
Hypothesis 4. (H.4)
The fact that the provider is a Big 4 affects assurance quality.
Besides the provider’s classification as Big 4 and non-Big 4 firms, literature often distinguishes between two groups of professionals: auditors and consultants (Perego and Kolk 2012; Zorio et al. 2013). This classification considers professional background, namely whether the assuror belongs to the accounting profession, bearing in mind that each of them uses different approaches to perform SR assurance (Manurung and Basuki 2010). By and large, auditors are characterized as being more cautious in performing the assurance service. Having a greater risk aversion, they are reluctant to provide high levels of assurance, and they focus more on the consistency of information, accuracy of data and evaluation of control systems (Owen and O’Dwyer 2004; Deegan et al. 2006; Manurung and Basuki 2010). Their approach is more conservative and influenced by the use of mandatory standards for their profession. They apply ethical and independence requirements and quality control mechanisms (Simnett et al. 2009; Pflugrath et al. 2011). In contrast, literature characterizes consultants as having a more strategic approach focused on stakeholder interests (Owen and O’Dwyer 2004; Manurung and Basuki 2010). Their main competitive advantage is their greater experience and knowledge on the social and the environmental dimensions of CSR (Perego 2009; Huggins et al. 2011). They centre more on evaluating the communication process and consider added value and sustainable performance measures under completeness, fairness and balance premises (Manurung and Basuki 2010). Therefore, they are more likely to give advice concerning the need for SR improvement (Owen and O’Dwyer 2004; Perego 2009).
In terms of quality, the main competitive advantage of auditors is their experience and recognized reputation in financial auditing. This may allow them to export their skills and rigor to assurance procedures and reporting formats (Wallage 2000; Perego 2009; Simnett et al. 2009). Sometimes all of these features contribute to perceiving auditors as providers offering a higher quality for the assurance of SR (Simnett et al. 2009; Pflugrath et al. 2011; Zorio et al. 2013). However, the qualitative nature of CSR information leads to the need for other assurance methods, beyond the rigor defined by financial auditing (Ballou et al. 2006). Thus, the accounting profession may lack certain skills required to face difficulties presented by aspects such as the environmental impact assessment or stakeholder commitment (Gray 2000; Manetti and Becatti 2009). In this sense, Perego and Kolk (2012) concluded that auditing firms provide higher quality in the formats and procedures followed in the assurance process; consultants tend to be more comprehensive about the recommendations given in assurance statements.
Despite the above-mentioned differences between auditors and consultants, we observe this classification is made according to the professional background of the provider of traditional services (e.g., services offered by Big 4 firms are regarded as auditing services). However, we must point out that the same firm (e.g., Big 4 firm) offers other professional areas (e.g., consulting). In addition, large firms can approach the assurance process through multidisciplinary teams. The approach and how it is perceived could differ according to the professional area in which the providers frame the assurance service. This could, in turn, affect the process and quality. Thus, we want to test if the differences stated in the literature between auditors and consultants remain when the classification depends on the provider’s perception of the service and not on the provider’s traditional professional background. Hence, we formulate our last hypotheses as follows:
Hypothesis 5. (H.5):
The professional area (auditing or not) where the providers frame the service affects the performed assurance process.
Hypothesis 6. (H.6):
The professional area (auditing or not) where the providers frame the service affects assurance quality.
3. Methodology
Our paper faced assurance quality from a quantitative approach. The methodology used to analyse the assurance of SR from the assurance provider perspective was applied in three stages. First, we collected data through a questionnaire. Second, we developed a quality index to assess the assurance service. Finally, we performed the statistical analysis to contrast our hypotheses.
3.1. Data Collection
3.1.1. Questionnaire Design
Surveys are highlighted as useful tools for research in the field of CSR as they provide information that is hardly observable (Fifka 2013). Direct communication with assurance providers is the best way to deeply understand the status SR assurance (O’Dwyer and Owen 2005; Edgley et al. 2010). This tool allows access to primary sources that provide information beyond others such as reporting documents or databases. We chose to survey assurors through a written questionnaire to capture a broader population and avoid interviewer bias (Naranjo-Gil 2006).
Our questionnaire, designed taking the information needed to test our hypotheses and the target population into account, attempted to avoid individual misunderstandings when responding (Naranjo-Gil 2006). It was validated by a double panel of experts, both in CSR and in the tool itself. The final version of this questionnaire (Appendix A) incorporated the suggestions of these experts. It comprises 17 mostly closed-type questions. These questions were designed to gather information about assuror’s characteristics and assurance procedures. Responses were primarily structured polytomically or in a Likert scale. Table 2 summarizes the questionnaire structure and indicates the main content of each question; the number of related items of multiple questions; its function, depending on whether the information is primarily used to test the hypotheses or as complementary information; and the related variable and hypotheses, if applicable.
Table 2.
Questionnaire structure.
3.1.2. Sample Selection and Procedure
We collected the list of addressees for the questionnaire from CorporateRegister.com (http://www.corporateregister.com/search/partners_search.cgi?d=&cou=Spain&tow=&rep=1&nr=All&ty=Auditor+%2F+Verifier&n=0, accessed on February 2014). This organisation provides a directory on its website where entities performing communication services related to CSR may register. More than 8000 organizations worldwide are registered and classified by type of service. We selected “Auditing partners” with at least one SR assured in Spain. We excluded 16 of the 36 registered providers because they were duplicated, extinct, erroneous, or missing contact information. The final sample consisted of 20 firms including the most important providers within the Spanish assurance market (Zorio-Grima et al. 2015). According to the CorporateRegister.com database, these 20 providers had 844 assurance statements associated in Spain on the sampling date (February 2014). This represents 96.5% of the total assurance statements registered for this country (875 were from the former list).
We sent the questionnaires and received responses between October 2014 and July 2015. A total of 10 providers answered. This represents a response rate of 50%. The respondents had a total of 731 Spanish assurance statements associated in the CorporateRegister.com database. That is to say, this represents 86.6% of the statements in the initial sample of 20 providers (844 initial assurance statements). We conducted a psychometric analysis to check if these responses were biased with respect to the initial sample. We compared the frequency distributions of both samples and distinguished between Big 4 and non-Big 4 providers. We chose this feature to compare the samples because it was the only characteristic in the analysis that could be previously identifiable. We needed to classify provider responses according to the use of international standards and their professional perception of the assurance service. Both characteristics were not previously identifiable. Hence, it was impossible to apply these criteria to the sample. No significant differences were found between the initial sample and the responses received concerning Big 4 and non-Big 4 distribution. The responses are therefore representative.
3.2. Development of a Quality Index
Composite indices have often been developed to assess sustainable development. The construction of such indices requires the selection, normalization and weighting of adequate indicators to be aggregated in a single value (Krajnc and Glavič 2005; Böhringer and Jochem 2007; Singh et al. 2012).
Regarding the selection of indicators, the questionnaire gave us useful information on the assuror’s profile and the process that can be used as a quality indicator. The index components must be identified according to theoretical, empirical or intuitive arguments (Booysen 2002). Thus, assurance quality indicators were selected taking into account the criteria considered in previous literature and the specific characteristics of CSR information. We developed a quality index that includes the following factors:
- Expertise. It is one of the most important attributes in selecting an assurance provider (Knechel et al. 2006). It is understood as the extent to which a professional is perceived as an expert in the service. Tenure or experience could be an indicator of expertise. In the auditing field, experience is a determinant of quality (Simnett 1996) because it provides professionals with a greater knowledge base (Bédard et al. 1993). We therefore used the number of years the supplier has been providing the service to measure this factor. Given the assuror’s responses to the questionnaire, expertise ranges between 10 and 20 years.
- Knowledge transfer. Knowledge spill-over happens when a provider performs more than one service to a same client (Beck and Wu 2006). This gives a better understanding of the client (Beck and Wu 2006) and provides greater assurance quality (Martínez-Ferrero et al. 2018). Furthermore, it allows the transfer of abilities related to procedures or specific capabilities (Perego and Kolk 2012) that ease the provision of a quality service. We measured this factor bearing in mind the proportion of clients that hire more than one service from the same provider. This information was obtained by inverting the response about client exclusivity because a lower proportion of clients that only hire SR assurance indicate a higher proportion of shared services. The value of this factor is 1 if the proportion of clients hiring more than one service ranges between 0% and 25%; 2 if this proportion is between 26% and 50%; 3 when the proportion of shared services was between 51% and 75%; and 4 when it is between 76% and 100%.
- Specialization by industry. The provision of specialized services permits a better understanding of client demands (Lee 2013). Specialization provides assurors with technical capabilities associated with greater quality (Abidin et al. 2010). Specifically, industry specialization is evidenced as a factor associated with higher assurance quality (Martínez-Ferrero et al. 2018). Thus, we considered specialization by industry and give a value of 2 if most of the assuror’s clients belong to the same industry; 1 if most clients only belong to two or three different industries; and 0 otherwise.
- Independence. Independence is an important factor in determining assurance quality and credibility (Hodge et al. 2009; Gillet 2012). This factor relates to the assuror’s freedom to report misinformation found in the assurance process. The reporting of a discovered breach in the information system of a firm may be used as a measure of auditor’s independence (DeAngelo 1981). We determined independence through the proportion of qualified reports issued by the assuror (Barkess and Simnett 2012). This variable is assessed as 1 if the proportion of qualified reports ranges between 0% and 25%; 2 if it is between 26% and 50%; 3 if the assuror issues a proportion between 51% and 75% of qualified reports; and 4 if this proportion ranges between 76% and 100%.
- Financial audit relationship. The collaboration between assurors of SR and auditors of financial statements is a factor that benefits both professionals in identifying incidences (Manetti and Becatti 2009). We argued that assurors could provide greater quality if they used company audit reports as one of the information sources to support their opinions. The value assigned to this factor is 0 if the assuror does not use financial auditing reports; 1 if they sometimes do; 2 if they use them when they are also the financial auditors; and 3 if they use them in any case.
- Use of quality standards. Standardization is assumed to be important in granting credibility to the assurance service (Deegan et al. 2006; Smith et al. 2011). Specifically, standards of quality control guide assurors in establishing a system for controlling the quality and appropriateness of their work (IFAC 2015). We considered that the existence of a pre-established framework for the internal control of the work performed by assurors positively affects the quality of the results. This factor is value 2 if assurors follow a generally accepted quality standard, 1 if they followed their own quality standard, and 0 if they do not follow any standard at all.
- Stakeholder involvement. Given the particular features of CSR information, the inclusion of stakeholders in the assurance process is considered a key element in improving service quality and credibility (Edgley et al. 2010; Manetti and Toccafondi 2012). We considered two indicators on the grounds that stakeholder involvement in the assurance process is important (Gürtürk and Hahn 2016) and assurance quality can be ultimately measured by the ability to increase stakeholder confidence (Herda et al. 2014):
- Stakeholder related tests: It measures the degree of implementation of communication instruments between the assuror and the company stakeholders, such as “interviews with the staff”, “interviews with other external stakeholders” and “the search for additional information with third parties”. According to the questionnaire responses, structured in a Likert scale, the value of each test ranges between 1 (if the test is never performed) and 5 (if it is always performed). The total score is therefore determined with the average value reached by each assuror in these tests.
- Stakeholder consultation: It indicates the degree to which stakeholders, other than company managers, are consulted during the assurance process. Its value ranges from 1 to 5 according the average frequency of consultation to shareholders, investors, providers, clients, employees, nongovernmental organizations (NGO), public administration and organizations representing civil society.
The selected quality indicators did not have the same measurement scale given the different way the questionnaire presents related questions. Hence, we normalized them to allow comparability and aggregation (Krajnc and Glavič 2005). Given the absence of a generally accepted procedure for normalization (Böhringer and Jochem 2007), we decided to transform all the indicators into a 0–1 scale by applying the following formula:
where x’ is the re-scaled value reached by the providers for each indicator, xi is the initial value considered, xmin the minimum potential value and xmax the maximum potential value. This normalization method is used in the Human Development Index of the United Nations Development Programme (UNDP 2005).
Finally, in terms of the Environmental Sustainability Index developed under the umbrella of World Economic Forum in 2001 (Esty et al. 2005), we gave the same weight to all the indicators and used an arithmetic mean to aggregate them in a composite index. We highlight that all individual indicators have the same importance in the composite index, but stakeholder involvement is weighted double because we use two indicators to measure it.
Table 3 summarizes the criteria applied in evaluating the quality of the assurance process. It indicates possible values, the minimum and maximum scores each indicator may achieve (according the questionnaire responses) and the main considerations in the composite index construction:
Table 3.
Assurance quality index.
3.3. Statistical Analysis: Variables and Procedures
Each item included in the questionnaire offers information on the characteristics of providers or the procedures for performing the assurance service. This information may be qualitative if the related item is based on a feature or a concrete behaviour (nominal response), or quantitative if it is measured using a scale according to the respondents’ thoughts and attitudes. Most of this information and the values of the quality index were used to check differences that support (or do not support) our hypotheses. Specifically, we defined two explained variables and three explicative variables to test our hypotheses:
Explained variables:
Assurance process. It is a set of variables defined by means of several items related with the assurance scope (8 items), the assurance team composition (4 items), the planning of the work (10 items), the testing performed to obtain evidence (11 items), and the stakeholders consulted during assurance performance (10 items). Each of the related items receives a value between 1 and 5 according to how often assurance providers consider them.
Assurance quality. It is calculated aggregating eight quality indicators: expertise, knowledge transfer, industry specialization, independence, relationship with financial audit, the use of quality standards, stakeholder related tests and stakeholder consultation. It ranges between 0 and 1.
Explicative variables:
International standards. Its value is 1 if the provider uses AA1000AS or ISAE3000, both jointly or separately, to guide the performed assurance procedures, and 0 if no international standard is used.
Big 4. It is valued as 1 if the provider is one of the four largest accounting firms and 0 if it is not.
Auditing service. Its value is 1 if the providers perceive the assurance service as an auditing service and 0 if they frame it in other professional areas, such as consulting or certification.
The complementary information gathered in the questionnaire responses was descriptively analysed to identify providers’ features that allow us to build a big picture of the topic. Statistical tests used to contrast hypotheses are mainly based on bivariate analysis. Given the sample size, the quantitative variables follow no normal distribution. Thus, we applied Mann–Whitney U test to search for significant differences between explained and explicative variables.
4. Results
4.1. Descriptive Analysis
Table 4 presents the sample composition regarding the explicative variables: international standards, Big 4 and auditing service. Providers using international standards to perform the assurance service represent 70% of the sample. Concerning the providers’ profile, Big 4 firms represent 30% of the sample and firms that perceive this service as auditing represent 70%. The number of this latter group in the sample is high as compared to the number of Big 4 because the auditing service variable depends on the area where providers frame the assurance service, regardless of their professional background. In fact, one of the Big 4 firms does not consider assurance an auditing service.
Table 4.
Sample composition: explicative variables.
Table 5 shows the descriptive statistics for the items included in the explained variable “assurance process”. It is remarkable that the average score of all the items related to the assurance scope, except those associated to a limited scope (coverage of specific sections or elements of the report), is greater than 4. This result reflects the providers’ willingness to assure SR comprehensively. The assurance teams, often multidisciplinary teams (average rating 4.500), infrequently hire external experts. In general terms, assurance planning and tests performed to obtain evidence are akin to the financial auditing process (most of the related items are scored above 4 on average). This result supports the perception that the presence of similar practices (namely financial accounting) influences the normalisation and legitimisation of activities unregulated by law, as is the case of sustainability accounting (Bebbington et al. 2012). It is worth noting that the most infrequent tests are those that imply communication with third parties. Furthermore, external stakeholders, other than company managers (mean 4.111) and employees (mean 3.778), are infrequently consulted. This result falls in line with the literature highlighting the sparse participation of stakeholders in the assurance process (Manurung and Basuki 2010; Ackers and van Heerden 2015; Gürtürk and Hahn 2016) and its “managerial capture” (Edgley et al. 2010; Smith et al. 2011; Michelon et al. 2015).
Table 5.
Assurance process: general results.
Table 6 presents the mean value of the explained variable “assurance quality”. It also shows the average score reached by the sample in each factor in the quality index. The highest total score obtained for the quality index is 0.750 and the lowest is 0.313. Quality indicators obtaining higher scores are related to formal aspects (financial audit relationship and testing and quality standards). The average score of the quality index (0.552) is slightly above the medium potential value (0.500). In consonance with Zorio et al. (2013), we evidenced an acceptable level of assurance quality in Spain, although there is still room for improvement. Expertise, independence, specialization by industry and stakeholder consultation are individual quality indicators that present lower average values.
Table 6.
Assurance quality: general results.
Table 7 shows that Big 4 firms have been providing the service for 14.33 years on average (13.29 years for non-Big 4) and have a mean of 14.33 SR assured in 2013 (18.43 for non-Big 4). The average of years providing the service is 12.29 for providers that frame assurance as an auditing service (16.67 when assurance is not considered an auditing service) and they have a mean of 19.43 SR assured throughout the last year consulted (12.00 SR for non-auditing service). Generally, years of experience range between 10 and 20. The minimum corresponds to a non-Big 4 firm that considers assurance an auditing service and the maximum is reached by a non-Big 4 that does not frame assurance as an auditing service. The number of assurance engagements in 2013 has greater variability, ranging from 2 to 51. The provider with fewer assured SR is a non-Big 4 with a non-auditing approach. By contrary, a non-Big 4 with an auditing approach provided the greatest number of assurance services.
Table 7.
Providers responding the questionnaire (N = 10).
Table 8 shows the motivations to offer this service. It distinguishes responses by provider profile. On average, the opportunity to open a new market niche is valued 4 or more (over a maximum of 5) by Big 4, non-Big 4 and providers that frame assurance as an auditing service. Non-Big 4 and assurors with an auditing approach give value 4 to the expansion of existing services. This makes it the most valued motivation of both groups. The request from clients has great influence on all kind of providers (valued 4 or more) and it is the most valued motivation for Big 4 and providers that do not consider assurance an auditing service. Finally, external pressures coming from competitors and stakeholders have less influence on the decision to offer the assurance service. Thus, we could state that the offer of this service is primarily based on the providers’ business strategy and it extends traditional services to regular clients.
Table 8.
Motivation for offering the service.
4.2. Hypotheses Contrast
Table 9 shows the mean value of the assurance process items grouped in function of the use (or not) of international assurance standard. The results of the mean comparison indicate that the use of international standards has no influence on the characteristics of the assurance process. The only significant difference is observed in the consultation with organizations representing civil society (p-value = 0.048), which is more frequent when assurors use international assurance standards. Given the results, the assurance process and the use of international standard are unrelated. Therefore, the first hypothesis is rejected.
Table 9.
Assurance process vs. international standards.
Although there are no significant differences, providers using international standards tend to set multidisciplinary teams, and they are more rigorous regarding assurance planning, especially in activities such as standardized criteria, risk identification and materiality determination. Furthermore, although this is still scarcely the case, providers do consult external stakeholders more frequently when they use international standards.
Table 10 shows the results obtained by comparing assurance quality between the providers that use and those that do not use international standards. There are no significant differences either in the individual factors or in the final index. The use (or not) of international standards has no impact on assurance quality. Thus, we reject our second hypothesis.
Table 10.
Assurance quality vs. international standards.
Remarkably, assurors who apply no international standards reach a slightly higher value of the quality index. They are more qualified regarding independence and specialization, indicators in which providers using international standards fail considerably. However, the latter group does better in aspects such as financial audit relationship and using of quality standards. Stakeholder consultation is one of the less scored factors in both groups, being higher when international standards are used.
Results regarding the relationship between the assurance process and whether the provider is a Big 4 are shown in Table 11. The only slight difference is found in the employees’ consideration (p-value = 0.095). Employees are more frequently consulted by non-Big 4 firms. Taking into account the results of the whole process, we cannot accept our third hypothesis. Thus, the fact that the provider is a Big 4 has no effect on the assurance process. This result may suggest that, even despite the heterogeneity of assurance reports (Rossi and Tarquinio 2017), the underlying assurance work is already normalized among providers regardless of their professional background.
Table 11.
Assurance process vs. Big 4.
Although differences are not significant, we observe that Big 4 are more inclined to create multidisciplinary teams and they are more exhaustive concerning assurance planning and testing. On the other hand, non-Big 4 providers are more thorough in terms of assurance scope.
Table 12 shows the quality index score. It distinguishes between Big 4 and non-Big 4 firms and compares their mean. Only the use of quality standards presents significant differences between both assuror profiles. Big 4 firms are more regular users. This indicates these providers are more exposed to formal aspects of assurance work. Even so, the scores obtained by Big 4 and non-Big 4 in the aggregated quality index present no significant differences. It makes no difference to assurance quality whether the provider is a Big 4. The fourth hypothesis must therefore be rejected.
Table 12.
Assurance quality vs. Big 4.
These results do not align with some authors who have reported Big 4 as the most qualified providers (Perego 2009; Fernández-Feijóo-Souto et al. 2012). Our results could be explained by the composition of the Spanish market, as proven by Zorio-Grima et al. (2015), in which dominant positions are shared among Big 4 and other firms with a professional trajectory in other related services, like certification. In this situation, synergies in the processes and shared skills may exist not only because of their experience in financial auditing, but also other specific expertise related to CSR. In fact, knowledge transfer and specialization scored higher in non-Big 4 than they did in Big 4 assurors. Finally, it is interesting that stakeholder consultation scores low in both groups.
Table 13 shows the results on the relationship between the assurance process and the “auditing service” variable. They indicate no significant differences in the scores given to the process characteristics regarding the professional area in which the provider frames the service. Hence, the fifth hypothesis is rejected.
Table 13.
Assurance process vs. auditing service.
Contrary to the literature reporting differences between auditor and non-auditor assurors (Perego and Kolk 2012), we observe similar patterns in the assurance process, regardless of the given professional approach. This question may be explained by the large size of the main providers competing in this market, who can offer several services other than auditing or consulting. It is worth pointing out that some of the suppliers that define assurance as an auditing service, would in fact fall into other categories if their traditional services were considered. Furthermore, setting-up multidisciplinary teams makes it possible to achieve the right balance of skills and competencies to perform a more comprehensive process (Wallage 2000; Adams and Evans 2004; Simnett et al. 2009).
Table 14 shows the assurance quality index of providers that consider (and do not) assurance an auditing service. The quality index score for both assuror profiles is substantially different. We therefore accept the last hypothesis: the professional area (auditing or not) where the providers frame the service affects assurance quality.
Table 14.
Assurance quality vs. auditing service.
Providers with a non-auditing approach offer an assurance service of greater quality. Previous studies find that auditors are more qualified assurors (Martínez-Ferrero et al. 2018; Pflugrath et al. 2011; Zorio et al. 2013) or state that the perceived quality provided by auditors and consultants is converging (De Beelde and Tuybens 2015). Unlike previous literature, we consider the auditing service variable according the provider perception of the assurance service and not professional background. This point, along with the absence of significant differences between Big 4 and non-Big 4 firms, could lead to reconsidering the traditional distinction between auditors and consultants, in which differences are often based on the contents of the assurance statements, regardless of the underlying processes and capabilities. Formal aspects included in assurance reporting could be more exhaustive for accountants (Rossi and Tarquinio 2017). This is owed to its similarity to auditing reports (Bebbington et al. 2012). However, our quality index is based on factors underlying the report. Our results indicate that the main factors influencing quality differences are related with experience (expertise and knowledge transfer). The market is shared by accountant and non-accountant firms, but those that present greater expertise and knowledge transfer do not perceive the service as an auditing service. This could mean that SR assurance service requires specific skills other than traditional accounting skills (Manetti and Becatti 2009). In fact, it is remarkable that only non-auditor providers were able to reach the average score regarding stakeholder consultation.
5. Conclusions
This paper aims to attain a better understanding of the assurance market from the service-provider perspective. Specifically, it analyses whether the assurance process and its quality are affected by the use of international standards or by the assuror profile, namely whether they are a Big 4, and whether SR assurance is considered an auditing service. Our primary information source was a written questionnaire distributed to a sample of Spanish assurance providers.
Regarding the influence of using international assurance standards, results show no significant differences either in the process or quality reached by providers that use (or not) international standardization. This leads us to reject Hypotheses 1 and 2. We also rejected our third and fourth hypotheses because we found no differences in the process and the quality performed by the Big 4 and non-Big 4 firms. Finally, our results show that the professional area where the provider considers the service, i.e., auditing vs. non-auditing service, has no effect on the assurance process. However, it does affect assurance quality. Hence, Hypothesis 5 is rejected and Hypothesis 6 is accepted. The most qualified providers are those who perceive the service as a non-audit service. We may conclude that assurance results do not depend as much on the assurors’ professional background as on their perception of the service. This result might require a deeper analysis of traditional perceptions, such as provider classification or Big 4 service, as a proxy for quality.
This paper provides a general picture of the SR assurance service in Spain. From a practical perspective, we found the same patterns in the assurance process, regardless of the assurance standards and the assuror profile. SR assurors perform the service like a financial audit. They include assurance planning and tests to form an opinion on the assured information. Thus, we can assert that the assurance process carried out by providers in Spain is normalized and could be influenced by the existence of kindred services.
In terms of quality, we observe a generally acceptable level. However, there is room for improvement. Both process and quality analyses show that objectivity and stakeholder engagement are the weakest points in the provision of this service. The latter is the main characteristic that distinguishes between financial and CSR information and, consequently, differentiates financial auditing and SR assurance. Despite the influence of financial auditing regarding formal aspects, SR characteristics require other specific capabilities to ensure a comprehensive service. In fact, the most qualified assurors frame the SR assurance service as a non-audit service. Thus, we argue that academics, practitioners and institutional bodies, should focus more on how the assurance service should be performed and not so much on identifying the provider. To this end, they should reinforce the role of the stakeholder in the assurance process.
Analysing the way in which assurors provide the service, this paper contributes to literature by building a general picture of the assurance offer in Spain. We use a questionnaire from firms offering their services in the assurance market, to directly obtain information about their behaviour and characteristics. We develop a quality index to assess performance and determine the issues that should be considered for improvement. To the best of our knowledge, we are innovative in evaluating assurance quality through information gathered directly from providers. In this sense, we go far beyond the content analysis of assurance reports to consider the underlying process and assurors’ attributes in the final result.
Our findings may be useful for standard-setters and regulators to reinforce stakeholder involvement in CSR communication and assurance processes. It may be necessary to review current standards to strengthen their crucial role in increasing service credibility and, consequently, improving the way the market works. In this sense, we agree with Simnett et al. (2016), who state that international research on the evolution and quality of assurance services of SR can help to further develop assurance standards and maximise public benefit. Finally, this paper has implications for practitioners. It may be useful to providers who want to self-evaluate their performance and find issues to increase quality and obtain a competitive advantage.
We acknowledge the limitations of our research, which are mainly derived from the size and selection of the sample and the use of a questionnaire as a research methodology. Although we have achieved a reasonable response rate, in some cases, the sample size has impeded desirable statistical treatment. Besides, other weaknesses, such as inherent bias of the respondents may affect the results. In addition, we should note that the findings can only be applied to the assurance market in Spain. The results cannot be extrapolated to other countries, where the situation may be different.
Despite its limitations, this paper could represent a starting point for future research on the assurance of SR from the perspective of the assurors’ processes and procedures. The methodology could be useful in continuing the analysis from a multi-country perspective. Countries present differences concerning the contents of assurance statements (Sethi et al. 2017), so it would be helpful to know whether these differences remain in the procedures. The providers’ strategies could also be analysed in greater depth and the traditional classifications of assurance providers (i.e., Big 4/non-Big 4 or auditors/consultants) should be revised. Other assuror attributes could be considered in the search for differences in assurance process and quality. Firm size, for example, is an indicator of quality and independence because large firms have a greater reputation risk (Craswell et al. 2002; Perego 2009) and promote public confidence in the competence of the service (King and Schwartz 1998). Finally, even assuming the difficulty of such a task, it would be interesting look at how to ensure stakeholder engagement in the assurance process and fulfil their expectations. A consistent research line in this field could shed light on the possible need for governmental intervention as a regulator (Ackers and Eccles 2015).
Author Contributions
All authors were equally involved in the research design, data collection and analysis, and paper writing. All authors read, edited, and approved the final manuscript.
Funding
This research received no external funding.
Conflicts of Interest
The authors declare no conflict of interest.
Appendix A. Questionnaire for Assurance Providers
The aim of this questionnaire is to know how the company you represent offers the service of external assurance of sustainability reports and the procedures carried out in this regard.
Explanatory Note: the term “sustainability report” refers to the information published by the company about its corporate social responsibility (CSR), either as isolated or integrated into the annual report document.
- Company name:(This information will be used only as control measure and data processing)
- The assurance service of sustainability reports is offered in the area:
- Auditing
- Consultancy
- Others: ___________
- How many years your company has been providing this service?
- How many sustainability reports has your company assured in the last year?
- What proportion of your clients of assurance of sustainability reports only hires this service?
- 0–25%
- 26–50%
- 51–75%
- 76–100%
- Indicate whether among its clients of assurance of sustainability reports predominates one of the following enterprise sizes:
- Micro-enterprise
- SMEs
- Big
- Multinationals
- There is no predominance of any size
- If there is a predominant industry among its clients of assurance of sustainability reports indicate which:(Maximum 5)
- Rate the motivations to offer this service (1 = none, 5 = very much):
1 2 3 4 5 Opportunity to open a new market niche Expansion of existing services Equalization of competence provided services Request from clients Stakeholder pressures Others Describe Others: - Indicate the service’s characteristics offered by your company (1 = never, 5 = always):
1 2 3 4 5 It covers all the information of the report It covers only specific sections of the report (social, economic or environmental) It covers only specific elements of the report (such as greenhouse emissions) It is verified that the information recorded represents events that actually occurred It is verified that all the relevant events were included, both positive and negative It is verified that the quantitative data was recorded in their correct amounts It is verified that the information is presented in accordance to a given standard It is verified that the information meets stakeholder expectations - Indicate the percentage of assurance engagements that culminate in the following opinions:
0–25% 26–50% 51–75% 76–100% Favourable With recommendations With incidences - Indicate whether the following characteristics correspond to the personnel carrying out the assurance of sustainability reports (1 = never; 5 = always):
1 2 3 4 5 Multidisciplinary teams are internally set External experts in economic matters are hired External experts in social matters are hired External experts in environmental matters are hired - Indicate whether the following tasks are performed to initiate assurance process (1 = never; 5 = always):
1 2 3 4 5 Engagements acceptance only if SR are drawn up following a standardized criteria (GRI, AA1000, etc.) Meetings with predecessor assurors, if any Checking the verifiability of the information’s Identification of business areas and group firms included in the report Identification of information needs of the company stakeholders CSR risk analysis for the company and its environment Analysis of the company’s internal control systems Identification of error risk in the assurance process Determination of criteria to establish information materiality Development of a work program with testing, scope and time - Indicate which tests are carried out in the assurance process (1 = never, 5 = always):
1 2 3 4 5 Visits to the company’s facilities Supporting documents review Analysis techniques and ratios comparison Arithmetic calculations Interviews with company staff Compliance checking with internal control system Written representations from management Confirmation of contained information by third parties Search for additional information by third parties Others Describe Others: - Indicate which of the following stakeholders are consulted in the assurance process and to what degree (1 = none, 5 = very much):
1 2 3 4 5 Company managers Shareholders Investors Providers Clients and consumers Employees NGO Public administration Organizations representing civil society Others Describe Others: - Do you support on the auditing report to assure the financial information contained in sustainability reporting?
- Do not
- Sometimes
- Yes, when it has been carried out by our company
- Yes, in any case
- What assurance standards do you use to assure sustainability reports? (Multiple choice answer)
- Any
- ISAE3000
- AA1000AS
- Others: ________
- What quality standards do you use to control the work? (Multiple choice answer)
- Any
- Own code
- ISQC1 from IFAC
- Others: _________
References
- AccountAbility. 2008. AA1000 Assurance Standard 2008. London: AccountAbility. [Google Scholar]
- Abidin, Shamharir, Vivien Beattie, and Alan Goodacre. 2010. Audit market structure, fees and choice in a period of structural change: Evidence from the UK—1998–2003. The British Accounting Review 42: 187–206. [Google Scholar] [CrossRef]
- Ackers, Barry, and Neil Stuart Eccles. 2015. Mandatory corporate social responsibility assurance practices: The case of king III in South Africa. Accounting, Auditing & Accountability Journal 28: 515–50. [Google Scholar]
- Ackers, Barry, and Bernard van Heerden. 2015. Can a conceptual framework for corporate social responsibility [CSR] assurance be developed? Corporate Ownership and Control 12: 8–23. [Google Scholar] [CrossRef]
- Adams, Carol A., and Richard Evans. 2004. Accountability, completeness, credibility and the audit expectations gap. Journal of Corporate Citizenship 14: 97–115. [Google Scholar] [CrossRef]
- Ballou, Brian, Dan L. Heitger, Charles E. Landes, and Moss Adams. 2006. The future of corporate sustainability reporting. Journal of Accountancy 202: 65–74. [Google Scholar]
- Barkess, Lynn, and Roger Simnett. 2012. The Provision of Other Services by Auditors: Independence and Pricing Issues. Accounting and Business Research 24: 99–108. [Google Scholar] [CrossRef]
- Bebbington, Jan, Elizabeth A. Kirk, and Carlos Larrinaga. 2012. The production of normativity: A comparison of reporting regimes in Spain and the UK. Accounting, Organizations and Society 37: 78–94. [Google Scholar] [CrossRef]
- Beck, Paul J., and Martin G. Wu. 2006. Learning by doing and audit quality. Contemporary Accounting Research 23: 1–30. [Google Scholar] [CrossRef]
- Bédard, Jean, Michelene T. Chi, Lynford E. Graham, and James Shanteau. 1993. Expertise in auditing; discussion. Auditing 12: 21. [Google Scholar]
- Böhringer, Christoph, and Patrick E. Jochem. 2007. Measuring the immeasurable—A survey of sustainability indices. Ecological Economics 63: 1–8. [Google Scholar] [CrossRef]
- Booysen, Frederik. 2002. An overview and evaluation of composite indices of development. Social Indicators Research 59: 115–51. [Google Scholar] [CrossRef]
- CorporateRegister.com. 2012. The CR Reporting Awards. Global Winners and Reporting Trends. London: CorporateRegister.com. [Google Scholar]
- CorporateRegister.com. 2013. CR Perspectives 2013: Global CR Reporting Trends and Stakeholders View. London: CorporateRegister.com. [Google Scholar]
- Craswell, Allen, Donald J. Stokes, and Janet Laughton. 2002. Auditor independence and fee dependence. Journal of Accounting and Economics 33: 253–75. [Google Scholar] [CrossRef]
- Darus, Faizah, Yussri Sawani, Mustaffa Mohamed Zain, and Tamoi Janggu. 2014. Impediments to CSR assurance in an emerging economy. Managerial Auditing Journal 29: 253–67. [Google Scholar] [CrossRef]
- De Beelde, Ignace, and Sanne Tuybens. 2015. Enhancing the credibility of reporting on corporate social responsibility in Europe. Business Strategy and the Environment 24: 190–216. [Google Scholar] [CrossRef]
- DeAngelo, Linda Elizabeth. 1981. Auditor size and audit quality. Journal of Accounting and Economics 3: 183–99. [Google Scholar] [CrossRef]
- Deegan, Craig, Barry J. Cooper, and Marita Shelly. 2006. An investigation of TBL report assurance statements: UK and European evidence. Managerial Auditing Journal 21: 329–71. [Google Scholar] [CrossRef]
- Dillard, Jesse. 2011. Double loop learning; or, just another service to sell: A comment on “The case of sustainability assurance: Constructing a new assurance service”. Contemporary Accounting Research 28: 1267–77. [Google Scholar] [CrossRef]
- Edgley, Carla Rhianon, Michael John Jones, and Jill Frances Solomon. 2010. Stakeholder inclusivity in social and environmental report assurance. Accounting, Auditing and Accountability Journal 23: 532–57. [Google Scholar] [CrossRef]
- Esty, Daniel C., Marc A. Levy, Tanja Srebotnjak, and Alex de Sherbinin. 2005. Environmental Sustainability Index: Benchmarking National Environmental Stewardship. New Haven: Yale Center for Environmental Law and Policy. [Google Scholar]
- Fernandez-Feijoo, Belen, Silvia Romero, and Silvia Ruiz. 2016. The assurance market of sustainability reports: What do accounting firms do? Journal of Cleaner Production 139: 1128–37. [Google Scholar] [CrossRef]
- Fernández-Feijóo-Souto, Belén, Silvia Romero, and Silvia Ruiz-Blanco. 2012. Measuring quality of sustainability reports and assurance statements: Characteristics of the high quality reporting companies. International Journal of Society Systems Science 4: 5–27. [Google Scholar]
- Fifka, Matthias S. 2013. Corporate responsibility reporting and its determinants in comparative perspective—A review of the empirical literature and a meta-analysis. Business Strategy and the Environment 22: 1–35. [Google Scholar] [CrossRef]
- Fonseca, Alberto. 2010. How credible are mining corporations’ sustainability reports? A critical analysis of external assurance under the requirements of the international council on mining and metals. Corporate Social Responsibility and Environmental Management 17: 355–70. [Google Scholar] [CrossRef]
- Fuhrmann, Stephan, Christian Ott, Elisabeth Looks, and Thomas W. Guenther. 2017. The contents of assurance statements for sustainability reports and information asymmetry. Accounting and Business Research 47: 369–400. [Google Scholar] [CrossRef]
- Gillet, Claire. 2012. A study of sustainability verification practices: The French case. Journal of Accounting & Organizational Change 8: 62–84. [Google Scholar]
- Gray, Rob. 2000. Current developments and trends in social and environmental auditing, reporting and attestation: A review and comment. International Journal of Auditing 4: 247–68. [Google Scholar] [CrossRef]
- GRI. 2013. G4 Sustainability Reporting Guidelines. Reporting Principles and Disclosures Standard. Amsterdam: Global Reporting Initiative. [Google Scholar]
- Gürtürk, Anil, and Rüdiger Hahn. 2016. An empirical assessment of assurance statements in sustainability reports: Smoke screens or enlightening information? Journal of Cleaner Production 136: 30–41. [Google Scholar] [CrossRef]
- Hasan, Mahreen, Steven Maijoor, Theodore J. Mock, Peter Roebuck, Roger Simnett, and Ann Vanstraelen. 2005. The different types of assurance services and levels of assurance provided. International Journal of Auditing 9: 91–102. [Google Scholar] [CrossRef]
- Herda, David N., Martin E. Taylor, and Glyn Winterbotham. 2014. The effect of country-level investor protection on the voluntary assurance of sustainability reports. Journal of International Financial Management & Accounting 25: 209–36. [Google Scholar]
- Hodge, Kristy, Nava Subramaniam, and Jenny Stewart. 2009. Assurance of sustainability reports: Impact on report users’ confidence and perceptions of information credibility. Australian Accounting Review 19: 178–94. [Google Scholar] [CrossRef]
- Huggins, Anna, Wendy J. Green, and Roger Simnett. 2011. The competitive market for assurance engagements on greenhouse gas statements: Is there a role for assurers from the accounting profession? Current Issues in Auditing 5: A1–A12. [Google Scholar] [CrossRef]
- IAASB. 2013. ISAE 3000 (Revised) Assurance Engagements Other than Audits or Reviews of Historical Financial Information. New York: International Federation of Accountants (IFAC). [Google Scholar]
- IFAC. 2015. Handbook of International Quality Control, Auditing, Review, Other Assurance, and Related Services Pronouncements. New York: International Federation of Accountants (IFAC). [Google Scholar]
- Jones, Ambrose, III, and Gregory A. Jonas. 2011. Corporate social responsibility reporting: The growing need for input from the accounting profession. The CPA Journal 81: 65–71. [Google Scholar]
- Jones, Peter, David Hillier, and Daphne Comfort. 2014. Assurance of the leading UK food retailers’ corporate social responsibility/sustainability reports. Corporate Governance 14: 130–38. [Google Scholar] [CrossRef]
- Junior, Renzo Mori, Peter J. Best, and Julie Cotter. 2014. Sustainability reporting and assurance: A historical analysis on a world-wide phenomenon. Journal of Business Ethics 120: 1–11. [Google Scholar] [CrossRef]
- King, Ronald R., and Rachel Schwartz. 1998. Planning assurance services. Auditing 17: 9–36. [Google Scholar]
- Knechel, W. Robert, Philip Wallage, Aasmund Eilifsen, and Bart Van Praag. 2006. The demand attributes of assurance services providers and the role of independent accountants. International Journal of Auditing 10: 143–62. [Google Scholar] [CrossRef]
- KPMG. 2008. The KPMG Survey of Corporate Responsibility Reporting 2008. Amstelveen: KPMG International. [Google Scholar]
- KPMG. 2011. The KPMG Survey of Corporate Responsibility Reporting 2011. Amstelveen: KPMG International. [Google Scholar]
- KPMG. 2015. The KPMG Survey of Corporate Responsibility Reporting 2015. Amstelveen: KPMG International. [Google Scholar]
- Krajnc, Damjan, and Peter Glavič. 2005. A model for integrated assessment of sustainable development. Resources, Conservation and Recycling 43: 189–208. [Google Scholar] [CrossRef]
- Lee, Chia-Chi. 2013. Business service market share, international operation strategy and performance. Baltic Journal of Management 8: 463–85. [Google Scholar] [CrossRef]
- Manetti, Giacomo, and Lucia Becatti. 2009. Assurance services for sustainability reports: Standards and empirical evidence. Journal of Business Ethics 87: 289–98. [Google Scholar] [CrossRef]
- Manetti, Giacomo, and Simone Toccafondi. 2012. The role of stakeholders in sustainability reporting assurance. Journal of Business Ethics 107: 363–77. [Google Scholar] [CrossRef]
- Manurung, Annisa Melissa, and Hardo Basuki. 2010. An analytical assessment of assurance practices in social environmental and sustainable reporting in the United Kingdom and North America. Gadjah Mada International Journal of Business 12: 75–115. [Google Scholar]
- Martínez-Ferrero, Jennifer, Isabel-María García-Sánchez, and Emiliano Ruiz-Barbadillo. 2018. The quality of sustainability assurance reports: The expertise and experience of assurance providers as determinants. Business Strategy and the Environment, 1–16. [Google Scholar] [CrossRef]
- Marx, Ben, and Vanessa van Dyk. 2011. Sustainability reporting and assurance: An analysis of assurance practices in South Africa. Meditari Accountancy Research 19: 39–55. [Google Scholar] [CrossRef]
- Michelon, Giovanna, Silvia Pilonato, and Federica Ricceri. 2015. CSR reporting practices and the quality of disclosure: An empirical analysis. Critical Perspectives on Accounting 33: 59–78. [Google Scholar] [CrossRef]
- Mock, Theodore J., Christiane Strohm, and Kevin M. Swartz. 2007. An examination of worldwide assured sustainability reporting. Australian Accounting Review 17: 67–77. [Google Scholar] [CrossRef]
- Naranjo-Gil, David. 2006. Overcoming the difficulties of using the survey in management accounting research: An empirical application. Spanish Journal of Finance and Accounting 129: 361–85. [Google Scholar]
- O’Dwyer, Brendan. 2011. The case of sustainability assurance: Constructing a new assurance service. Contemporary Accounting Research 28: 1230–66. [Google Scholar] [CrossRef]
- O’Dwyer, Brendan, and David L. Owen. 2005. Assurance statement practice in environmental, social and sustainability reporting: A critical evaluation. The British Accounting Review 37: 205–29. [Google Scholar] [CrossRef]
- O’Dwyer, Brendan, David L. Owen, and Jeffrey Unerman. 2011. Seeking legitimacy for new assurance forms: The case of assurance on sustainability reporting. Accounting, Organizations and Society 36: 31–52. [Google Scholar] [CrossRef]
- Owen, David L., and Brendan O’Dwyer. 2004. Assurance Statement Quality in Environmental, Social and Sustainability Reporting: A Critical Evaluation of Leading Edge Practice. Nottingham: International Centre for Corporate Social Responsibility. [Google Scholar]
- Perego, Paolo. 2009. Causes and consequences of choosing different assurance providers: An international study of sustainability reporting. International Journal of Management 26: 412–25. [Google Scholar]
- Perego, Paolo, and Ans Kolk. 2012. Multinationals’ accountability on sustainability: The evolution of third-party assurance of sustainability reports. Journal of Business Ethics 110: 173–90. [Google Scholar] [CrossRef]
- Pflugrath, Gary, Peter Roebuck, and Roger Simnett. 2011. Impact of assurance and assurer’s professional affiliation on financial analysts’ assessment of credibility of corporate social responsibility information. Auditing: A Journal of Practice & Theory 30: 239–54. [Google Scholar]
- Rossi, Adriana, and Lara Tarquinio. 2017. An analysis of sustainability report assurance statements: Evidence from Italian listed companies. Managerial Auditing Journal 32: 578–602. [Google Scholar] [CrossRef]
- Sethi, S. Prakash, Terrence F. Martell, and Mert Demir. 2017. Enhancing the role and effectiveness of corporate social responsibility (CSR) reports: The missing element of content verification and integrity assurance. Journal of Business Ethics 144: 59–82. [Google Scholar] [CrossRef]
- Sierra, Laura, María A. García-Benau, and Ana Zorio. 2014. Credibility in Latin America of corporate social responsibility reports. Revista De Administração De Empresas 54: 28–38. [Google Scholar] [CrossRef]
- Simnett, Roger. 1996. The effect of information selection, information processing and task complexity on predictive accuracy of auditors. Accounting, Organizations and Society 21: 699–719. [Google Scholar] [CrossRef]
- Simnett, Roger, Ann Vanstraelen, and Wai Fong Chua. 2009. Assurance on sustainability reports: An international comparison. The Accounting Review 84: 937–67. [Google Scholar] [CrossRef]
- Simnett, Roger, Elizabeth Carson, and Ann Vanstraelen. 2016. International archival auditing and assurance research: Trends, methodological issues, and opportunities. Auditing: A Journal of Practice & Theory 35: 1–32. [Google Scholar]
- Singh, Rajesh Kumar, H. Ramalinga Murty, S. Kumar Gupta, and A. Kumar Dikshit. 2012. An overview of sustainability assessment methodologies. Ecological Indicators 15: 281–99. [Google Scholar] [CrossRef]
- Smith, John, Ros Haniffa, and Jenny Fairbrass. 2011. A conceptual framework for investigating ‘capture’ in corporate sustainability reporting assurance. Journal of Business Ethics 99: 425–39. [Google Scholar] [CrossRef]
- UNDP. 2005. Human Development Report 2005. Oxford: Oxford University Press. [Google Scholar]
- Wallage, Philip. 2000. Assurance on sustainability reporting: An auditor’s view. Auditing: A Journal of Practice & Theory 19: 53–65. [Google Scholar]
- Zorio, Ana, Maria A. García-Benau, and Laura Sierra. 2013. Sustainability development and the quality of assurance reports: Empirical evidence. Business Strategy and the Environment 22: 484–500. [Google Scholar] [CrossRef]
- Zorio-Grima, Ana, María A. García-Benau, and Laura Sierra-García. 2015. Sustainability report assurance in Spain and Latin America. Innovar 25: 85–101. [Google Scholar]

© 2018 by the authors. Licensee MDPI, Basel, Switzerland. This article is an open access article distributed under the terms and conditions of the Creative Commons Attribution (CC BY) license (http://creativecommons.org/licenses/by/4.0/).