1. Introduction
Modern technological development contributes to the continued growth of multimedia databases in various areas of life. As a result, it raises problems in the management of large libraries of such data, in particular in relation to automated search, interpretation and indexing of digital images or video sequences. Non-automated retrieval and interpretation are undoubtedly the most effective form of data analysis; however, in the case of very extensive databases (often comprising hundreds of thousands or millions of objects), this method is hard to implemented. A similar situation is observed in the case of imaging data analysed for the needs of geological sciences. The universal access to cameras and digital video recorders results in a radical increase of archives and multimedia databases. Unfortunately, such sets are frequently labelled incorrectly, and thus searching for appropriate information in these databases (minerals, inclusions, structures, textures, etc.) is time-consuming and sometimes impossible. This situation makes it necessary to develop and verify techniques that would allow automated management of imaging data sets. These include, for example, image retrieval techniques which have been actively developed in recent years [
1,
2,
3,
4,
5]. Image retrieval methods use both verbal and image information. In this paper, we describe a relatively new methodology, namely on the retrieval of images or their fragments based on a manually created drawing (sketch) [
6,
7,
8]. The study describes the suggested methods of the Query by Sketch (QBS) and outlines the possibilities of their application for the needs of geological research. The methods described allow for full or partial automation of searching through databases of microscopic images of rocks obtained in the course of documenting and testing of deposits.
2. Query by Example
Image retrieval, in its most general form, is divided into two main approaches. The first approach retrieves images based on the metadata describing the image (TBIR—text-based image retrieval, concept-based image indexing). The second approach (discussed in this paper) retrieves images based on the analysis of the content of the images (CB(V)IR—content-based (visual) image retrieval) [
9,
10,
11]. TBIR-type image retrieval systems are impractical for extensive collections of geological images, as they require the labelling of each image with a text description. The natural upshot of the situation described is the inclination towards image retrieval systems which are founded on the analysis of the content of the images (CBIR). To a considerable extent, these systems can reflect the way in which images are compared by the human brain. The idea behind the CBIR systems is the identification of an effective way to compare images by referring to the content represented by image pixels. These techniques are used in certain aspects of computer graphics, interactions between the computer and the human, and database mining—for example—image mining. The common denominator of research on CBIR-related issues is the analysis of digital images in terms of differences between colours, textures and content of the images, e.g., in the context of quantitative analysis, the analysis of object shapes, for both the search key and the viewed images.
There are different forms of posing a query by image. In general, a query can be specified by means of an example of an image (QBIC—Query by Image Content, QBE—Query by Example), by an example of a group of images (QBGE—Query by Group Example), and by means of a simplified sketch of the image (QBS—Query by Sketch, or QBC—Query by Canvas) [
12,
13,
14,
15,
16]. These methods are founded on the principal assumptions of the CBIR methodology, where both the search query and the database of the images explored are processed in order to extract their characteristic features, which are then compared and adjusted according to set criteria [
17].
A diagram of image retrieval based on the query by sketch assumes that in order to find a specific image or object, the user sends a query to the system in the form of a manually created sketch of an object and in response receives an image with a certain similarity (or group of images). Both the sketch (search query) and the set of images in the database may be subject to appropriate processing, for instance to extract their characteristic features. These features are compared and adjusted according to the established criteria. The result may be a ranking of images included in the search, sorted in the order of decreasing similarity to the query in the form of an image (see
Figure 1).
A key problem in the system described is the selection of appropriate parameters describing the objects and the selection of their adjustment criteria. The criteria for the adjustment of image parameters are determined by many factors, for instance: the purpose of the system and the functional operation (searching for a fragment of the image, searching for similar fragments of the image, tracking a given object or similar objects), the type of data comprising the system, and factors other than functional requirements, such as the speed of operation.
3. Materials and Methods
The methodology proposed in this paper concerns two tasks, i.e., retrieval from the image database of objects visually similar to the sketch and retrieval of images from the database which have a similar share or distribution of objects as on the sketch. These tasks will be discussed on the basis of porosity analyses of carbonate rock and sandstone. In these rocks, the pore space was filled with blue resin. It is a commonly used practice which aims to simplify the detection of pore space.
3.1. Sketch Preparation
In the context of the matter in question, a sketch of an image is understood as a digital image on a white background, where the edges mark the areas of the objects which are to be further analysed. The proposed method standardises the drawn sketch in relation to the background (known as canvas); therefore, no boundary conditions are set in the form of sketch dimensions. Two types of queries are considered. The first query is for the retrieval of the most similar object—in this case, the search query should be a sketch of a single object (
Figure 2a). In order to retrieve images with the best matching pore space distribution, a search query with at least two objects indicating the porosity intensity through their distribution is taken into account (
Figure 2b).
Images created manually or generated using graphics software (MS Paint for instance) should be transform into an objects useful for image analysis. To do this, the completion of the images is set, the outlines are closed and the areas surrounded by a boundary are filled in.
3.2. Object Segmentation
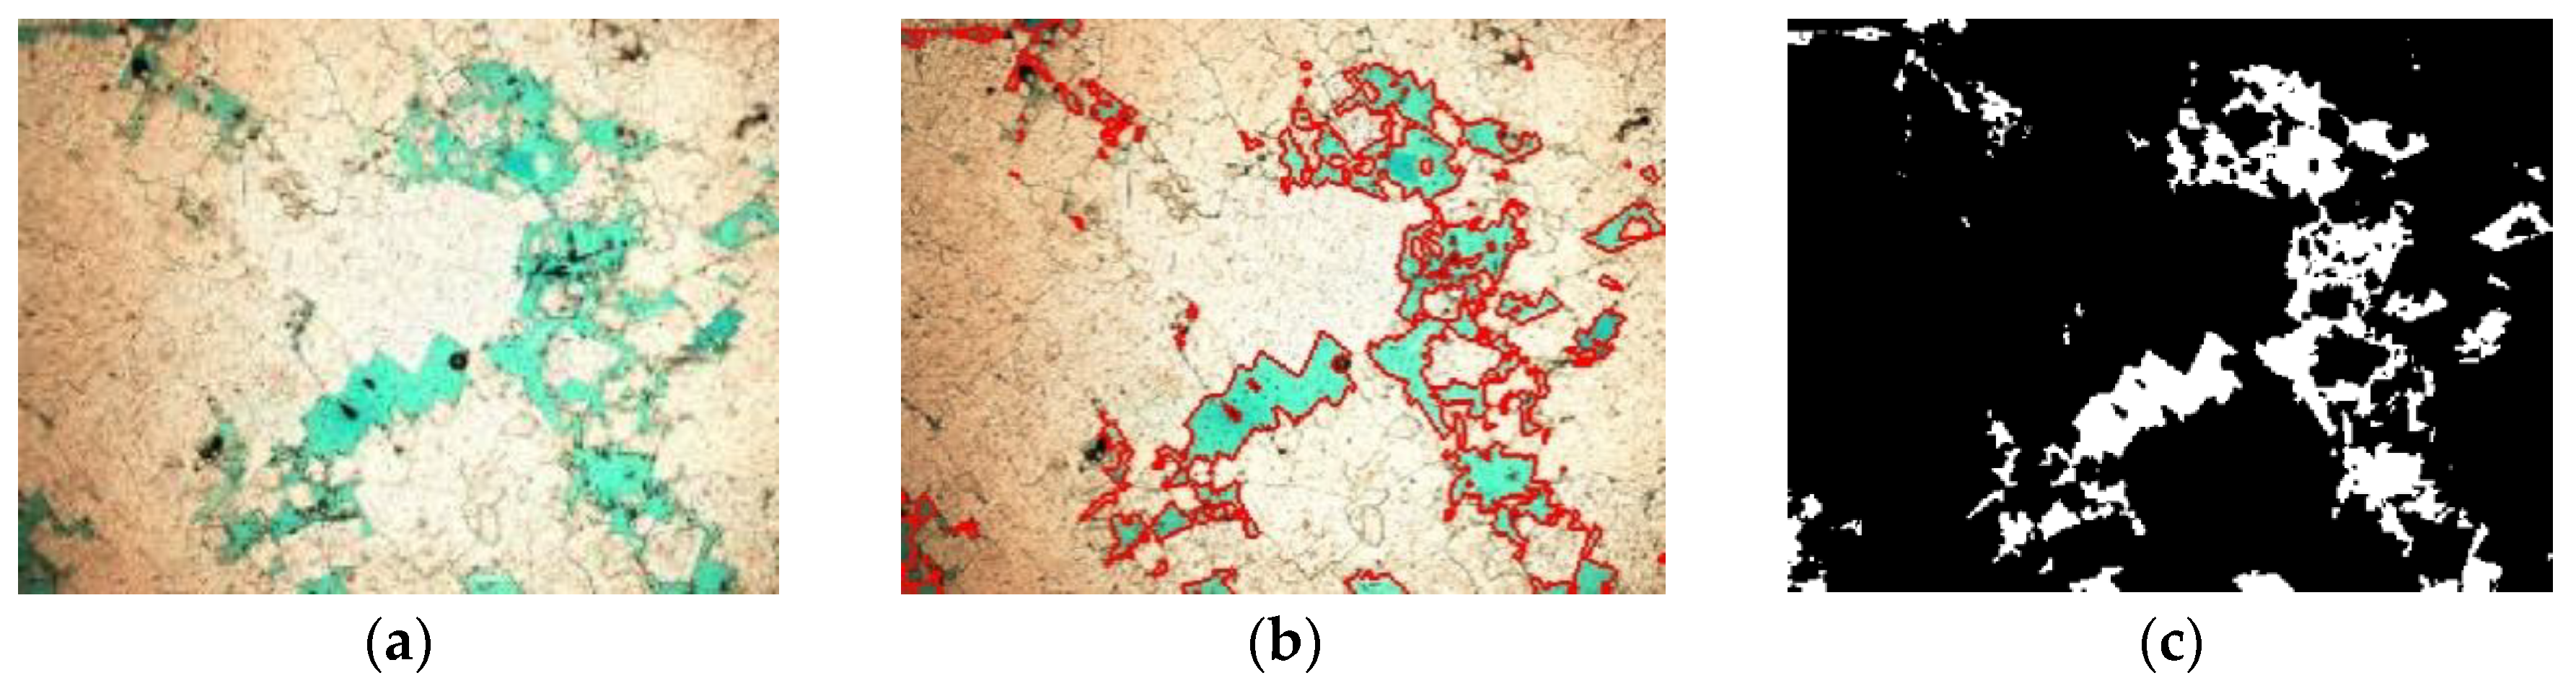
The next step in the analysed method is porosity detection for the entire set of data (
Figure 3). It was carried out by using the adaptation of the segmentation algorithm through grey level clusters. One of the most popular methods of data clustering, i.e., the k-means method [
18,
19] was employed. This approach assigns value ‘1’ to classes containing pixels with brightness in a given colour range of pore space and ‘0’ to the remainder. These ranges are determined by the selection of the k parameter using the k-means method, i.e., the number of resulting clusters [
20]. This number can be set apriori or determined automatically (with for example followed methods: Dunn’s Index [
21], Davies Bouldin index, Calinski-Harabasz [
22] or Silhouette criteria [
23], gap statistic or Elbow methods [
24,
25,
26]. The images obtained for 2 clusters were the basis for calculating the values of object features or entire images, representing porosity characteristics in the images. These images are subject to the retrieval method of similar objects/pores and similar areas/images.
3.3. Retrieving Similar Objects
The method of retrieving similar objects is presented in a pseudo-algorithmic form in
Figure 4. It involves downloading both the key (query) and the image database. A sketch of the image is prepared in line with the procedure described in the previous chapter. Then the algorithm performs a segmentation of the pore space for the image database. The values of selected parameters are then calculated both for the query and all images in the database. These values are used to create a set of parameters describing each object. These parameters can be a shape, orientation, size, etc. There exist many approaches which use different types of descriptors. Unfortunately, they are often determined by numerous internal parameters, which significantly hampers their optimal selection in regard to universal image retrieval in geology. In the literature, simple parameters are often used, which do not require internal parameters to be provided but are based directly on the geometric representation of the object. These include the surface area, side length ratio, Feret diameter, etc. The paper suggests that the feature space is founded on the following parameters:
Area of the object,
Equivalent Diameter (diameter of a circle with the same area as the object)
Major axis of the fitted ellipse,
Minor axis of the fitted ellipse,
Orientation (angle between the x-axis and the major axis of the best fitted ellipse).
To avoid the excessive impact of the scale of the sketch, it is possible to remove dimensionality through parameter scaling. In the research, the Area parameter was divided by the surface area of the entire sketch, while Equivalent Diameter, Major axis of the fitted ellipse and Minor axis of the fitted ellipse parameters were divided by the element from the surface area of the sketch (or appropriately, the database image). The Orientation parameter was left unscaled. The parameters obtained were then normalized from the set minimum to the set maximum.
The similarities between the query feature vector and the image feature vectors for the images in the database were then determined. There are many ways of determining the similarity between objects. For example, it is possible to use distance analysis methods in feature spaces (e.g., Euclidean, Minkowski, etc.). For the purpose of this study, the Sum of Squared Differences (SSD) was used as a measure of similarity. The lowest results of the SSD values indicate the closest location in the feature space, which may indirectly translate into considerable similarity.
3.4. Retrieving Similar Distribution of Objects
Having a database that includes thousands of images we might need to retrieve an image (and in a result, a rock or a piece of the rock mass) with a given distribution of objects (porosity). Such images could be for example those presented in
Figure 5 and which are the sketches of images with the porosity created by small pores (a), the sketches of porosity created by large pores (b), sketches with porosity created by large pores next to the lack of porosity (c) or those with high porosity created by small pores next to high porosity created by large pores (d). Searching databases with the purpose of retrieving the described situations can be performed by providing a mathematical description of such structure and then searching the entire database to find an image which is the closest to this description. However, according to the authors, this task is difficult and requires engagement of a specialist that is able to prepare such mathematical description. This is why we recommend another method, which is based on Query by Sketch.
In the case of similarity retrieval in a distribution of objects (porosity), the procedure is similar to the one described in the previous chapter (see
Figure 4). It is proposed to load the images and to process them in order to detect the objects both in the database and in the search query. The parameters describing the “arrangement” of the objects in the image are then extracted. It is proposed to standardise these parameters in order to obtain relative values. The case of retrieving the most similar image from the entire database differs from the previously described case mainly in the preparation of the feature space. The analysis of the arrangement of objects can determine the feature space and the features dependent on:
the surface area (e.g., detected porosity);
the average size of the object in the image;
the skewness of the surface areas of individual objects—it indicates the distribution of their feature and its asymmetry on the images;
the range of features (surface area)—it is the difference between extreme objects on the image.
It is worth noting that it is possible to calculate selected parameters for fragments (Regions of Interest) of the image. The images can be divided according to the set thresholds, for example, at half height and using the width of the image. In the opinion of the authors, the division of such an image results in four main parts that are easily interpretable by a human, which may be important from the point of view of the preparation of a sketch (
Figure 5). The possibility of dividing the image into more Regions of Interest (ROIs) can also be taken into account, on an individual basis.
4. Result and Discussion
As many as 880 images presenting a variable degree of porosity were included in the study. Once loaded, the porosity detection method described in
Section 3.2 was applied. It leads to the segmentation of the areas distinguished by the blue colour obtained by soaking the sample in resin.
Segmentation was applied through grey level clusters. Next, the detected objects were subject to parametrisation (as described in
Section 3.3) and on this basis a feature vector was built, which is the basis for determining the similarity between the sketch and the data set. The feature space defined in
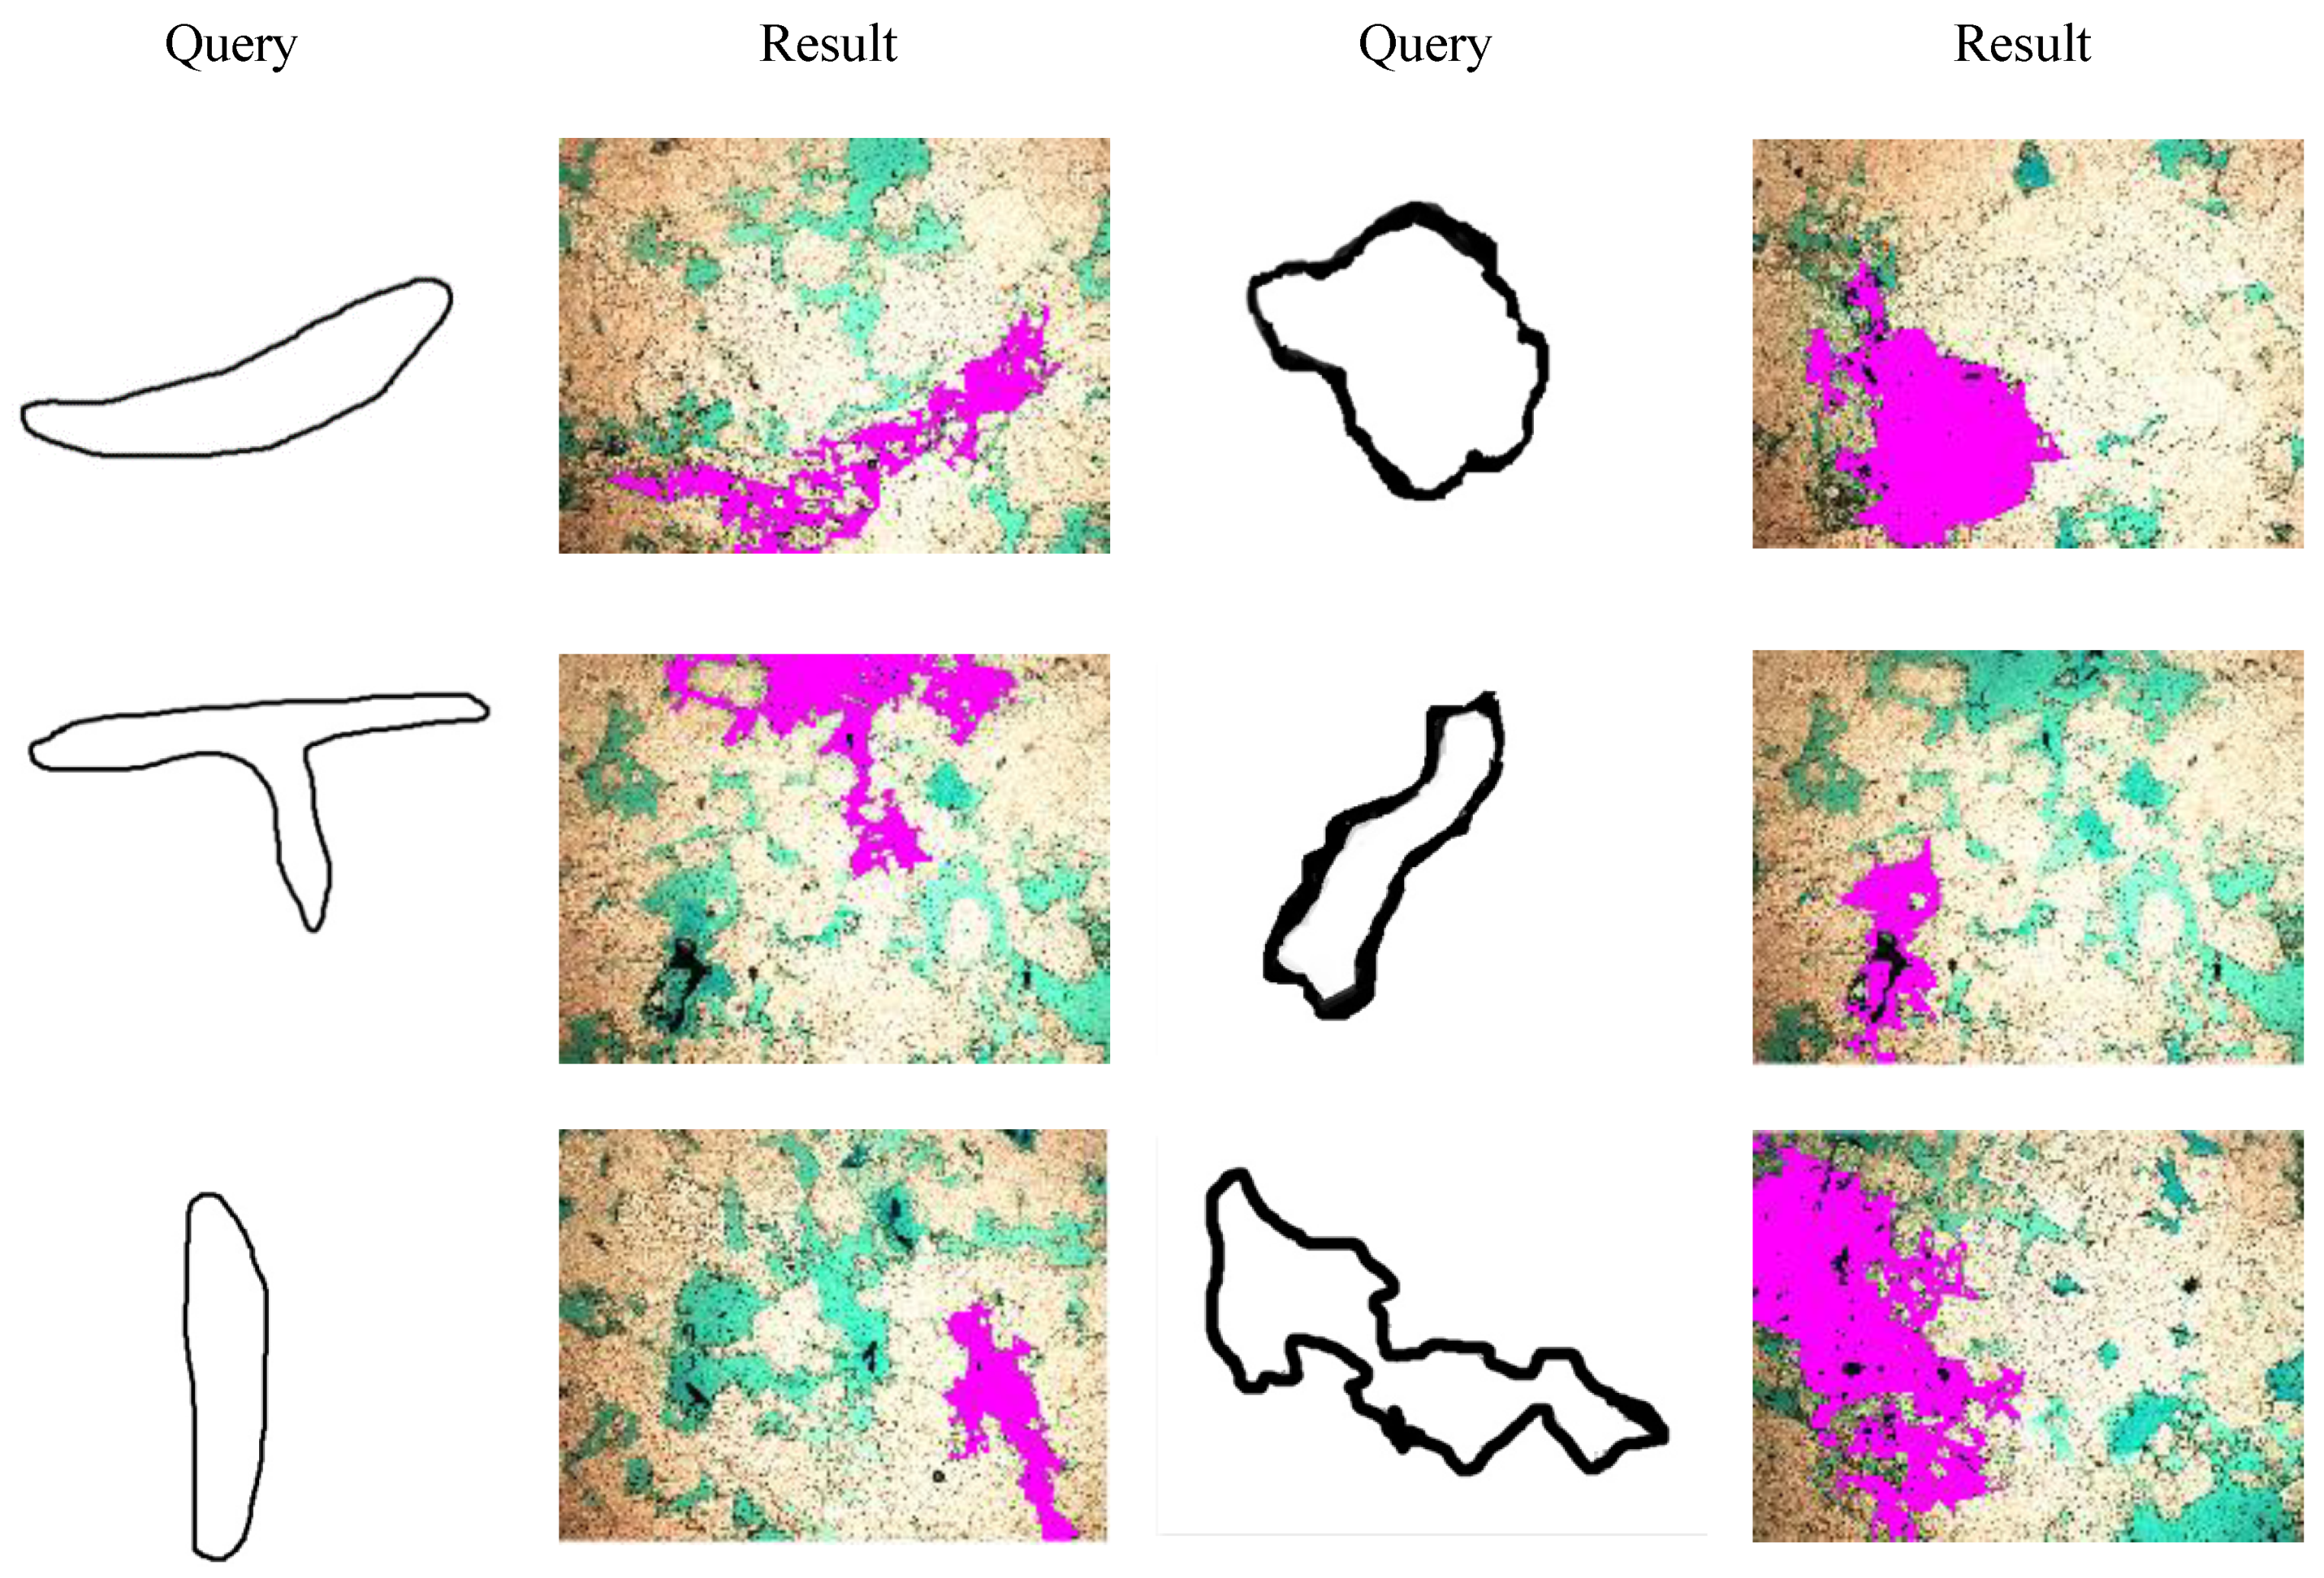
Section 3.3 was used. For each query, a ranking of the most similar objects was determined. The samples of best match in this ranking is shown in
Figure 6. The results obtained make it possible to confirm that such retrieval is satisfactory.
Retrieving similar sets of objects (similar porosity distribution) requires that the feature space is replaced with that proposed in
Section 3.4 and based on parameters of filling particular areas with query and data base.
In this method, when retrieving porosity by drawing large areas in the appropriate part of the image, we obtain images from the database with a similar porosity distribution. A functional effect can therefore be achieved: “return all images with a similar pore fill rate in a given part of the image, as on the sketch”.
Figure 7 presents images with the best match from the database under analysis (880 images). The result of processing the query is also presented, as described in
Section 3.1.
5. Conclusions
The paper presents a description of the researches on the method of retrieving microscopic images of rocks or their fragments. The assumption of the retrieval method is to base only on the query by sketch. The sketch is an image created manually by the user, and can be created using a raster graphics editor. It is assumed that a sketch may represent a pattern—the shape of one object, for instance a cross-section of a pore. This sketch can then become a template for the retrieval methodology for the most similar objects. In addition, the sketch may present multiple objects for the retrieval of areas with a similar distribution of objects (e.g., porosity) in the images. The description of partial methods was also presented, i.e., the method of sketch preparation and the method of porosity detection in a microscopic image of porous rock (segmentation). The paper also includes a description of sample features of the detected porosity for a sketch—query and database. On this basis, illustrative retrieval of selected sample sketches was made. The results obtained show that the creation of a retrieval method for extensive image sets is possible on the basis of an artificial sketch. Although the paper focuses only on porosity analysis, this method can also be used to retrieve other objects of interest to geologists. However, it should be remembered that the main prerequisite for the success of this methodology is the ability to perform correct segmentation of analysed objects in all images in the database. The methodology described seems to be an interesting and innovative approach to geological data management. In the opinion of the authors, it may constitute one of the potential functionalities of IT systems intended for the geology and mining industry.
Author Contributions
Conceptualization, M.H. and M.M.; methodology, M.H. and M.M.; software, M.H.; validation, M.H., M.M.; investigation, M.H., M.M.; resources, M.M.; data curation, M.H., M.M.; writing—original draft preparation, M.H.; writing—review and editing, M.H., M.M.; visualization, M.H. and M.M.; supervision, M.M. All authors have read and agreed to the published version of the manuscript.
Funding
This research received no external funding.
Acknowledgments
This work was financed by the AGH—University of Science and Technology, Faculty of Geology, Geophysics and Environmental Protection as a part of statutory project.
Conflicts of Interest
The authors declare no conflict of interest.
References
- Datta, R.; Joshi, D.; Li, J.; Wang, J.Z. Image retrieval: Ideas, influences, and trends of the new age. ACM Comput. Surv. 2008, 40, 5. [Google Scholar] [CrossRef]
- Liu, Y.; Zhang, D.; Lu, G.; Ma, W.Y. A survey of content-based image retrieval with high-level semantics. Pattern Recognit. 2007, 40, 262–282. [Google Scholar] [CrossRef]
- Ładniak, M.; Młynarczuk, M. Search of visually similar microscopic rock images. Comput. Geosci. 2015, 19, 127–136. [Google Scholar] [CrossRef] [Green Version]
- Młynarczuk, M.; Habrat, M.; Skoczylas, N. The application of the automatic search for visually similar geological layers in a borehole in introscopic camera recordings. Measurement 2016, 85, 142–151. [Google Scholar] [CrossRef]
- Habrat, M.; Młynarczuk, M. Evaluation of Local Matching Methods in Image Analysis for Mineral Grain Tracking in Microscope Images of Rock Sections. Minerals 2018, 8, 182. [Google Scholar] [CrossRef] [Green Version]
- Cao, Y.; Wang, H.; Wang, C.; Li, Z.; Zhang, L.; Zhang, L. Mindfinder: Interactive sketch-based image search on millions of images. In Proceedings of the 18th ACM International Conference on Multimedia, Firenze, Italy, 25–29 October 2010; pp. 1605–1608. [Google Scholar]
- Di Sciascio, E.; Mingolla, G.; Mongiello, M. Content-based image retrieval over the web using query by sketch and relevance feedback. In International Conference on Advances in Visual Information Systems; Amsterdam, The Netherlands, 2–4 June 1999, Lecture Notes in Computer Science 1614; Springer: Berlin/Heidelberg, Germany, 1999; pp. 123–130. [Google Scholar]
- Di Sciascio, E.; Mongiello, M. Query by sketch and relevance feedback for content-based image retrieval over the web. J. Vis. Lang. Comput. 1999, 10, 565–584. [Google Scholar] [CrossRef] [Green Version]
- Aigrain, P.; Zhang, H.; Petkovic, D. Content-based representation and retrieval of visual media: A state of the art review. In Representation and Retrieval of Visual Media in Multimedia Systems; Kluwer Academic Publishers: Boston, MA, USA, 1996; pp. 3–26. [Google Scholar]
- Sivic, J.; Zisserman, A. Video google: A text retrieval approach to object matching in videos. In Proceedings of the Ninth IEEE International Conference on Computer Vision, Nice, France, 13–16 October 2003; pp. 1470–1477. [Google Scholar]
- Vikhar, P.A. Content-based image retrieval (CBIR): State-of-the-art and future scope for research. IUP J. Inf. Technol. 2010, 6, 68–84. [Google Scholar]
- Flickner, M.; Sawhney, H.; Niblack, W.; Ashley, J.; Huang, Q.; Dom, B.; Gorkani, M.; Hafner, J.; Lee, D.; Petkovic, D.; et al. Query by image and video content: The QBIC system. IEEE Comput. Mag. 1995, 28, 23–32. [Google Scholar] [CrossRef] [Green Version]
- Jiang, Y.G.; Wang, J.; Xue, X.; Chang, S.F. Query-adaptive image search with hash codes. IEEE Trans. Multimed. 2013, 15, 442–453. [Google Scholar] [CrossRef]
- Rorissa, A. Image retrieval: Benchmarking visual information indexing and retrieval systems. Bull. Assoc. Inf. Sci. Technol. 2007, 33, 15–17. [Google Scholar] [CrossRef]
- Springmann, M.; Ispas, A.; Schuldt, H.; Norrie, M.; Signer, B. Towards query by sketch. In Proceedings of the 2nd DELOS Conference on Digital Libraries, Pisa, Italy, 5–7 December 2007. [Google Scholar]
- Lim, J.H.; Jin, J.S. A structured learning framework for content-based image indexing and visual query. Multimed. Syst. 2005, 10, 317–331. [Google Scholar] [CrossRef] [Green Version]
- Zhou, X.S.; Huang, T.S. CBIR: From low-level features to high-level semantics. In: Image and Video Communications and Processing. Int. Soc. Opt. Photonics 2000, 3974, 426–432. [Google Scholar]
- Jain, A.K. Data clustering: 50 years beyond K-means. Pattern Recognit. Lett. 2010, 31, 651–666. [Google Scholar] [CrossRef]
- Hartigan, J.A.; Wong, M.A. Algorithm as 136: A k-means clustering algorithm. Appl. Stat. 1979, 28, 100–108. [Google Scholar] [CrossRef]
- Chen, T.W.; Chen, Y.L.; Chien, S.Y. Fast image segmentation based on k-means clustering with histograms in HSV color space. In Proceedings of the IEEE 10th Workshop on Multimedia Signal Processing, Cairns, Australia, 8–10 October 2008; pp. 322–325. [Google Scholar]
- Dunn, J.C. A fuzzy relative of the ISODATA process and its use in detecting compact well-separated clusters. J. Cybern. 1973, 3, 32–57. [Google Scholar] [CrossRef]
- Maulik, U.; Bandyopadhyay, S. Performance evaluation of some clustering algorithms and validity indices. IEEE Trans. Pattern Anal. Mach. Intell. 2002, 24, 1650–1654. [Google Scholar] [CrossRef] [Green Version]
- Rousseeuw, P.J. Silhouettes: A graphical aid to the interpretation and validation of cluster analysis. J. Comput. Appl. Math. 1987, 20, 53–65. [Google Scholar] [CrossRef] [Green Version]
- Kodinariya, T.M.; Makwana, R.P. Review on determining number of cluster in k-means clustering. Int. J. Adv. Res. Comput. Sci. Manag. Stud. 2013, 1, 90–95. [Google Scholar]
- Ray, S.; Turi, R.H. Determination of number of clusters in k-means clustering and application in colour image segmentation. In Proceedings of the 4th International Conference on Advances in Pattern Recognition and Digital Techniques, Calcutta, India, 28–31 December 1999; pp. 137–143. [Google Scholar]
- Tibshirani, R.; Walther, G.; Hastie, T. Estimating the number of clusters in a data set via the gap statistic. J. R. Stat. Soc. Ser. B (Stat. Methodol.) 2001, 63, 411–423. [Google Scholar] [CrossRef]
© 2019 by the authors. Licensee MDPI, Basel, Switzerland. This article is an open access article distributed under the terms and conditions of the Creative Commons Attribution (CC BY) license (http://creativecommons.org/licenses/by/4.0/).

