Featured Application
This paper presents a laser ultrasonic testing (LUT) method for the inspection of internal hole defects in a Ti-6Al-4V part produced by additive manufacturing (AM). The LUT system achieved a resolution in sub-millimeter scale, demonstrating its significant potential in the quality evaluation of additive manufactured part.
Abstract
For a non-contact, non-destructive quality evaluation, laser ultrasonic testing (LUT) has received increasing attention in complex manufacturing processes, such as additive manufacturing (AM). This work assessed the LUT method for the inspection of internal hole defects in additive manufactured Ti-6Al-4V part. A Q-switched pulsed laser was utilized to generate ultrasound waves on the top surface of a Ti-6Al-4V alloy part, and a laser Doppler vibrometer (LDV) was utilized to detect the ultrasound waves. Sub-millimeter (0.8 mm diameter) internal hole defect was successfully detected by using the established LUT system in pulse-echo mode. The method achieved a relatively high resolution, suggesting significant application prospects in the non-destructive evaluation of AM part. The relationship between the diameter of the hole defects and the amplitude of the laser-generated Rayleigh waves was studied. X-ray computed tomography (XCT) was conducted to validate the results obtained from the LUT system.
1. Introduction
Additive manufacturing (AM) is a type of technology in which an entity part is manufactured by means of a gradual accumulation of materials. Information is obtained via computer-aided design (CAD), and the part is built in a layer-by-layer style. In recent years, AM processes such as selective laser melting (SLM) and laser-engineered net shaping (LENS) have gained increasing attention as a type of AM technology. The AM process offers many advantages over conventional machining technology, such as the diversity of materials available and no limitation on the structural complexity of modeling part [1]. Despite these advantages, material discontinuities can be caused due to the complex environment of the AM process. The most common material discontinuities are voids and pores situated in the bulk of the fused material. Such defects seriously affect the mechanical properties of the workpiece, limiting the development and application of the AM process [2]. Therefore, there is an urgent need for non-destructive quality evaluation technology for the process control of AM. At present, the most commonly used technologies for the characterization of internal defects in AM part are X-ray computed tomography (XCT) and ultrasonic testing (UT) [3].
XCT is a test technology that provides information on the spatial distribution of X-ray absorption in analyzed structures. The sample can be reconstructed in three dimensions, and its internal porosities can be assessed [4]. Ziółkowski et al. utilized XCT to detect the discontinuity and porosity of 316 L stainless-steel parts produced by AM, showing that the porosity of AM samples ranged from 0.15% to 0.39% and that the highest resolution of the defects was 70 μm, depending upon the voxel size of the XCT machine [5]. Cunningham et al. used ultrahigh-speed synchrotron X-ray imaging to quantify the phenomenon of vapor depression during the laser melting of metals. The evolution of melt pool and vapor depression under stationary laser illumination were well observed [6]. UT uses the signals reflected from defects, to characterize the internal structure of the sample. Hans et al. accessed several features of UT such as the sound velocity and its variation due to microstructural parameters, using a well-designed AM part. The minimum internal defect that can be detected is of 1 mm thickness [7]. Rieder et al. set an ultrasonic transducer at the bottom side of the building platform. Different from the traditional methods, the transducer fixed under the bottom side of the platform can avoid the interference from the complex environment of building chamber. Therefore, it can be utilized for online monitoring. By plotting A-Scan signals after each layer-wise melting, discontinuities in the interfaces between adjacent layers can be identified but not quantitatively evaluated [8]. Karthik et al. used high-frequency ultrasonic signals to investigate AM parts. It was found that ultrasonic parameters such as signal amplitude and velocity were very sensitive, with small physical changes leading to drastic changes in these parameters [9]. Raguvarun et al. used both XCT and UT methods to evaluate the porosity of titanium samples fabricated by gas tungsten arc welding (GTAW), finding that a change in process parameter, namely wire feed, significantly affected the porosity of the sample fabricated by GTAW [10]. However, owing to the relatively large size of XCT equipment and the coupling agent needed for UT, their application has been limited [2].
The laser ultrasonic testing (LUT) technique has been around for about 20 years, which can be applied to the non-contact and non-destructive inspection in many areas, including nondestructive inspection, quality assurance testing, and structural health monitoring [11,12]. The performance of LUT technique has been constantly improved in recent years by advances in material sciences and fabrication technology [13]. However, the technology has not attracted attention before, due to significantly high costs of installation and complexity of the data interpretation. With the advent of advanced manufacturing processes, such as metal-additive manufacturing, it is possible to integrate the laser with the printing system, to provide real-time monitoring solution. The LUT method uses a pulsed laser source to generate ultrasound waves on a sample surface. Once the pulsed laser irradiates on the sample surface, a tiny area around the incident point is instantaneously heated by the high-energy pulsed laser [14]. The strain and stress fields induced by thermoelastic mechanism (in a few cases, thermal ablation mechanism) on the sample surface cause fluctuations in the heated zone, generating ultrasonic waves inside the sample [15]. A laser Doppler vibrometer (LDV) can be used to detect these ultrasonic waves as micro-displacements on the sample surface [16]. Compared with conventional UT methods, ultrasonic waves generated by pulsed laser have broader bandwidth and higher energy. Moreover, the non-contact characteristic makes LUT suitable for online quality monitoring in complicated working conditions, such as the SLM and LENS processes [17]. Gao et al. presented a laser ultrasonic method for the analysis of transient Lamb waves in a thin-plate structure, which can directly estimate the thickness of the plate [18]. Pei et al. utilized an electromagnetic acoustic transducer (EMAT) to detect ultrasonic waves in LUT of internal hole defects of aluminum parts, finding that only defects with a diameter larger than 1 mm could be identified [19]. In addition, a numerical model based on the finite element method was developed for crack inspection, using laser-induced ultrasonic waves; cracks with various depths were evaluated by the shadow method [20]. Lee et al. improved the damage evaluation algorithm of UPI technology through the introduction of a wavelet-transformed ultrasonic propagation imaging method [21] and investigated the internal delaminations in wind-turbine blades. Delaminations with length of 20 mm were identified by using the proposed LUT system [22]. Sun et al. utilized a constraint layer on the aluminum sample surface to change the propagation direction and the generation efficiency of the longitudinal wave. Defects with a diameter larger than 0.8 mm could be identified by using the transmission mode, indicating that the generation laser and detection laser were located on opposite sides of the sample [23]. Wu et al. utilized a flexible ultrasonic transducer (FUT) for non-destructive characterization of metallic pipes at high temperature of up to 176 °C. Compared with normal ultrasound transducers, the FUT had great potential for non-destructive evaluation of structures in high temperature environments [24]. Hong et al. developed a nonlinear ultrasonic testing method for delamination detection of lined anticorrosion pipes [25]. Toyama et al. demonstrated a rapid non-contact ultrasonic inspection technique by visualization of Lamb wave propagation for detecting barely visible impact damage (BVID) in carbon fiber reinforced polymer (CFRP) laminates [26]. Furusawa et al. utilized laser-induced ultrasonic guided wave technology to detect corrosion of the reinforced concrete structures [27]. Liu et al. presented a non-destructive damage detection, visualization, and quantification technique based on laser-generated ultrasonics and state-space predictive models [28]. To date, few works have reported the application of the LUT method in the field of AM. Everton et al. evaluated the use of laser-generated surface waves to detect artificially set-in holes in titanium alloy (Ti-6Al-4V) samples fabricated by AM; only holes with a diameter larger than 0.725 mm were identified from B-Scan images [29]. Davis et al. proposed a self-established LUT system to evaluate AM parts, with hole defects of 2 mm diameter identified in B-Scan and C-Scan images [30]. Cerniglia et al. proposed a laser ultrasonic technique for in-line inspection of laser powder deposition (LPD) parts. Typical micro-defects such as near-surface and surface flaws can be detected [31]. Everton et al. used LUT to identified the presence of four though holes (580–670 μm at 800 μm depth) in a Ti6Al4V AM samples [32]. In order to obtain better results of ultrasonic testing, synthetic aperture focusing technique (SAFT) method are usually utilized. The SAFT has been used to restore ultrasonic images obtained either from B-Scans or C-Scans with focusing distortion. With the use of this technique, an improvement of the image resolution can be obtained. Vrana et al. used SAFT to reconstruct the volume inside cylindrical parts. The method shows a sensitivity improvement of magnitude compared to classical ultrasonic inspections [33]. Tamulevičius et al. utilized scanning acoustic microscopy (SAM) to diagnostic micro cracks and pores. It was obtained that resolution of SAM operating with 230 MHz transducer is not worse than 40 μm [34]. However, using the LUT method to identify sub-millimeter hole defects in AM part needs to be further studied.
In this work, a non-contact laser ultrasonic inspection system was utilized. The inspection was conducted in pulse–echo mode, i.e., the generation laser and detection laser were located on the same side of the part. Laser-generated longitudinal ultrasonic waves were used to inspect sub-millimeter defects in the AM part. XCT was conducted to validate the results obtained from the LUT system. The relationship between the diameter of holes and the amplitude of laser-generated ultrasonic Rayleigh waves was also studied.
2. Experimental Method
2.1. Sample Fabrication
The sample investigated in this paper was manufactured by using the AM equipment (SLM 125, SLM Solutions NA, Inc., Lübeck, Germany). Figure 1 demonstrates the layout of the AM equipment. A Yb:YAG continuous wave (CW) fiber laser (IPG YLR-400, IPG Photonics Corporation, Oxford, MA, USA) with a wavelength of 1060 nm, nominal output power of 400 W, and spot size of 100 µm was used in the sample fabrication process. Usually, the minimum size that can be manufactured by the SLM machine is no less than the laser spot size, which is smaller than the minimum size that can be detected by the LUT system in this work. Near spherical titanium aluminide alloy Ti-6Al-4V powder (AP&C, GE Additive, Munich, Germany) with a diameter range of 15~45 μm was used. The building chamber was set with a protective argon atmosphere (oxygen content of less than 0.2%) to prevent oxidation of the material during the AM process. The building platform was preheated to 473.15 K, to reduce the thermal gradient and residual-stress formation in the sample during manufacturing process.
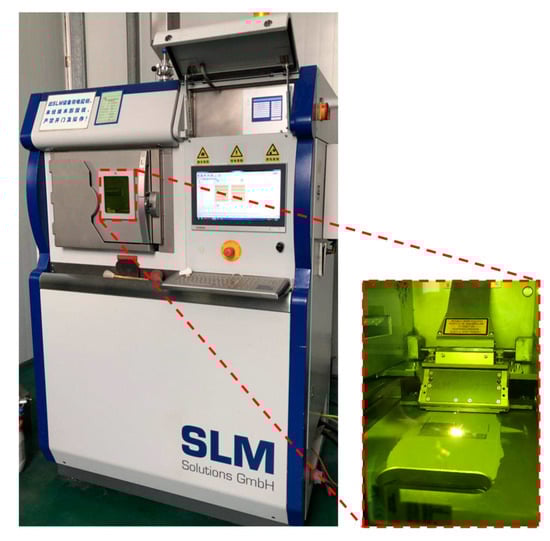
Figure 1.
Photograph of the additive manufacturing (AM) equipment (SLM 125). Zoom out viewport: The manufacturing process of the investigated sample.
The specific AM process parameters are shown in Table 1. The sample with four internal holes with diameters of 0.4, 0.8, 1.0, and 2.0 mm was manufactured. The dimensions of the Ti-6Al-4V sample were set to 50 × 10 × 5 mm3. The center-to-center distance among four holes was designed to be 12 mm. All four holes were located at the center along the thickness direction. During the AM process, these holes were formed as near hole-type defects, thus representing a common defect formed in the AM process. Note that the AM process used a laser beam to manufacture the part in a layer-by-layer style. During AM process, issues including balling and porosity can be formed due to the high-power density [2] and occur in the inner surface of four holes. Next, the sample was cut by using wire-cutting equipment (FH-020C, Suzhou Xingjie CNC Technology Co., Ltd., Suzhou, China). In order to obtain lower surface roughness for better signal reception, the sample was then sand-blasted (BNP-55, Clemco Industries Co., Ltd., Washington, MO, USA) on the top and bottom surfaces of the sample, with the blasting distance of 150 mm and flow rate of 3 m3/min.

Table 1.
AM parameters of the Ti-6Al-4V sample.
2.2. Laser Ultrasonic Testing
The proposed non-contact laser ultrasonic inspection system was utilized. The whole system was set in pulse–echo mode, which is an ultrasonic detection method. Pulse refers to the generation of ultrasonic waves, and echo refers to the signal received from the sample surface. Figure 2 shows the experimental setup of the LUT system. The LUT parameters used for the target sample are shown in Table 2.
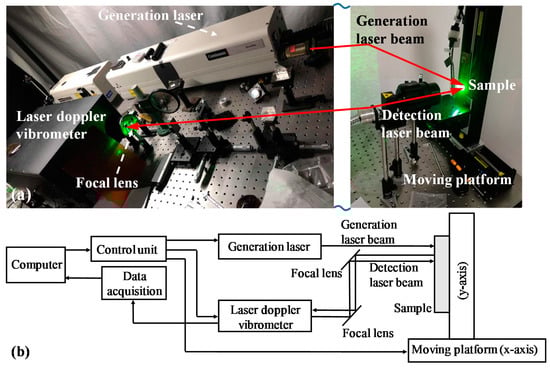
Figure 2.
Setup for the laser ultrasonic testing (LUT) system: (a) photography and (b) principle scheme.
Table 2.
LUT parameters used for the target sample.
A 532 nm frequency-doubled Nd: YAG pulsed laser in Q-Switch mode (Q-smart 100, Quantel laser Co., Ltd., Les Ulis, France) was used for ultrasonic wave generation. Once the generation laser beam produced by the generation laser was irradiated on the top surface of the sample, an extremely small area was heated by the high laser power density, and ultrasonic waves were generated via thermal expansion due to thermoelastic mechanisms. The ablation threshold of Ti-6Al-4V was observed at 708 mJ/cm2 for the pulsed Nd: YAG laser in previous work [35]. In this work, the laser absorption coefficient A of the sample was around 0.1. The pulsed laser energy density E can be calculated by E = (A × e)/s, where e is the laser energy per pulse (mJ), and s is the laser heating area (cm2). The calculated pulsed laser energy density was 637 mJ/cm2, which was lower than 708 mJ/cm2 to avoid ablation on the top surface of the sample.
A scanning LDV with a built-in galvanometer and auto-focal lenses was utilized as a detection device, with lens diameter of 25 mm and focal distance of 4 mm. A commercial CW diode pumped solid-state laser (Cobolt Samba-532, Hubner Cobolt Inc., San Jose, USA) with a wavelength of 532 nm was used as the laser source of the LDV. The other components of the LDV contained of a femto-amplifier (HSA-Y 200 MHz, Femto Easy Inc., Pessac, France), wave plates, and gratings. The LDV produced a detection laser beam to monitor the small displacement on the sample surface. The measurement range of the out-of-plane velocity of the LDV was from 0.01 μm/s to 10 m/s, based on the Doppler Effect. The voltage/displacement signal received from the top surface of the sample by the LDV was stored on a computer and processed by MATLAB codes.
As shown in Figure 2, the target sample was fixed in front of the focal lens. The generation laser beam was irradiated on the top surface of the target sample. The inspection was conducted in pulse–echo mode, i.e., the generation laser and detection laser were located on the same side of the sample. During inspection, the generation laser and detection laser were fixed. The spacing of laser irradiation point and detection point was set to 5 mm. The sample was fixed on the moving platform and moved along each scanning path driven by step-motor. The corresponding signals were received by the LDV at the target detection point, as shown in Figure 3. The LUT scanning area of the target sample was 40 × 8 mm2, and the spatial resolution along each scanning path (scanning resolution) and between two adjacent scanning paths (index resolution) were 0.1 and 0.2 mm, respectively. The ultrasonic waveforms were averaged 512 times to improve the signal-to-noise ratio.
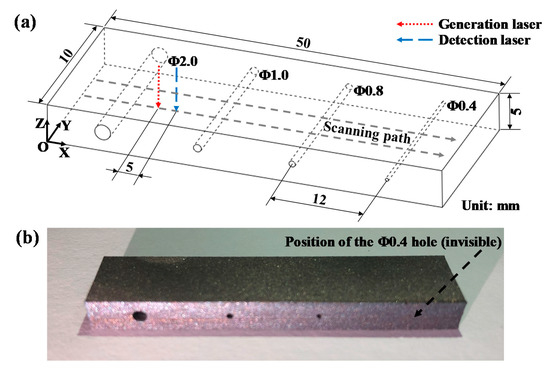
Figure 3.
The investigated sample: (a) sketch of CAD model and (b) photography of the AM sample.
2.3. X-ray Computed Tomography
In order to determine the sample’s internal structure and validate the results obtained from the established LUT system, an XCT scan was also performed on the entire region of the sample, using the commercial XCT equipment (FF35 CT, YXLON X-ray Equipment Trading Co., Ltd., Hamburg, Germany). The voltage and current of the microfocus tube were set to 220 kV and 100 μA, respectively. The specific XCT parameters used for the target sample are shown in Table 3.
Table 3.
XCT parameters used for the target sample.
3. Results
3.1. Laser Ultrasonic Testing
In the LUT inspection, an A-Scan signal demonstrates the voltage amplitude of received ultrasonic waves at a certain detection point as a function of time. The A-Scans are processed to generate B-Scans. In a B-Scan image, the travel time of the ultrasonic waves are plotted on one axis, and the X-coordinates of detection points along the scanning path are plotted on the other axis. The maximum amplitude values obtained from A-Scan signals of all scanning points are extracted to generate a plan view image (C-Scan) of the sample. The colors in B-Scan and C-Scan images render the amplitude of signals. The plane of C-Scan image is parallel to the scanning surface.
The incident laser energy caused displacement on the top surface of the sample. The displacement wave propagated through the sample, and it was then diffracted by the defects inside the sample and reflected by the bottom surface of the sample. Finally, the displacement wave propagated back to the top surface of the sample and was detected and saved in the form of voltage by the LDV. The conversion factor from voltage to displacement was 100 mV/nm. Multiple waves, including surface waves (Rayleigh waves), bulk waves (longitudinal waves), and shear waves, can be generated by the pulsed laser. Note that Rayleigh waves contain information of surface and subsurface defects, whereas longitudinal waves contain information of internal defects. Therefore, longitudinal pulse–echo signals were used to identify the internal holes of the sample.
Figure 4a–e show A-Scan signals of holes with different diameters. The positions of the five different points were located at an interesting scanning path (Y = 5 mm, along X-axis in Figure 3). Longitudinal waves propagated through the sample and were then reflected by the bottom surface. In the near field of incident point, the Rayleigh (R) wave traveling along the top surface was most dominant, and firstly arrived at the detection point. The Rayleigh (R) wave penetrated down the top surface of the sample at the depth of the wavelength λ. The wavelength of the R wave can be calculated by λ = v/f, where v and f referred to the velocity and frequency of the R wave, respectively. The calculated wavelength of the R wave was 4.17 mm. The depth of the hole was 2.5 mm < 4.17 mm, so the R wave might have interactions with internal holes. Then, the longitudinal (L) wave and shear (S) wave became prevailing in the part as they moved further away from the top surface of the sample. It can be seen that the R wave first arrived at the top surface at around 1.2 μs, followed by other waveforms, including L and S waves, as shown in Figure 4a. Figure 4f shows a local amplification of Rayleigh waves propagating through the different holes in the time domain from 1.10 to 1.26 μs. The existence of hole defects significantly influenced the amplitude of the ultrasonic waves. The peak value of the Rayleigh wave was reduced with the increasing internal hole diameter. The detected peak voltage of the sample without defects was 0.9499 V, whereas the detected peak voltages were 0.7817, 0.6140, 0.4235, and 0.2204 V for the 0.4, 0.8, 1.0, and 2.0 mm holes, respectively. Figure 5 shows the relationship between the peak value of the Rayleigh wave and internal hole diameter. It can be seen that existences of different holes made significant differences to the amplitude of Rayleigh waves. The amplitude of the Rayleigh waves attenuated approximately linearly with the increasing diameter of the internal hole.
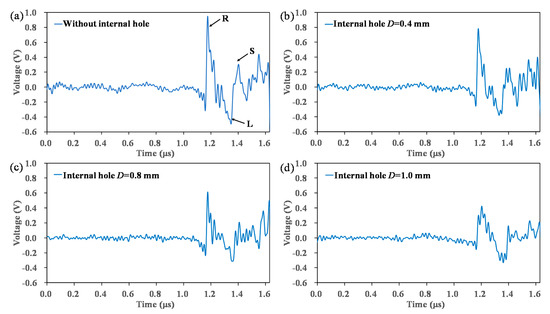
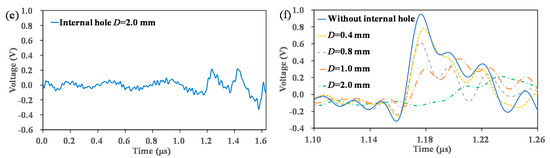
Figure 4.
A-Scan signals contain of Rayleigh (R) wave, longitudinal (L) wave, and shear (S) wave of different positions located at the scanning path (Y = 5 mm, along X-axis in Figure 3): (a) without internal hole, (b) internal hole D = 0.4 mm, (c) internal hole D = 0.8 mm, (d) internal hole D = 1.0 mm, (e) internal hole D = 2.0 mm, and (f) local amplification of Rayleigh waves.
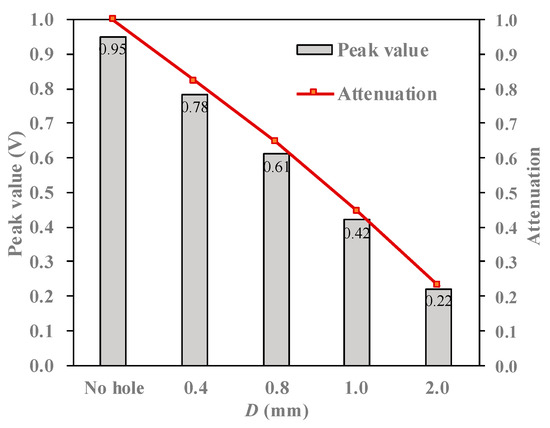
Figure 5.
Peak value and attenuation of Rayleigh (R) wave at different hole diameters.
Figure 6a shows a B-Scan image of an interesting plane (Y = 5 mm, in the X–Z plane in Figure 3). The highlighted areas represent the arrival of longitudinal waves on the top surface of the sample. It can be clearly seen that three voids occurred in the highlighted bands with an interval of approximately 12 mm along the X-axis, indicating the existence of internal holes with diameters of 0.8, 1.0, and 2.0 mm. As the L wave approached the hole, it was diffracted at the edges of the hole and traveled around the hole. The L wave took a longer time to arrive at the top surface of the sample.
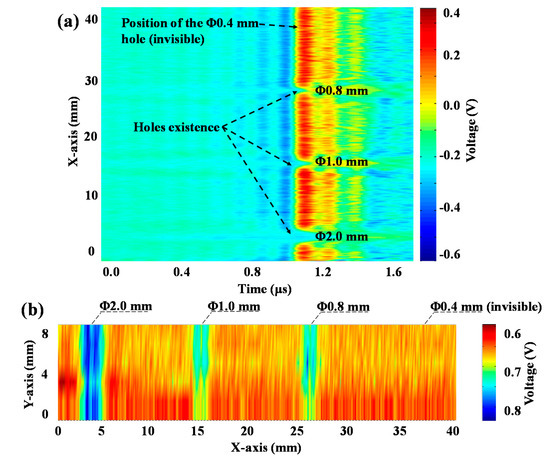
Figure 6b shows the C-Scan image obtained from the sample. It scanned the center area of the investigated sample with a size of 40 × 8 mm2, i.e., the area displayed in C-Scan image was in the center of the sample surface. The position and size of internal hole defects with diameters of 0.8, 1.0, and 2.0 mm could be clearly identified in the C-Scan image. However, the internal hole defect of 0.4 mm diameter was not visible in either the B-Scan or C-Scan image. Compared with previous work [19,30], the LUT system made improvement and achieved a resolution in sub-millimeter scale. Further work should be done to find the relationship between gate setting and hole parameters (diameter, depth, etc.) and then optimize LUT parameters for the detection of even smaller defects in AM part.
3.2. X-ray Computed Tomography
As shown in Figure 7, artificially designed internal holes with diameters of 0.4, 0.8, 1.0, and 2.0 mm were successfully formed by the AM process. All four holes are through-holes with a center-to-center spacing of 12 mm. The XCT method was able to determine the hole inside the sample with hole diameters smaller than 0.4 mm. We compared the sizes and locations of holes obtained from LUT and XCT results, and the holes obtained from our LUT system were smaller than those in the previously published work [30]. Therefore, the XCT results validated the results obtained from the LUT system. In addition, the inner surfaces of holes were not completely smooth. It can be explained that, during the AM process of the sample, the powder bed underwent rapid melting and solidification. The metallic material was shocked by the laser-produced plasma and melted by the relatively high laser energy. Therefore, issues such as balling, porosity, and residual stress could occur in the inner surface of the holes, which led to the deformation of the inner surface of the holes. The void fraction of the entire sample was 0.87%. The average size of the porosities was approximately 50 μm with actual values in the range of 30 to 110 μm, which was better than the results in previous work [30].
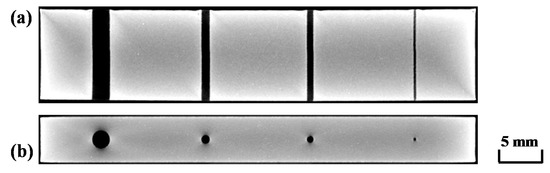
Figure 7.
XCT test results: (a) sectional top view and (b) sectional front view.
4. Conclusions
In this work, an AM Ti-6Al-4V part with four internal holes was investigated by using the LUT system. The results obtained from LUT were validated by using an XCT method. The main conclusions can be summarized as follows:
- The amplitude of laser-generated ultrasonic Rayleigh wave attenuated approximately linearly with the increasing internal hole diameter.
- Owing to the diffraction by holes, amplitude of longitudinal waves decreased. Meanwhile, the longitudinal wave may take a longer time to arrive at the top surface of the sample.
- Sub-millimeter holes with a diameter of 0.8 mm was clearly identified in both B-Scan and C-Scan images obtained from the utilized LUT system. Holes with diameters of 1.0 and 2.0 mm were also identified.
Combined with the advantages of being completely non-contact and its integration ability due to the long distance from focal lens to the part, the LUT method can be further utilized in the online monitoring of the AM process.
Author Contributions
J.Y. contributed to the experimental study, data analysis, and preparation of the manuscript. D.Z. and S.S. helped to conduct the LUT inspection. H.L., C.S., and X.Z. reviewed the manuscript and provided supervision and guidance in this research. G.Z. edited the manuscript. Y.Y. and H.W. contributed to the AM fabrication of the sample. All authors have read and agreed to the published version of the manuscript.
Funding
This research was funded by the Key Research and Development Program of Guangdong Province (grant no. 2018B090905001); the Natural Science Foundation of Guangdong Province (grant no. 2018A030313044); the Science and Technology Program of Shenzhen (grant no. JCYJ20170816171733384); the Hubei Provincial Natural Science Foundation of China (grant no. 2017CFB657); and the Fundamental Research Funds for the Central Universities (grant no. 2042018kf0240).
Acknowledgments
The LUT equipment is supported by the National Laboratory of Solid-State Microstructures, Nanjing University, China.
Conflicts of Interest
The authors declare no conflict of interest.
References
- Zhang, T.; Li, H.; Liu, S.; Shen, S.; Xie, H.; Shi, W.; Zhang, G.; Shen, B.; Chen, L.; Xiao, B.; et al. Evolution of molten pool during selective laser melting of Ti–6Al–4V. J. Phys. D 2018, 52, 055302. [Google Scholar] [CrossRef]
- Shen, B.; Li, H.; Liu, S.; Zou, J.; Shen, S.; Wang, Y.; Zhang, T.; Zhang, D.; Chen, Y.; Qi, H. Influence of laser post-processing on pore evolution of Ti–6Al–4V alloy by laser powder bed fusion. J. Alloys Compd. 2019, 42, 152845. [Google Scholar] [CrossRef]
- Everton, S.K.; Hirsch, M.; Stravroulakis, P.; Leach, R.K.; Clare, A.T. Review of in-situ process monitoring and in-situ metrology for metal additive manufacturing. Mater. Des. 2016, 95, 431–445. [Google Scholar] [CrossRef]
- Tammas-Williams, S.; Zhao, H.; Léonard, F.; Derguti, F.; Todd, I.; Prangnell, P.B. XCT analysis of the influence of melt strategies on defect population in Ti–6Al–4V components manufactured by Selective Electron Beam Melting. Mater. Charact. 2015, 102, 47–61. [Google Scholar] [CrossRef]
- Ziółkowski, G.; Chlebus, E.; Szymczyk, P.; Kurzac, J. Application of X-ray CT method for discontinuity and porosity detection in 316L stainless steel parts produced with SLM technology. Arch. Civ. Mech. Eng. 2014, 14, 608–614. [Google Scholar] [CrossRef]
- Cunningham, R.; Zhao, C.; Parab, N.; Kantzos, C.; Pauza, J.; Fezzaa, K.; Sun, T.; Rollett, A.D. Keyhole threshold and morphology in laser melting revealed by ultrahigh-speed X-ray imaging. Science 2019, 363, 849–852. [Google Scholar] [CrossRef]
- Rieder, H.; Spies, M.; Bamberg, J.; Henkel, B. On-and offline ultrasonic inspection of additively manufactured components. In Proceedings of the 19th World Conference on Non-Destructive Testing (WCNDT), Munich, Germany, 13–17 June 2016. [Google Scholar]
- Rieder, H.; Dillhöfer, A.; Spies, M.; Bamberg, J.; Hess, T. Ultrasonic online monitoring of additive manufacturing processes based on selective laser melting. AIP Conf. Proc. 2015, 1650, 184–191. [Google Scholar]
- Karthik, N.V.; Gu, H.; Pal, D.; Starr, T.; Stucker, B. High frequency ultrasonic non destructive evaluation of additively manufactured components. In Proceedings of the 24th International Solid Freeform Fabrication Symposium, Austin, TX, USA, 12–14 August 2013; pp. 311–325. [Google Scholar]
- Raguvarun, K.; Balasubramaniam, K.; Rajagopal, P.; Palanisamy, S.; Nagarajah, R.; Hoye, N.; Curiri, D.; Kapoor, A. A study of internal structure in components made by additive manufacturing process using 3 D X-ray tomography. AIP Conf. Proc. 2015, 1650, 146–155. [Google Scholar]
- Lissenden, C.J. Applied Sciences Special Issue: Ultrasonic Guided Waves. Appl. Sci. 2019, 9, 3869. [Google Scholar] [CrossRef]
- Bychkov, A.; Simonova, V.; Zarubin, V.; Cherepetskaya, E.; Karabutov, A. The progress in photoacoustic and laser ultrasonic tomographic imaging for biomedicine and industry: A review. Appl. Sci. 2018, 8, 1931. [Google Scholar] [CrossRef]
- Chen, S.L. Review of laser-generated ultrasound transmitters and their applications to all-optical ultrasound transducers and imaging. Appl. Sci. 2017, 7, 25. [Google Scholar] [CrossRef]
- Xu, B.; Shen, Z.; Ni, X.; Lu, J. Numerical simulation of laser-generated ultrasound by the finite element method. J. Appl. Phys. 2004, 95, 2116–2122. [Google Scholar] [CrossRef]
- Xu, B.; Shen, Z.; Ni, X.; Wang, J.; Guan, J.; Lu, J. Thermal and mechanical finite element modeling of laser-generated ultrasound in coating–substrate system. Opt. Laser Technol. 2006, 38, 138–145. [Google Scholar] [CrossRef]
- Park, B.; An, Y.K.; Sohn, H. Visualization of hidden delamination and debonding in composites through noncontact laser ultrasonic scanning. Compos. Sci. Technol. 2014, 100, 10–18. [Google Scholar] [CrossRef]
- Taheri, H.; Koester, L.W.; Bigelow, T.A.; Bond, L.J. Thermoelastic finite element modeling of laser generated ultrasound in additive manufacturing materials. In Proceedings of the ASNT Annual Conference 2017, Nashville, TN, USA, 30 October–2 November 2017; pp. 188–198. [Google Scholar]
- Gao, W.; Glorieux, C.; Thoen, J. Laser ultrasonic study of Lamb waves: Determination of the thickness and velocities of a thin plate. Int. J. Eng. Sci. 2003, 41, 219–228. [Google Scholar] [CrossRef]
- Pei, C.; Fukuchi, T.; Zhu, H.; Koyama, K.; Demachi, K.; Uesaka, M. A study of internal defect testing with the laser-EMAT ultrasonic method. IEEE Trans. Ultrason. Ferroelectr. Freq. Control 2012, 59, 2702–2708. [Google Scholar]
- Pei, C.; Demachi, K.; Zhu, H.; Fukuchi, T.; Koyama, K.; Uesaka, M. Inspection of cracks using laser-induced ultrasound with shadow method: Modeling and validation. Opt. Laser Technol. 2012, 44, 860–865. [Google Scholar] [CrossRef]
- Lee, J.R.; Chia, C.C.; Shin, H.J.; Park, C.Y.; Yoon, D.J. Laser ultrasonic propagation imaging method in the frequency domain based on wavelet transformation. Opt. Laser Eng. 2011, 49, 167–175. [Google Scholar] [CrossRef]
- Lee, J.R.; Shin, H.J.; Chia, C.C.; Dhital, D.; Yoon, D.J.; Huh, Y.H. Long distance laser ultrasonic propagation imaging system for damage visualization. Opt. Laser Eng. 2011, 49, 1361–1371. [Google Scholar]
- Sun, K.; Shen, Z.; Shi, Y.; Xu, Z.; Yuan, L.; Ni, X. Non-destructive detection of small blowholes in aluminum by using laser ultrasonics technique. Int. J. Thermophys. 2015, 36, 1181–1188. [Google Scholar] [CrossRef]
- Wu, T.C.; Kobayashi, M.; Tanabe, M.; Yang, C.H. The use of flexible ultrasound transducers for the detection of laser-induced guided waves on curved surfaces at elevated temperatures. Sensors 2017, 17, 1285. [Google Scholar] [CrossRef] [PubMed]
- Hong, X.; Liu, Y.; Lin, X.; Luo, Z.; He, Z. Nonlinear ultrasonic detection method for delamination damage of lined anti-corrosion pipes using PZT transducers. Appl. Sci. 2018, 8, 2240. [Google Scholar] [CrossRef]
- Toyama, N.; Ye, J.; Kokuyama, W.; Yashiro, S. Non-contact ultrasonic inspection of impact damage in composite laminates by visualization of Lamb wave propagation. Appl. Sci. 2019, 9, 46. [Google Scholar] [CrossRef]
- Furusawa, A.; Takenaka, Y.; Nishimura, A. Proposal of laser-Induced ultrasonic guided wave for corrosion detection of reinforced concrete structures in fukushima daiichi nuclear power plant decommissioning site. Appl. Sci. 2019, 9, 3544. [Google Scholar] [CrossRef]
- Liu, Y.; Yang, S.; Liu, X. Detection and quantification of damage in metallic structures by laser-generated ultrasonics. Appl. Sci. 2018, 8, 824. [Google Scholar] [CrossRef]
- Everton, S.; Dickens, P.; Tuck, C.; Dutton, B. Evaluation of laser ultrasonic testing for inspection of metal additive manufacturing. Int. Soc. Opt. Photonics 2015, 9353. [Google Scholar] [CrossRef]
- Davis, G.; Nagarajah, R.; Palanisamy, S.; Rashid, R.A.R.; Rajagopal, P.; Balasubramaniam, K. Laser ultrasonic inspection of additive manufactured components. Int. J. Adv. Manuf. Technol. 2019, 102, 2571–2579. [Google Scholar] [CrossRef]
- Cerniglia, D.; Scafidi, M.; Pantano, A.; Rudlin, J. Inspection of additive-manufactured layered components. Ultrasonics 2019, 62, 292–298. [Google Scholar] [CrossRef]
- Everton, S.; Dickens, P.; Tuck, C.; Dutton, B.; Wimpenny, D. The use of laser ultrasound to detect defects in laser melted parts. In TMS 2017 146th Annual Meeting Exhibition Supplemental Proceedings; Springer: Cham, Switzerland, 2017; pp. 105–116. [Google Scholar]
- Vrana, J.; Schörner, K.; Mooshofer, H.; Kolk, K.; Zimmer, A.; Fendt, K. Ultrasonic computed tomography—Pushing the boundaries of the ultrasonic inspection of forgings. Steel Res. Int. 2018, 89, 1700448. [Google Scholar] [CrossRef]
- Tamulevičius, T.; Šimatonis, L.; Ulčinas, O.; Tamulevičius, S.; Žukauskas, E.; Rekuvienė, R.; Mažeika, L. Micromachining and validation of the scanning acoustic microscope spatial resolution and sensitivity calibration block for 20–230 MHz frequency range. J. Electron Microsc. 2016, 65, 429–437. [Google Scholar] [CrossRef]
- Turner, M.; Crouse, P.; Li, L. Comparison of mechanisms and effects of Nd: YAG and CO2 laser cleaning of titanium alloys. Appl. Surf. Sci. 2006, 252, 4792–4797. [Google Scholar] [CrossRef]


© 2020 by the authors. Licensee MDPI, Basel, Switzerland. This article is an open access article distributed under the terms and conditions of the Creative Commons Attribution (CC BY) license (http://creativecommons.org/licenses/by/4.0/).