Reconstruction and Measurement of Irregular Karst Caves Using BLST along the Shield Metro Line


Abstract
:Featured Application
Abstract
1. Introduction
2. Multiwavelength Laser Attenuation Characteristics Test in Water-Filled Karst Caves
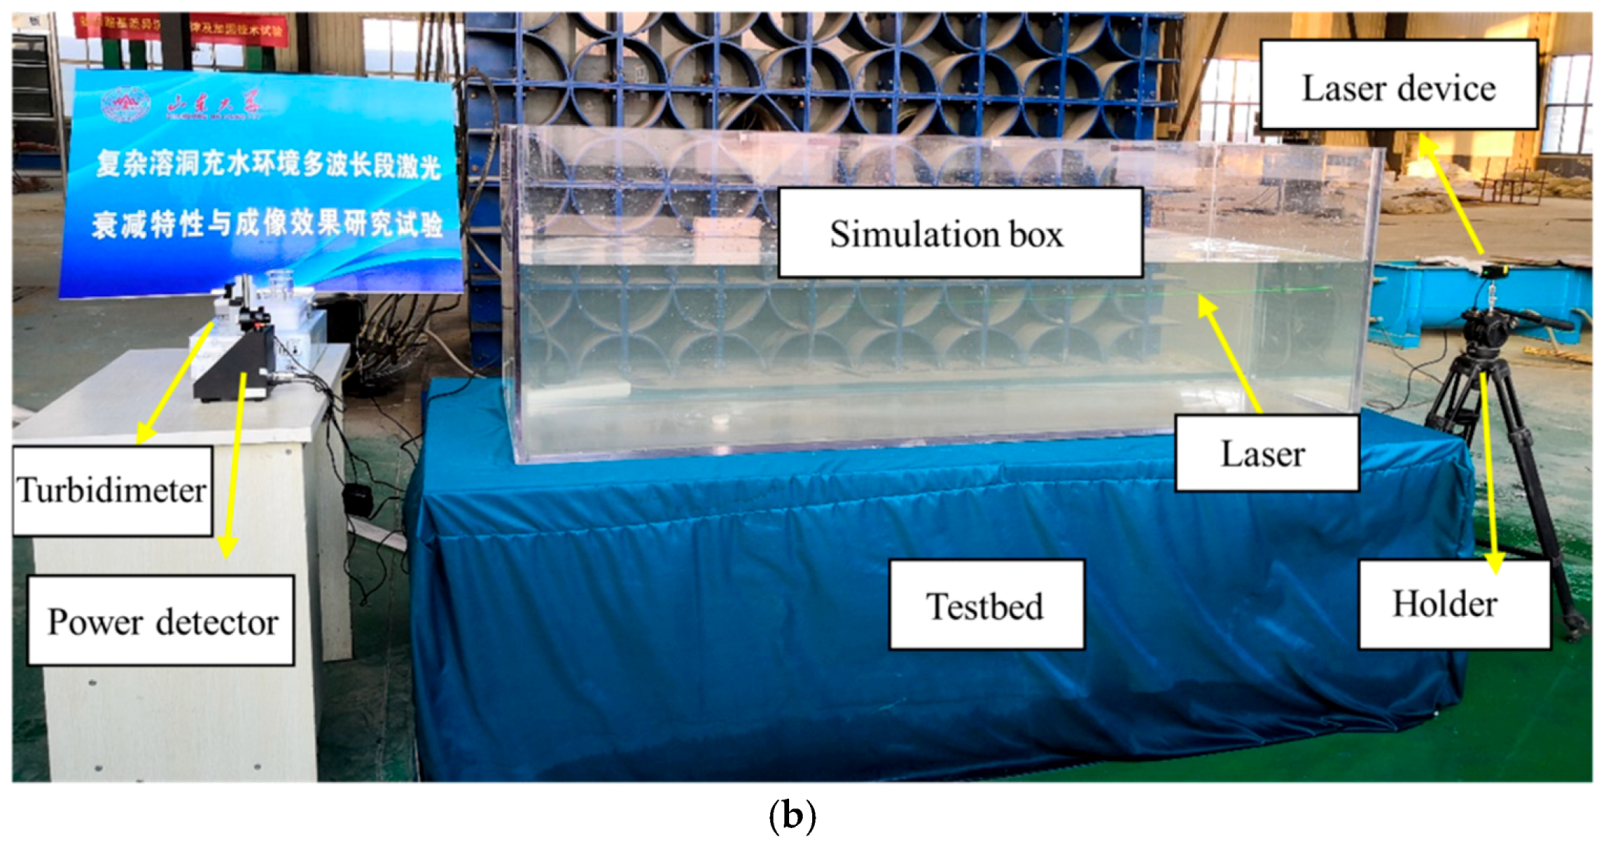
2.1. Laser Attenuation Characteristics Test System
2.1.1. Multiwavelength Laser Emission Module
2.1.2. Simulation Module of Karst Cave Water Environment
2.1.3. Measurement Module of Water Turbidity and Laser Attenuation
2.2. Definition of Laser Attenuation Coefficient
3. Test Results
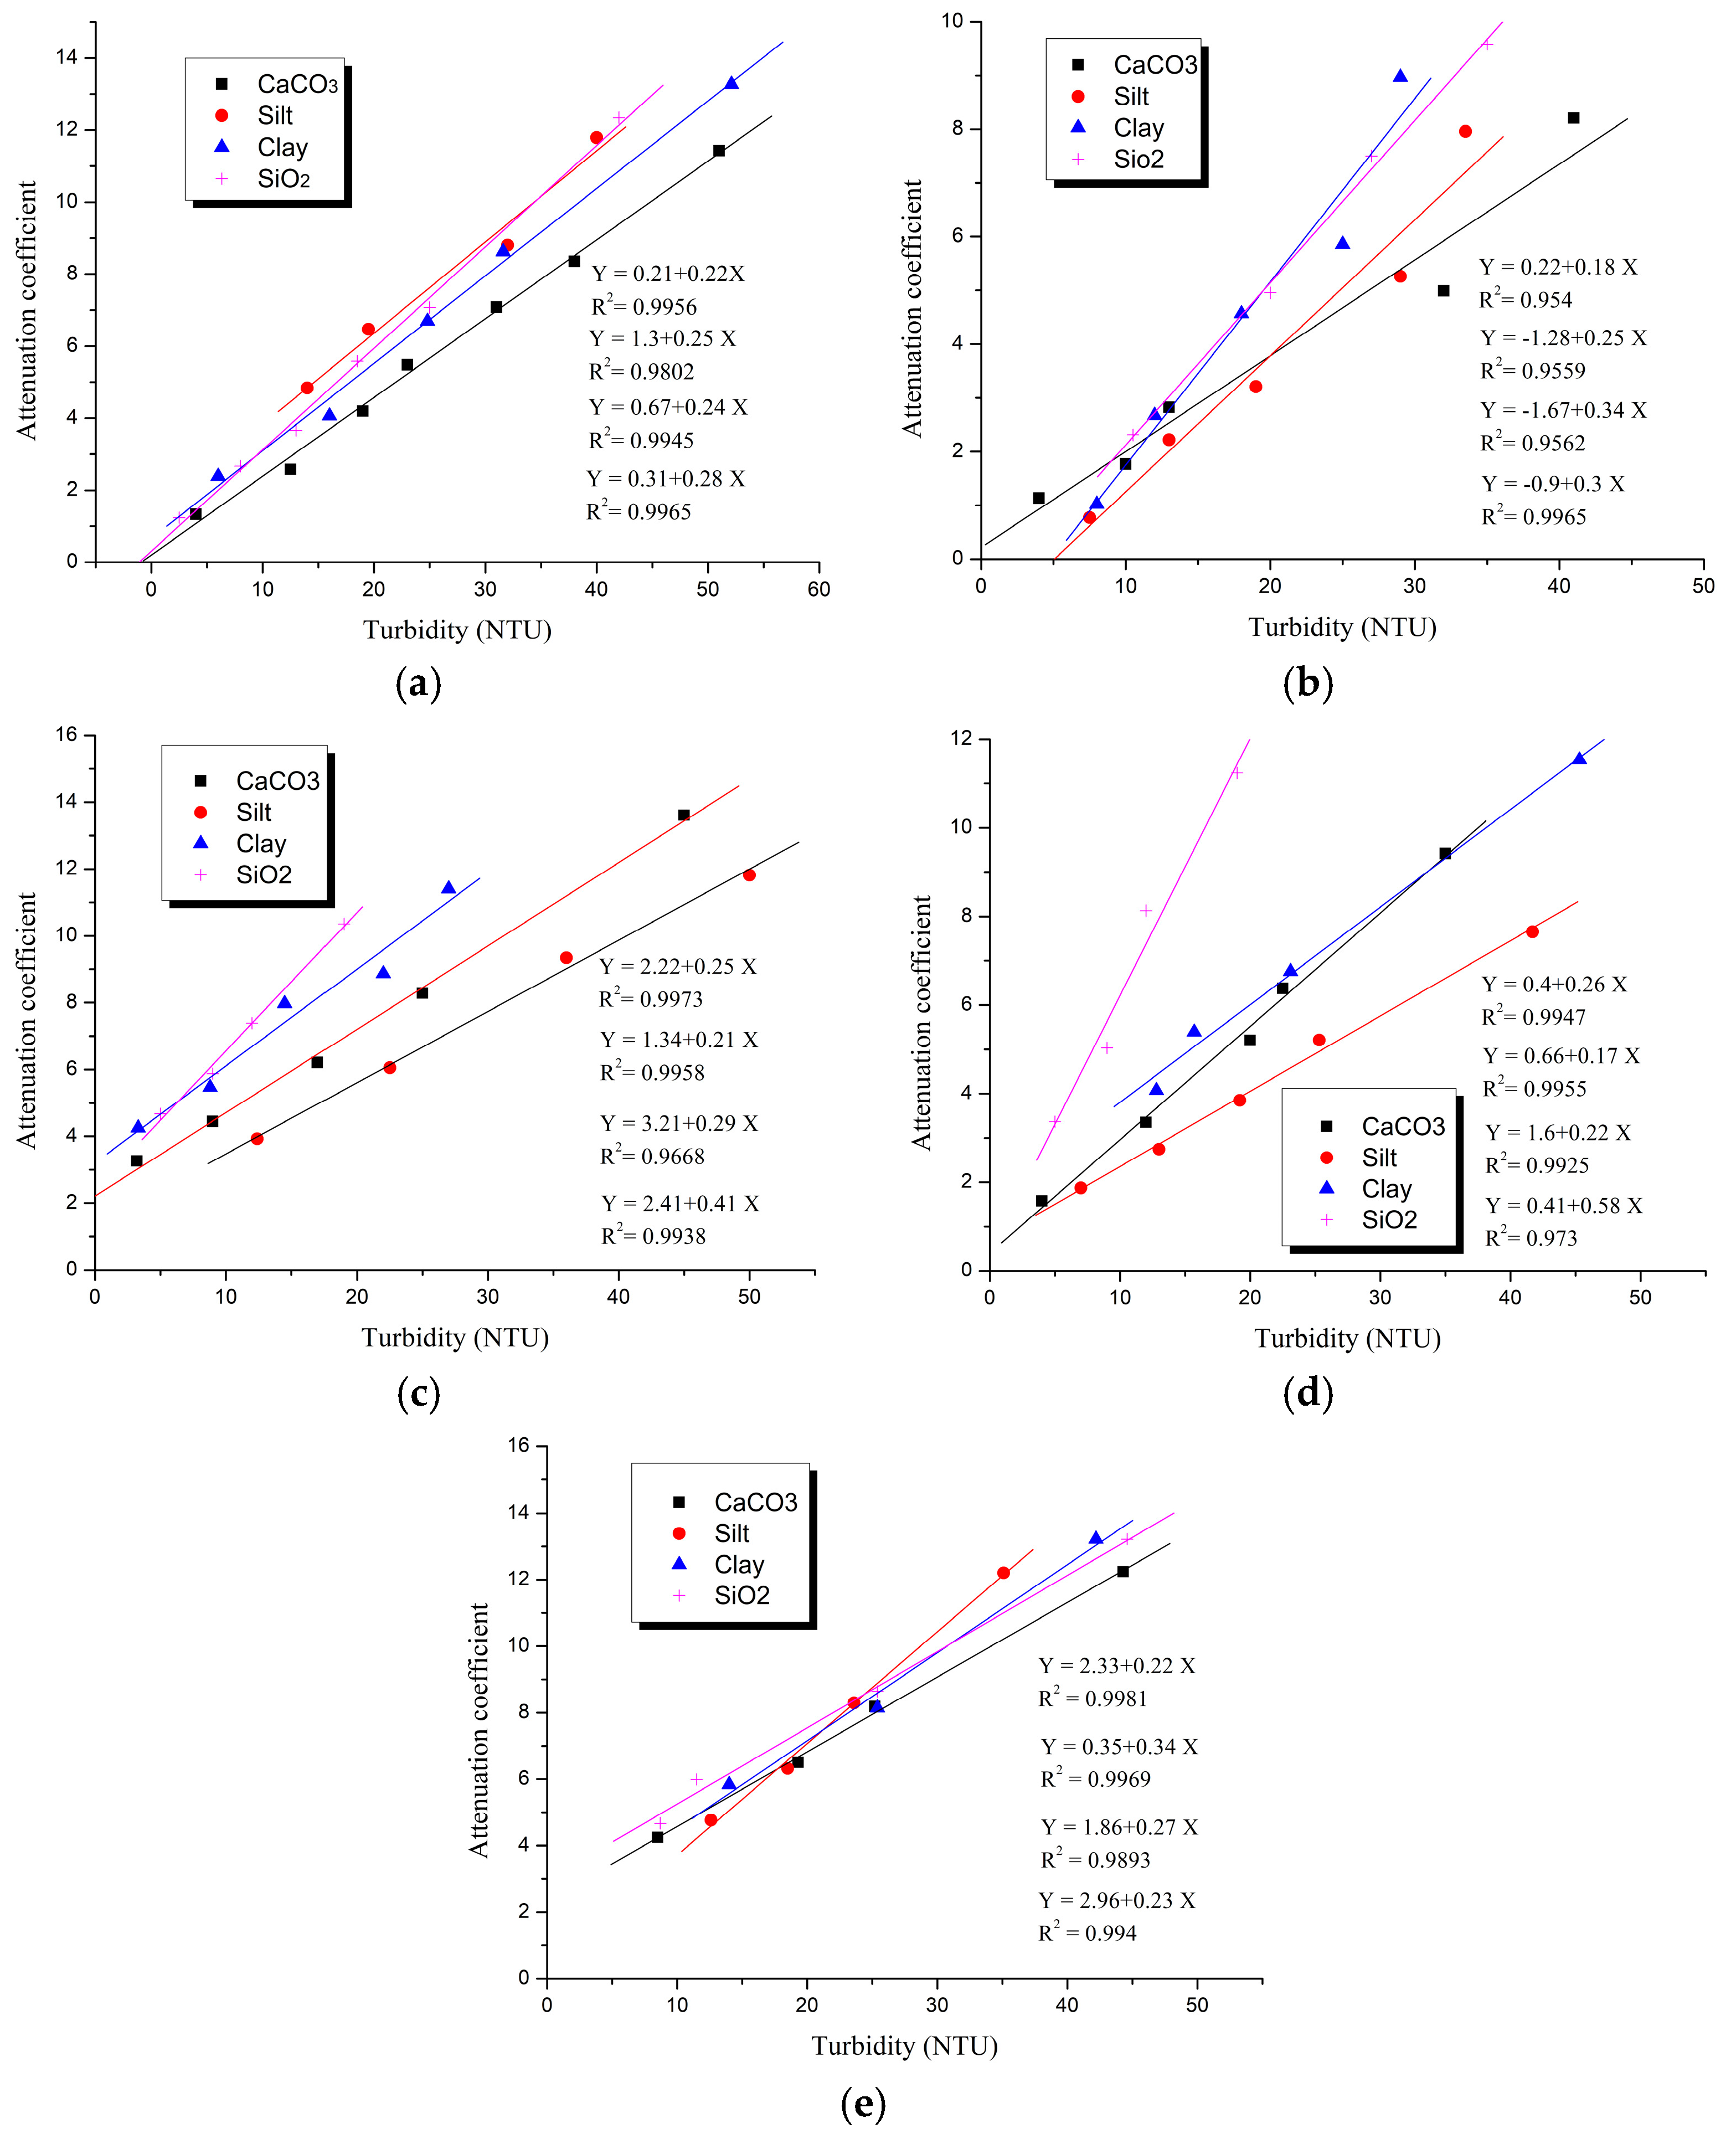
3.1. Attenuation Law of Lasers with the Same Wavelength in Different Suspended Media
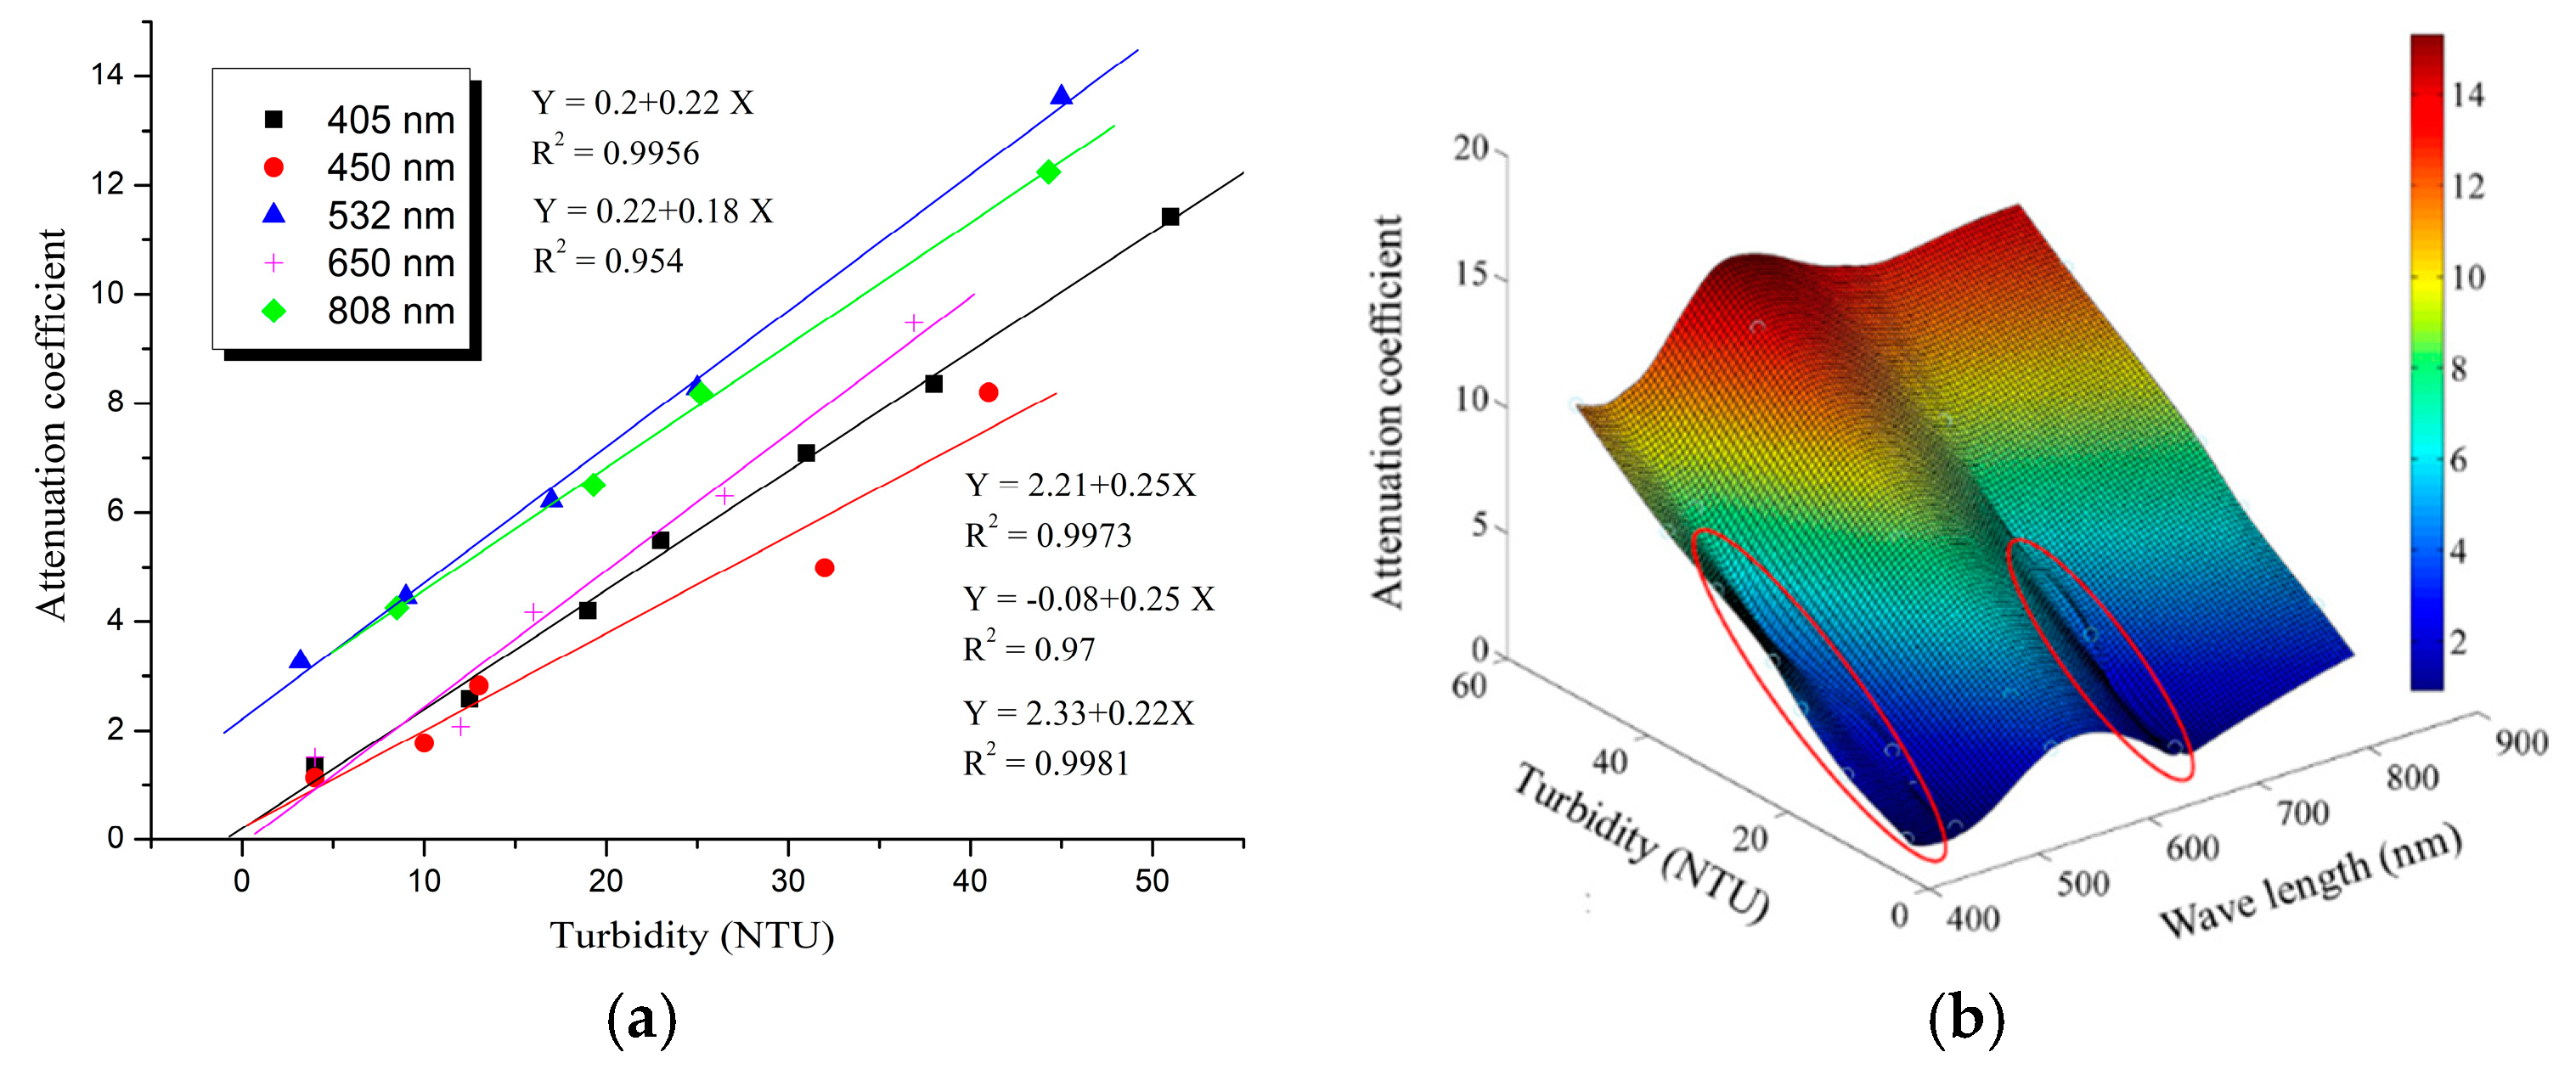
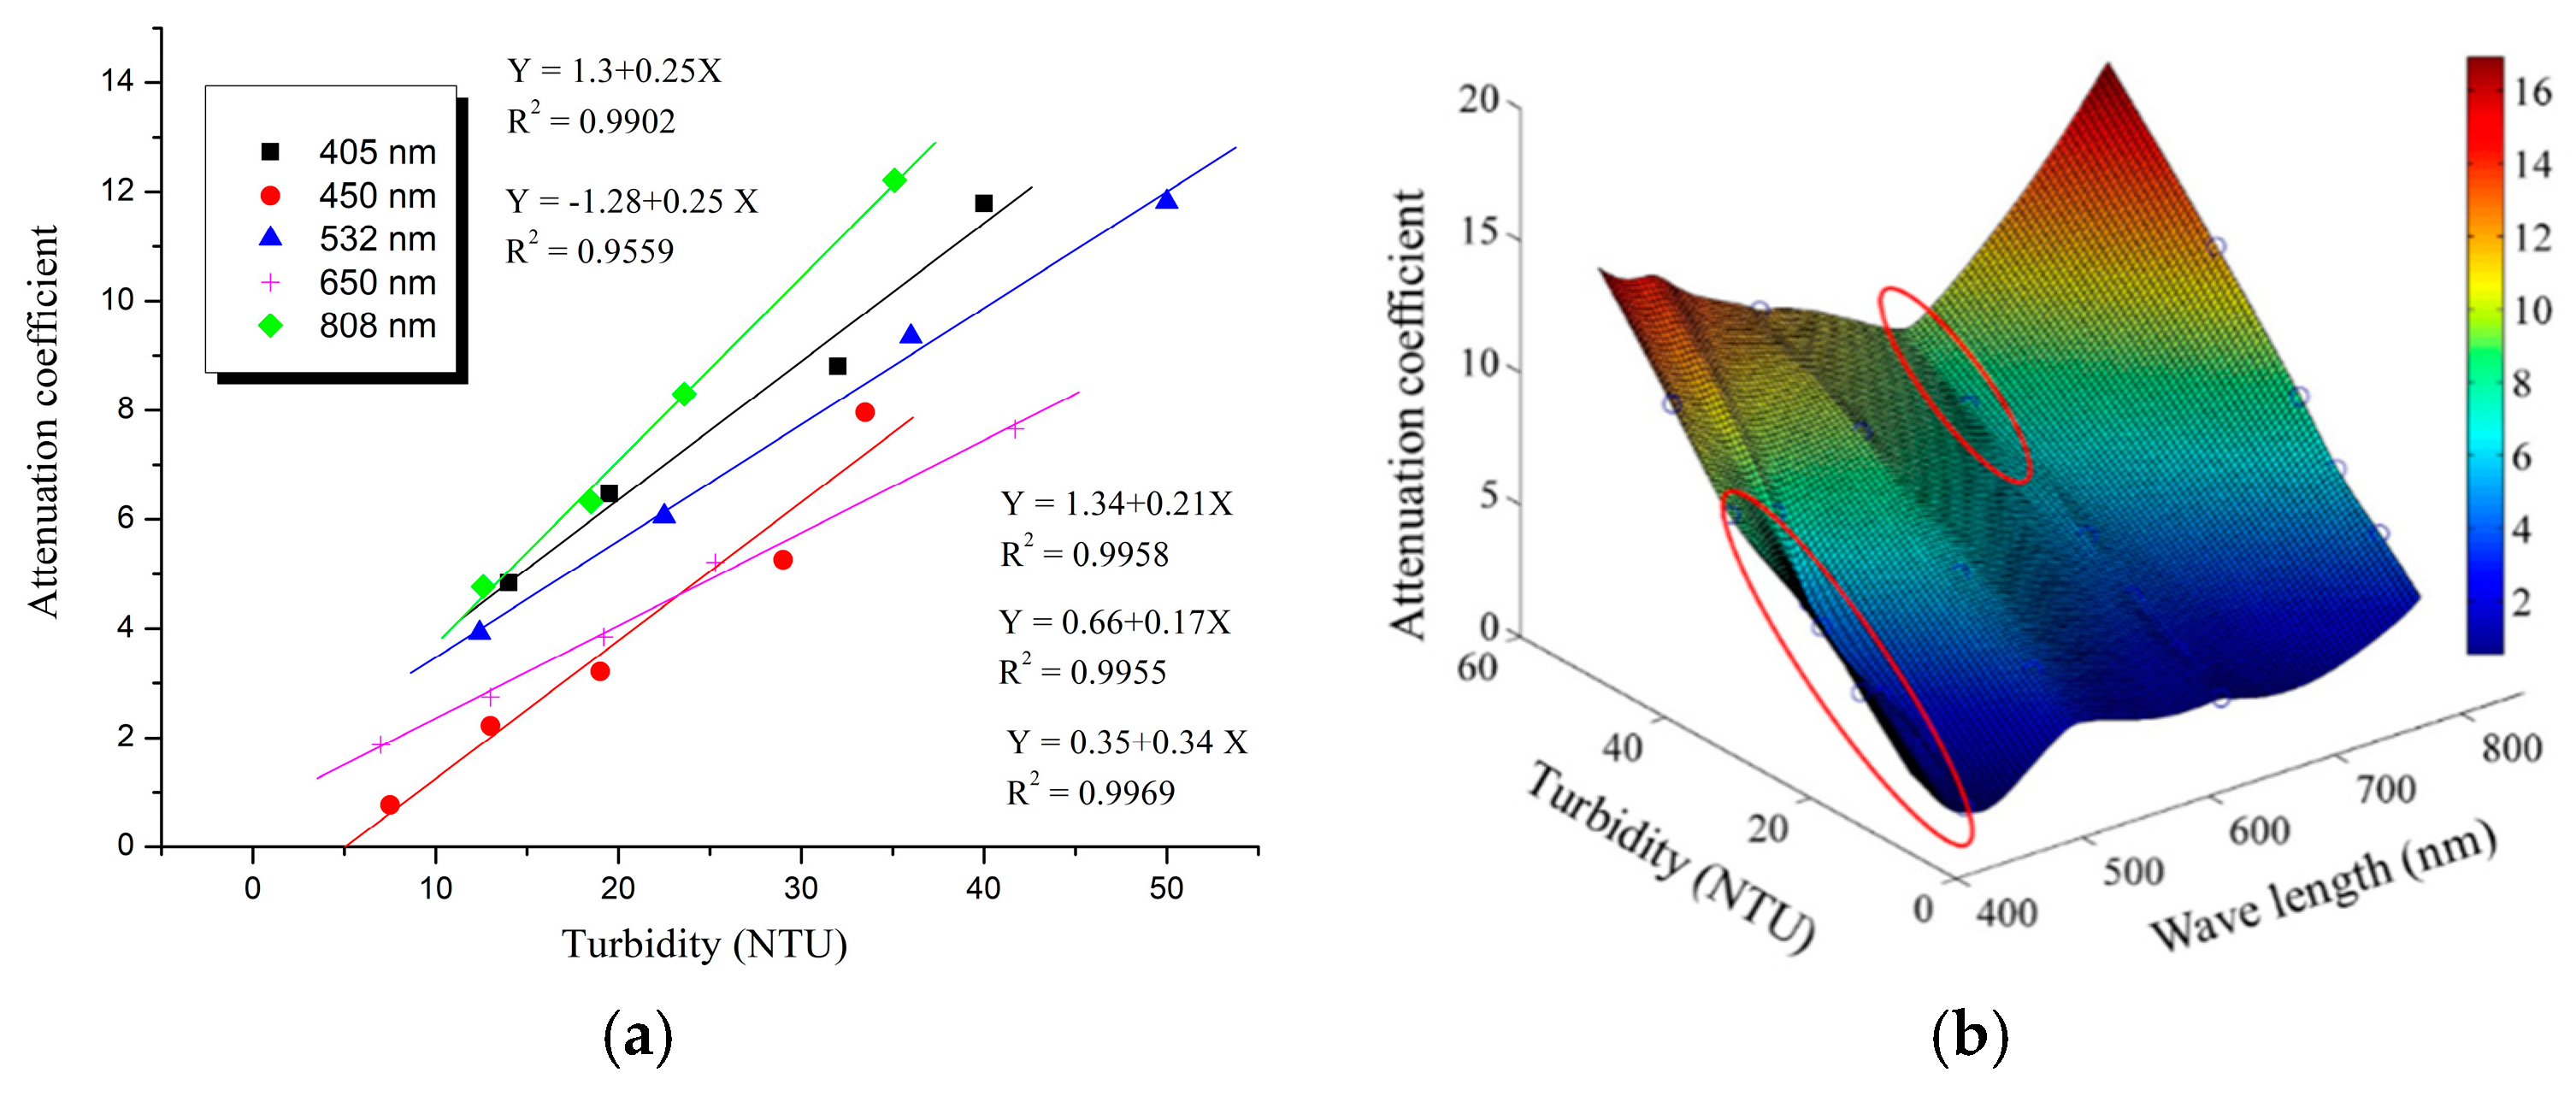
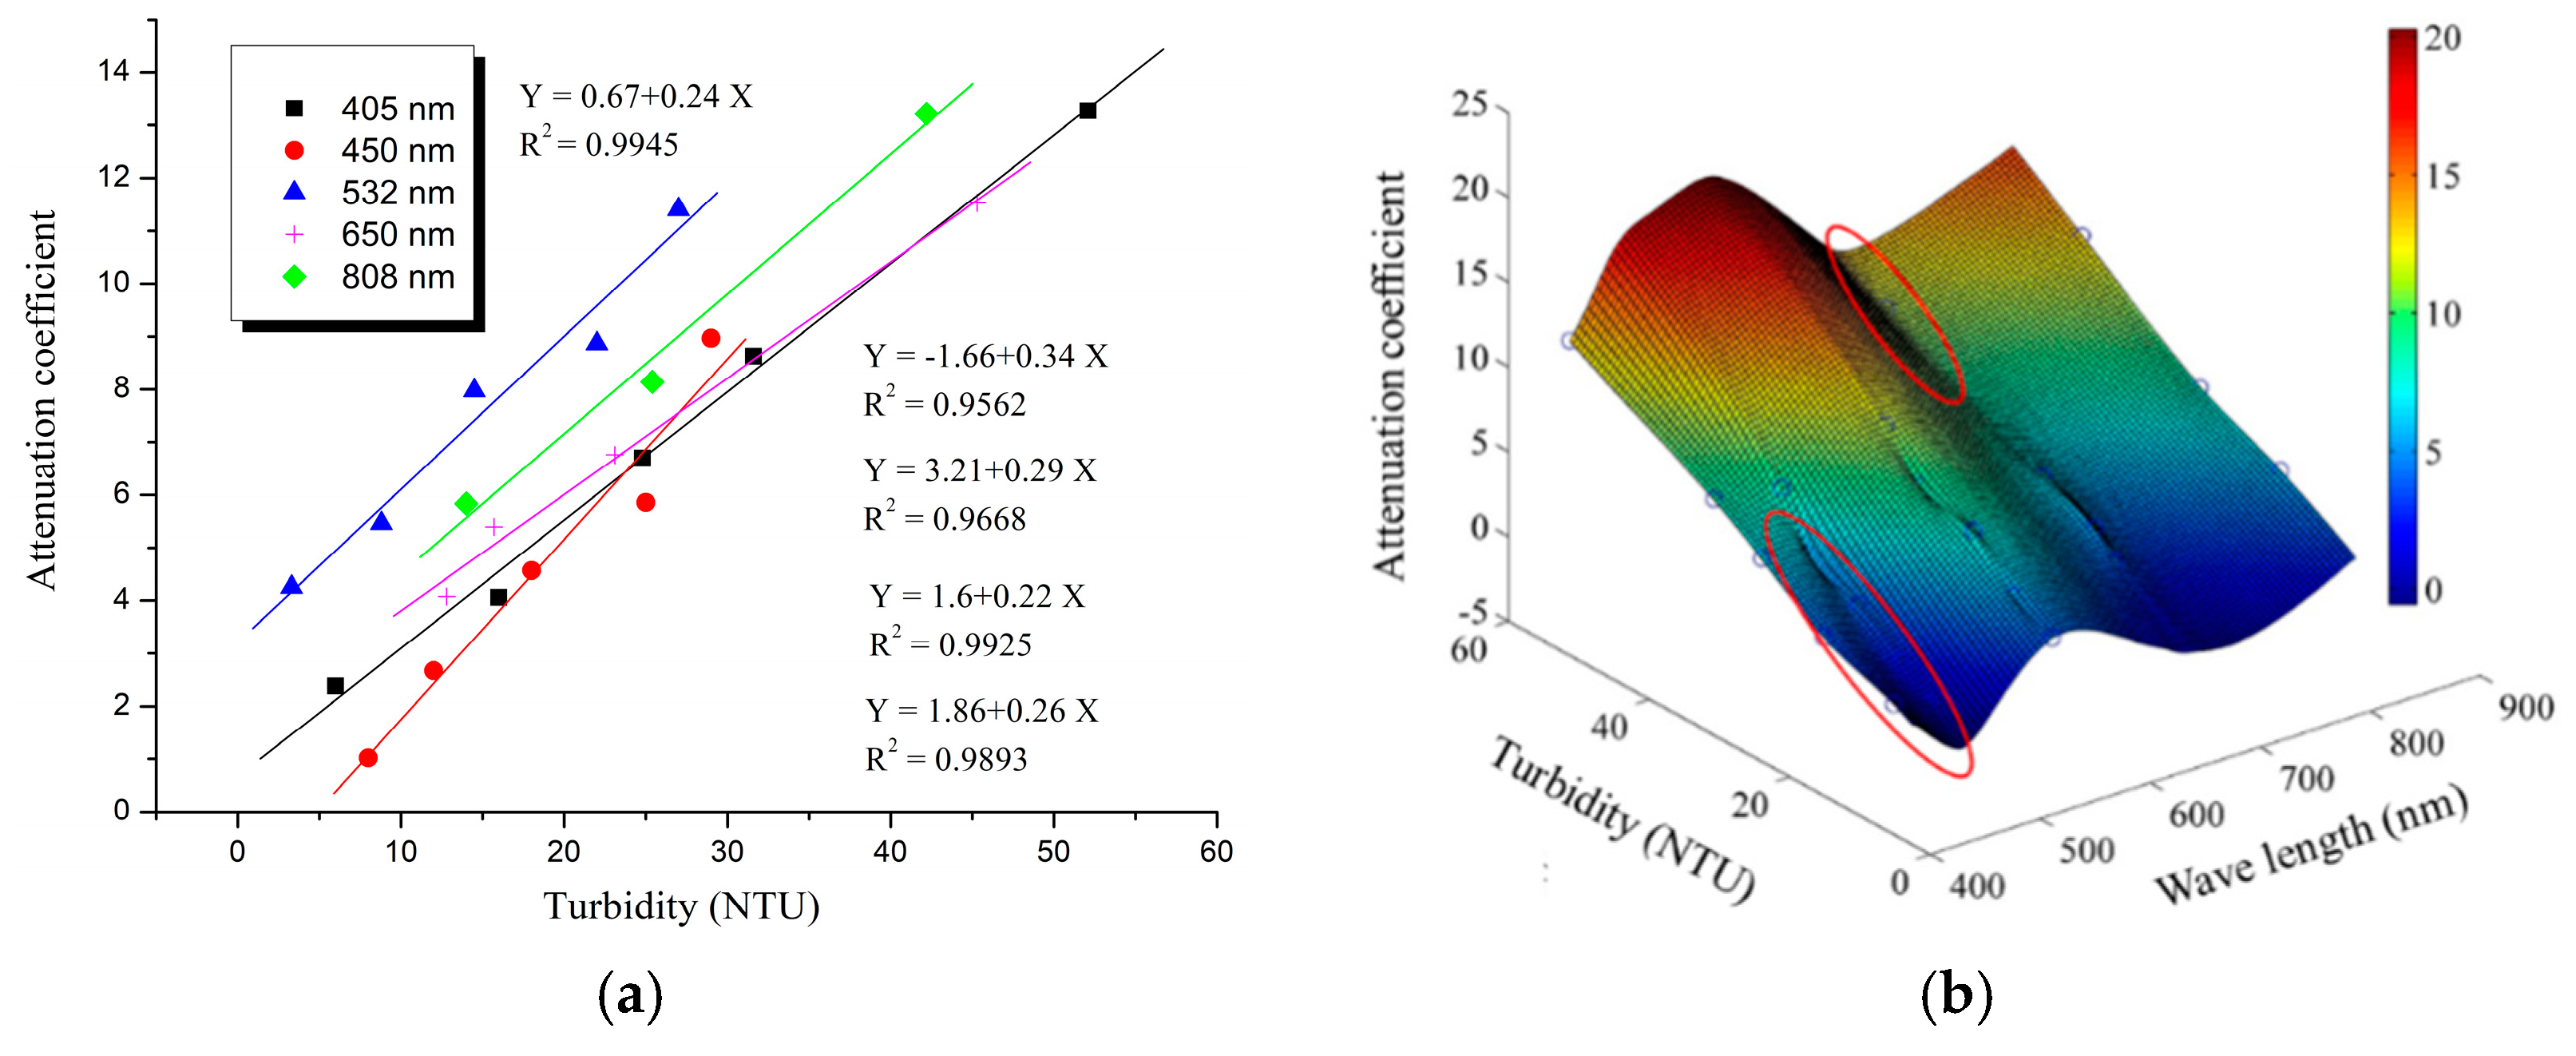
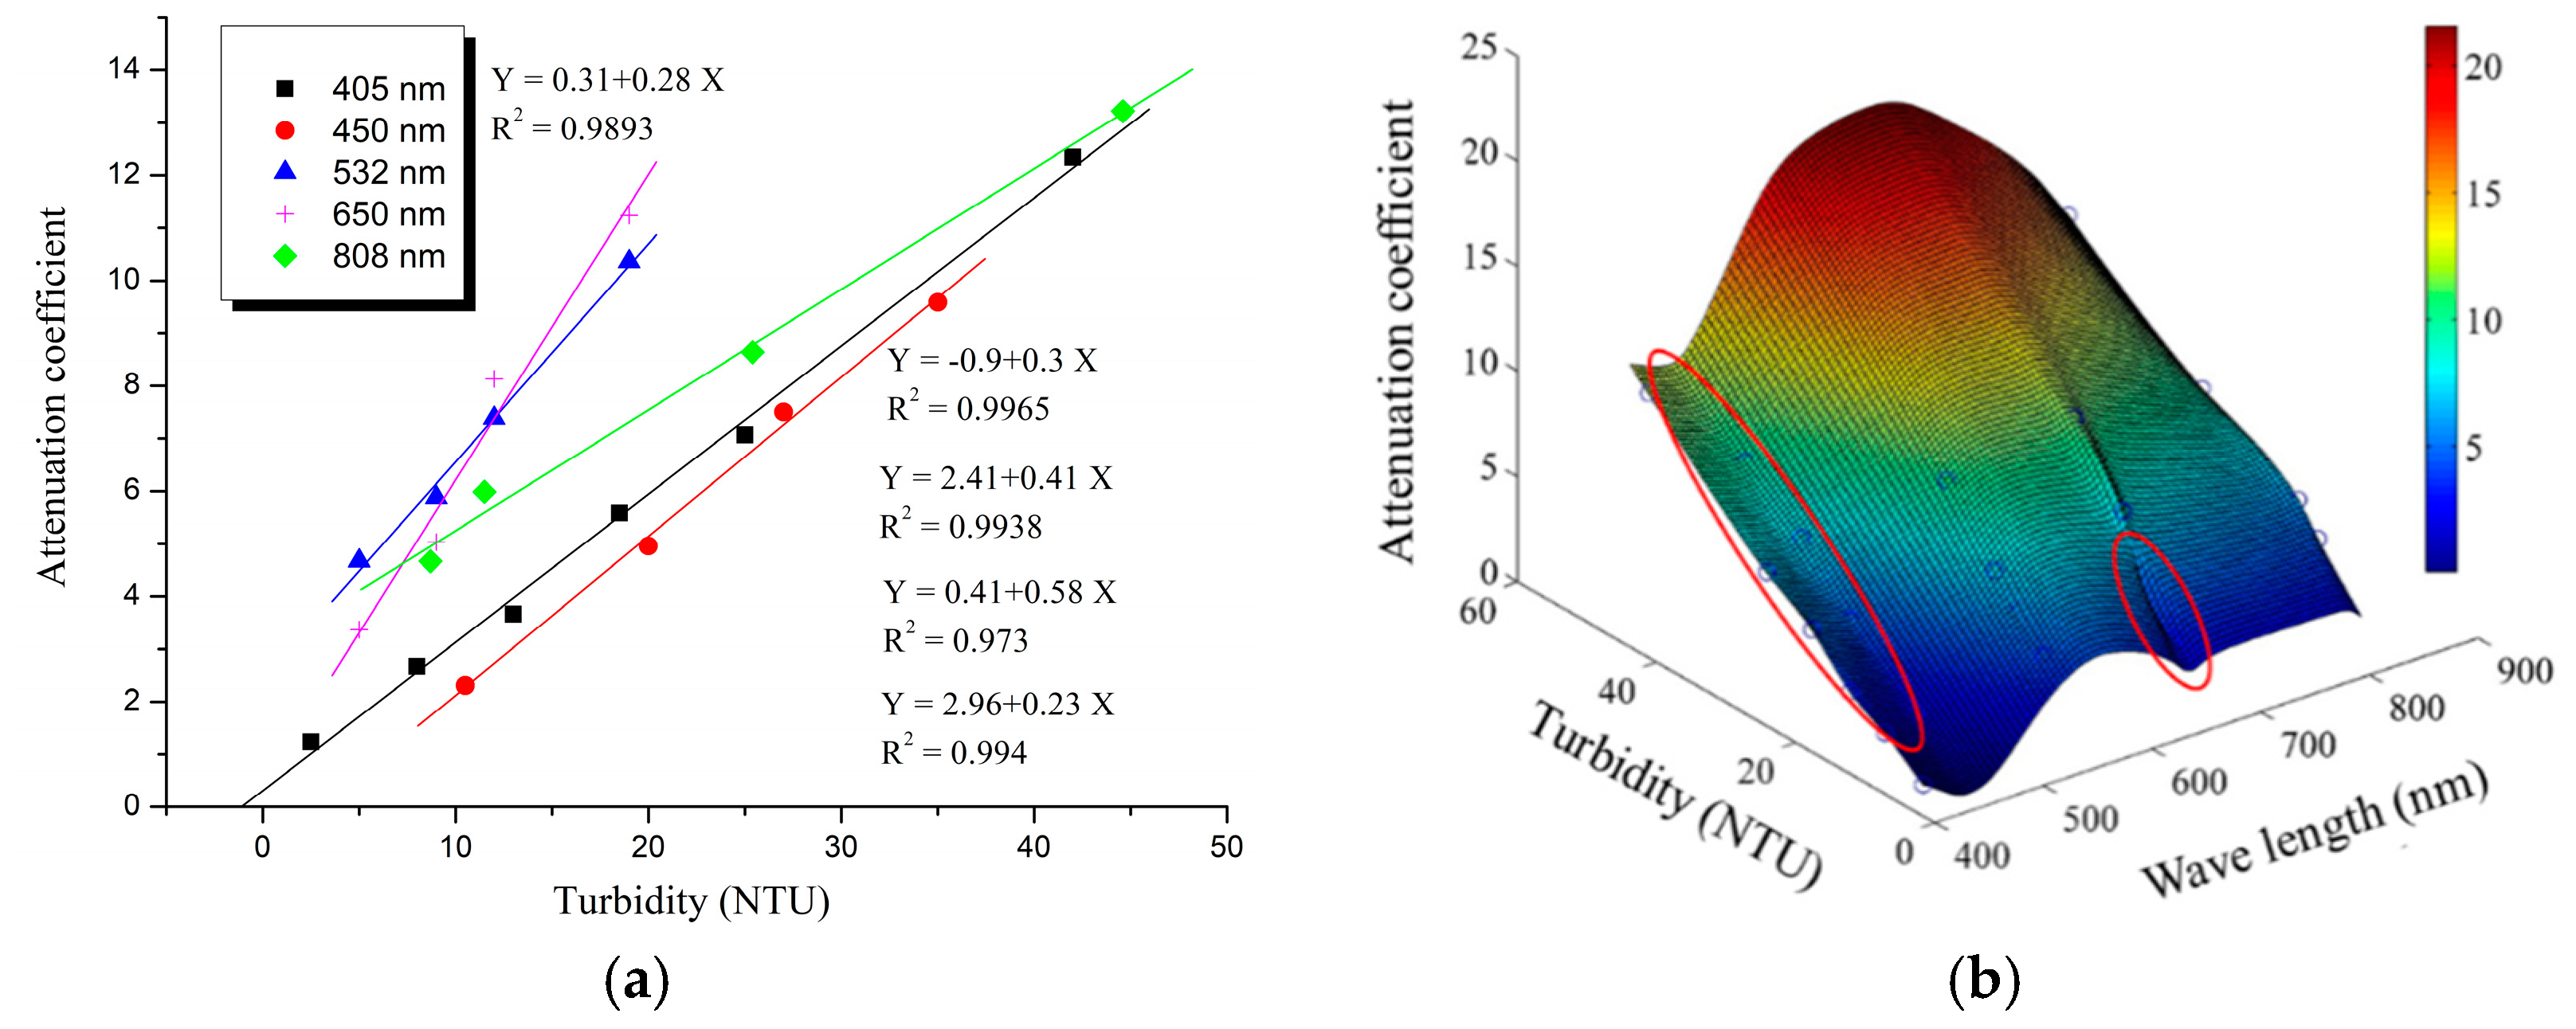
3.2. Attenuation Law of Lasers with Different Wavelengths in the Same Suspended Media
3.2.1. CaCO3 Suspended Medium
3.2.2. Silt Suspended Medium
3.2.3. Clay Suspended Medium
3.2.4. Fine Sand Suspended Medium
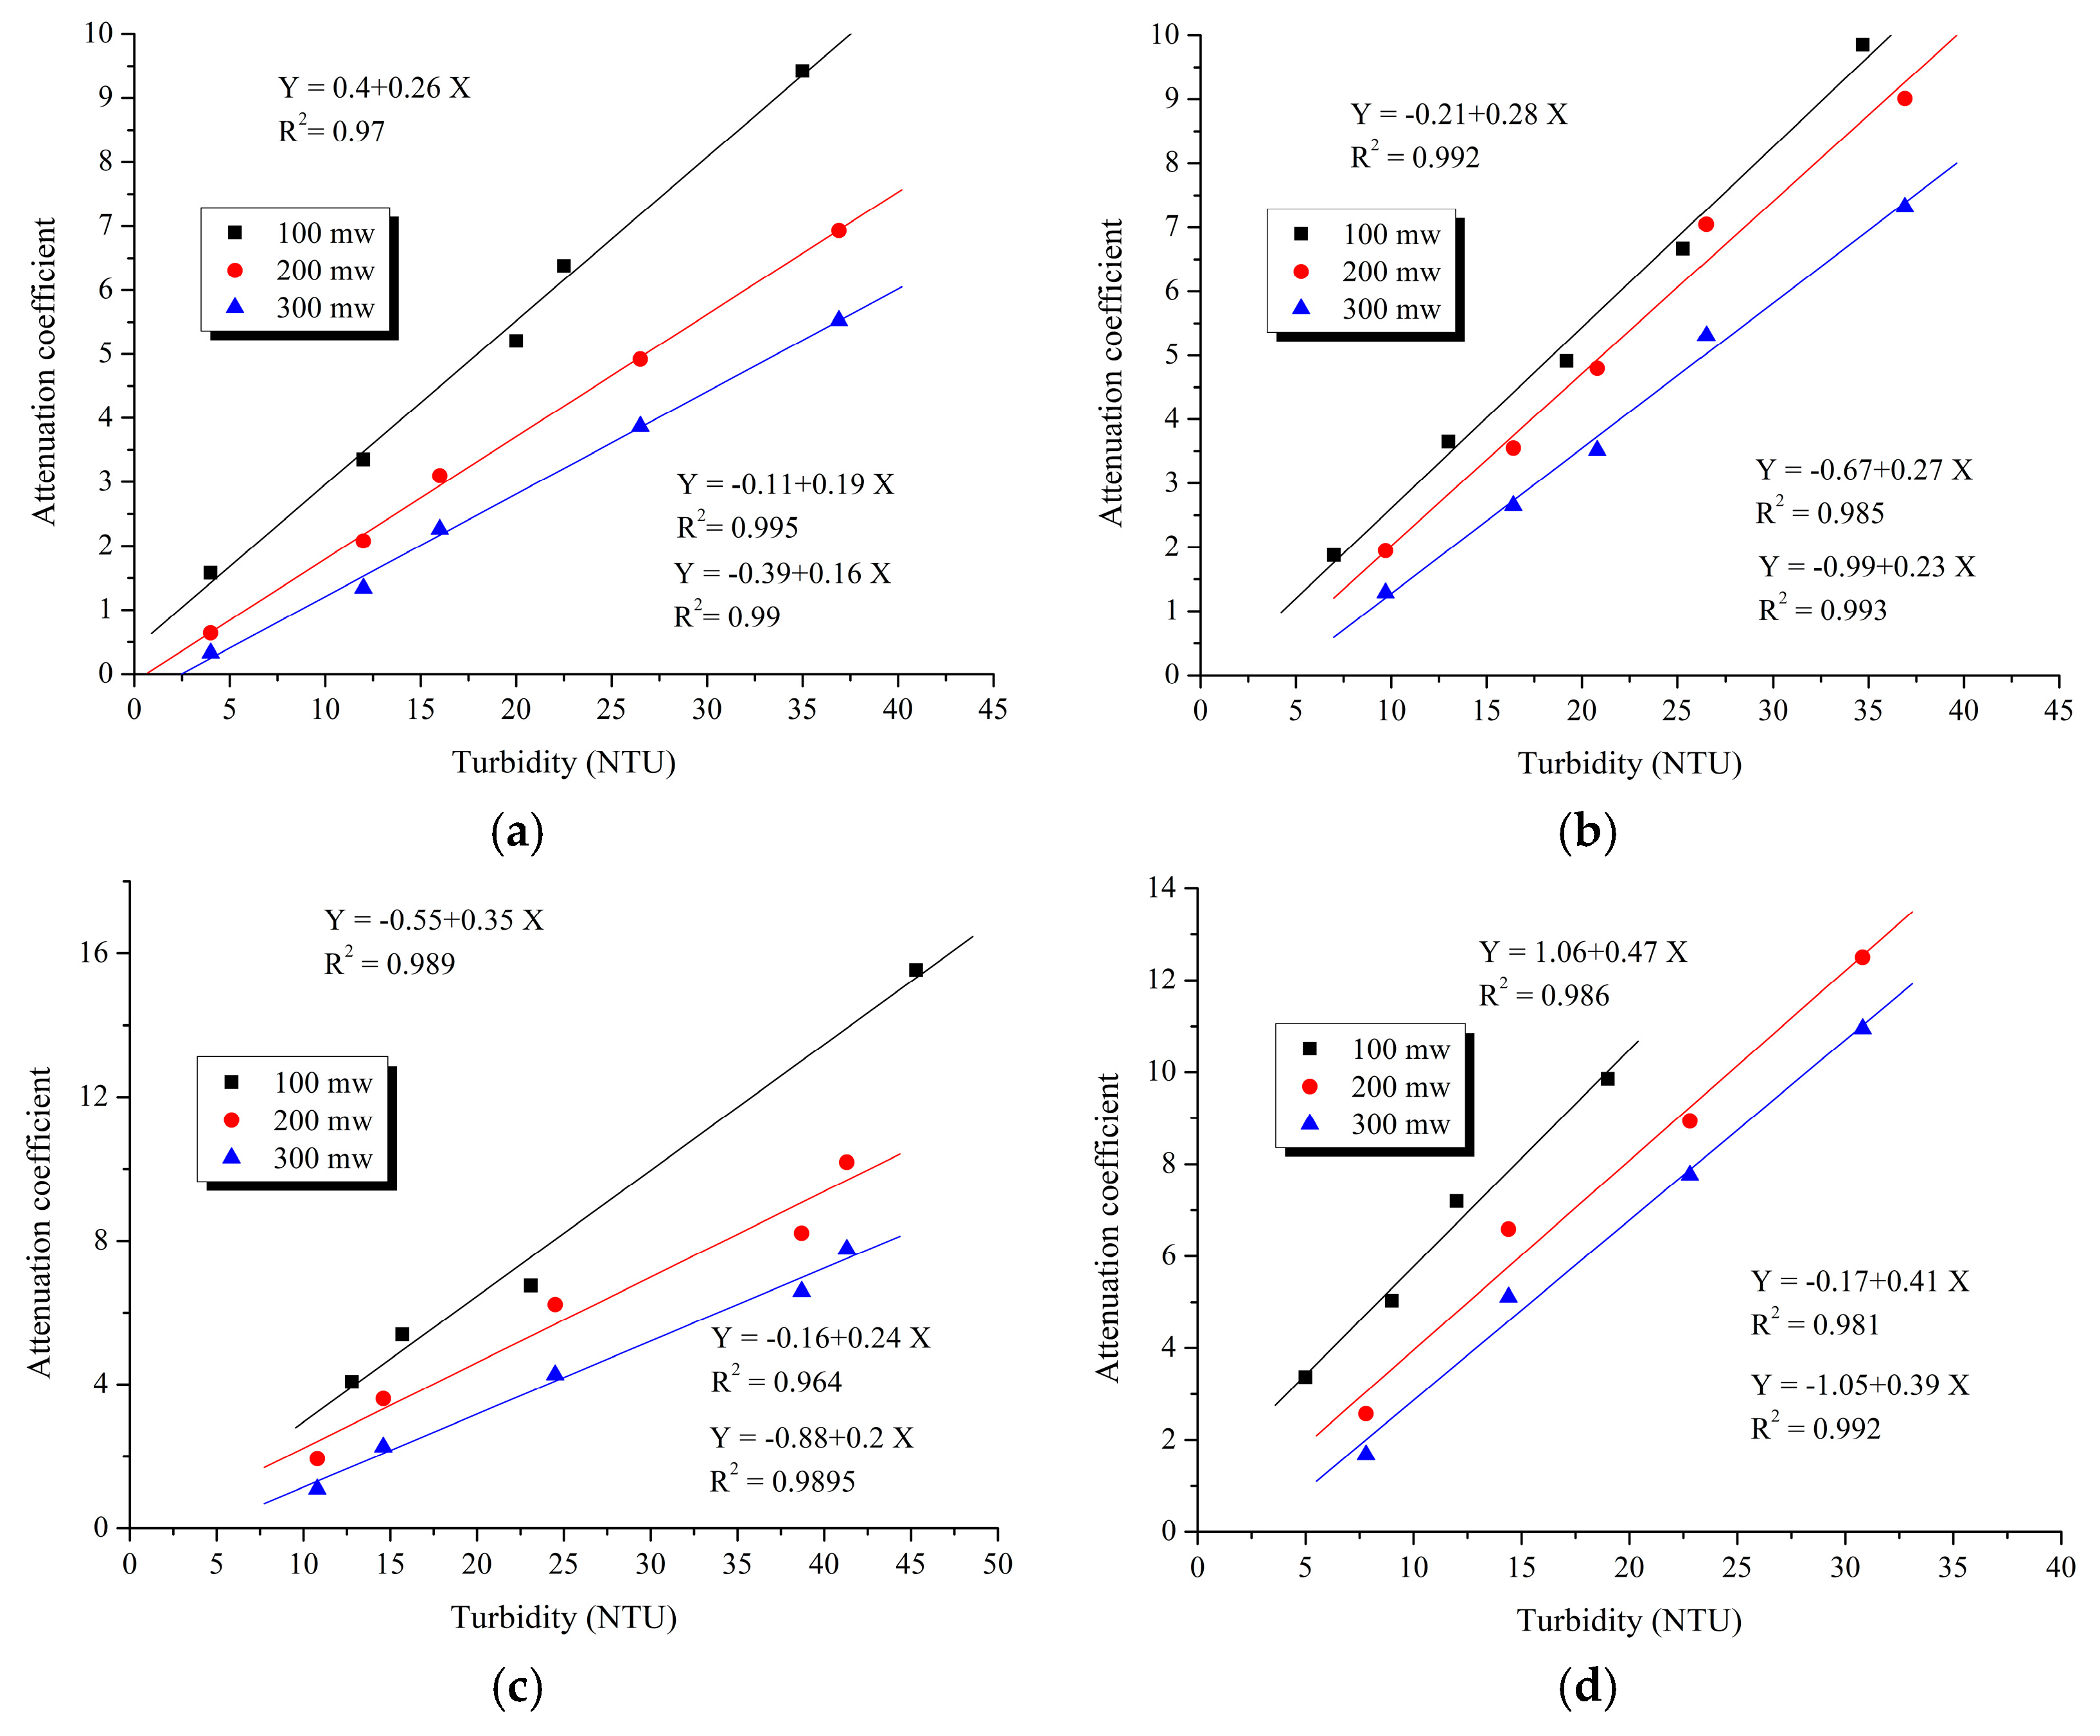
3.3. Attenuation Law of Lasers with Different Power Levels
3.4. Optimization Scheme of Longest Laser Detection Distance
4. Fine Measurement and Reconstruction of Complex Karst Caves
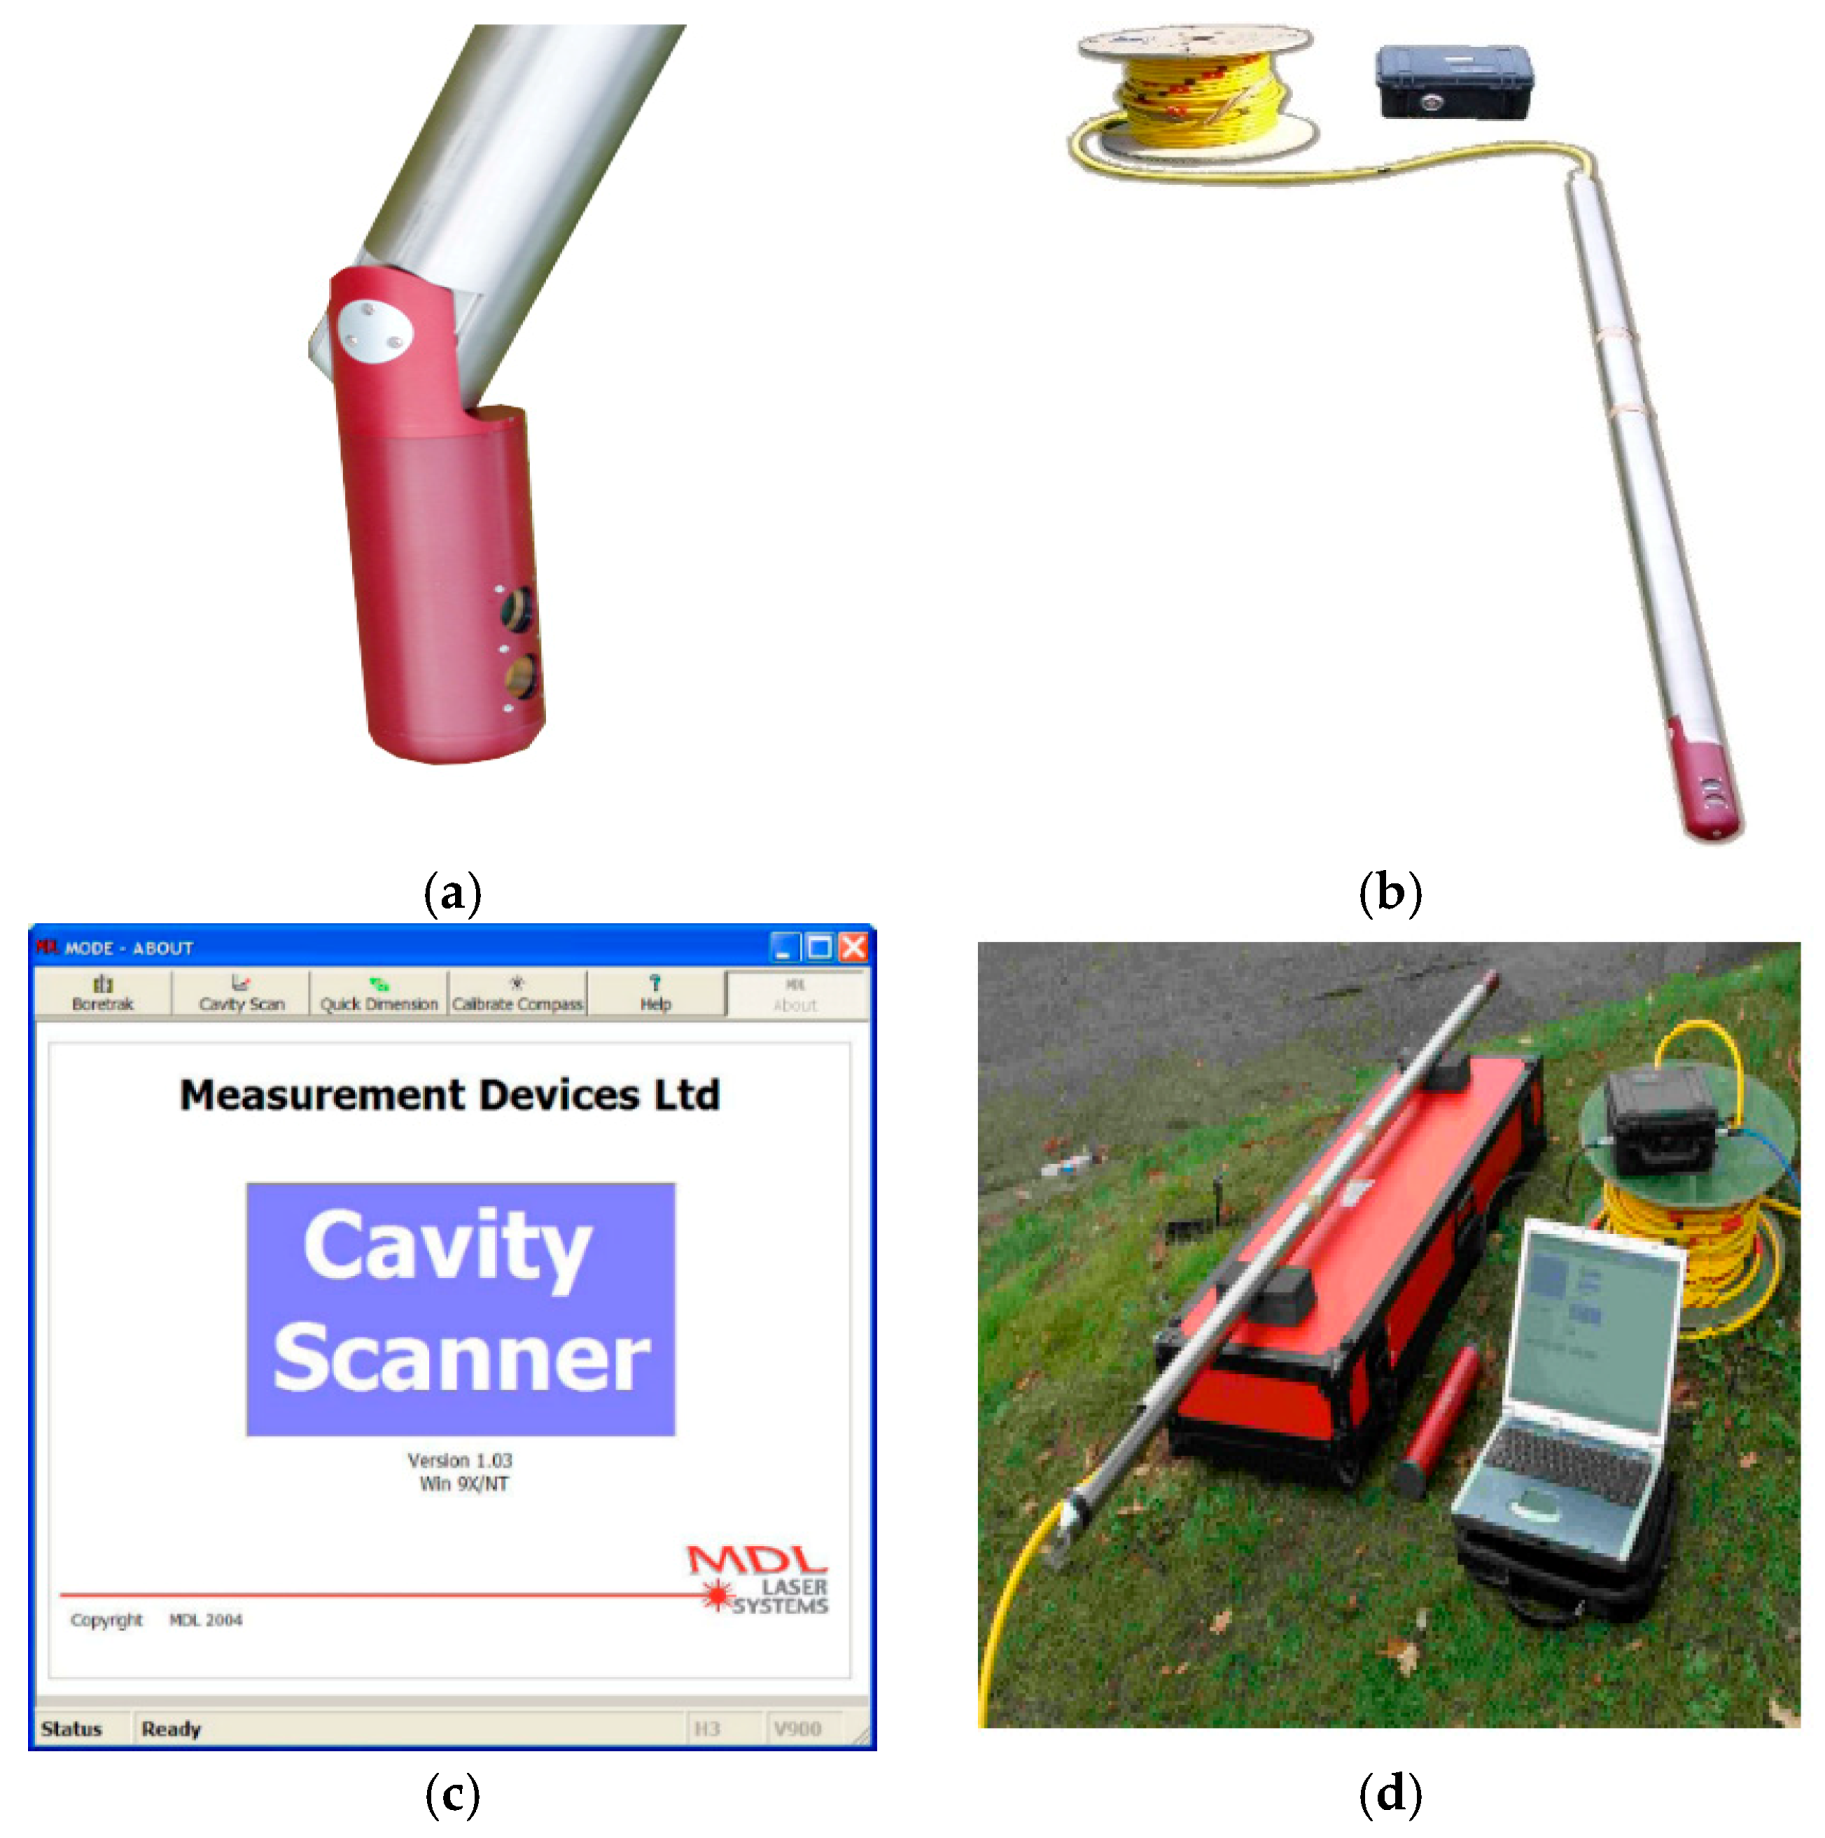
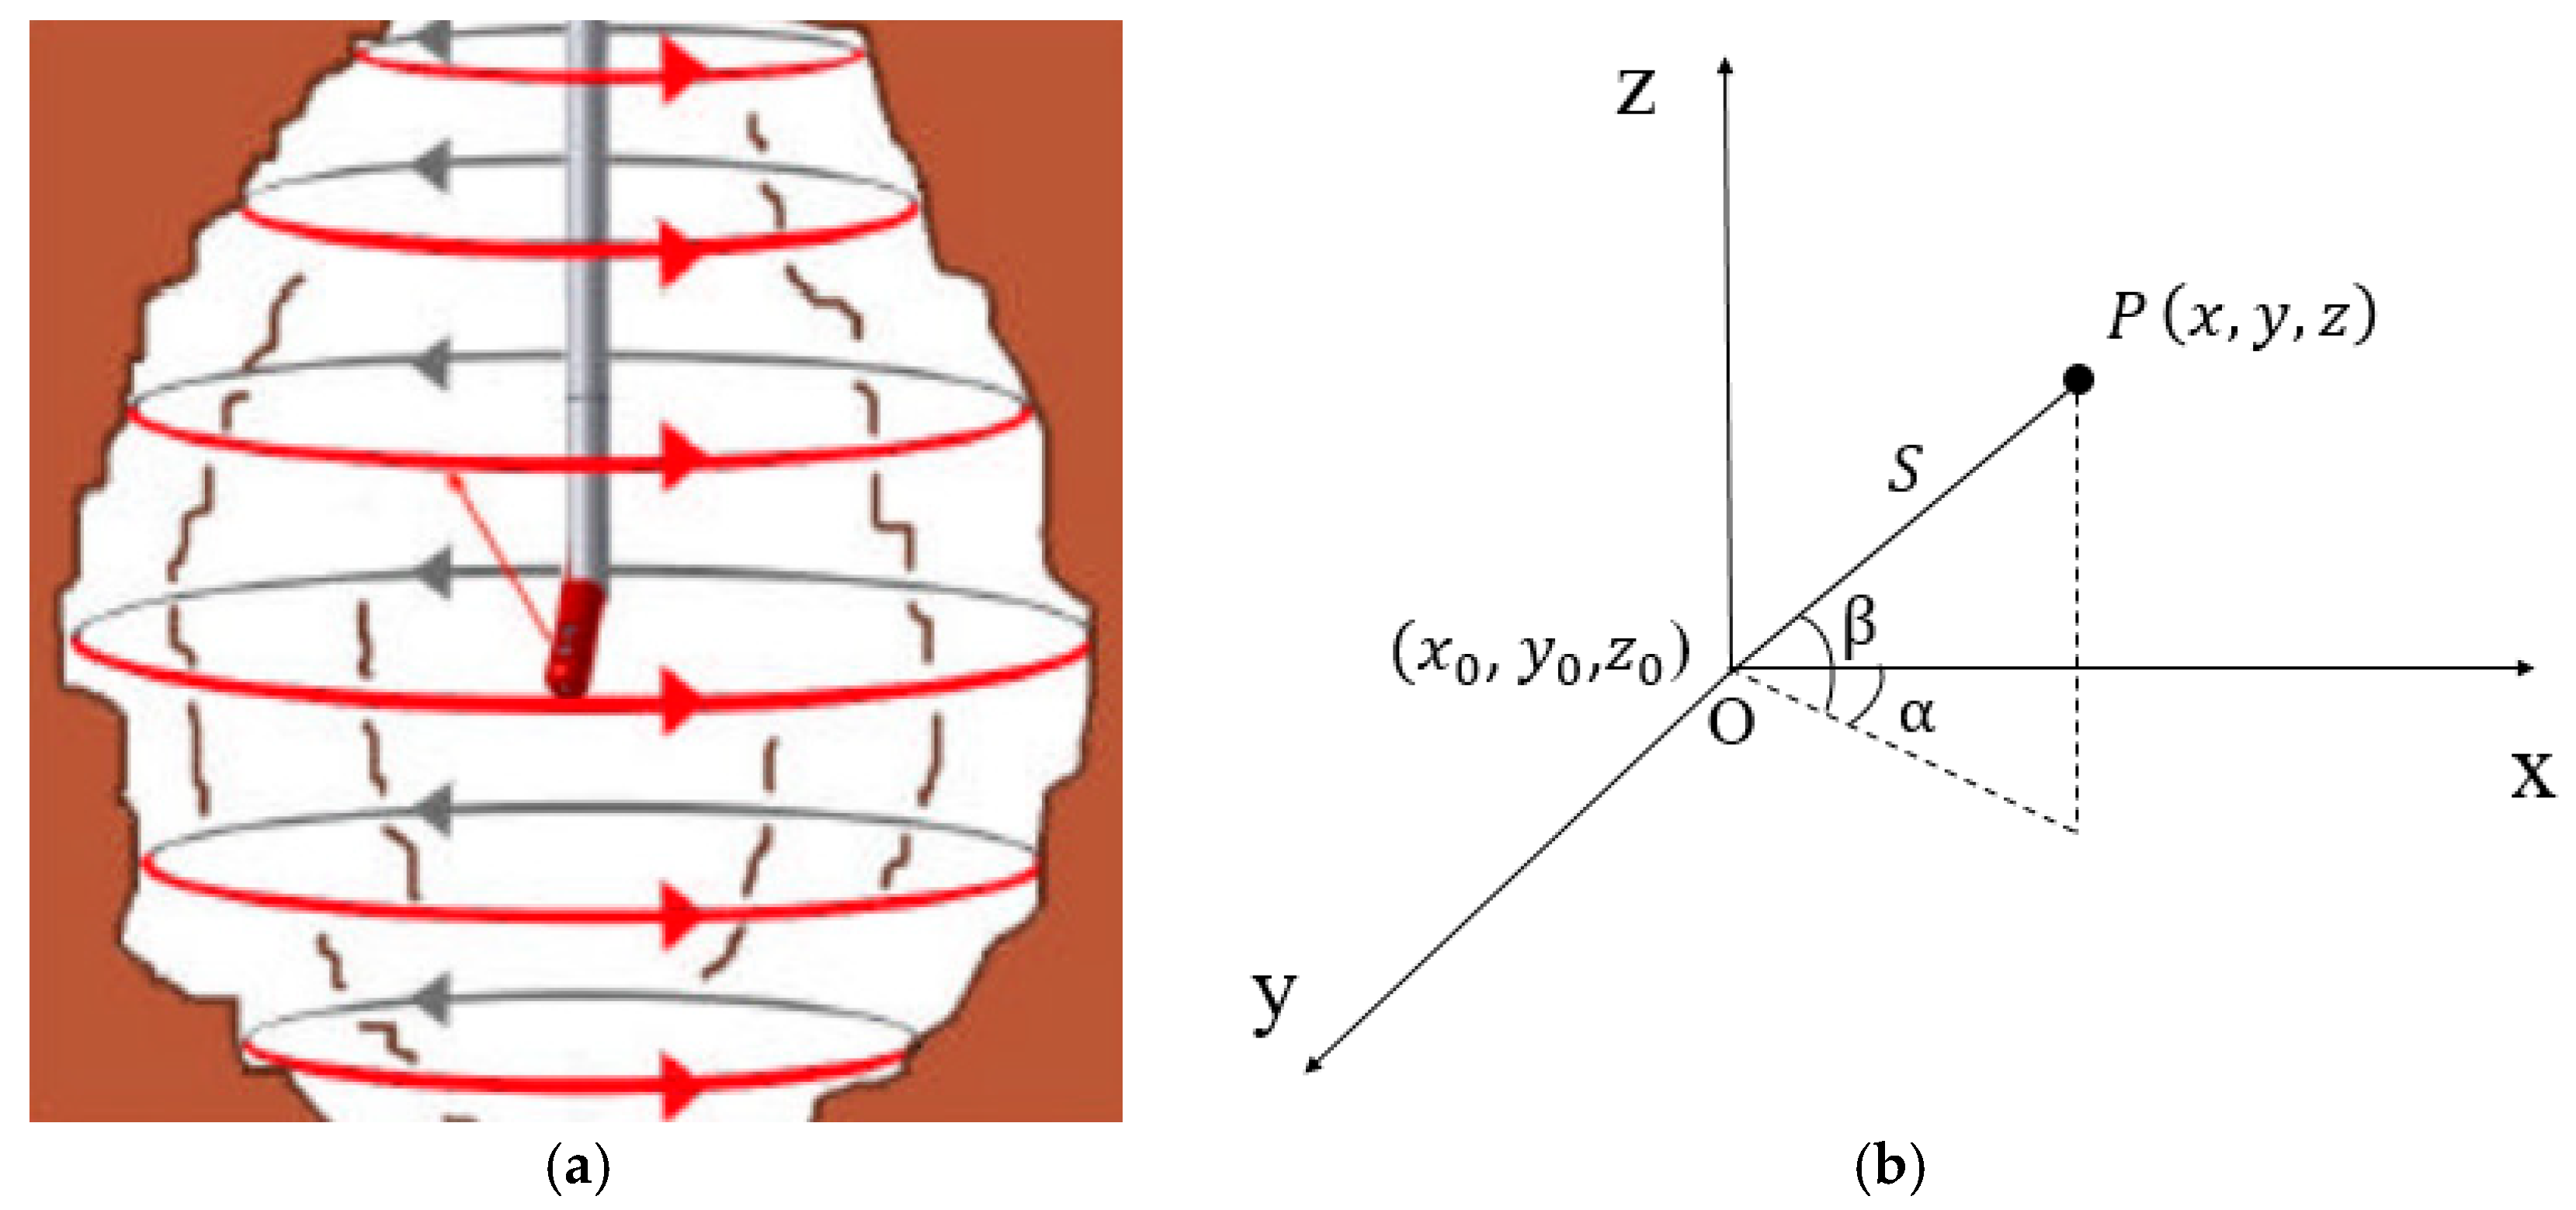
4.1. Borehole Laser Scanning Technology (BLST) Automatic Laser Scanning System in Karst Caves
4.2. Solution of Complex Cave Point Cloud Coordinates
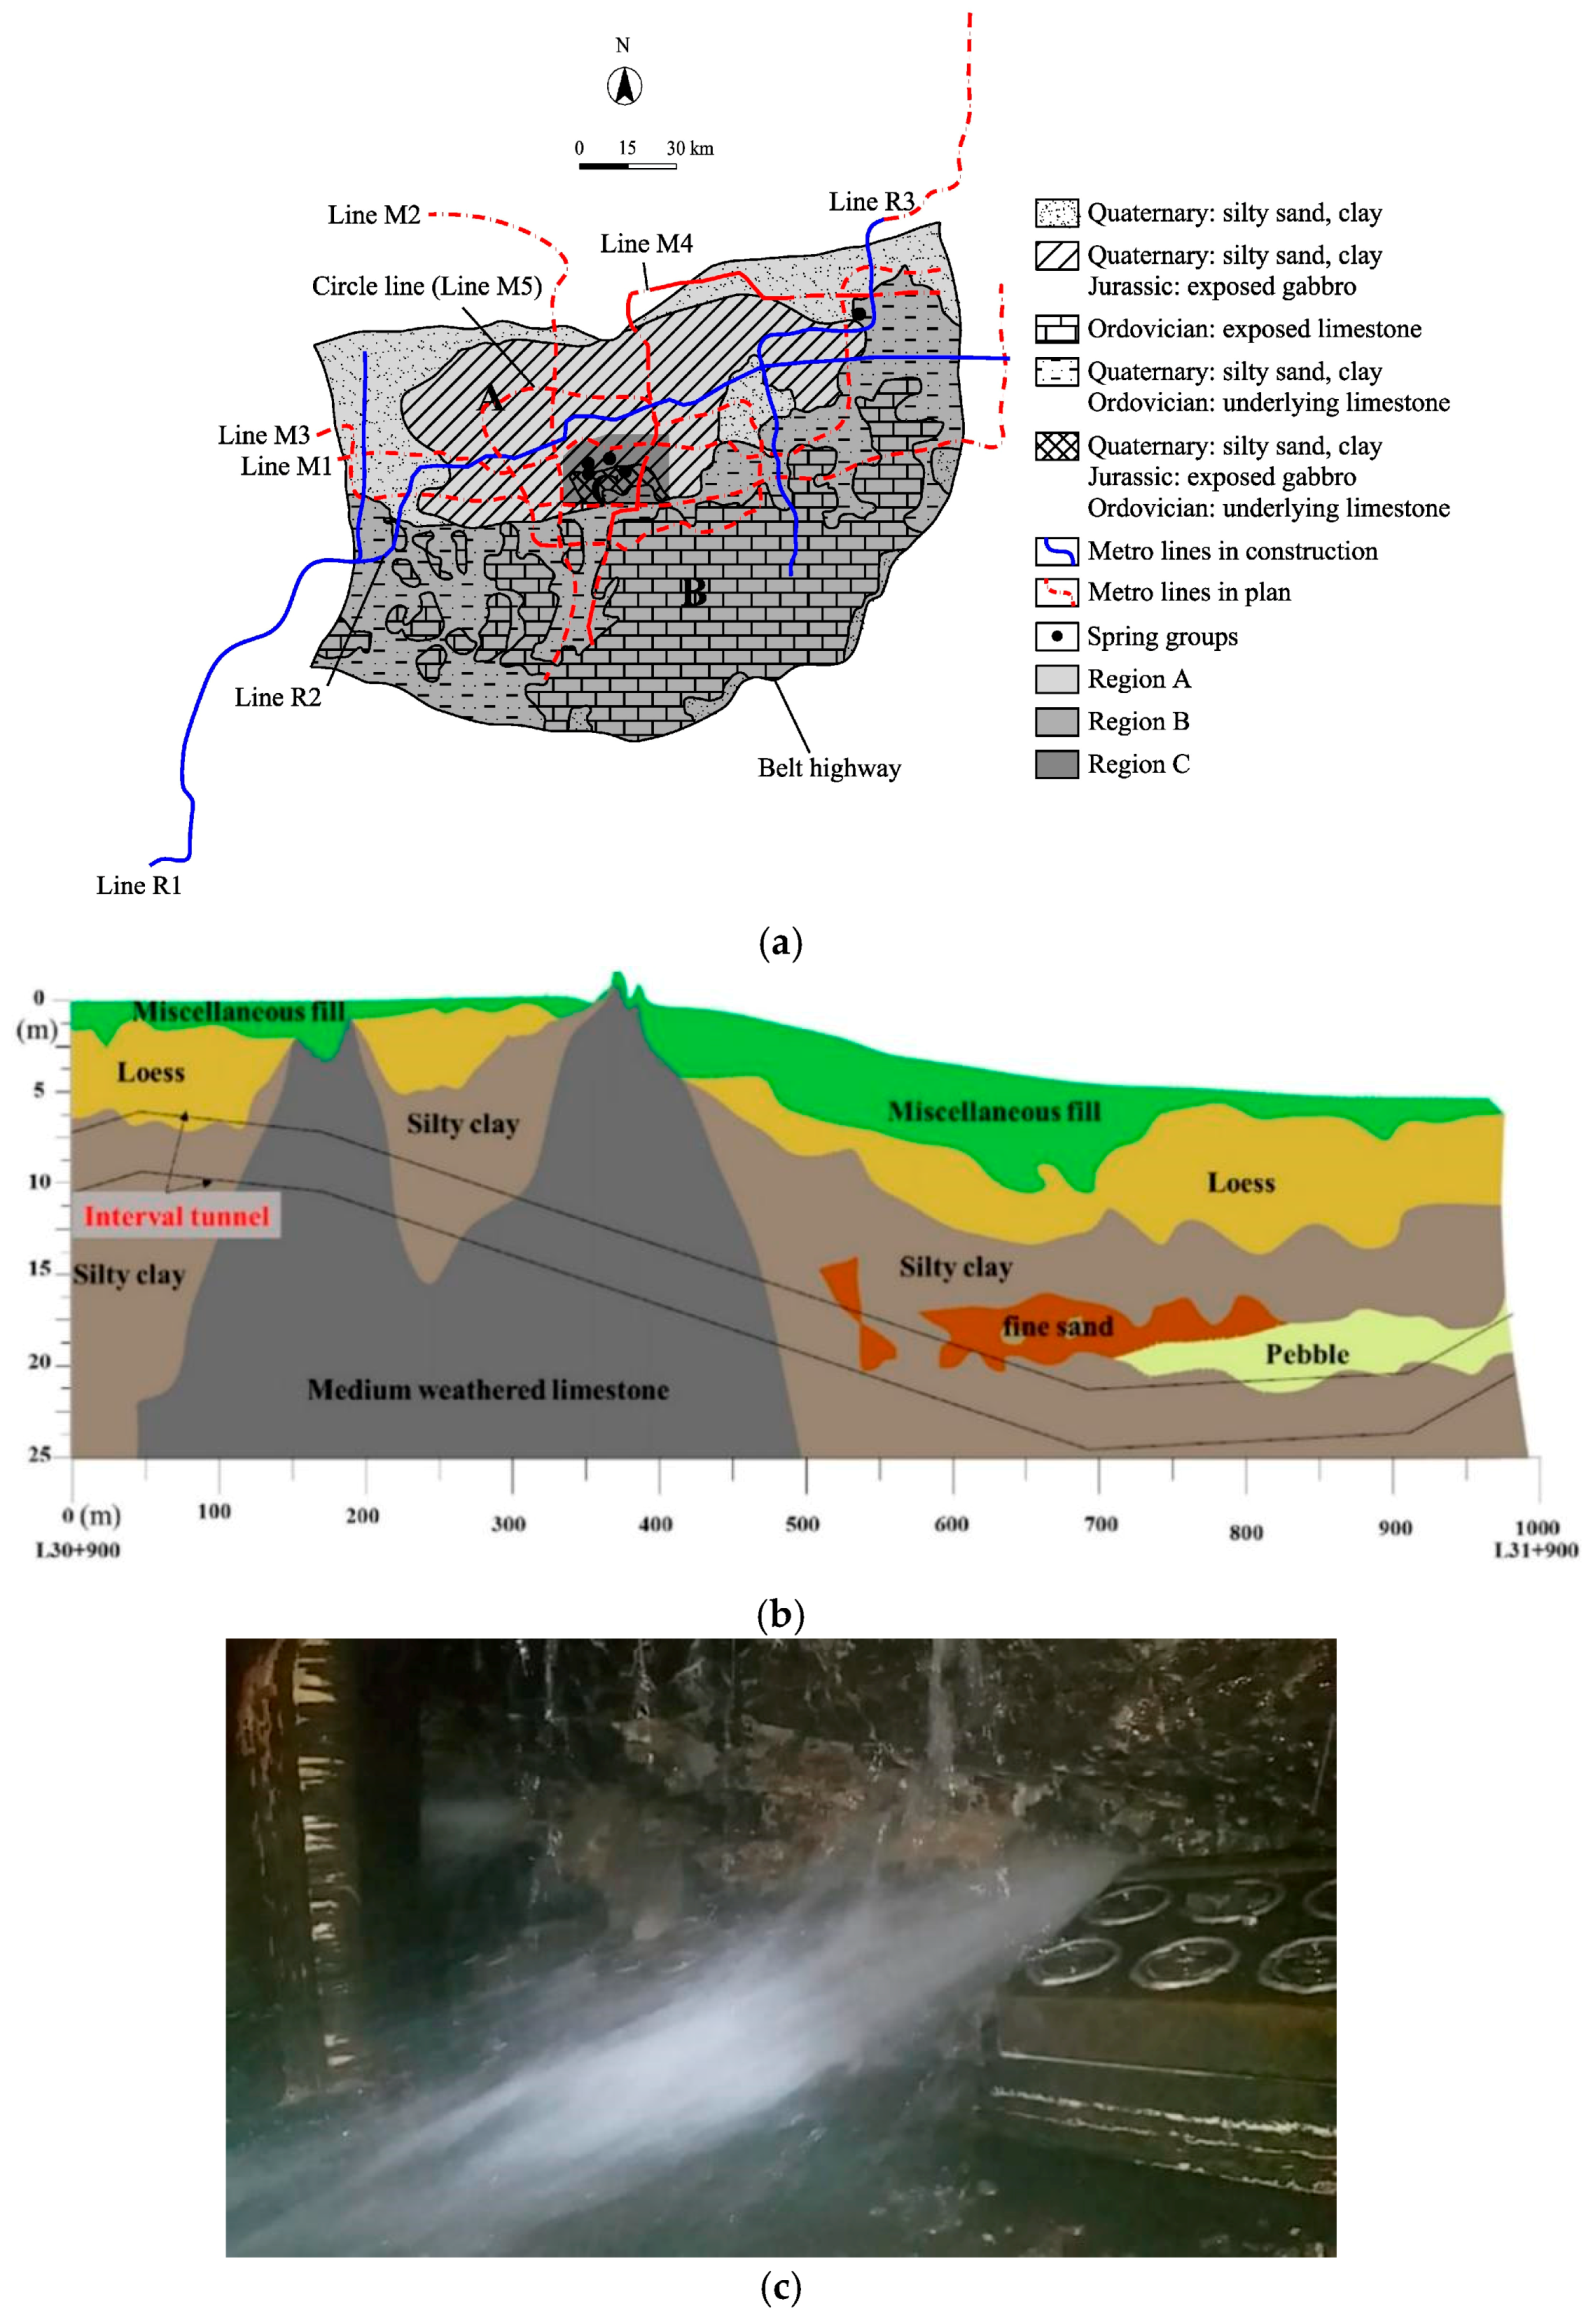
5. Case Study in Jinan Metro
5.1. Overview of the Project
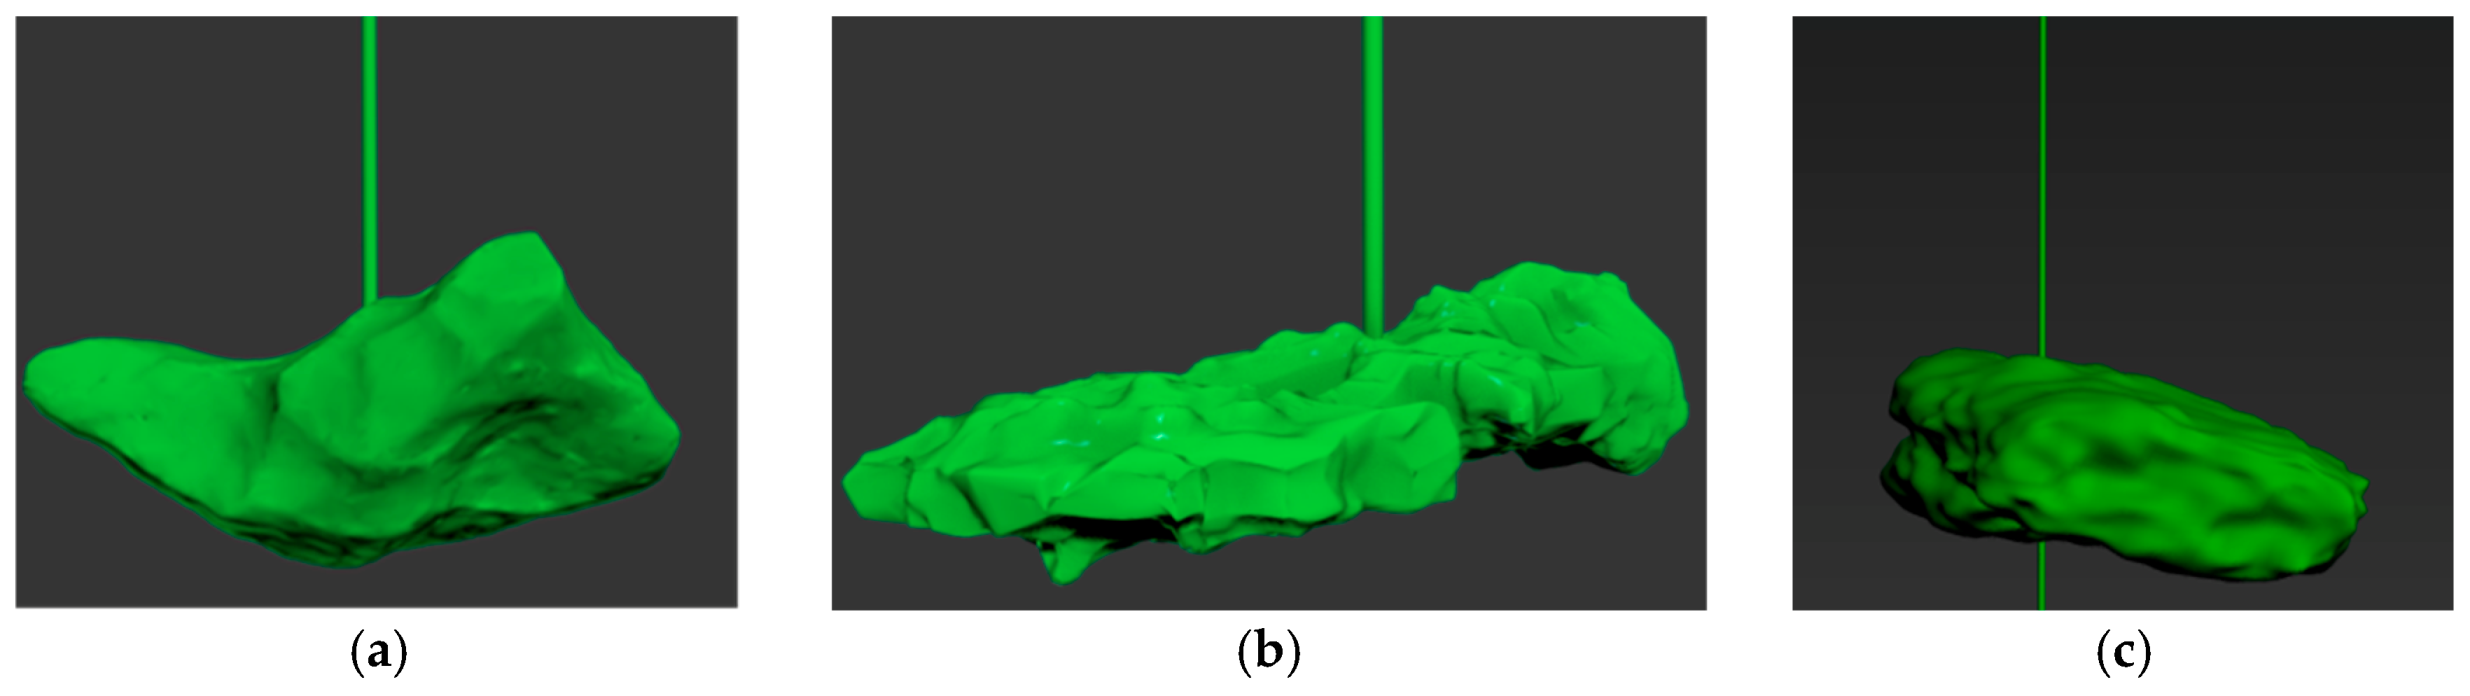
5.2. Detection of Complex Karst Caves and Three-Dimensional Data Acquisition
6. Conclusions
Author Contributions
Funding
Conflicts of Interest
References
- Cui, Q.L.; Wu, H.N.; Shen, S.L.; Xu, Y.S.; Ye, G.L. Chinese karst geology and measures to prevent geohazards during shield tunnelling in karst region with caves. Nat. Hazards 2015, 77, 129–152. [Google Scholar] [CrossRef]
- Wang, G.F.; Wu, Y.X.; Lu, L.H.; Li, G.; Shen, J.S. Investigation of the geological and hydrogeological environment with relation to metro system construction in Jinan, China. Bull. Eng. Geol. Environ. 2017, 78, 1–20. [Google Scholar] [CrossRef]
- Shen, S.L.; Wu, H.N.; Cui, Y.J.; Yin, Z.Y. Long-term settlement behavior of the metro tunnel in Shanghai. Tunn. Undergr. Space Technol. 2014, 40, 309–323. [Google Scholar] [CrossRef]
- Liao, S.M.; Liu, J.H.; Wang, R.L.; Li, Z.M. Shield tunneling and environment protection in Shanghai soft ground. Tunn. Undergr. Space Technol. 2009, 24, 454–465. [Google Scholar] [CrossRef]
- Sun, S.Q.; Li, L.P.; Wang, J.; Shi, S.S.; Song, S.G.; Fang, Z.D.; Ba, X.Z.; Jin, H. Karst Development Mechanism and Characteristics Based on Comprehensive Exploration along Jinan Metro, China. Sustainability 2018, 10, 3383. [Google Scholar] [CrossRef] [Green Version]
- Cui, Q.L.; Shen, S.L.; Xu, Y.S.; Wu, H.N.; Yin, Z.Y. Mitigation of geohazards during deep excavations in karst regions with caverns: A case study. Eng. Geol. 2015, 195, 16–27. [Google Scholar] [CrossRef]
- Zhao, Y.; Li, P.F.; Tian, S.M. Prevention and treatment technologies of railway tunnel water inrush and mud gushing in China. J. Rock Mech. Geotech. Eng. 2013, 5, 468–477. [Google Scholar] [CrossRef] [Green Version]
- Pasha, A.Y.; Khoshghalb, A.; Khalili, N. Pitfalls in Interpretation of Gravimetric Water Content–Based Soil-Water Characteristic Curve for Deformable Porous Media. Int. J. Geomech. 2015, 16, D4015004. [Google Scholar] [CrossRef]
- Liu, J.Q.; Chen, W.Z.; Yuan, J.Q.; Li, C.J.; Zhang, Q.Y.; Li, X.F. Groundwater control and curtain grouting for tunnel construction in completely weathered granite. Bull. Eng. Geol. Environ. 2018, 77, 515–531. [Google Scholar] [CrossRef]
- Li, S.C.; Liu, B.; Xu, X.J.; Nie, L.C.; Liu, Z.Y.; Song, J.; Sun, H.F.; Chen, L.; Fan, K.R. An overview of ahead geological prospecting in tunneling. Tunn. Undergr. Space Technol. 2017, 63, 69–94. [Google Scholar] [CrossRef]
- Li, S.C.; Liu, H.L.; Li, L.P.; Shi, S.S.; Zhang, Q.Q.; Sun, S.Q.; Hu, J. A quantitative method for rock structure at working faces of tunnels based on digital images and its application. Chin. J. Rock Mech. Eng. 2017, 36, 1–9. [Google Scholar] [CrossRef]
- Kana, J.D.; Djongyang, N.; Raïdandi, D.; Phillippe, N.N.; Abdouramani, D. A review of geophysical methods for geothermal exploration. Renew. Sustain. Energy Rev. 2015, 44, 87–95. [Google Scholar] [CrossRef]
- Lu, T.; Liu, S.; Wang, B.; Liu, S.D.; Wu, L.X.; Hu, X.W. A Review of Geophysical Exploration Technology for Mine Water Disaster in China: Applications and Trends. Mine Water Environ. 2017, 36, 331–340. [Google Scholar] [CrossRef]
- Xu, L.Y.; Curwen, C.A.; Hon, P.W.C.; Chen, Q.S.; Itoh, T. Metasurface external cavity laser. Appl. Phys. Lett. 2015, 107, 221105. [Google Scholar] [CrossRef]
- Liu, X.L.; Li, X.B.; Li, F.B.; Zhao, G.Y.; Qin, Y.H. 3D cavity detection technique and its application based on cavity auto scanning laser system. J. Cent. South Univ. Technol. 2008, 15, 285–288. [Google Scholar] [CrossRef]
- Li, X.B.; Li, D.Y.; Zhao, G.Y.; Zhou, Z.L.; Gong, F.Q. Detecting, Disposal and Safety Evaluation of the Underg round Goaf in Metal Mines. J. Mining Saf. Eng. 2006, 1, 24–29. [Google Scholar]
- Luo, Z.Q.; Luo, Z.Y.; Zhang, W.F.; Zhou, J.M.; Huang, J.J. Spherical projection triangulation algorithm for laser-scanninp splice unorganized Points of complex goafs. Chin. J. Eng. 2015, 37, 823–830. [Google Scholar]
- Cui, H.; Hu, Q.W.; Mao, Q.Z.; Song, M.X. Spiral trajectory planning approach for underground cavity measurements based on laser scanning. Measurement 2017, 110, 166–175. [Google Scholar] [CrossRef]
- Ingram, C.; Marshall, J. Evaluation of a ToF camera for remote surveying of underground cavities excavated by jet boring. Autom. Constr. 2015, 49, 271–282. [Google Scholar] [CrossRef] [Green Version]
- Oubei, H.M.; Li, C.; Park, K.H.; Ng, T.K.; Slim, M. 2.3 Gbit/s underwater wireless optical communications using directly modulated 520 nm laser diode. Opt. Express 2015, 23, 20743–20748. [Google Scholar] [CrossRef]
- Zhao, J.H.; Zhao, X.L.; Zhang, H.M.; Zhou, F.N. Shallow water measurements using a single green laser corrected by building a near water surface penetration model. Remote Sens. 2017, 9, 426. [Google Scholar] [CrossRef] [Green Version]
- Wen, Y.Z.; Mao, Y.F.; Wang, X.P. Application of chromaticity coordinates for solution turbidity measurement. Measurement 2018, 130, 39–43. [Google Scholar] [CrossRef]
- Shi, J.L.; Guo, P.F.; Huang, Y.; Qian, J.C.; Wang, H.P.; Liu, J.; He, X.D. Influences of temperature, humidity and pressure on the attenuation characteristics of laser beam in water. Acta Phys. Sin. 2015, 64, 24215. [Google Scholar] [CrossRef]
- Sun, S.Q. Precise Characteristics of Irregular Cavity and Its Effect on Surrounding Rockmass Stability of Shield Tunnel. Doctor Dissertation, Shandong University, Jinan, China, 23 May 2019. [Google Scholar]
- Wang, G.F.; Lyu, H.M.; Shen, S.L.; Lu, L.H.; Li, G.; Arulrajah, A. Evaluation of environmental risk due to metro system construction in Jinan, China. Int. J. Environ. Res. Public Health 2017, 14, 1114. [Google Scholar] [CrossRef] [Green Version]
- Chen, Y.W. Field measurement of laser attenuation in natural water. Ship Sci. Technol. 2000, 1, 3–7. [Google Scholar]
- Wang, J.; Li, L.; Shi, S.; Sun, S.; Ba, X.; Zhang, Y. Fine Exploration and Control of Subway Crossing Karst Area. Appl. Sci. 2019, 9, 2588. [Google Scholar] [CrossRef] [Green Version]
- Wang, J.; Li, S.C.; Li, L.P.; Lin, P.; Xu, Z.H.; Gao, C.L. Attribute recognition model for risk assessment of water inrush. Bull. Eng. Geol. Environ. 2019, 78, 1057–1071. [Google Scholar] [CrossRef]
- Li, W.T.; Yang, N.; Mei, Y.C.; Zhang, Y.H.; Wang, L.; Ma, H.Y. Experimental investigation of the compression-bending property of the casing joints in a concrete filled steel tubular supporting arch for tunnel engineering. Tunn. Undergr. Space Technol. 2020, 96, 103184. [Google Scholar] [CrossRef]


| Type | Wavelength (nm) | Wavelength Selected (nm) |
|---|---|---|
| Blue-violet laser | 405 | 405 |
| Blue laser | 450, 457, 473 | 450 |
| Green laser | 532 | 532 |
| Near infrared laser | 635, 660, 670, 671 | 650 |
| Far infrared laser | 808, 946, 980, 1047, 1064 | 808 |
| Medium | Turbidity (NTU) | 10 | 20 | 30 | 40 | 50 | |
|---|---|---|---|---|---|---|---|
| Length (nm) | |||||||
| CaCO3 | 405 | 1.63 | 0.85 | 0.58 | 0.44 | 0.35 | |
| 450 | 1.95 | 1.03 | 0.70 | 0.53 | 0.43 | ||
| 532 | 0.83 | 0.54 | 0.40 | 0.32 | 0.27 | ||
| 650 | 1.61 | 0.79 | 0.52 | 0.39 | 0.31 | ||
| 808 | 0.85 | 0.57 | 0.43 | 0.34 | 0.29 | ||
| Laser wavelength suggested (nm) | 450 | 450 | 450 | 450 | 450 | ||
| Silt | 405 | 1.02 | 0.61 | 0.44 | 0.34 | 0.28 | |
| 450 | 3.11 | 1.03 | 0.62 | 0.44 | 0.34 | ||
| 532 | 1.12 | 0.70 | 0.50 | 0.40 | 0.32 | ||
| 650 | 1.65 | 0.96 | 0.68 | 0.52 | 0.43 | ||
| 808 | 1.05 | 0.55 | 0.37 | 0.28 | 0.23 | ||
| Laser wavelength suggested (nm) | 450 | 450 | 650 | 650 | 650 | ||
| Clay | 405 | 1.26 | 0.71 | 0.49 | 0.38 | 0.30 | |
| 450 | 2.23 | 0.76 | 0.45 | 0.33 | 0.25 | ||
| 532 | 0.64 | 0.43 | 0.33 | 0.26 | 0.22 | ||
| 650 | 1.02 | 0.65 | 0.47 | 0.37 | 0.31 | ||
| 808 | 0.86 | 0.54 | 0.40 | 0.31 | 0.26 | ||
| Laser wavelength suggested (nm) | 450 | 450 | 650 | 650 | 650 | ||
| SiO2 | 405 | 1.25 | 0.66 | 0.45 | 0.34 | 0.27 | |
| 450 | 1.84 | 0.76 | 0.48 | 0.35 | 0.27 | ||
| 532 | 0.59 | 0.36 | 0.26 | 0.21 | 0.17 | ||
| 650 | 0.63 | 0.32 | 0.22 | 0.17 | 0.13 | ||
| 808 | 0.74 | 0.52 | 0.40 | 0.32 | 0.27 | ||
| Laser wavelength suggested (nm) | 450 | 450 | 450 | 450 | 450 | ||
| Medium | Turbidity (NTU) | 5 | 10 | 20 | 30 | 40 | |
|---|---|---|---|---|---|---|---|
| Power (mw) | |||||||
| CaCO3 | 100 | 2.32 | 1.32 | 0.71 | 0.48 | 0.37 | |
| 200 | 4.63 | 2.17 | 1.05 | 0.69 | 0.52 | ||
| 300 | 9.55 | 3.22 | 1.39 | 0.88 | 0.65 | ||
| Maximum differential times | 4.12 | 2.45 | 1.96 | 1.83 | 1.77 | ||
| Silt | 100 | 3.25 | 1.49 | 0.72 | 0.47 | 0.35 | |
| 200 | 5.78 | 1.93 | 0.83 | 0.53 | 0.39 | ||
| 300 | 6.07 | 3.05 | 1.10 | 0.67 | 0.48 | ||
| Maximum differential times | 1.87 | 2.05 | 1.53 | 1.42 | 1.37 | ||
| Clay | 100 | 1.70 | 0.96 | 0.52 | 0.35 | 0.27 | |
| 200 | 3.77 | 1.75 | 0.85 | 0.56 | 0.42 | ||
| 300 | 6.16 | 3.39 | 1.23 | 0.75 | 0.54 | ||
| Maximum differential times | 3.63 | 3.52 | 2.37 | 2.12 | 2.01 | ||
| SiO2 | 100 | 1.14 | 0.68 | 0.37 | 0.26 | 0.20 | |
| 200 | 2.06 | 0.99 | 0.48 | 0.32 | 0.24 | ||
| 300 | 4.31 | 1.36 | 0.57 | 0.36 | 0.27 | ||
| Maximum differential times | 3.77 | 2.01 | 1.55 | 1.42 | 1.36 | ||
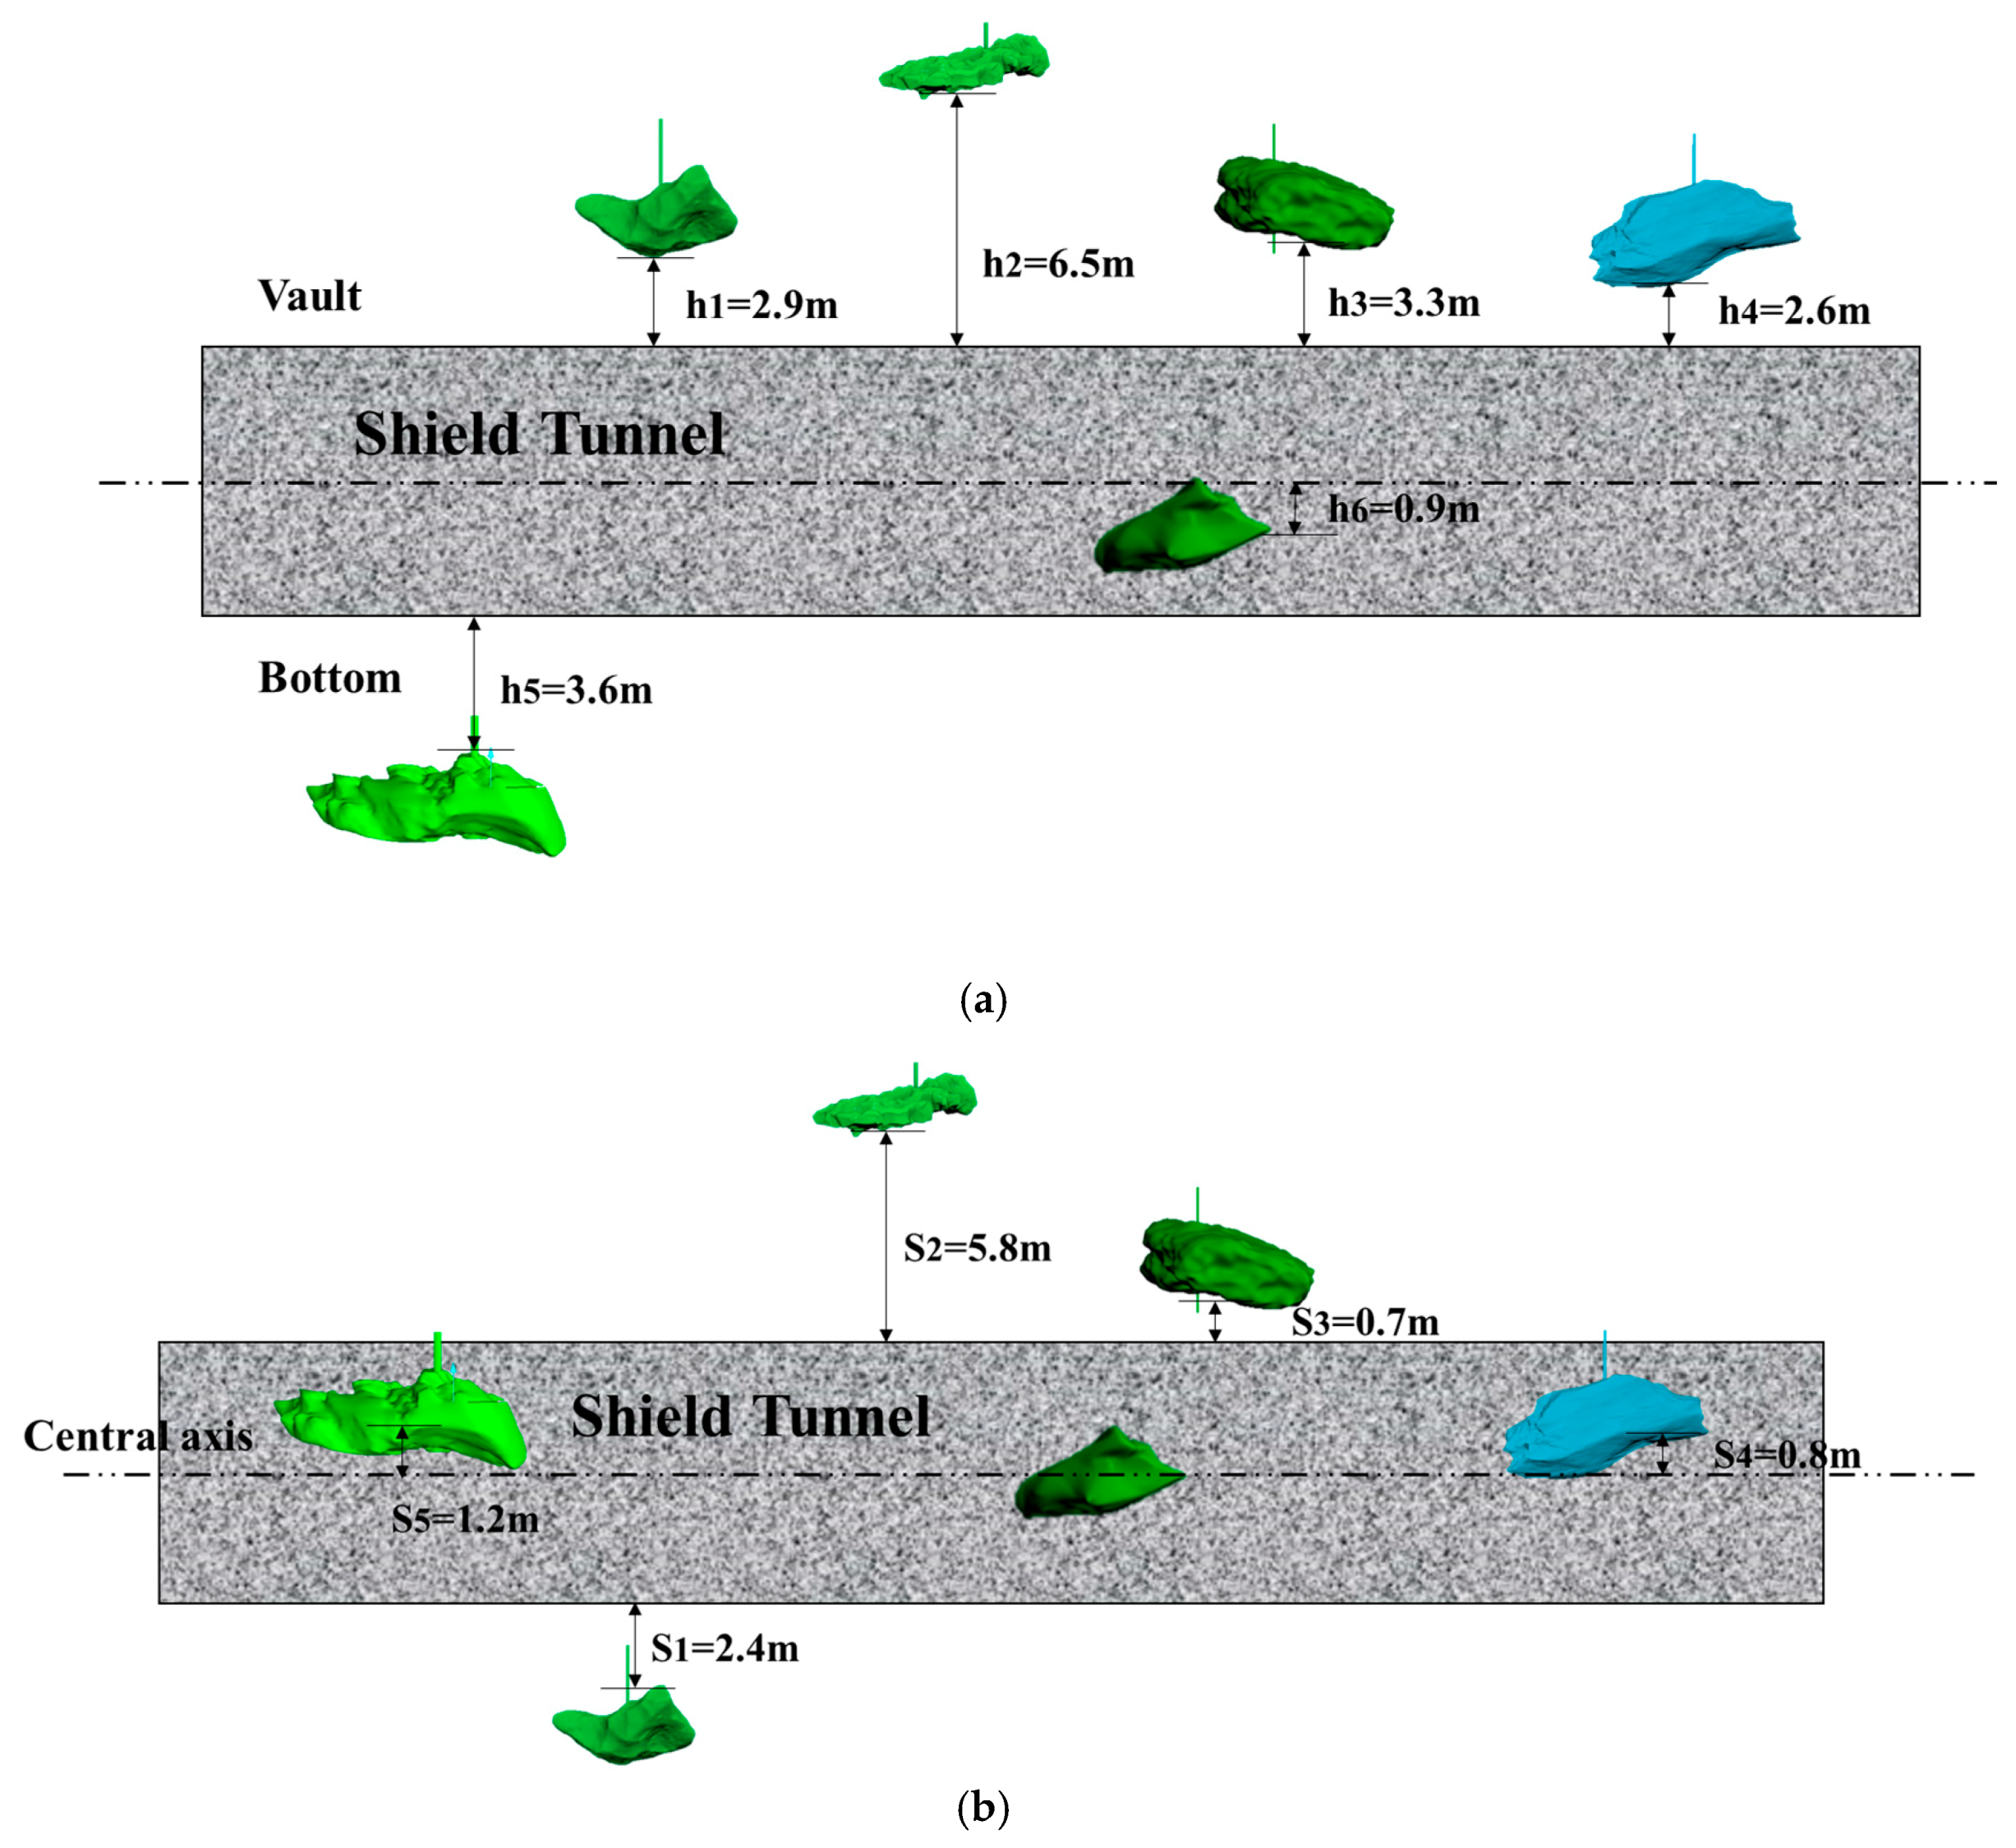
| Karst Cave Number | Orientation (°) | Vertical Distance (m) | Horizontal Distance (m) | Actual Distance (m) | Volume (m3) |
|---|---|---|---|---|---|
| 1 | 317.39 | 2.9 | 2.4 | 5.14 | 3.02 |
| 2 | 42.89 | 6.5 | 5.8 | 10.09 | 3.89 |
| 3 | 31.32 | 3.3 | 0.7 | 4.43 | 3.66 |
| 4 | 7.67 | 2.6 | 0.8 | 2.65 | 3.84 |
| 5 | 170.19 | 3.6 | 1.2 | 3.70 | 3.15 |
| 6 | 90 | 0.9 | 0 | - | 3.71 |
© 2020 by the authors. Licensee MDPI, Basel, Switzerland. This article is an open access article distributed under the terms and conditions of the Creative Commons Attribution (CC BY) license (http://creativecommons.org/licenses/by/4.0/).
Share and Cite
Sun, S.; Li, L.; Wang, J.; Song, S.; He, P.; Fang, Z. Reconstruction and Measurement of Irregular Karst Caves Using BLST along the Shield Metro Line. Appl. Sci. 2020, 10, 392. https://doi.org/10.3390/app10010392
Sun S, Li L, Wang J, Song S, He P, Fang Z. Reconstruction and Measurement of Irregular Karst Caves Using BLST along the Shield Metro Line. Applied Sciences. 2020; 10(1):392. https://doi.org/10.3390/app10010392
Chicago/Turabian StyleSun, Shangqu, Liping Li, Jing Wang, Shuguang Song, Peng He, and Zhongdong Fang. 2020. "Reconstruction and Measurement of Irregular Karst Caves Using BLST along the Shield Metro Line" Applied Sciences 10, no. 1: 392. https://doi.org/10.3390/app10010392