Featured Application
The present work proposes a capable hybrid intelligent approach which can be promisingly used for estimating the compression coefficient of soil in civil and geotechnical engineering projects.
Abstract
Employing league championship optimization (LCA) technique for adjusting the membership function parameters of the adaptive neuro-fuzzy inference system (ANFIS) is the focal objective of the present study. The mentioned optimization is carried out for better estimation of the soil compression coefficient (SCC) using twelve key factors of soil, namely depth of sample, percentage of sand, percentage of loam, percentage of clay, percentage of moisture content, wet density, dry density, void ratio, liquid limit, plastic limit, plastic Index, and liquidity index. This information is widely useable in designing high-rise buildings located in smart cities. Notably, the used data is collocated from a real-world construction project in Vietnam. The hybrid ensemble of LCA-ANFIS is developed, and the best structure is determined by a three-step sensitivity analysis process. The prediction accuracy of the proposed hybrid model is compared with typical ANFIS to examine the efficiency of the combined LCA. Based on the results, applying the LCA algorithm lead to a 4.88% and 6.19% decrease in prediction error, in terms of root mean square error and mean absolute error, respectively. Moreover, the correlation index rose from 0.7351 to 0.7539, which indicates the higher consistency of the hybrid model results. Due to the acceptable accuracy of the proposed LCA-ANFIS model, it can be a promising alternative to common empirical and laboratory methods.
1. Introduction
Determination of physio–mechanical parameters of soil is a significant task for the economical and safe design of civil engineering structures. Soil compression coefficient (SCC) is one of these parameters which reflects the potential of volume decrease in the soil [1]. The importance of this parameter lies in the changes in the structure of soil coming after the mentioned compression [2,3]. More clearly, once a load is applied to saturated soils, pore water pressure is increased, and the soil mass experiences a reduction in volume over time in the presence of drainage. This process leads to soil deposition induced by SCC [4]. Utilizing typical methods comprising soil sampling and implementing field measurement or laboratory tests requires spending a massive cost as well as time and attention. Moreover, temporal and spatial variations in the problem circumstance have made this task more difficult [5,6,7]. Hence, employing indirect SCC measurement methods has been more and more highlighted during the last decades. Artificial intelligence-based techniques are one of the most popular predictive models which have shown high capability in modeling plenty of engineering problems, and especially, geotechnical engineering [8,9]. These models use non-linear relationships to analyze the relationship between target variable(s) and influential factors.
In literature, artificial neural networks (ANNs) have been successfully used for the SCC estimation. Kurnaz, et al. [10], for example, employed an ANN for predicting the compression and recompression indices using basic soil properties of initial void ratio, the natural water content, plasticity index, and liquid limit. It was found that this model can satisfactorily predict the compression index. However, the recompression results were not as accurate as of that. As an alternative to empirical formulas for calculating the soil compression index, Park and Lee [11] used ANN for soil information on sites over the Republic of Korea. Their study proved the higher reliability of ANN compared to empirical techniques. Similarly, other data mining techniques like genetic expression programming and adaptive neuro-fuzzy inference system (ANFIS) have outperformed existing empirical formulas [12,13,14]. Namdarvand, et al. [5] demonstrated the higher effectiveness of ANN (correlation = 0.63) in comparison with regression method (correlation = 0.47). In some studies, scholars have conducted comparison between machine learning methods. The accuracy of three well-known intelligent approaches, namely minimax probability machine regression, genetic programming regression, and multivariate adaptive regression splines (MARS) was evaluated by Nhu, et al. [15]. Considering the applied accuracy criteria, it was shown that the MARS is a reliable predictive model for simulating the SCC. Likewise, the efficiency of three common predictive models of support vector machine (SVM), ANN, and ANFIS was explored along with Monte Carlo sensitivity analysis method by Pham, et al. [16]. Notably, the applied Monte Carlo method revealed the higher contribution of four input parameters namely clay, degree of saturation, specific gravity and depth of sample. Eventually, they concluded that the SVM performs more efficiently than two other colleagues.
More recently, hybrid swarm science has been broadly used in various geotechnical engineering issues (e.g., landslide modeling) for prevailing the computational shortcomings of regular data mining techniques [8,17]. For the purpose of SCC estimation, multi-gene genetic programming was used by Mohammadzadeh, et al. [18] for compression index modeling of fine-grained soil. The results of the proposed technique found to be more promising than traditional models. In another application of hybrid algorithms by Bui, et al. [19], particle swarm optimization (PSO) was synthesized with ANN to forecast the SCC of an urban project in Vietnam. Referring to the correlation criteria of 0.884 and 0.862 respectively for the testing phase, it was shown that the PSO is capable enough to improve the performance of ANN. As is seen, hybrid science has not sufficiently served in this field, and also, previous studies have mainly employed common optimization techniques like the GA and PSO for ANNs. Hence, in this paper, we introduced a new hybrid of ANFIS, namely, league championship optimization (LCA) used for estimating the SCC from a real-world project data. More specifically, the main contribution of the LCA algorithm lies in the adjustment of ANFIS membership function parameters. The results of both typical and reinforced ANFISs are evaluated to examine the effect of the applied hybridization.
2. Methodology
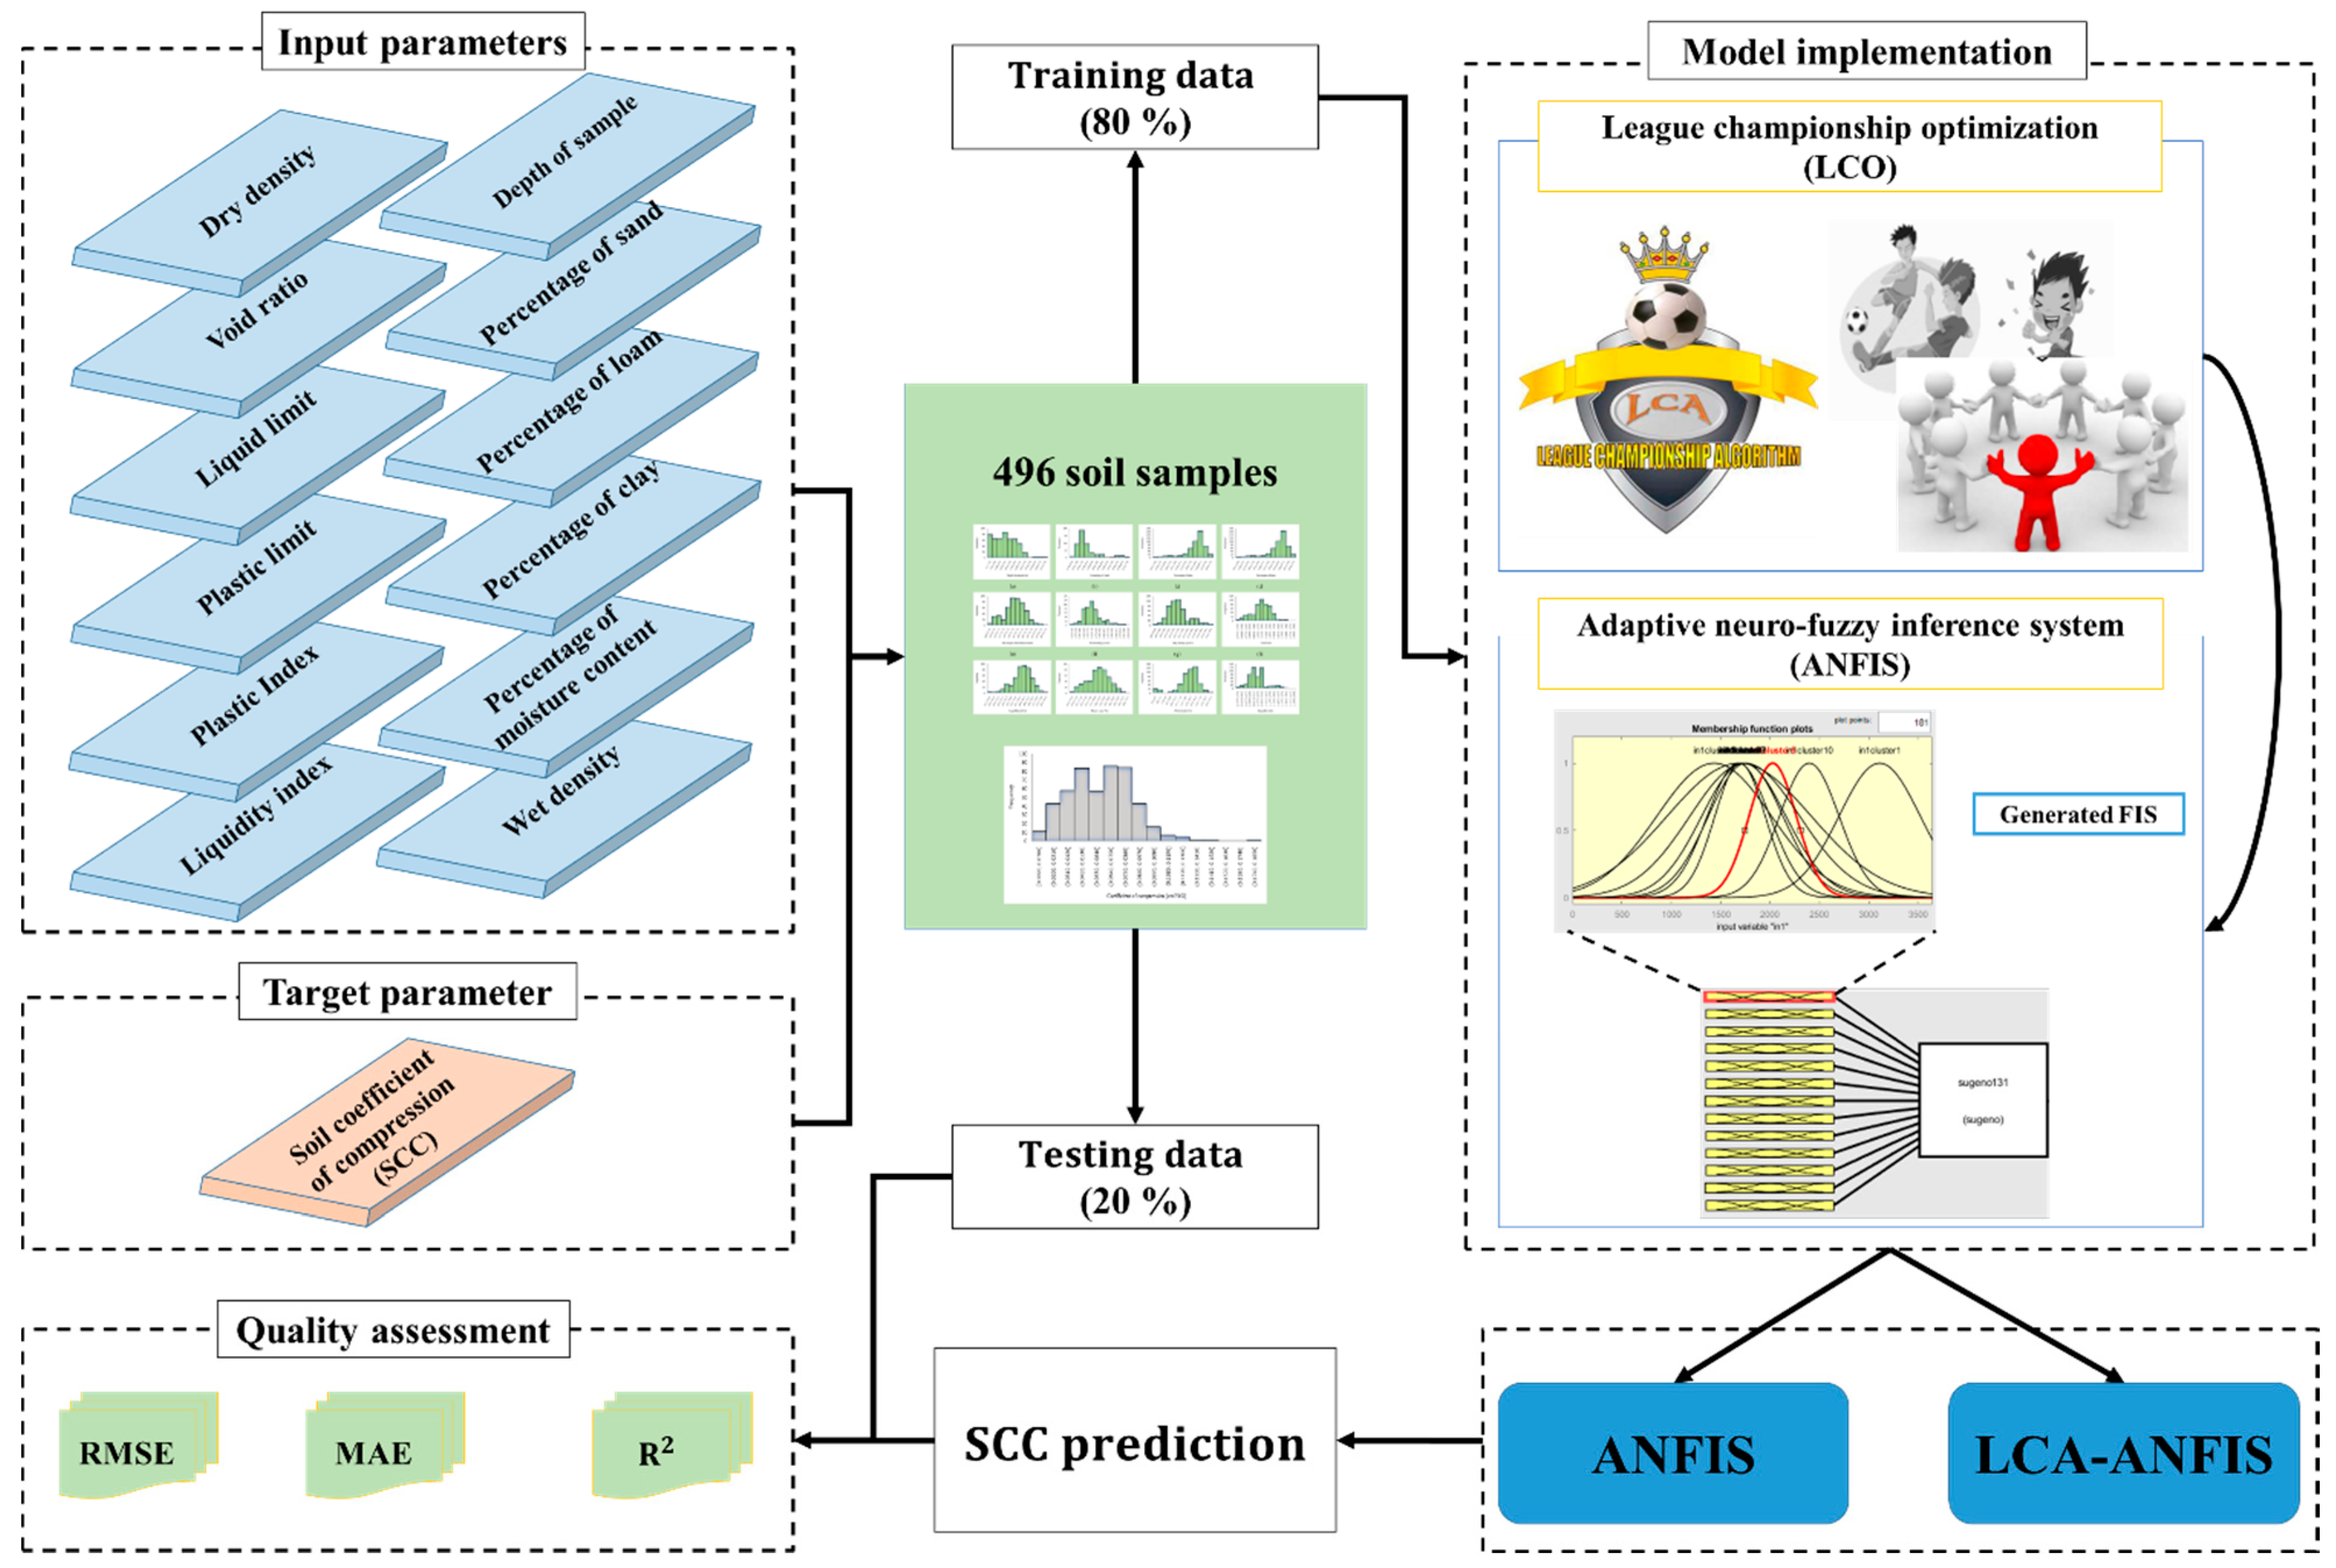
Figure 1 depicts an overall view of the steps carried out to meet the purpose of the current study. Each task is detailed in the next sections. Three well-known accuracy criteria used for evaluating the quality of the performance of the models are the root mean square error (RMSE), mean absolute error (MAE), and the coefficient of determination (R2) which are expressed as follows:
where Y and Y symbolize the predicted and observed SCCs, respectively. Also, observed is the average of the observed SCCs, and N denotes the number of samples.
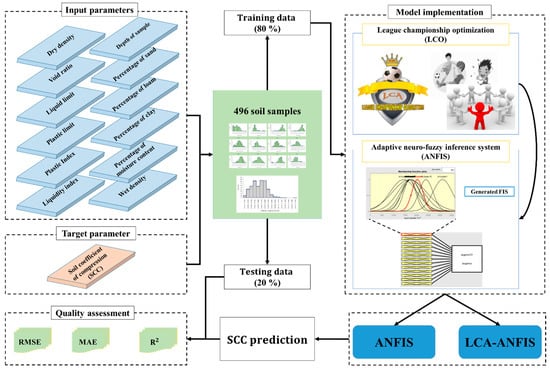
Figure 1.
The steps taken for soil compression coefficient (SCC) simulation in this study.
2.1. The Adaptive Neuro-fuzzy Inference System
The name ANFIS indicates an ANN-based hybrid of fuzzy logic which is inspired by decision-making in our life. This model was first proposed by Jang [20]. As an efficient intelligent model, ANFIS has shown good robustness in solving non-linear problems [21]. However, it might not yield preferable results in strange circumstances [22]. As mentioned it is an integration of both ANN (based on back-propagation gradient descent and least-squares learning methods) and FIS capturing the advantages of both of them [23,24,25,26]. As a result, ANFIS has outperformed unreinforced FIS for non-linear issues [27]. Up to now, many scholars have satisfactorily used this tool for various scientific aims [28,29,30].
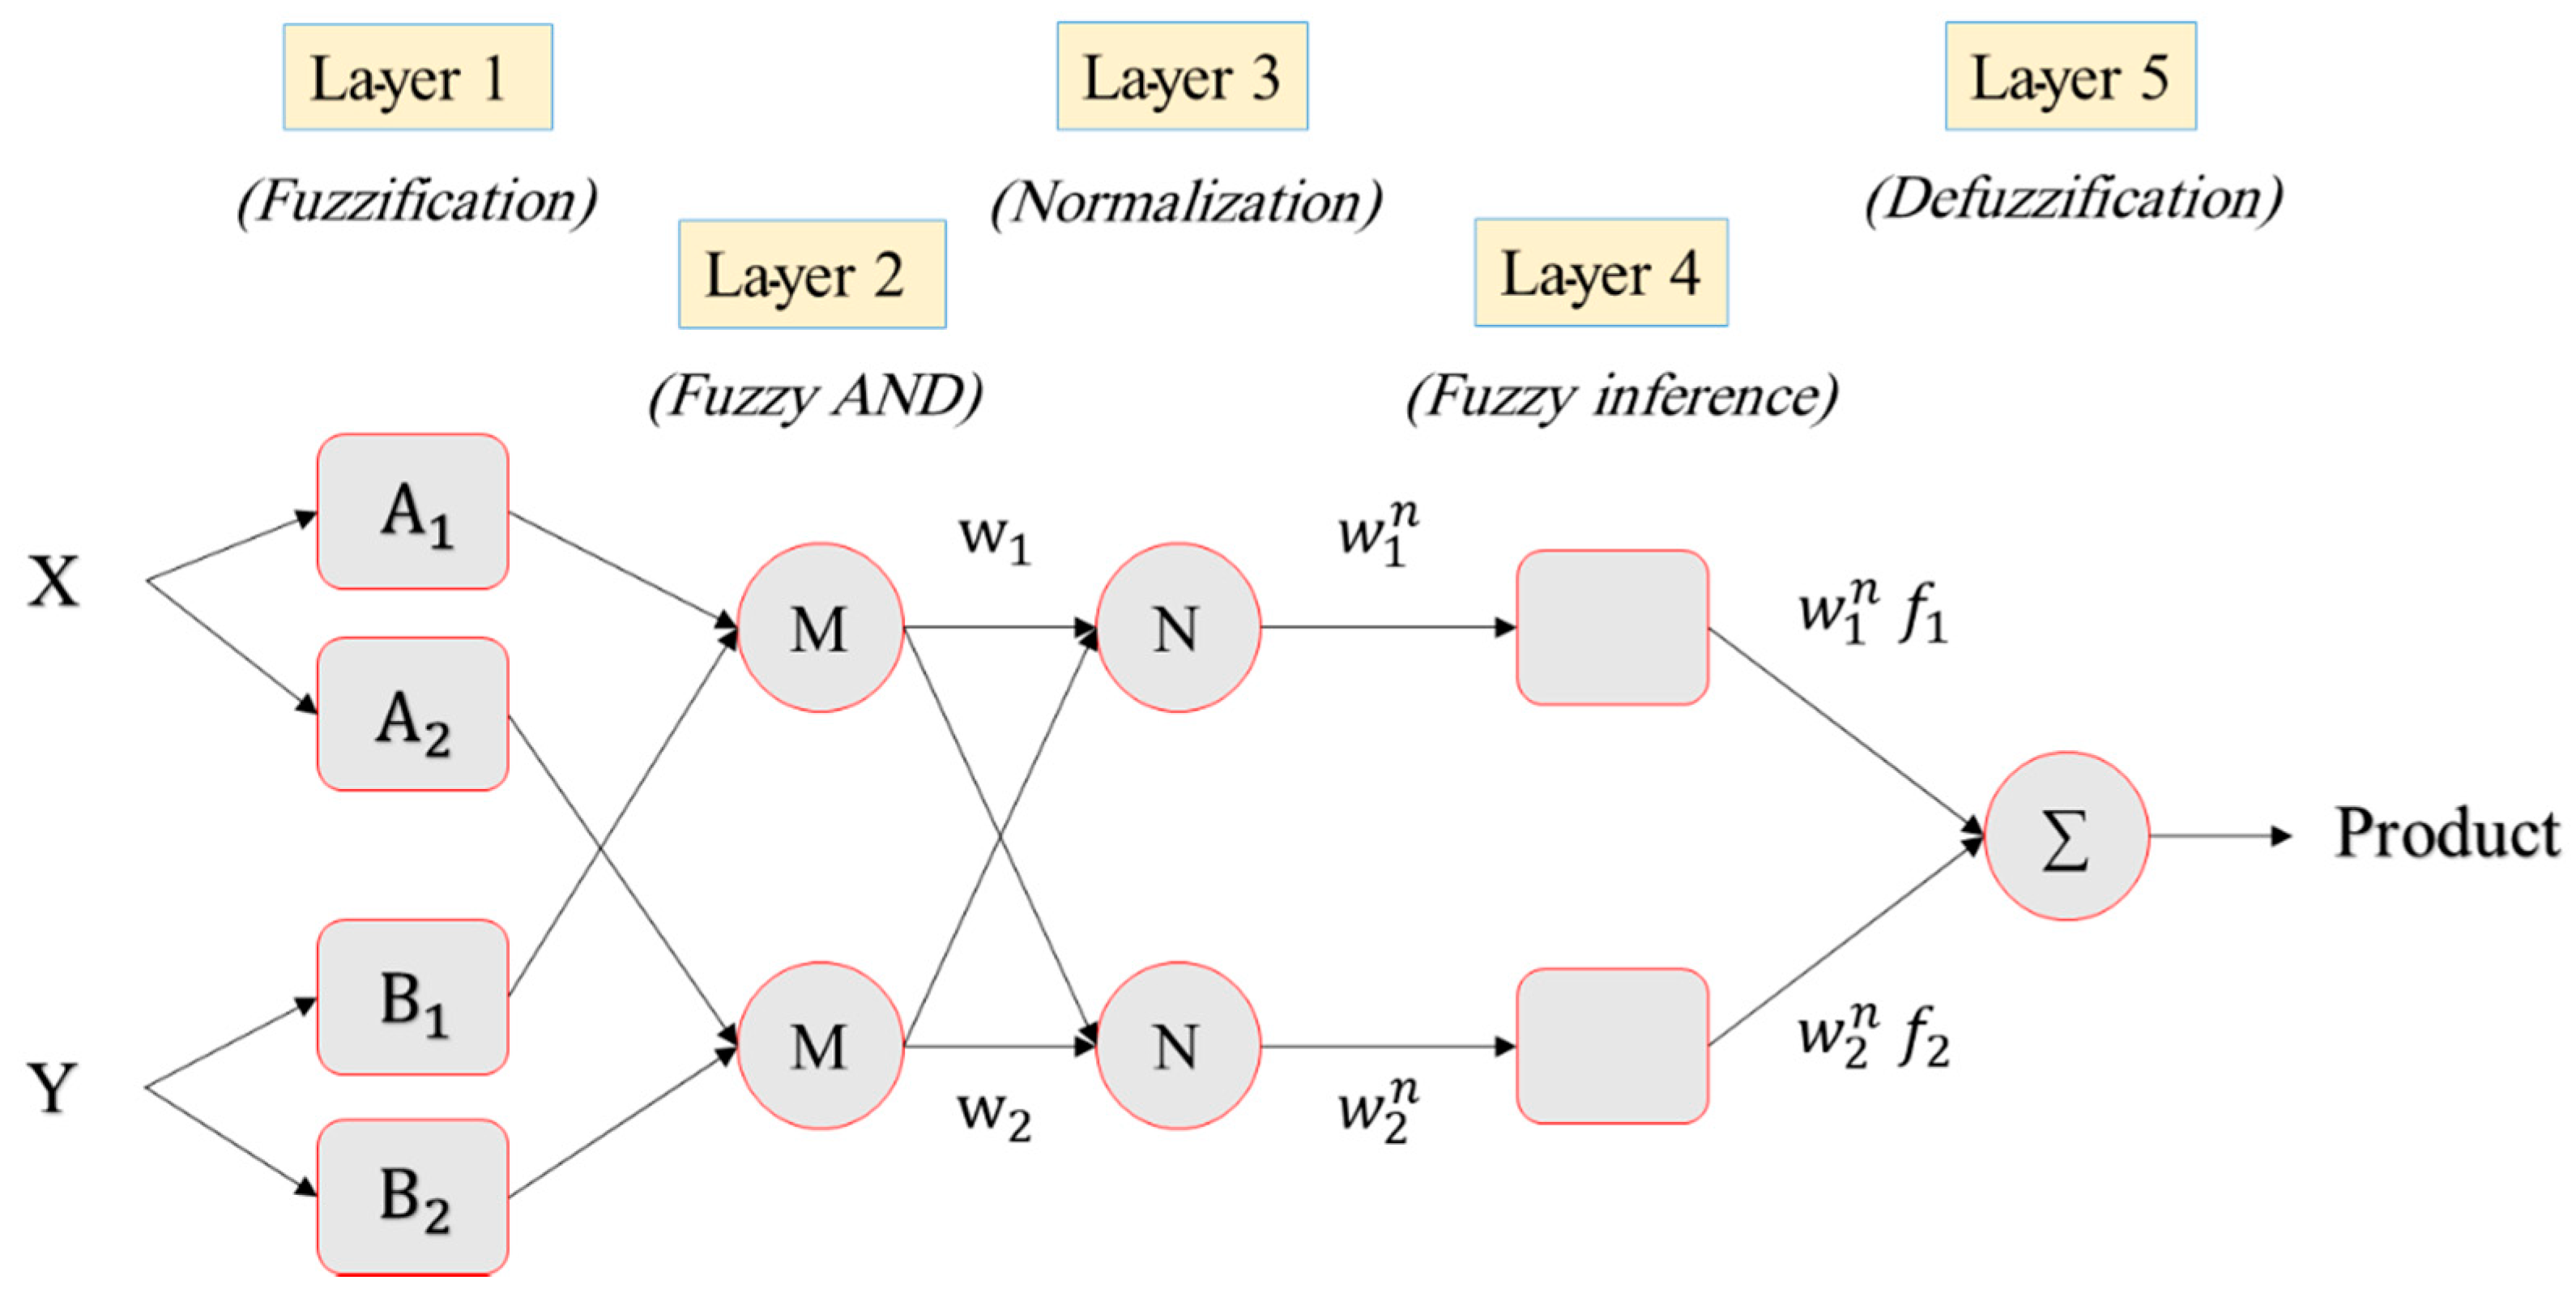
Among various fuzzy inference methods, Mamdani, Takagi–Sugeno, and Tsukamoto fuzzy are three notable ones that are commonly used to develop an ANFIS [31]. Figure 2 shows the structure of a Takagi–Sugeno FIS consisting of two inputs flowing within five layers. The membership function (MF) values of each input variable are calculated in the first layer nodes:
where F and G are the linguistic variables, and represent the MFs, and x and y are the inputs. Based on Equations (6) and (7), the nodes in the two following layers calculate and normalize the rule firing strength:
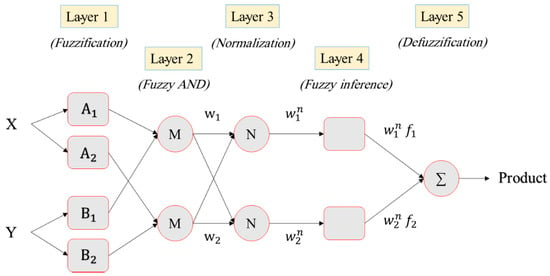
Figure 2.
Five-layered adaptive neuro-fuzzy inference system (ANFIS) structure.
In the fourth layer, a node function associates each node when ji, ki, and li denote the result parameters:
Finally, the network gives the response as the summation of the signals received from previous layers:
2.2. League Championship Optimization
Inspired by sporting competitions in sports leagues, Kashan [32] introduced LCA algorithm as a new evolutionary algorithm attempting to find the optimum solution of problems over a continuous search space. The initial population of the algorithm (league) consists of a group of L solutions which are randomly created. Each one of the solutions attributes to a team indicating the team’s current formation. In this algorithm, the fitness value is represented as the “playing strength” associated with the corresponding team formation. Due to the greedy selection of the LCA, the present formation is aimed to be replaced by a more potent one [33].
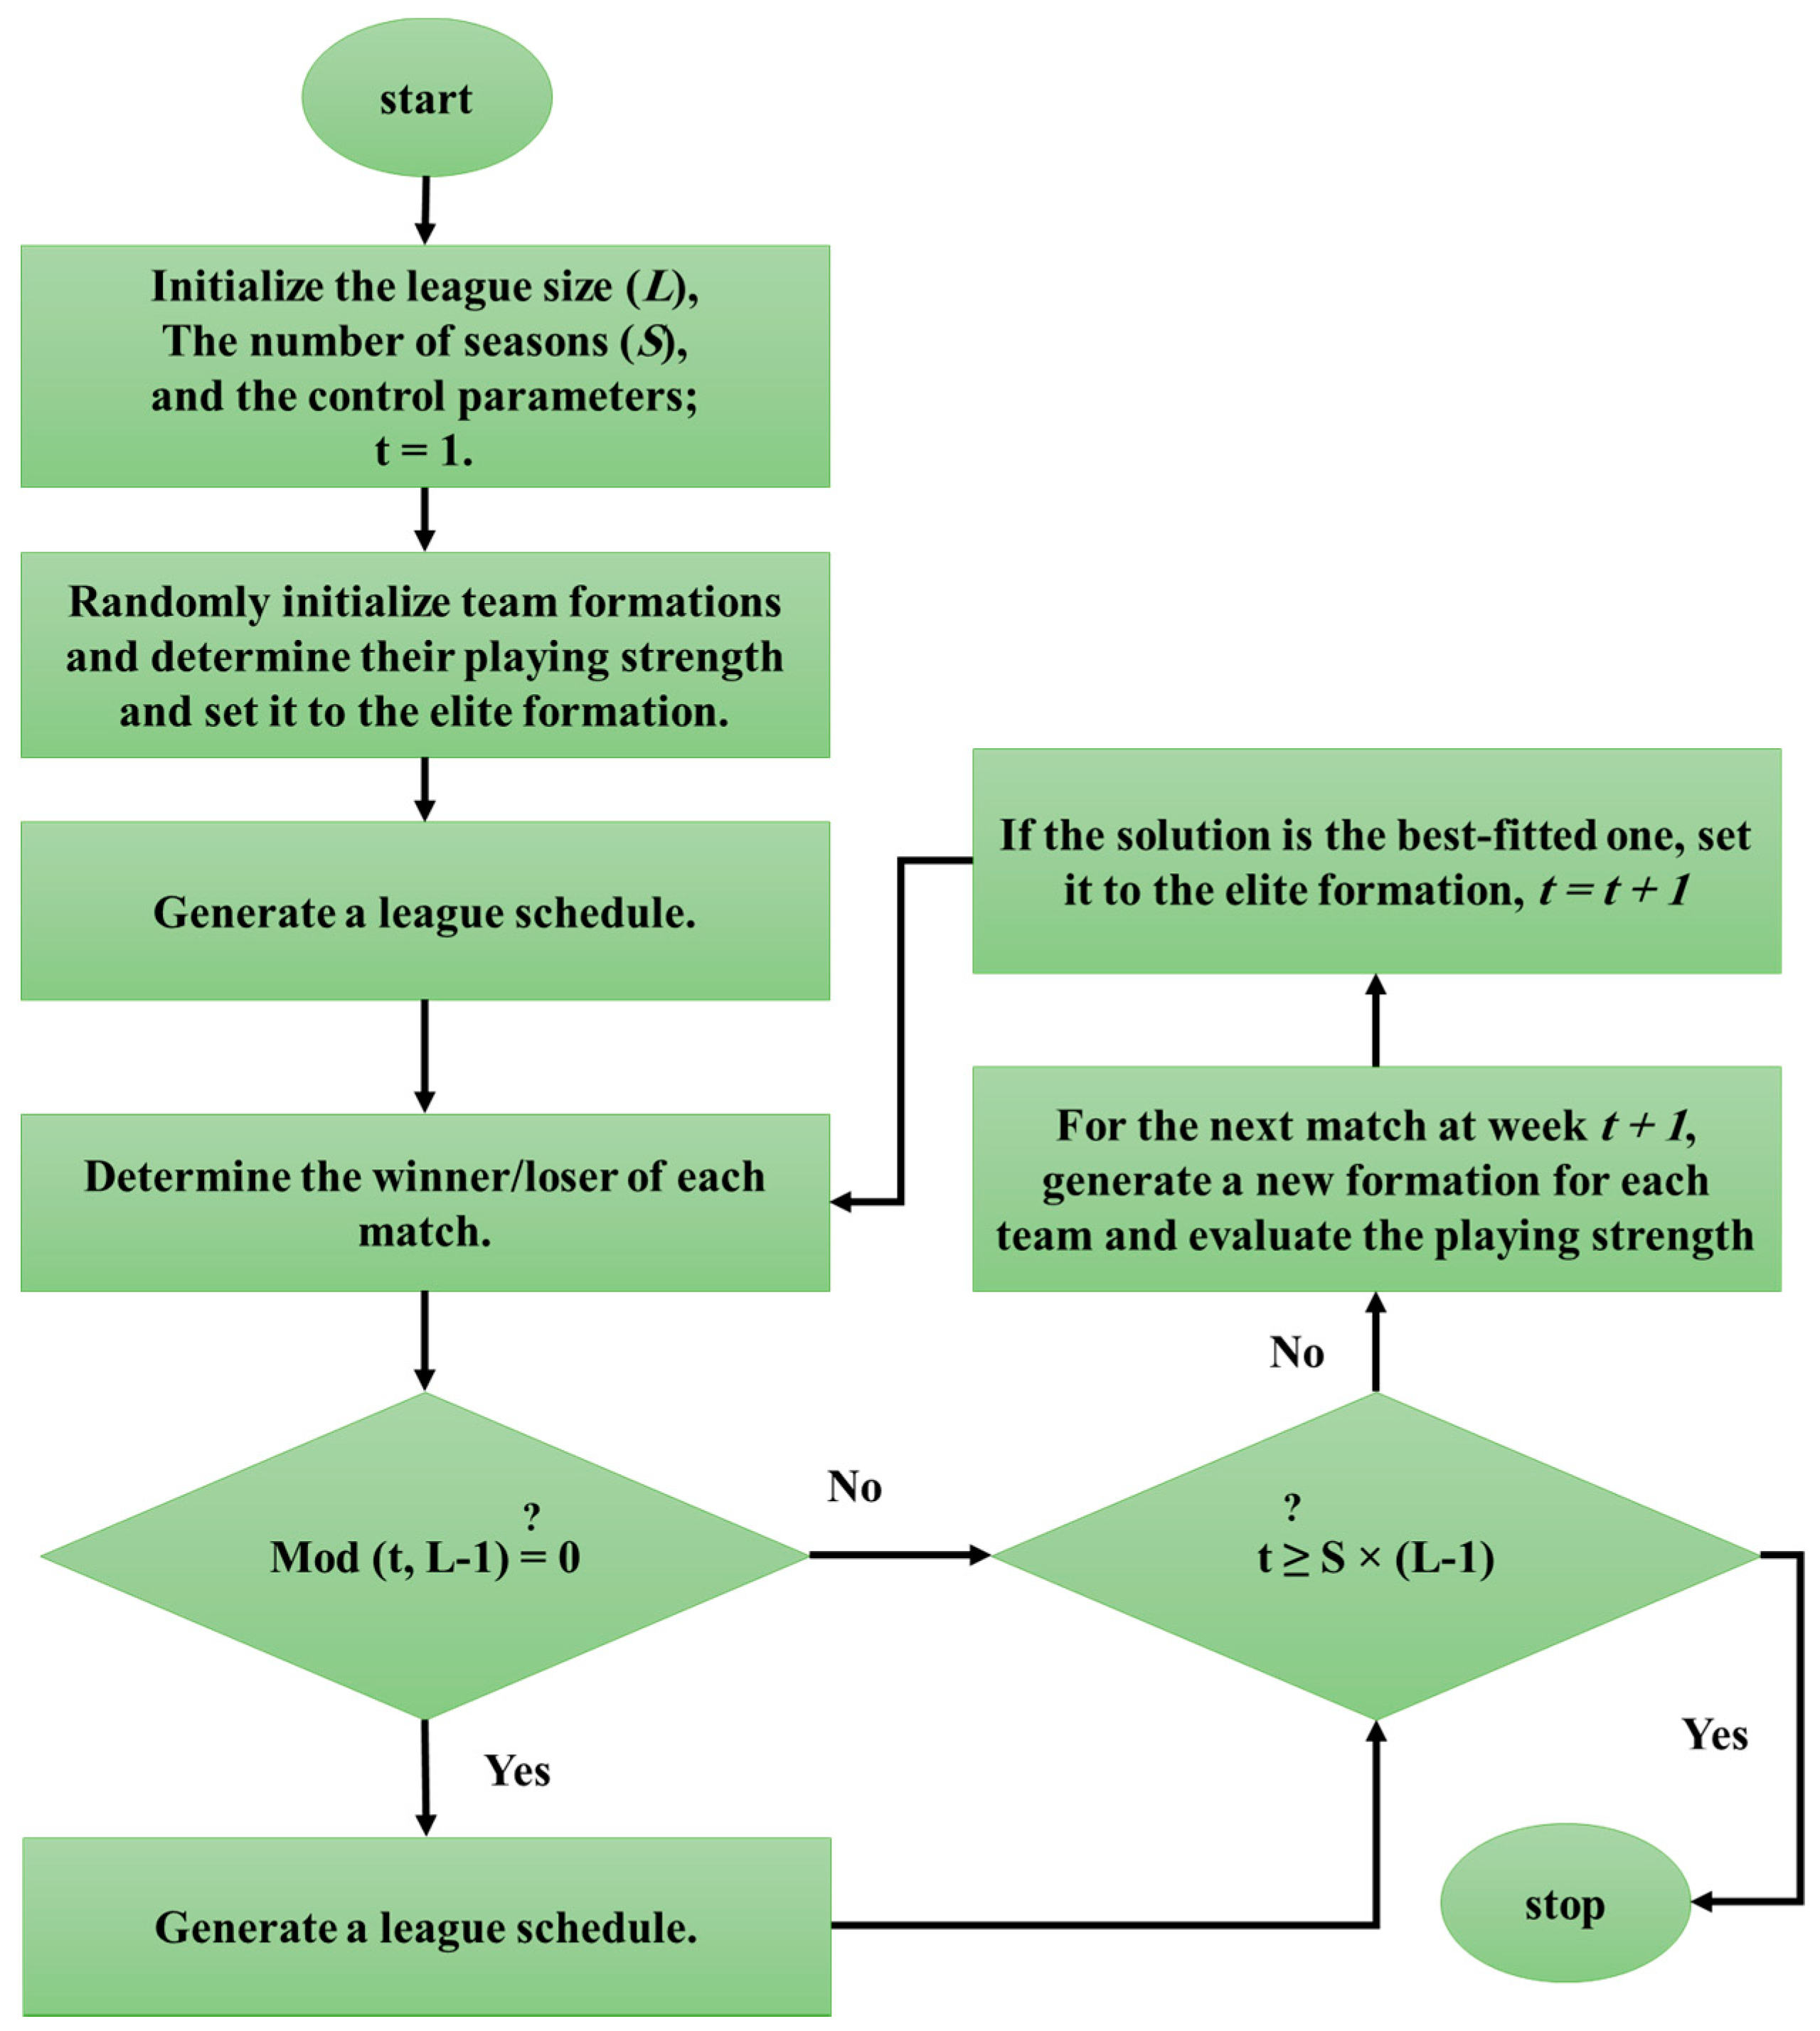
The number of seasons (S) is a termination factor comprising L-1 weeks (repetitions) which yields S × (L-1) contest weeks (Note that L is an even value). Considering the league schedule in every week, the existing teams play in pairs. Based on the formation of the team, the team’s playing strength determines the outcome of the match. Each team aims to update its formation during the recovery time when it is tracking the events of the previous events [34]. The flowchart of the LCA is schematically presented in Figure 3.
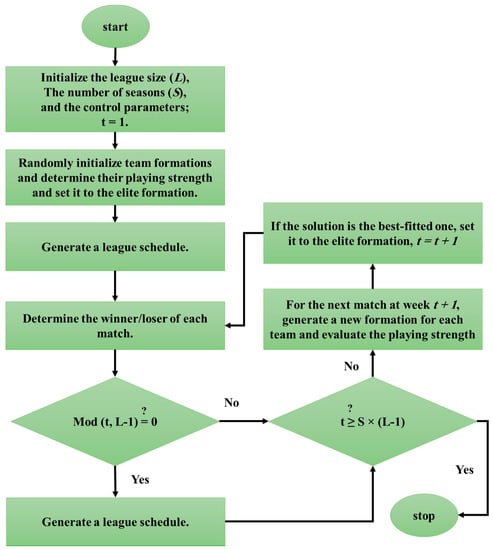
Figure 3.
The flowchart of the league championship optimization (LCA) technique.
Some examples of the governing rules of the LCA are the more the value of playing strength is, the more likelihood of winning the game, the outcome of a match cannot be predicted, and also, it only could represent the win or lose. Based on Figure 3, a brief explanation of the main modules is presented below:
2.2.1. League Schedule Development
A nonrandom order is generated for a season to enable teams to have a match against each other. The LCA also does this task by making a single round-robin program in which only one match is held between two teams during a season. Consequently, when L teams are involved, L (L−1)/2 games are required. Figure 4 shows an example of a single round-robin scheduling algorithm. As is seen, it contains eight teams where in week 1, the match is between teams 1 and 8, teams 2 and 7, and so on. In the next week, the position of team 1 is fixed and other teams rotate clockwise. This process is repeated for the next weeks until the initial status is met. Remarkably, a dummy team is considered when L is odd so that it donates rest to its opponent team. This process is also carried out for all S seasons.

Figure 4.
League scheduling algorithm.
2.2.2. Winner/Loser Determination
Based on the idealized rule 1 (the higher playing strength of a team, the higher likelihood of its winning [33]), and assuming and as the formations, and also and as the playing strengths of the teams i and j, respectively, then we can write:
where is the chance of team j to its opponent at week t ( can be defined accordingly) and f [X = (, , …, )] is a D variable function aimed to be minimized over the space.
The above formula denotes that the likelihood of a win for the team j (or i) is proportional to the difference between (or ) and the ideal strength of an ideal team. In this relationship, it is assumed that a better team can comply with more factors of the ideal team. Here, the distances from a common reference point are the basis for evaluating the teams. Hence, the ratio of these distances gives the winning portion for each team.
Considering the idealized rule 3 (The probability that team i beats team j is assumed to be equal from the viewpoint of both teams [33]) we have:
From Equations (10) and (11), can be obtained as follows:
A number (from 0 to 1) is then randomly generated and compared with to determine the winning/losing team. Accordingly, team i wins the game if is greater than or equal to this number, otherwise vice versa. More information about the LCA can be found in previous publications [33,35].
3. Data Collection and Statistical Analysis
By doing an extensive field survey in a real-world project in the Hai Phong city of Vietnam, namely Vinhomes Imperia housing, various information of soil was gathered [9]. The construction area was around 79 ha. The geological situation of the site was investigated by drilling 31 boreholes. Notably, the laboratory tests, as well as the geological survey, were carried out with respect to the Vietnam Standards of the TCVN9155:2012 and TCVN 9140:2012, considered for technical requirements for drilling machines and sample preservation, respectively. More details about the data provision process and the studied site are presented in ref. [9].
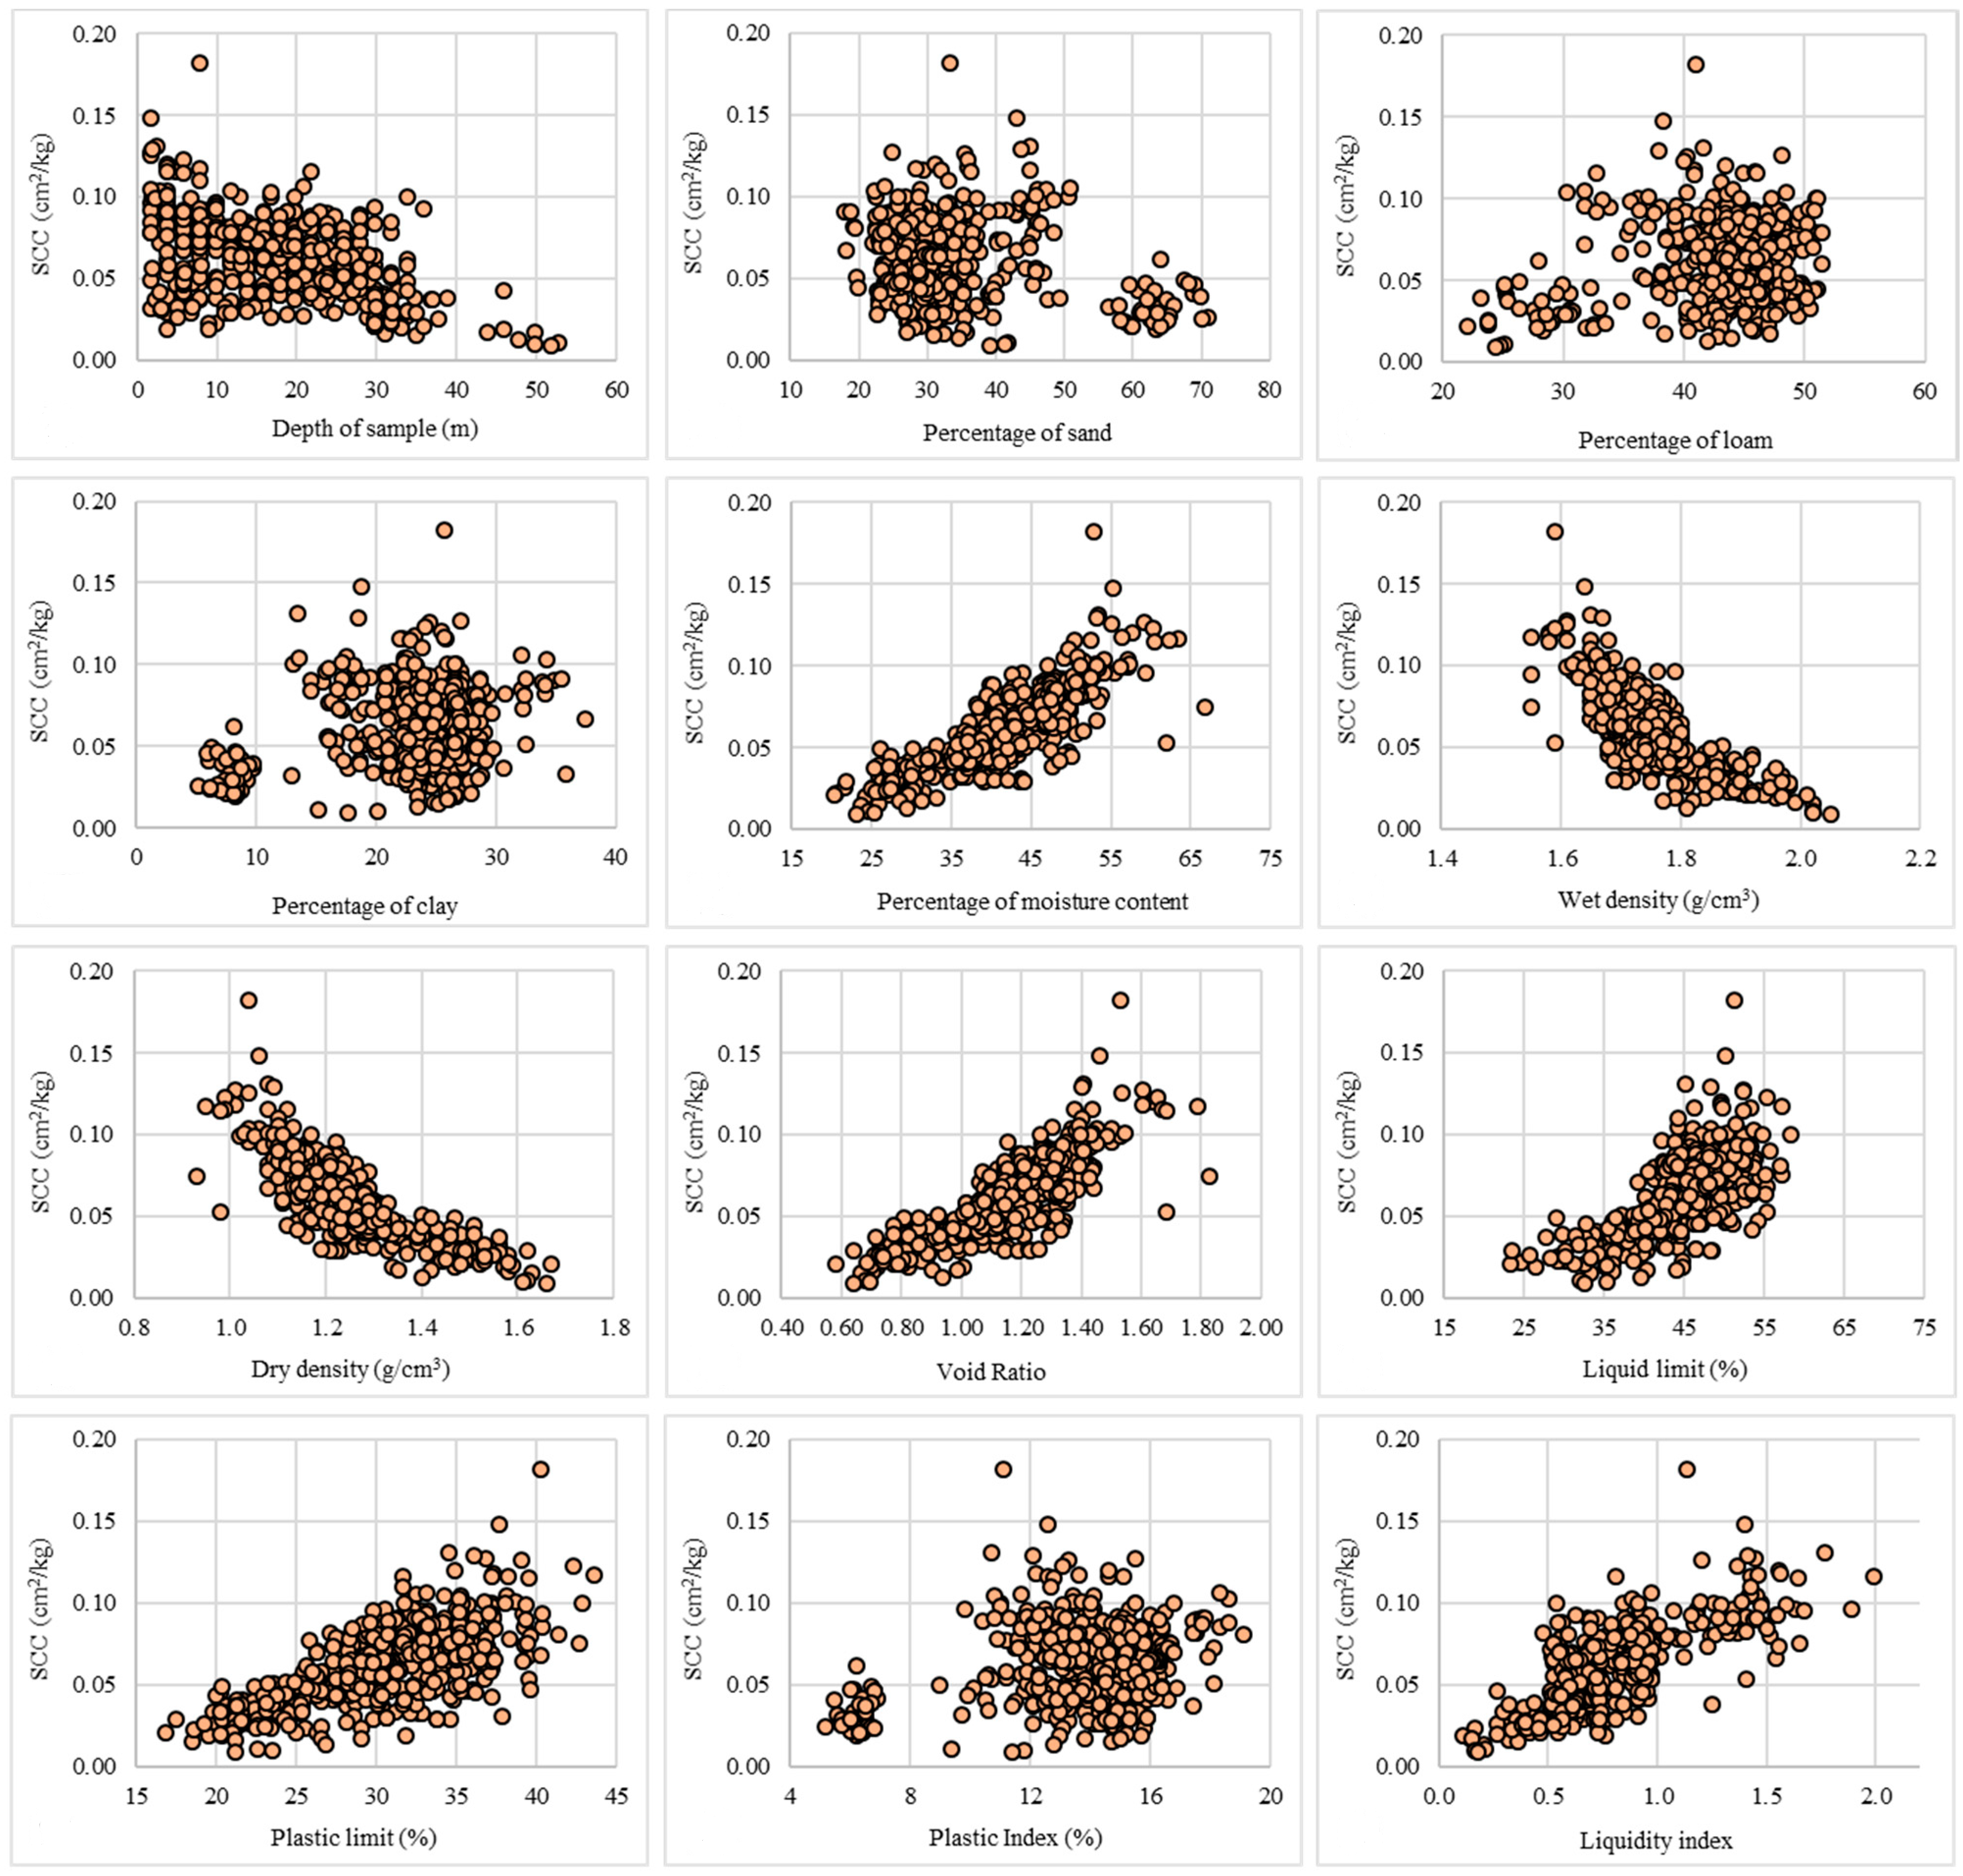
Eventually, the coefficient of compression is considered as the target variable affected by twelve key factors of soil, including depth of sample (DOP), percentage of sand, percentage of loam, percentage of clay, percentage of moisture content (MC), wet density (WD), dry density (DD), void ratio (VR), liquid limit (LL), plastic limit (PL), plastic Index (PI), and liquidity index (LI) as independent variables. Figure 5 depicts the SCC versus the mentioned factors. Moreover, descriptive statistics are available in Table 1.
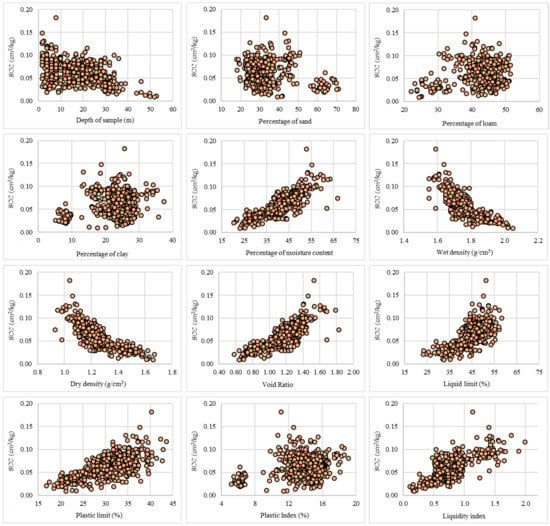
Figure 5.
Distribution of the SCC versus soil parameters.

Table 1.
Descriptive statistics of the used dataset.
Consisting of 496 samples, the whole dataset is divided into two parts by a random selection procedure. The proposed AI tools were fed with 80% of data (i.e., 397 instances) to analyze the relationship between the mentioned parameters. Then, the generalization power was evaluated by applying them to the remaining 20% of data (i.e., 99 instances). In other words, the input parameters of the second dataset were considered as stranger soil conditions with which the networks predicted the SCC for them.
4. Results and Discussion
This paper evaluates the application of the league championship optimization for hybridizing ANFIS in order to enhance its prediction capability. The results are presented in this part of the study. Firstly, the optimization procedure is explained and second, the accuracy enhancement is evaluated by comparing the results of the improved and typical ANFIS.
4.1. Hybridizing ANFIS Using the LCA Technique
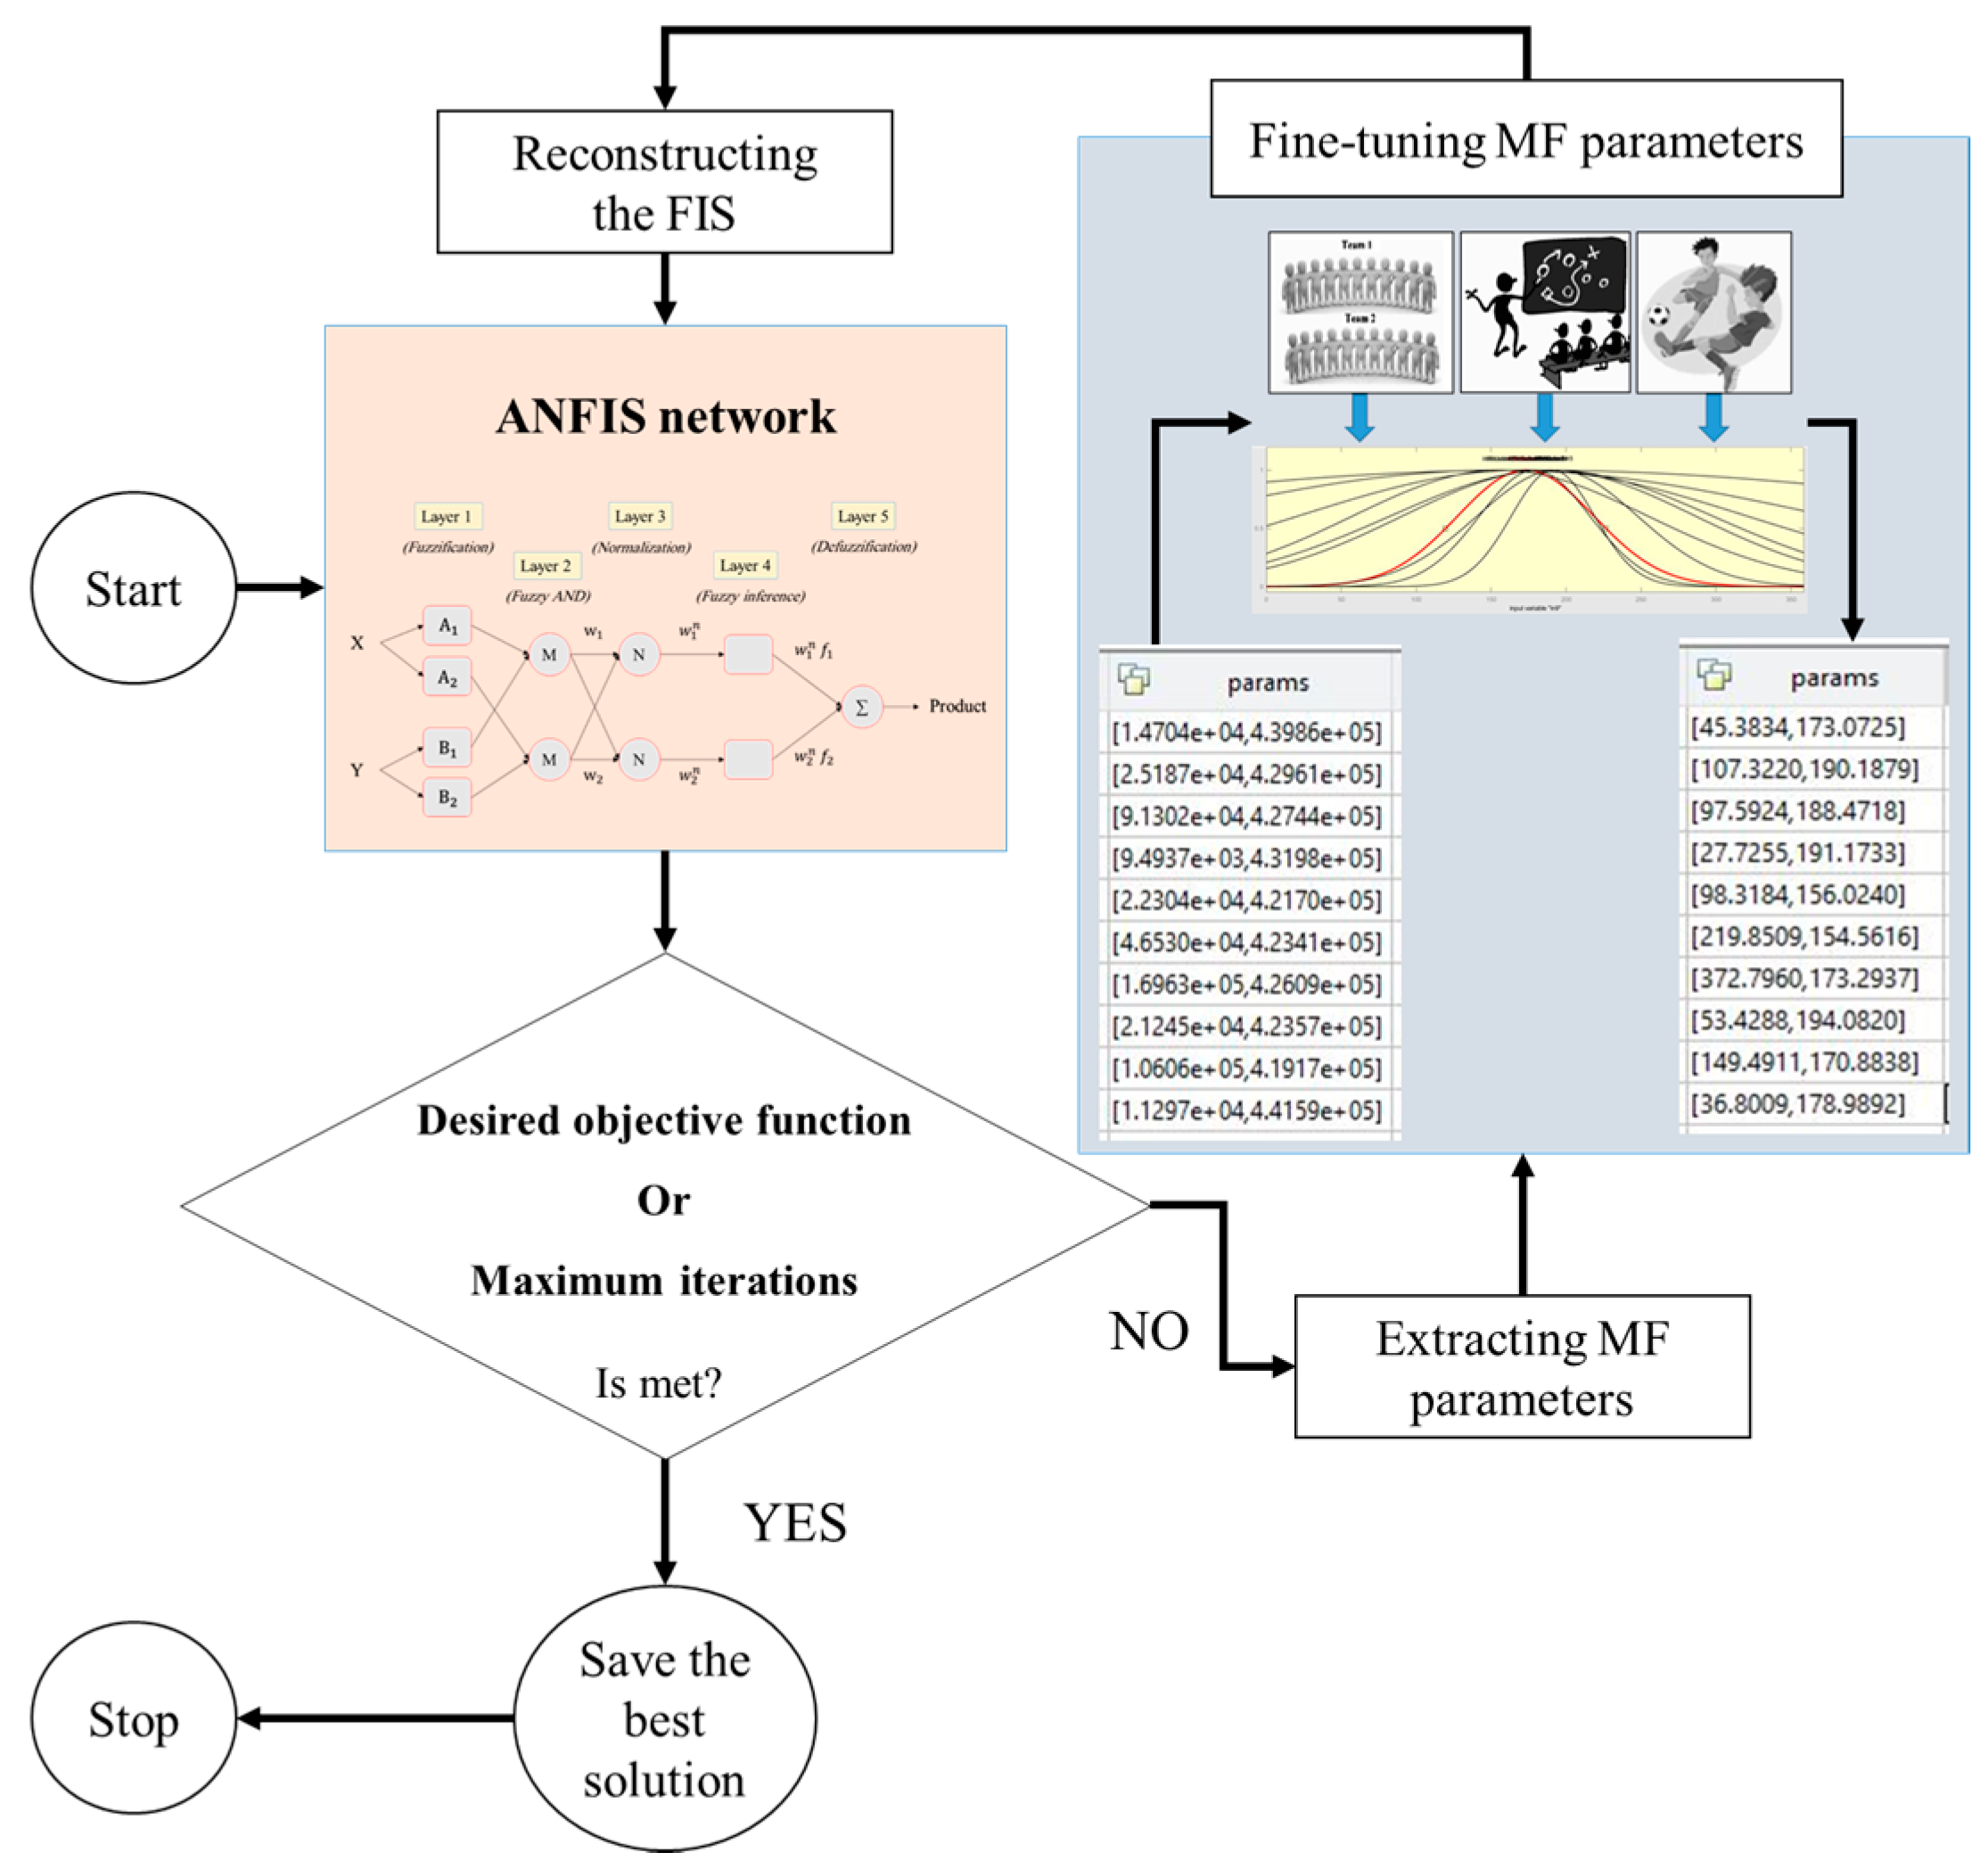
Utilizing the programming language of MATLAB 2014 (MathWorks, Natick, Massachusetts, USA), the LCA algorithm was coupled with ANFIS. Here, the main role of the metaheuristic algorithms is to adjust the parameters of the MFs [36]. This process is depicted in Figure 6. The FIS is reconstructed each time using new parameters. Note that, Gaussian membership function was used for ANFIS.
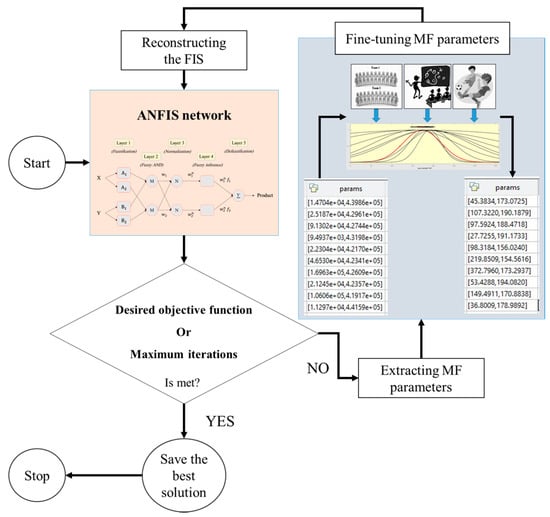
Figure 6.
A graphical view of ANFIS optimization using the LCA technique.
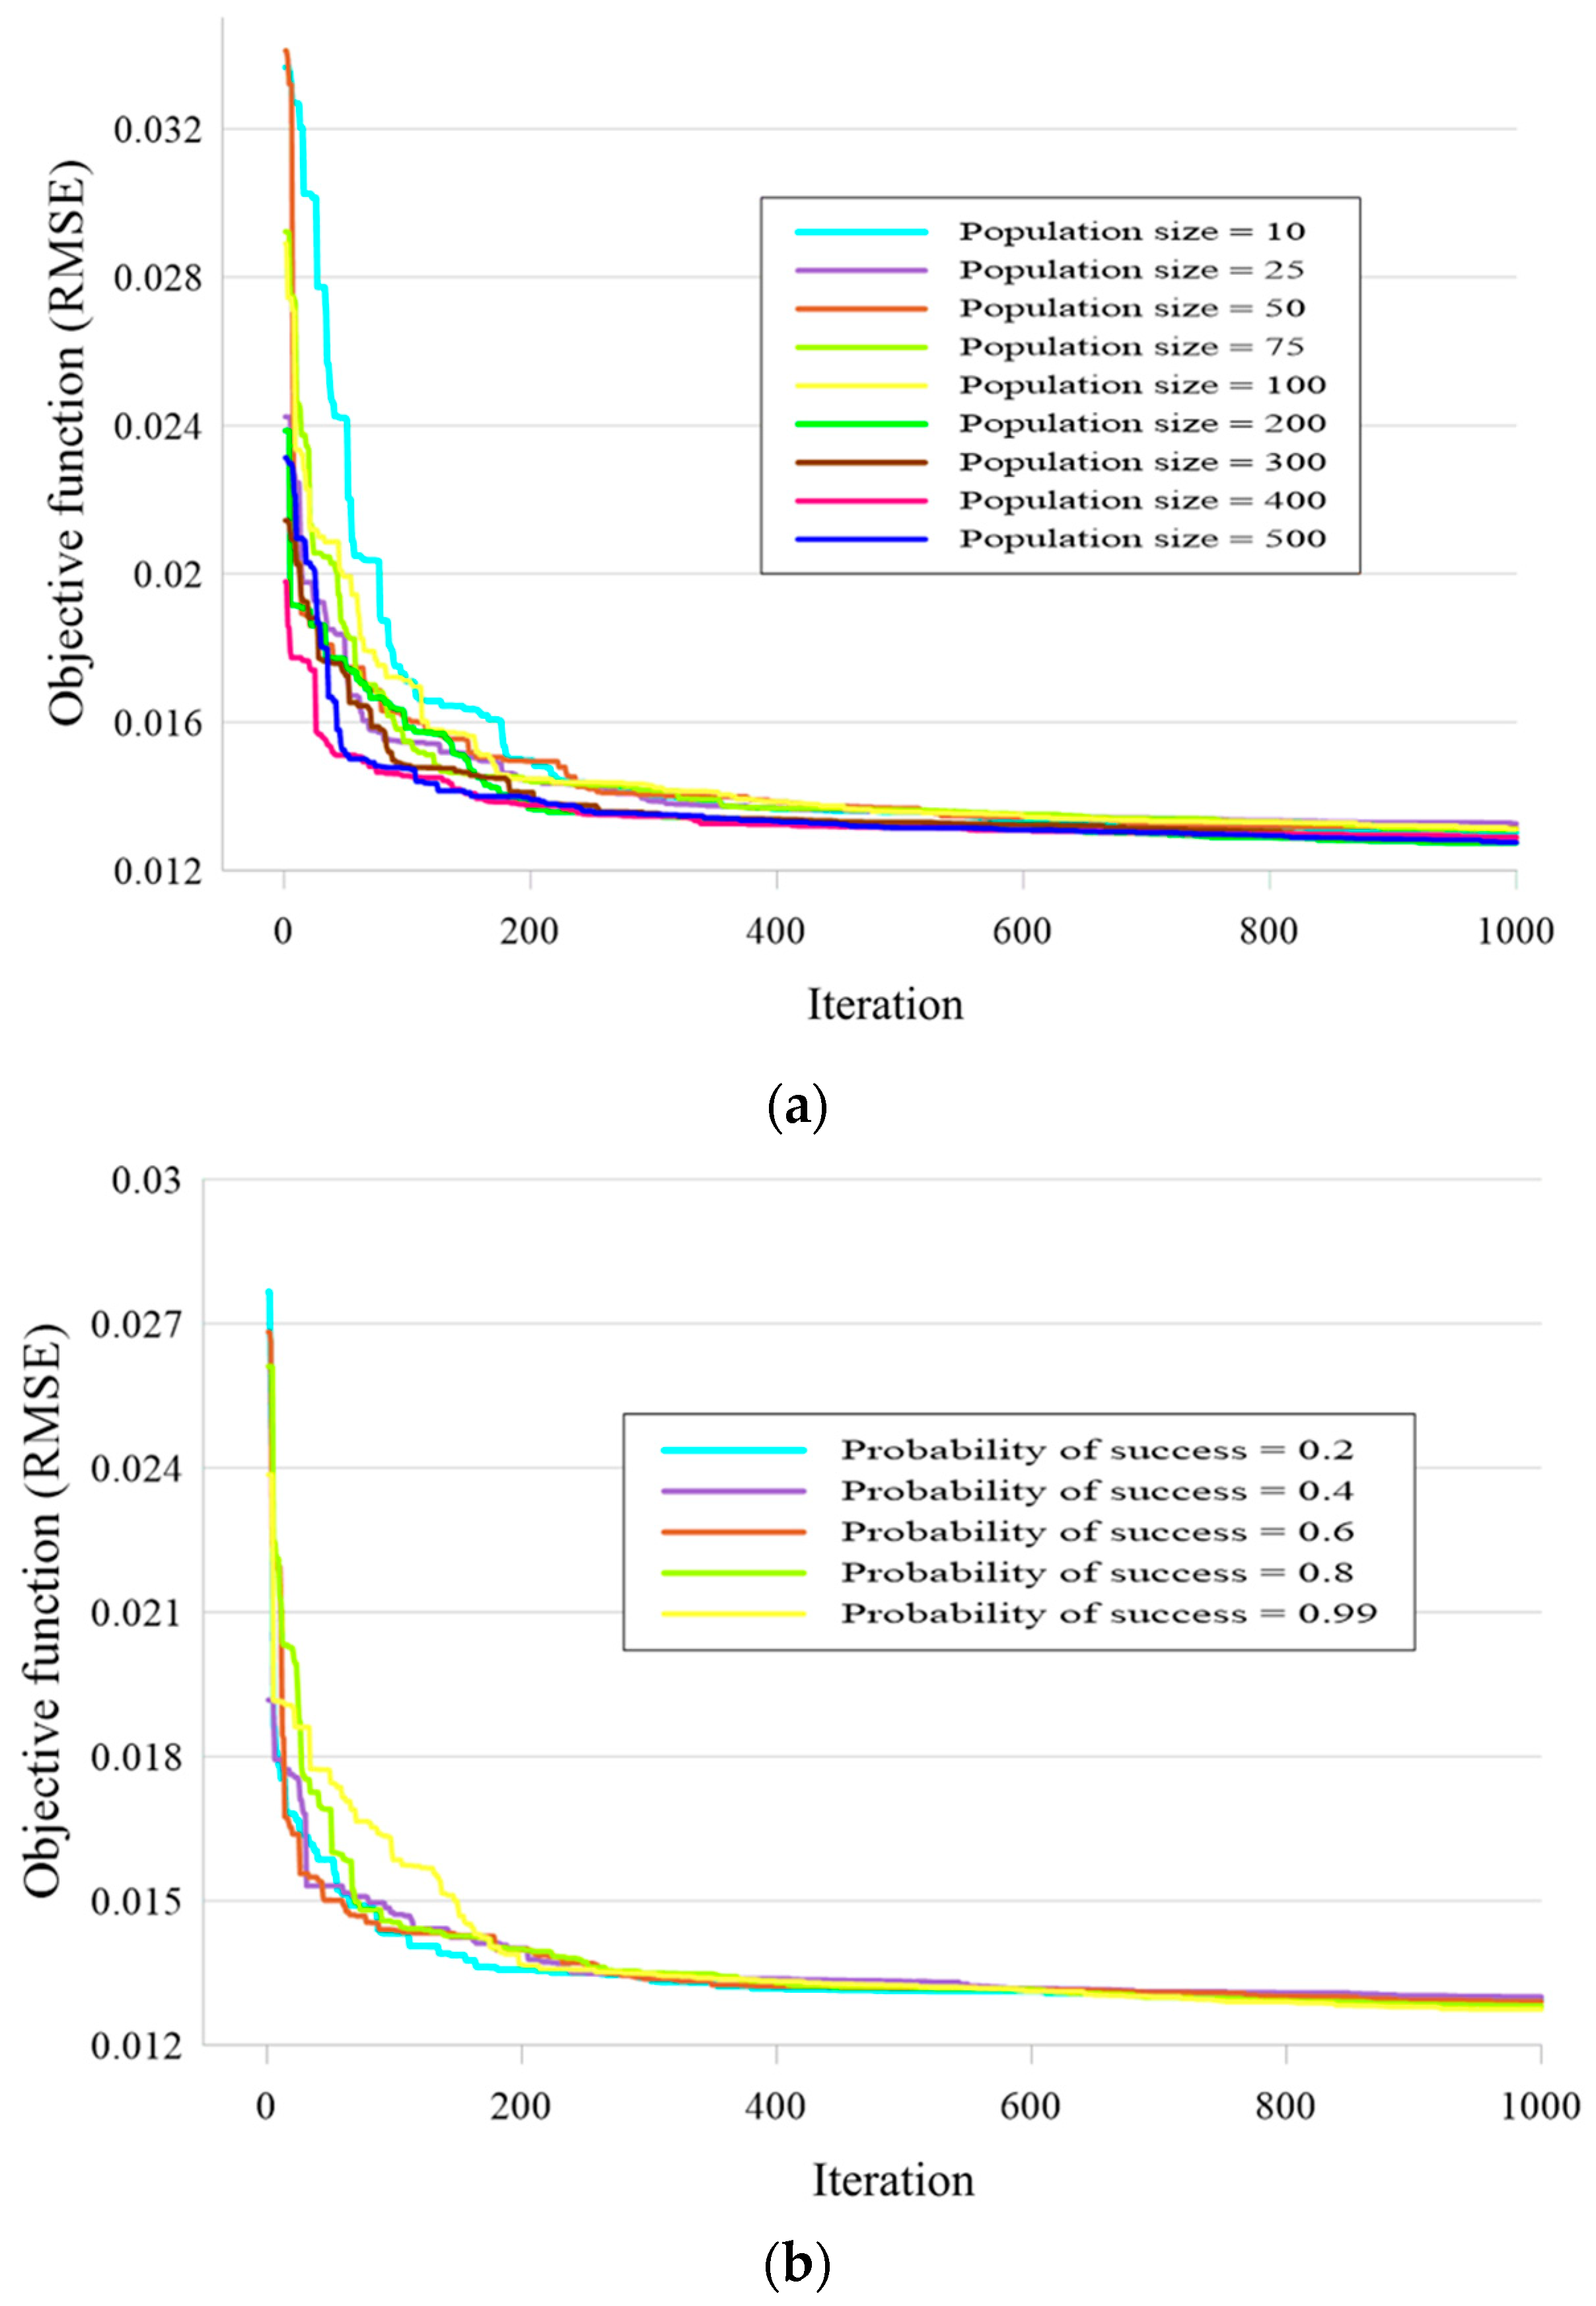
Like other optimization techniques, there are a number of LCA parameters that need to be optimized to make sure the best ensemble is being used [37]. Note that, one thousand iterations were set for each proposed network. Considering the population size, probability of success (POS), and type of formation (TOF) as the variables, three steps were carried out to achieve the most suitable architecture. Also, the RMSE was defined as the objective function, measuring the error of performance in each iteration.
According to Figure 7a, nine different population sizes of 10, 25, 50, 75, 100, 200, 300, 400, and 500 were tested, where the POS and TOF were set 0.99 and 2, respectively. As is seen, the majority of error reduction has occurred in the first 400 iterations. Finally, the best performance (i.e., lowest RMSE = 0.012741942) was obtained for the LCA-ANFIS with population size = 200.
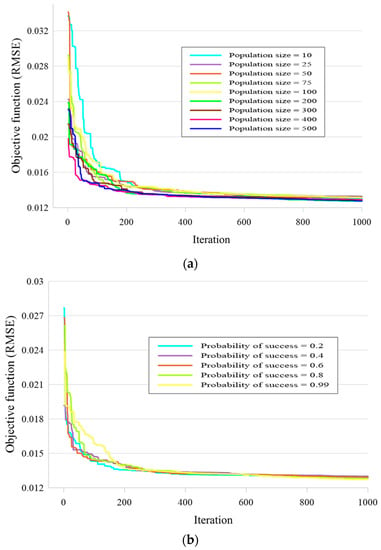
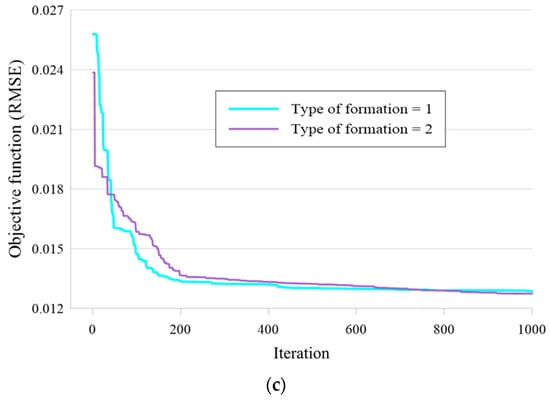
Figure 7.
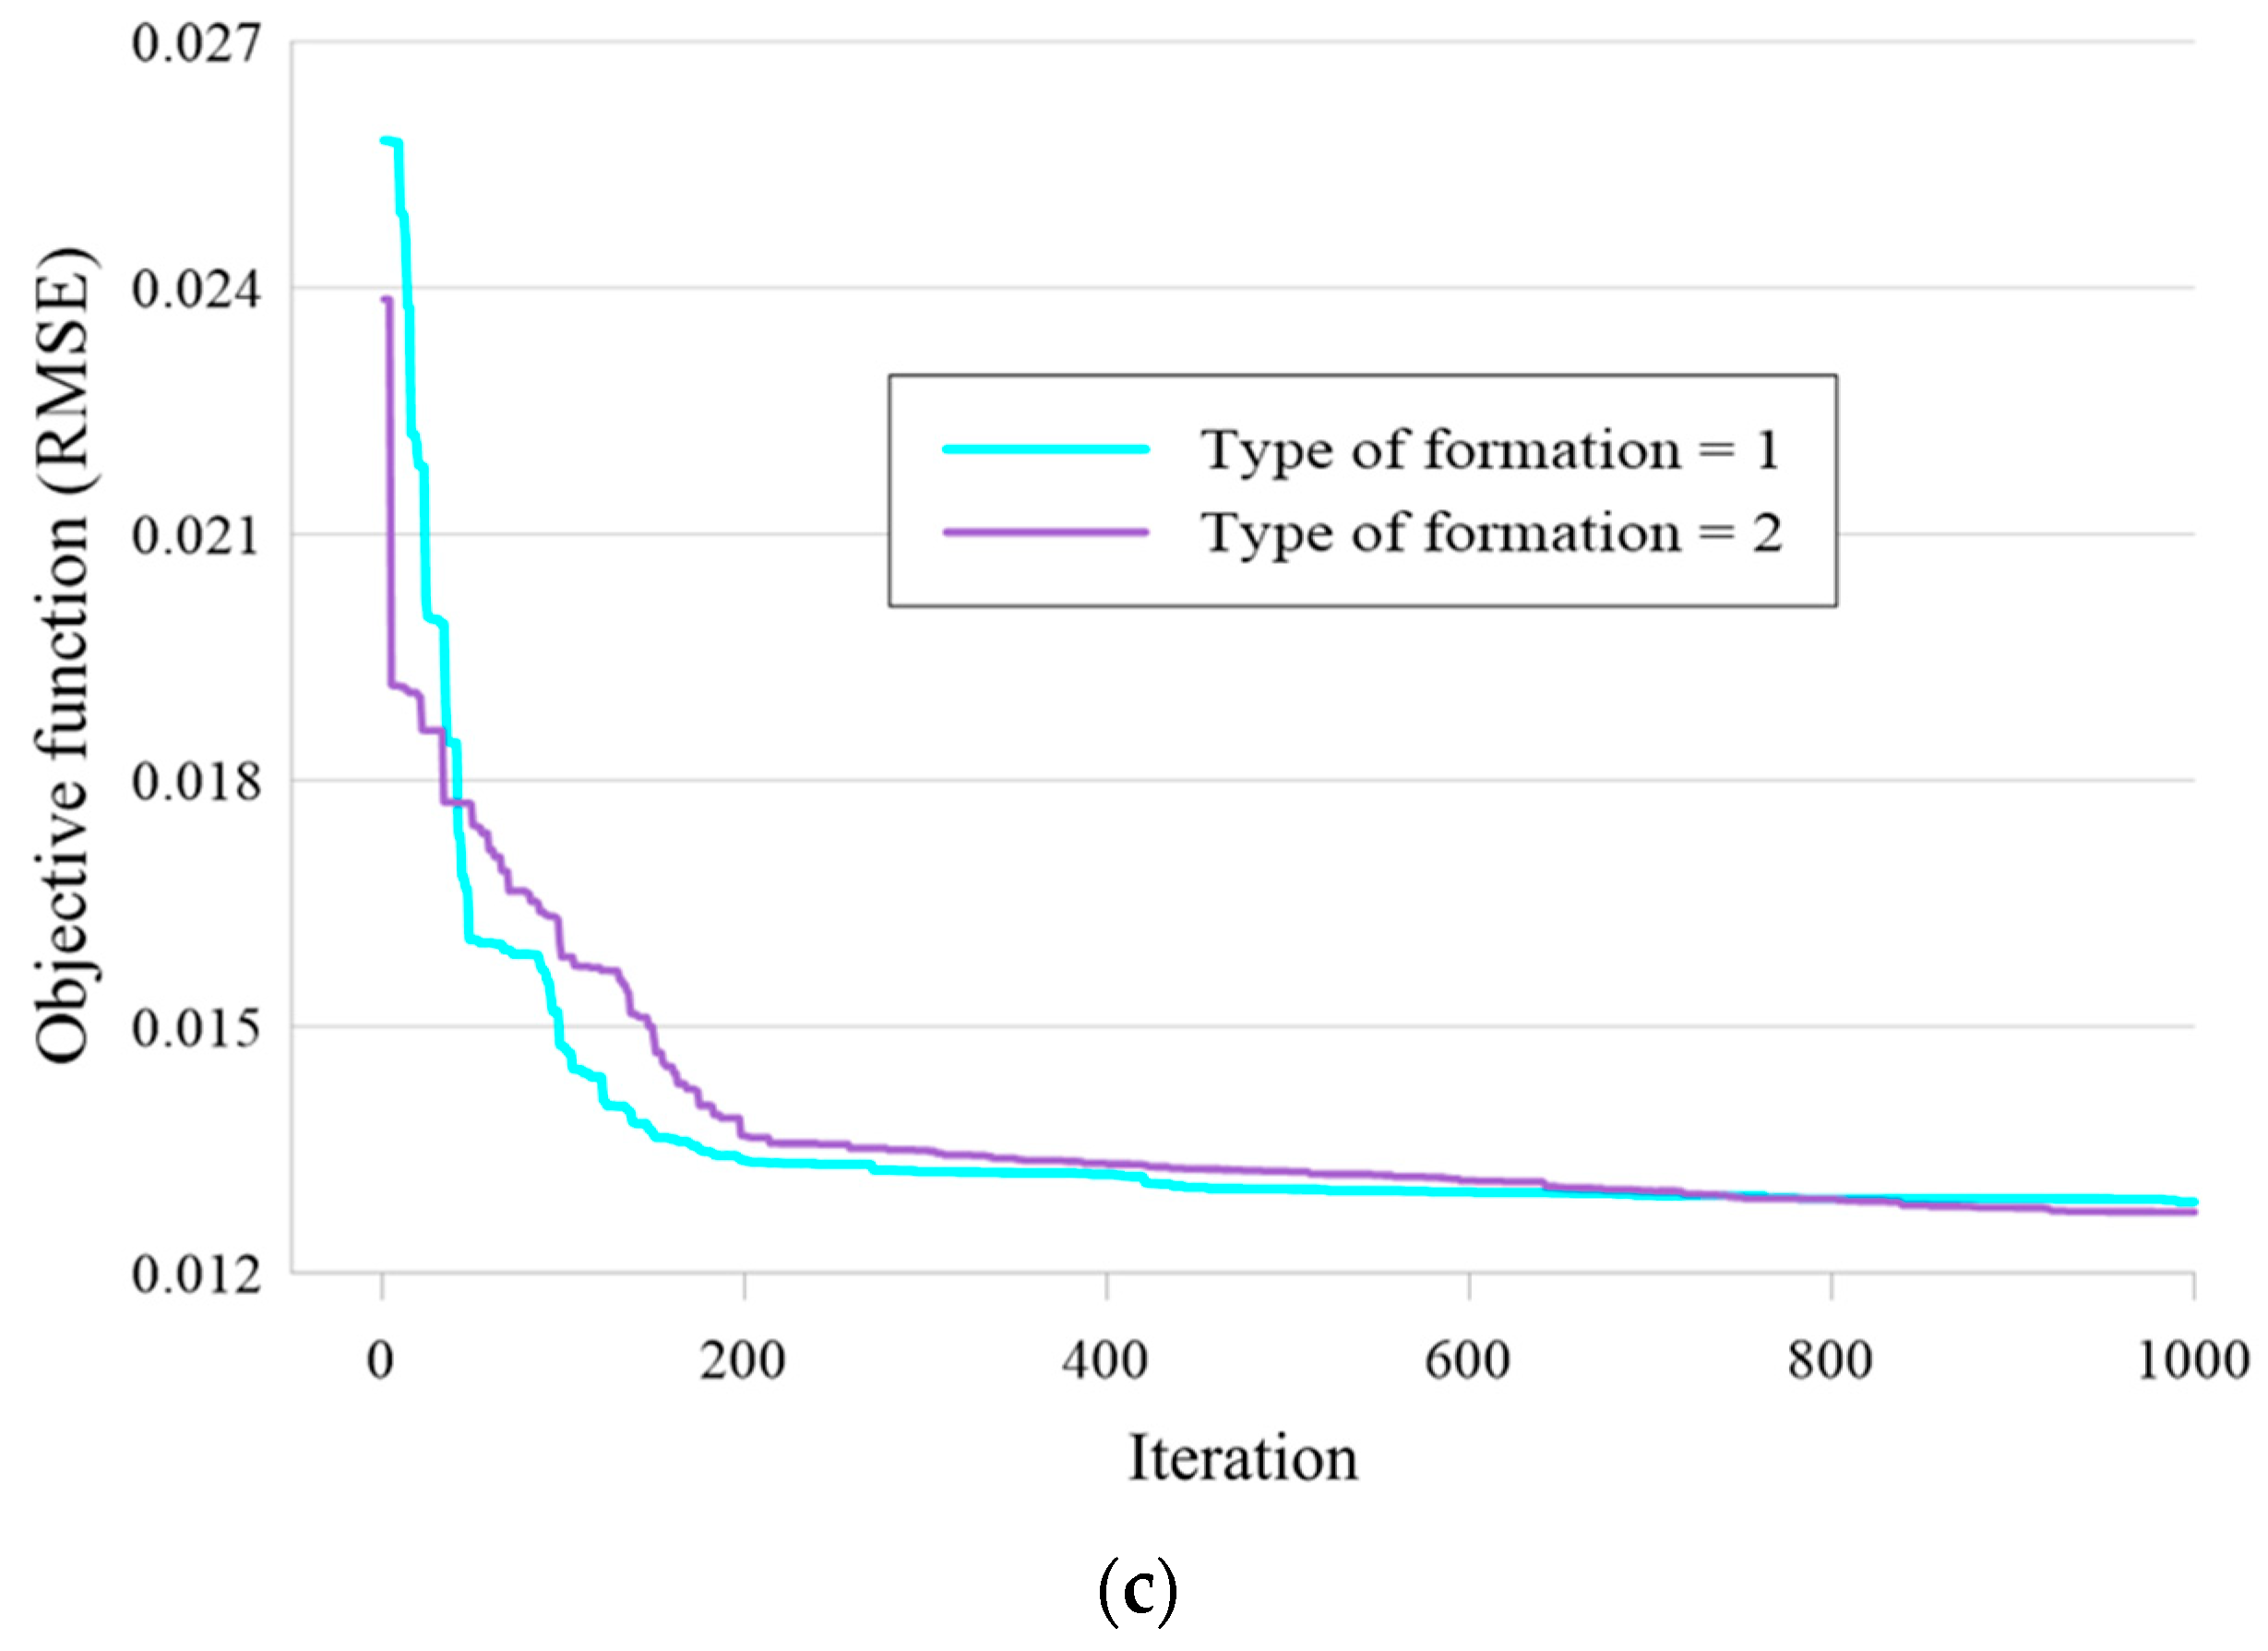
The results of the executed sensitivity analysis based on (a) the population size, (b) probability of success (POS), and (c) type of formation (TOF) of the LCA algorithm.
Next, five POSs of 0.2, 0.4, 0.6, 0.8, and 0.99 were tested, where the population size and TOF were 200 and 2, respectively. the convergence curves are presented in Figure 7b. The behavior of the models was similar to Figure 7a, and the lowest RMSE was equal to previous value as the best structure was created by POS = 0.99.
Lastly, the TOF is another influential factor in the LCA algorithm which reflects the basis of the new formation. In this sense, the TOF of 1 and 2 indicate that new formation is based on previous week events and the best formations, respectively. As Figure 7c shows, the ensemble performs more efficiently when the TOF = 2.
4.2. Performance Assessment
As explained supra, the effect of the applied metaheuristic algorithm is represented by the changes in the results of the typical ANFIS when it is coupled with the LCA. In this regard, the performance error is measured by the RSME and MAE criteria, and the correlation between the observed and modeled SCC is calculated by the R2 index. As is known, the quality of the training results represents the capability of the model in discerning the relationship between the SCC and influential soil factors. Also, the testing results indicate the generalization potential of the model. In other words, predicting the SCC for unseen soil conditions.
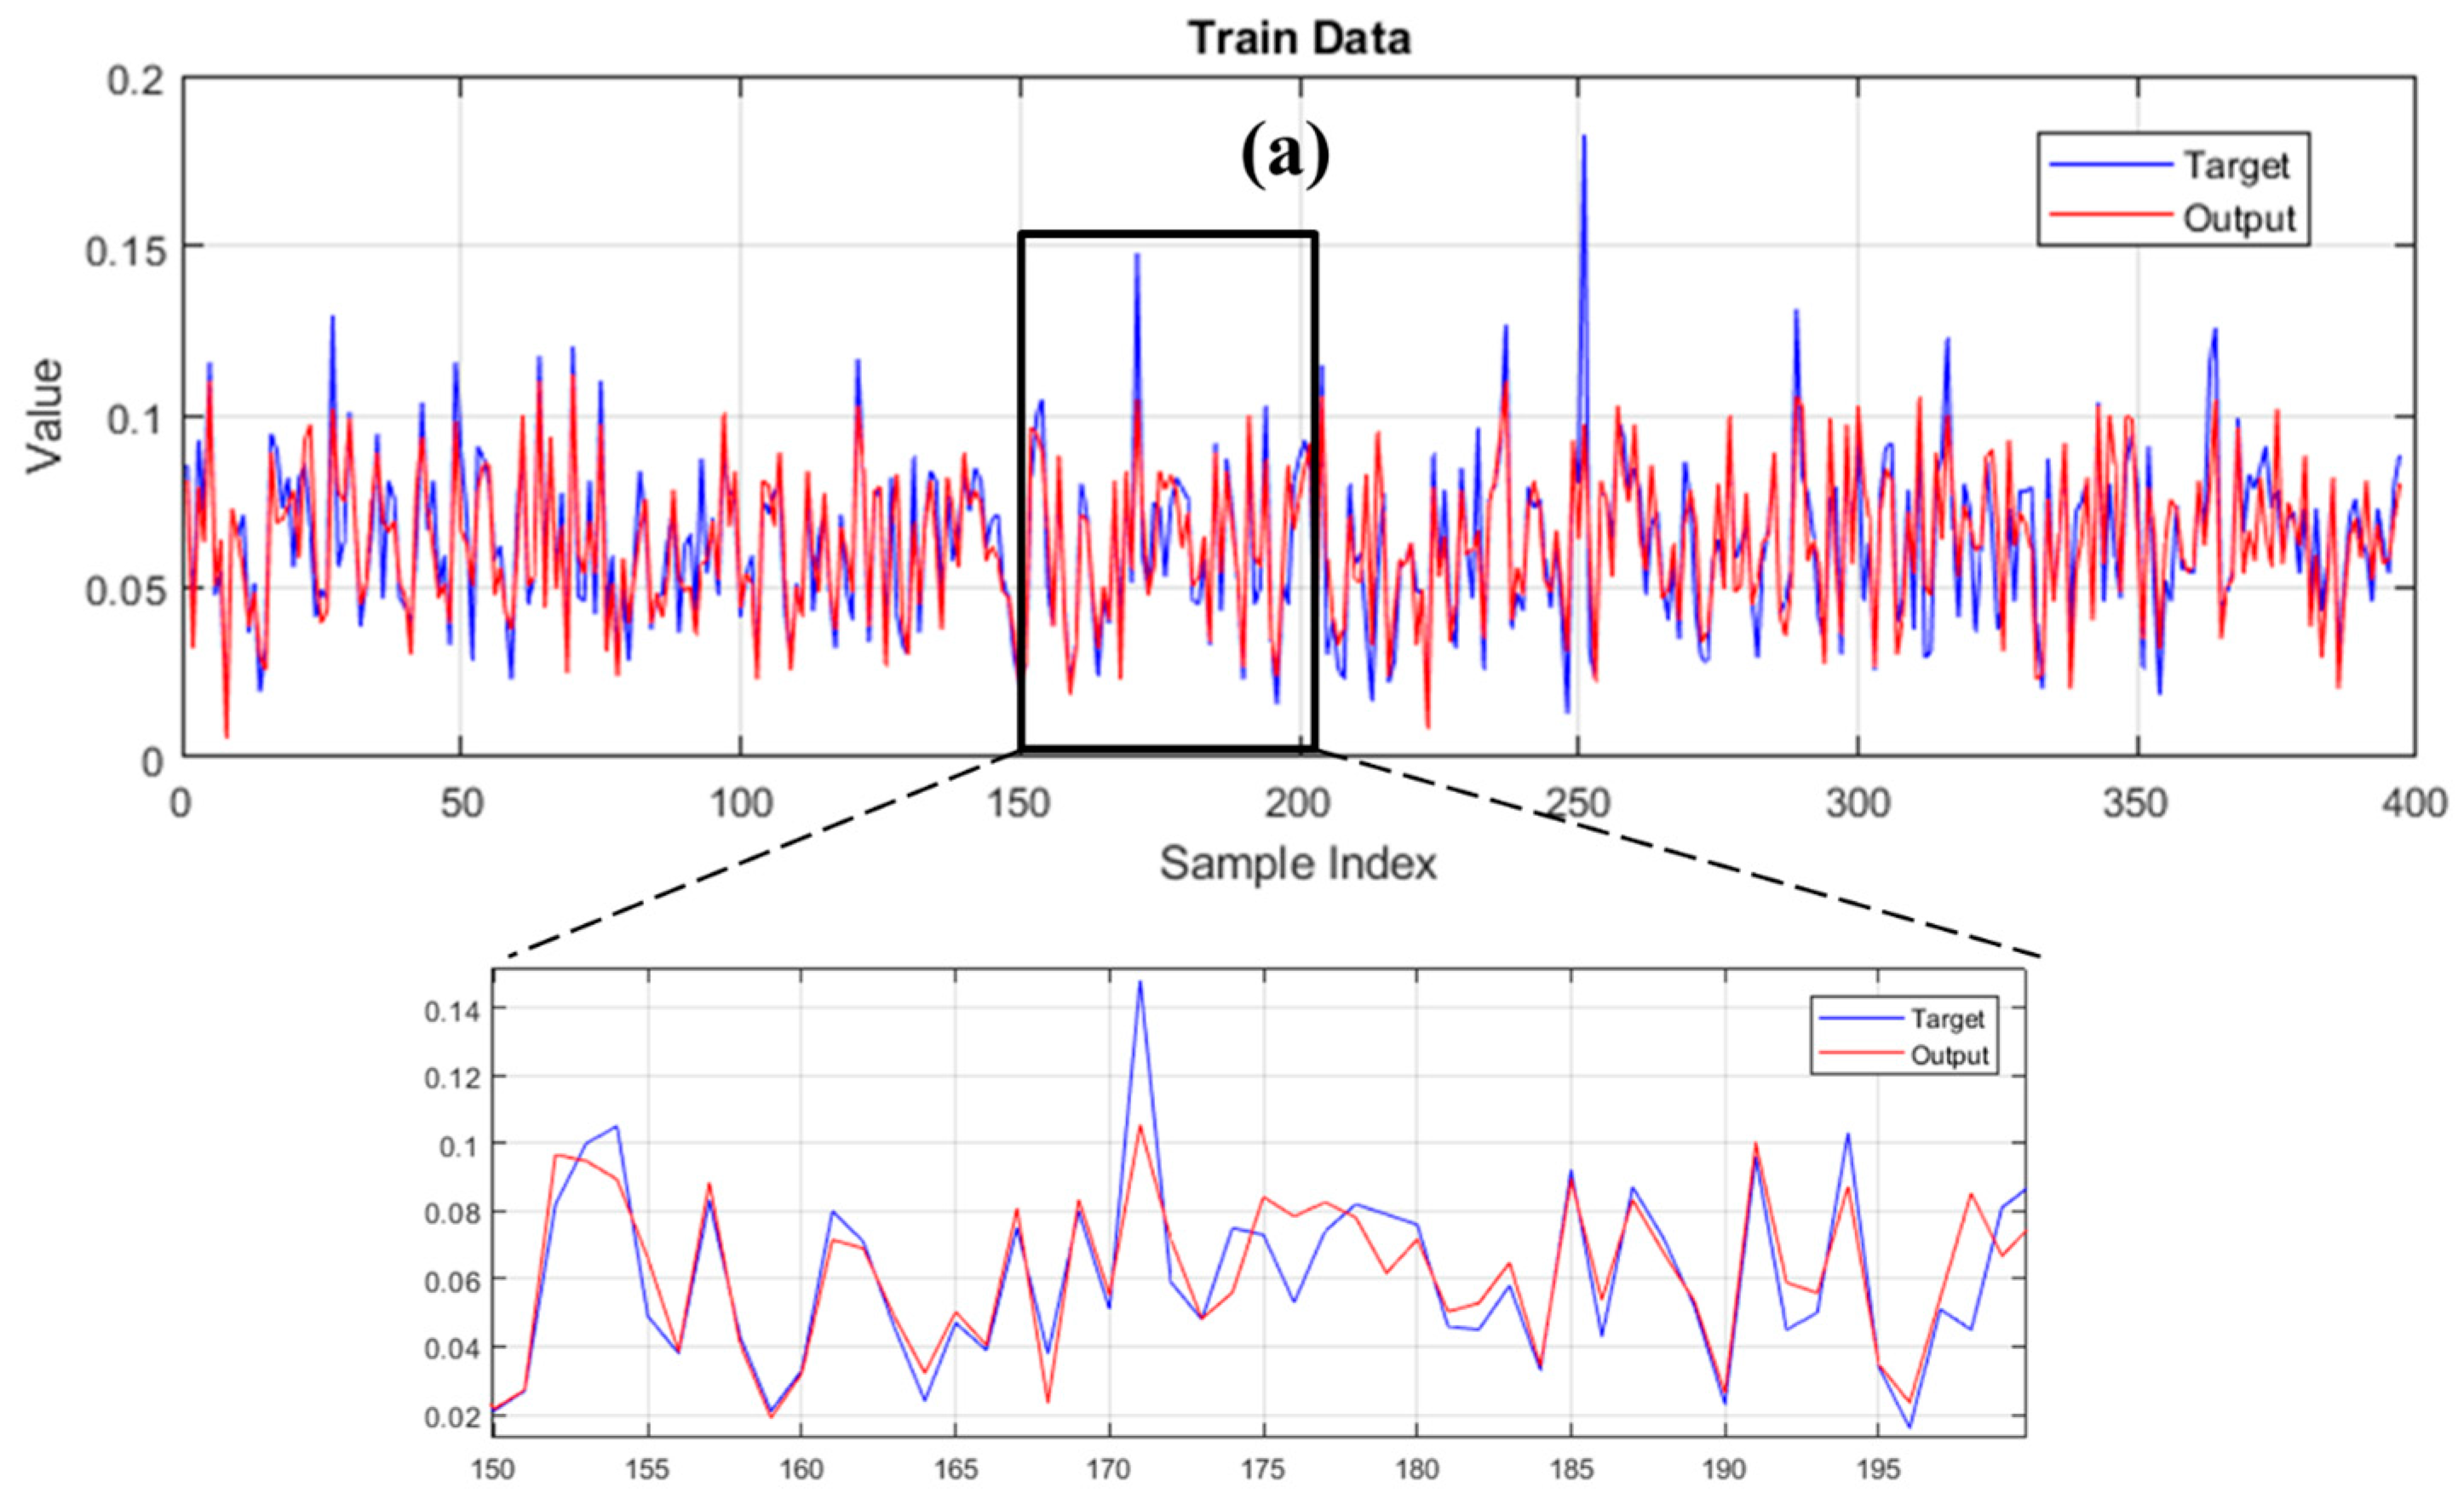
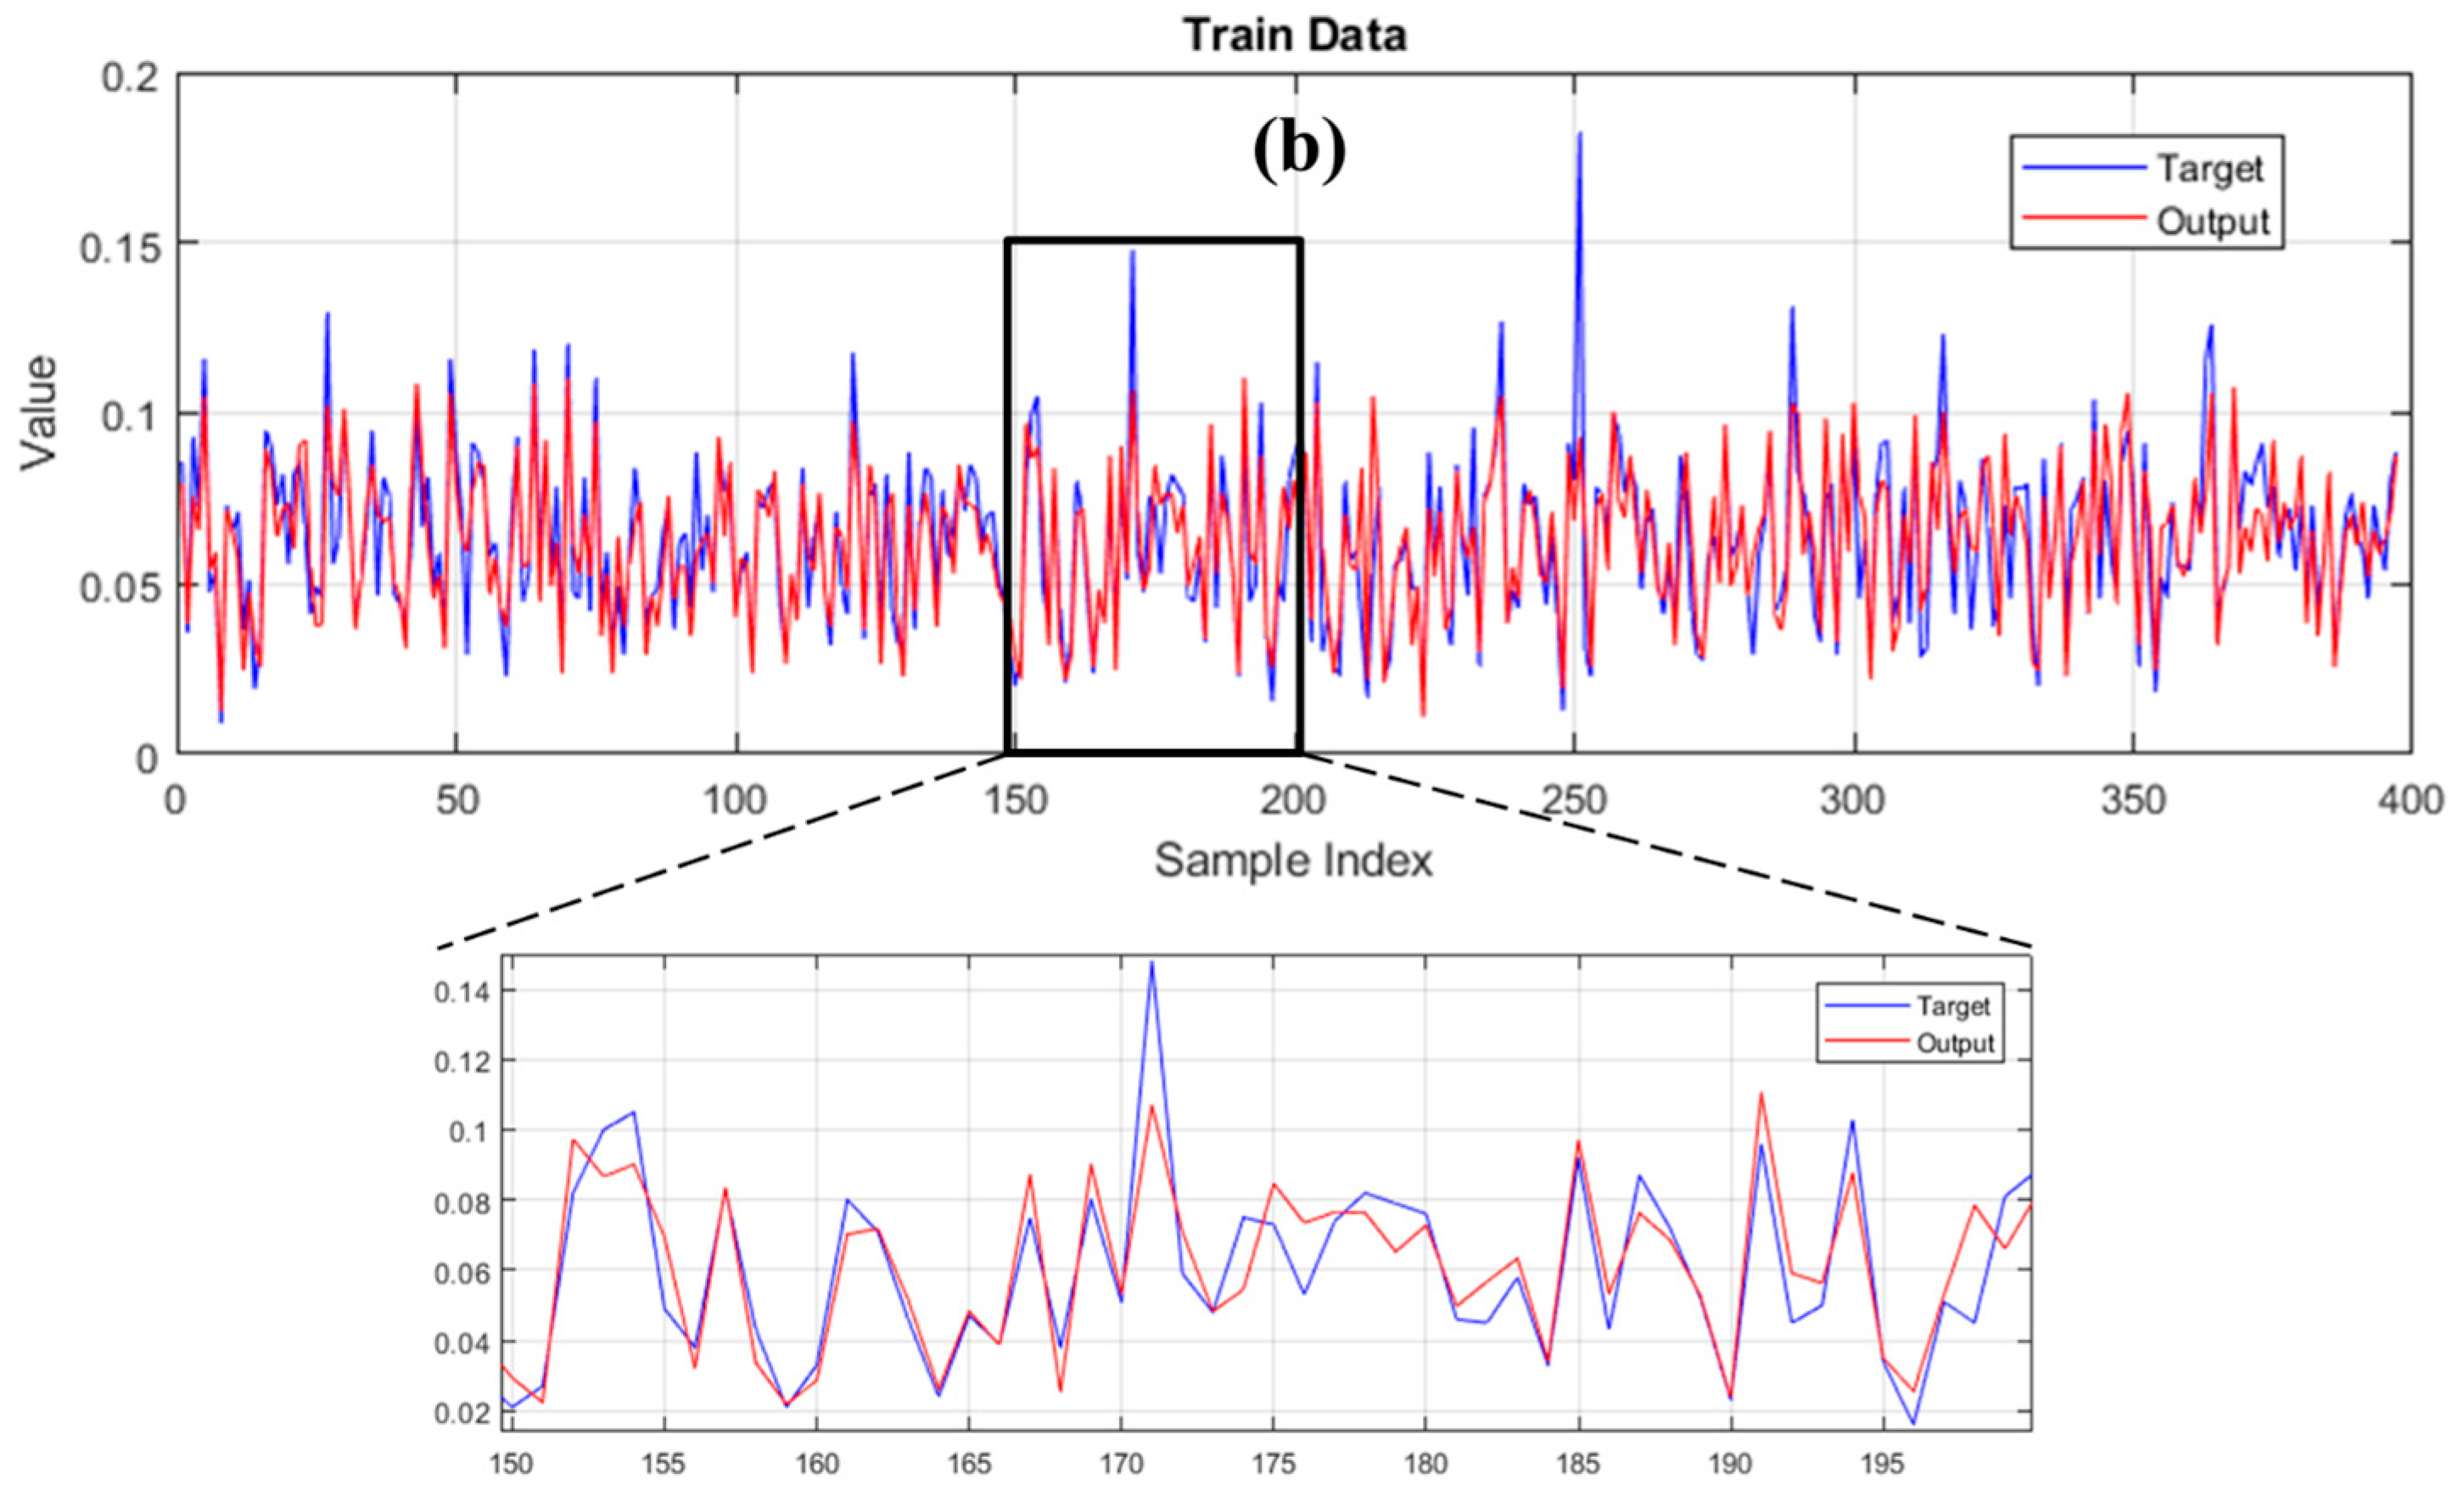
Figure 8 demonstrates the results of the training data. The observed values of the SCC vary from 0.0090 to 0.1820, and the products of ANFIS and LCA-ANFIS range in [0.0057, 0.1123] and [0.0109, 0.1105], respectively. It shows that both predictive models have grasped an acceptable pattern of the SCC. In this phase, the RMSE of ANFIS was reduced by 2.31% (i.e., from 0.0130 to 0.0127) as the impact of incorporation with the LCA technique. This improvement indicates that the MF parameters suggested by the LCA performed more promisingly than the regular ANFIS learning method. This claim could be also supported by respective MAEs of 0.0094 and 0.0091 calculated for ANFIS and LCA-ANFIS.
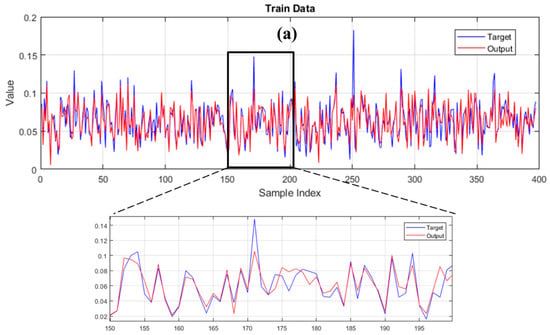
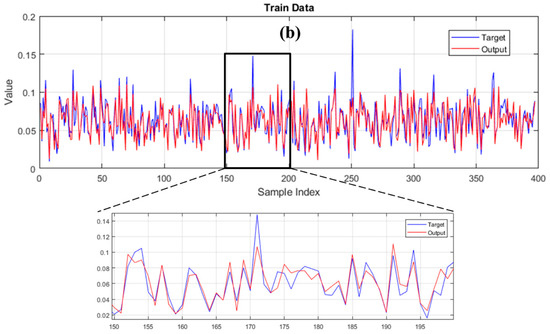
Figure 8.
Graphical comparison between the observed and modeled SCC for the (a) typical ANFIS and (b) LCA-ANFIS in the training phase.
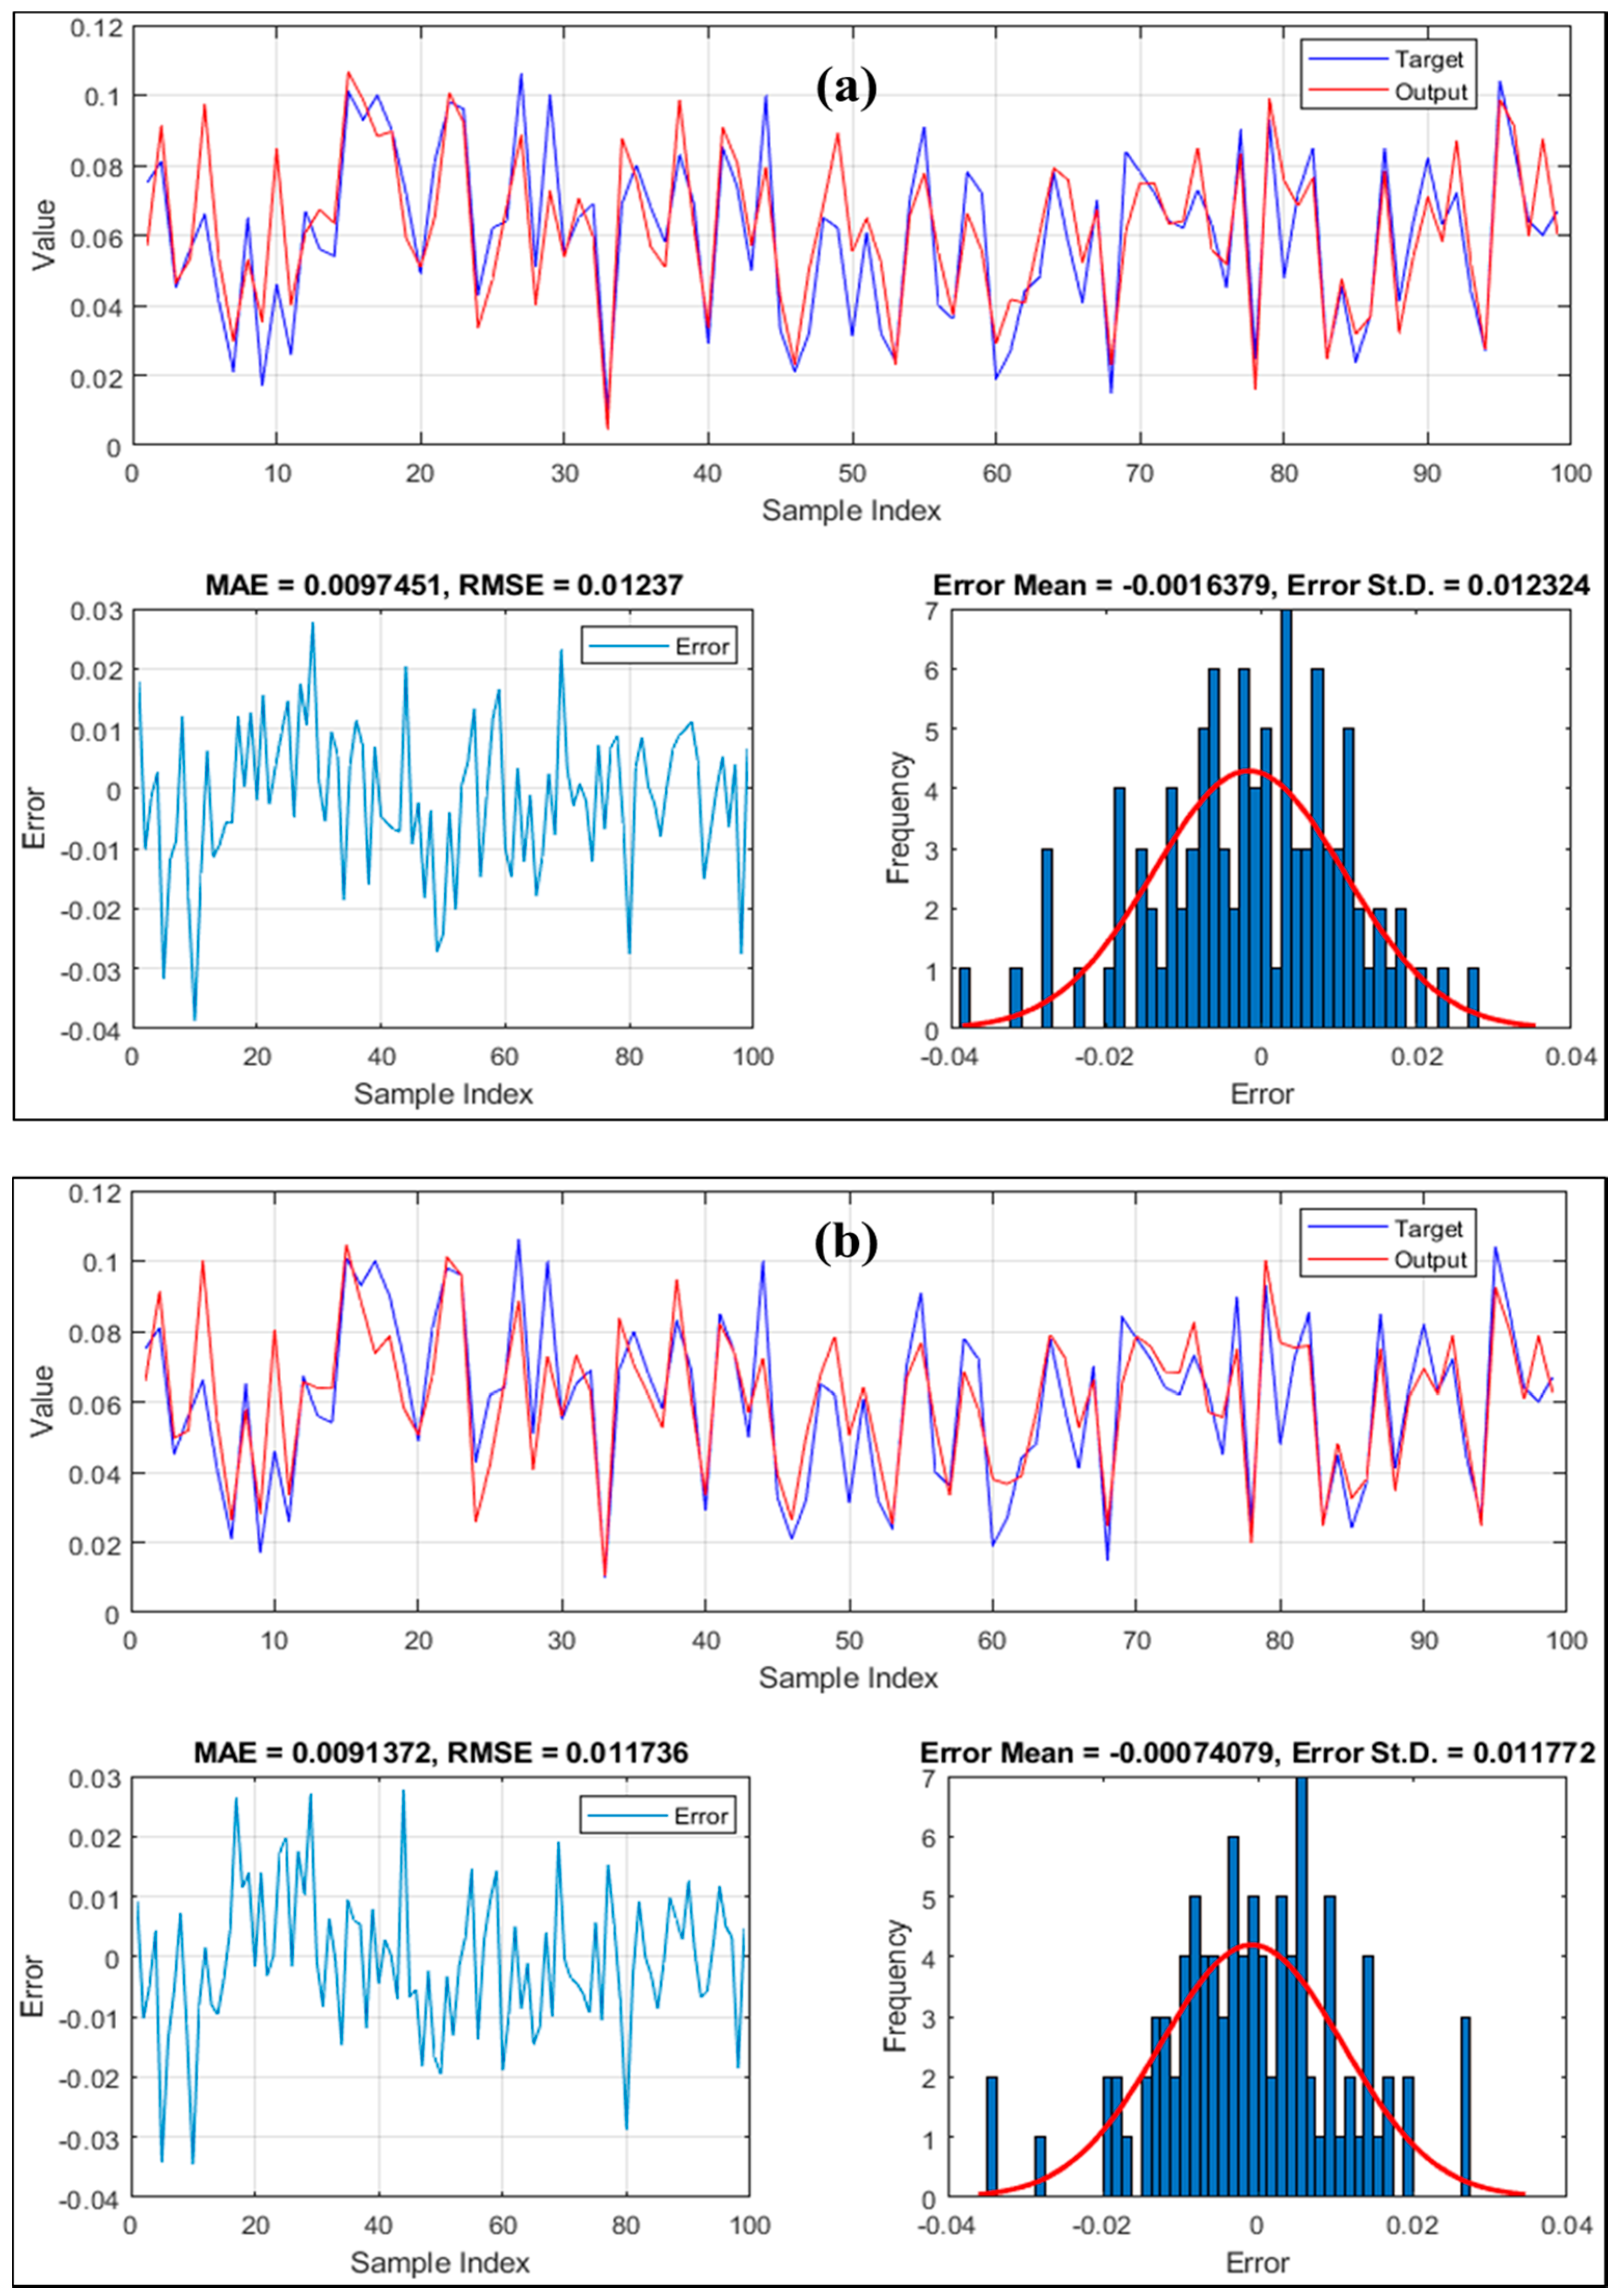
The results of the testing data are presented in Figure 9. In addition to the graphical comparisons of the targets and outputs, the error (= target – output) calculated for each sample is depicted. Besides, the histogram of the errors is also presented showing the frequency of each error value. The observed testing SCCs vary from 0.0100 to 0.1060, and the products of ANFIS and LCA-ANFIS range in [0.0045, 0.1066] and [0.0107, 0.1045], respectively. Referring to the obtained RMSEs of 0.0123 and 0.0117, as well as the MAEs of 0.0097 and 0.0091 (respectively for ANFIS and LCA-ANFIS models), it can be seen that applying the LCA resulted in 4.88% decrease in the RMSE, and more considerably, 6.19% reduction in the MAE criterion. Moreover, standard errors of 0.0123 and 0.0117 indicate a higher consistency of the hybrid ensemble prediction. This increase in the prediction accuracy demonstrates that the LCA technique enables ANFIS to gain a better generalization capability for strange conditions of the problem.
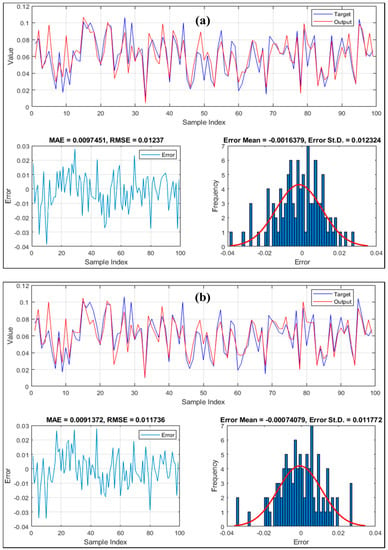
Figure 9.
The testing results of the (a) typical ANFIS and (b) LCA-ANFIS.
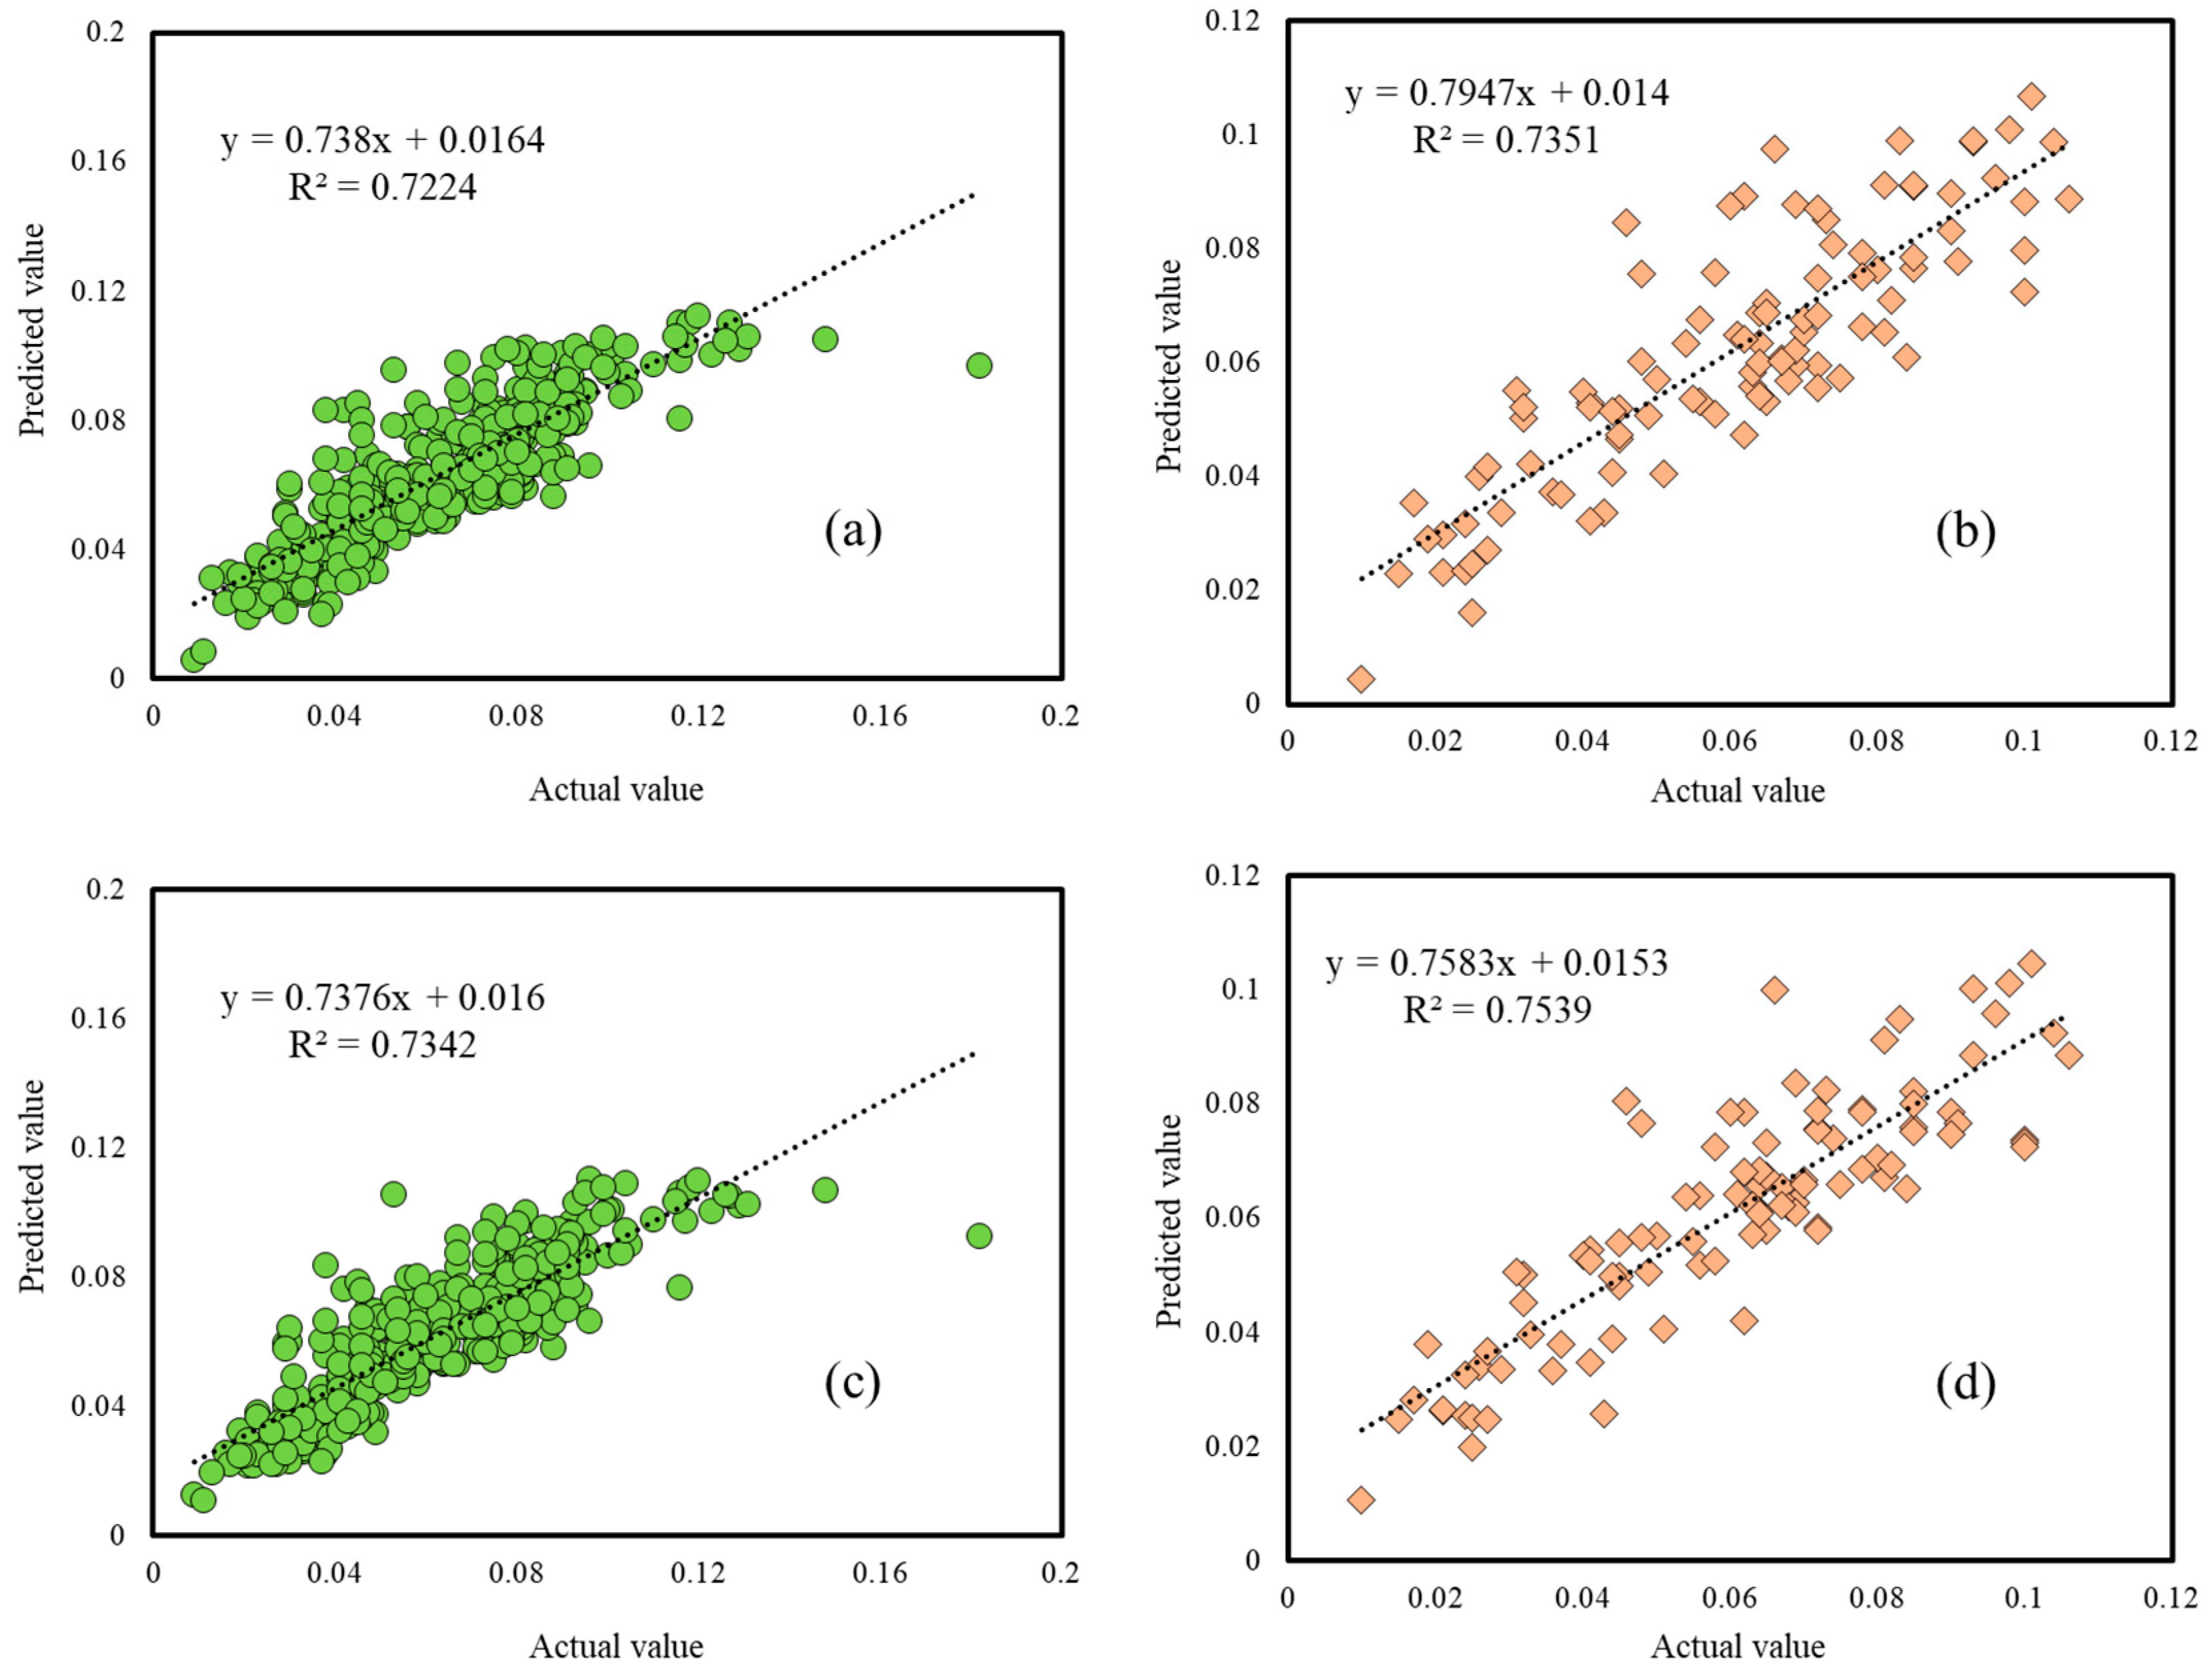
Furthermore, the consistency of both training and testing results is graphically evaluated by correlation charts presented in Figure 10. As is seen, the coefficient of determination experienced a rise from 0.7224 to 0.7342 in the training phase, and from 0.7351 to 0.7539 in the testing phase. Therefore, confirming the RMSE and MAE, the SCCs estimated by the LCA-ANFIS were better correlated with actual values in both phases.
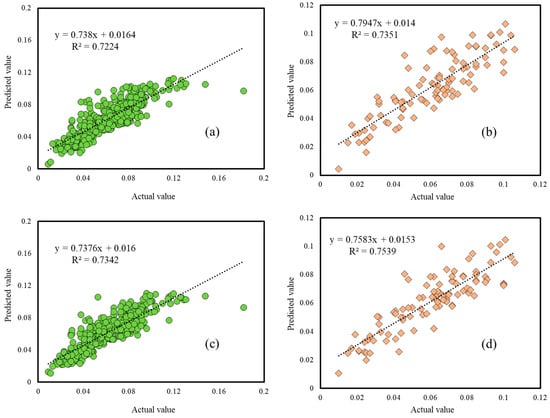
Figure 10.
The correlation between the actual and predicted SCC in the training and testing phases of (a,b) ANFIS, (c,d) LCA-ANFIS.
Another appreciable point is that the performance of both models for the testing data was more accurate than training ones. It could be also derived by the calculated values of the RMSE and MAE. Due to the extent of data, a possible reason for that could be the wider range of data in the training set (the difference between the maximum and minimum values of SCC is 0.173 and 0.096, respectively for the training and testing data). As Figure 10a,c illustrate, two maximum values of training dataset are 0.182 and 0.148 which have been considerably underestimated as 0.0969 and 0.1052 by ANFIS and 0.0926 and 0.1070 by LCA-ANFIS, respectively.
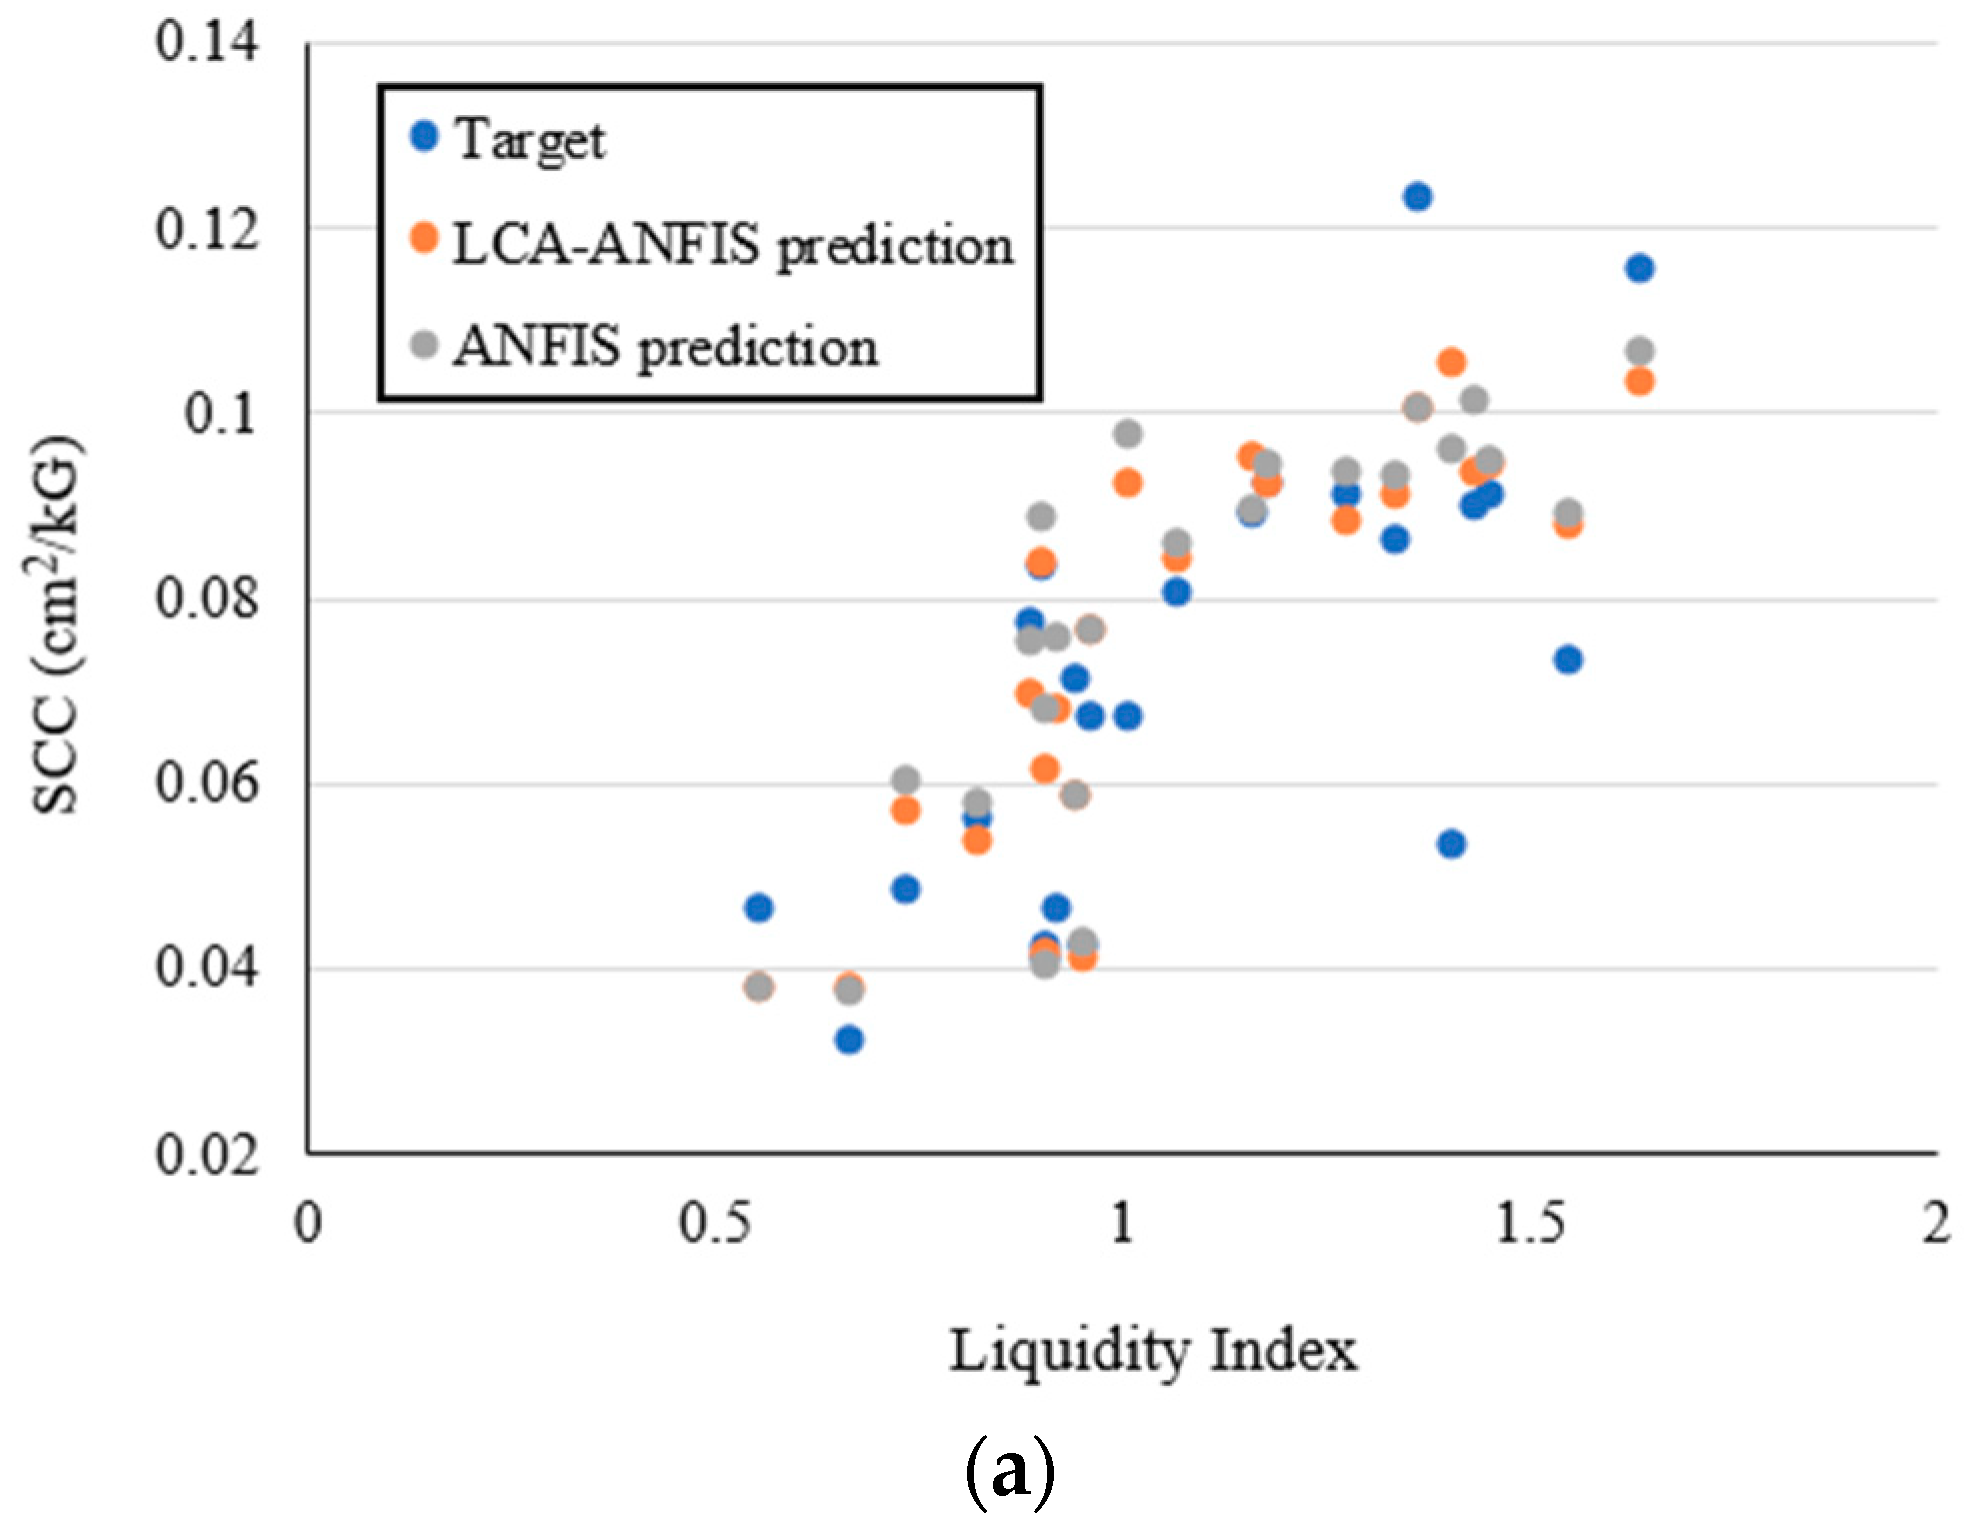
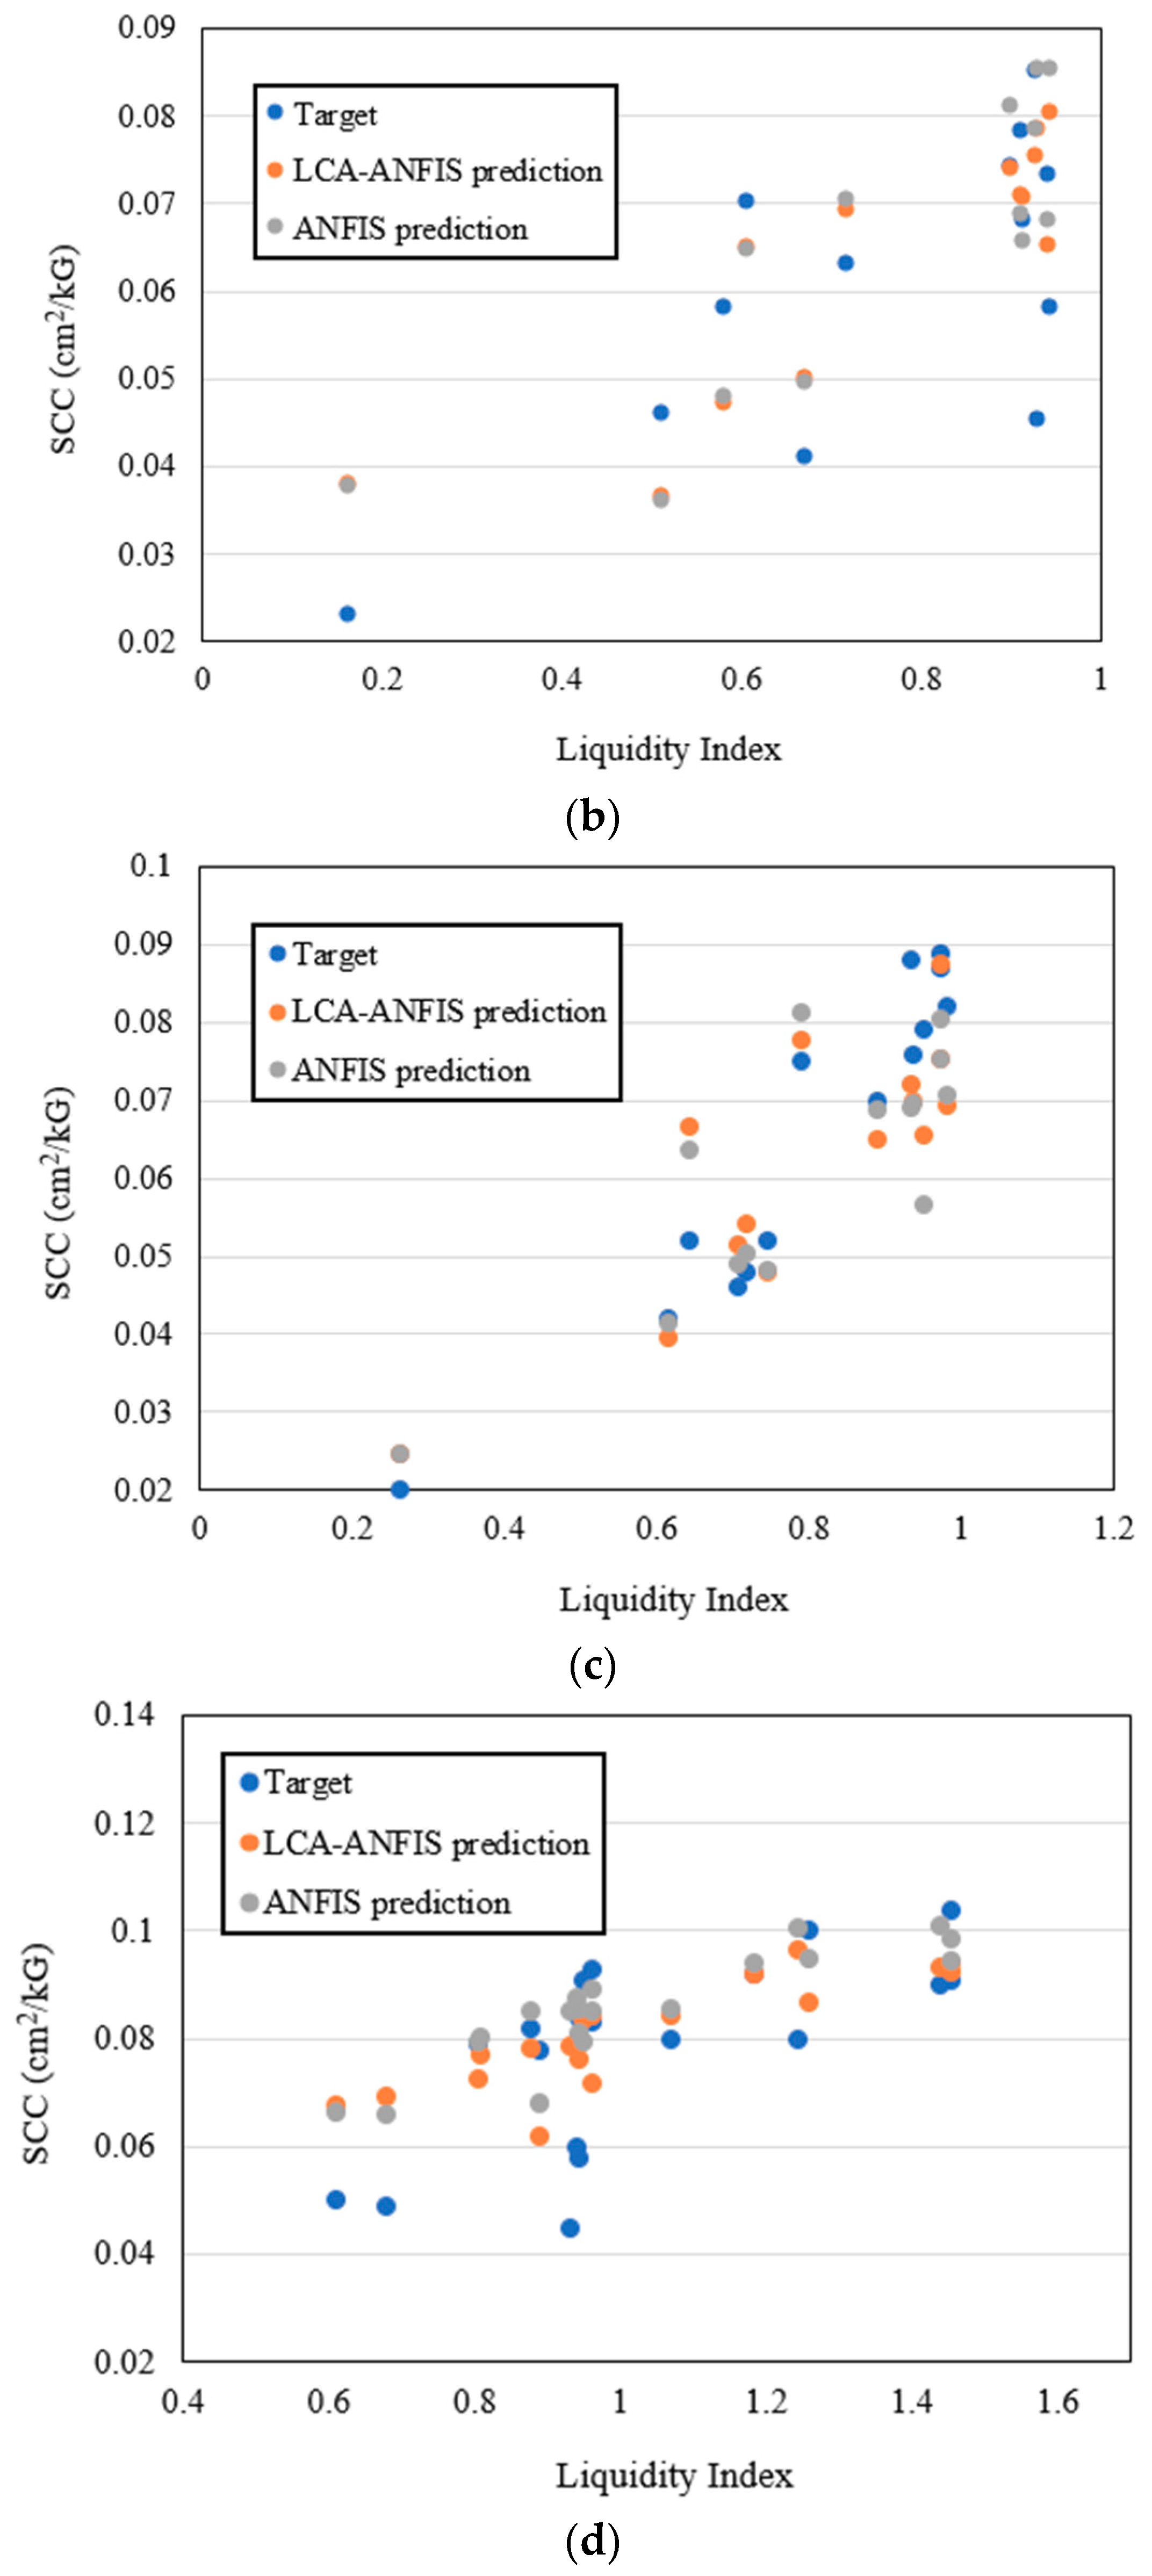
Also, Figure 11 displays four examples of scatter-based comparison between the predicted and actual SCCs belonging to the whole dataset. Each figure plots the SCC (on the y-axis) versus the LI (on the x-axis) for a constant value of other influential parameters. In Figure 11a the data are obtained from a borehole with a depth of 5.8 m. Likewise, in Figure 11b the percentage of loam is considered to be 46.1, and Figure 11c addresses soil data their percentage of clay is 26.5. Last but not least, the wet density of 1.68 g/cm3 is the common variable for the data shown in Figure 11d.
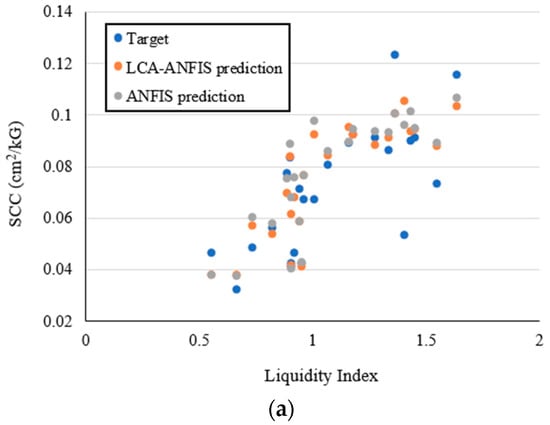
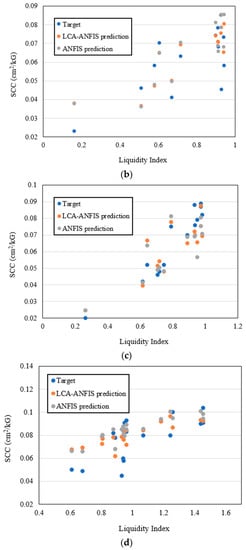
Figure 11.
Estimated and observed SCCs for data samples when (a) depth of sample = 5.8 m, (b) loam = 46.1%, (c) clay = 26.5%, and (d) wet density = 1.68 g/cm3.
Among different existing intelligent models, ANFIS is considered as a leading predictive tool that simultaneously enjoys the learning capability of ANNs and the expert knowledge of FISs [38]. Due to the complexity and non-linearity of engineering issues like the SCC estimation problem, utilizing ANFIS for this aim is a logical task. Similarly, many this model has been successfully used for analyzing the relationship between natural phenomena with complicated conditions (e.g., landslide [39] and flood [40]). The findings of the current paper fall in good agreement with these studies due to the high capability of ANFIS in inferring the non-linear relationship between the compression coefficient and related soil factors for a real-world project. The SCC estimation investigated in this study is classified as a high-dimensional problem due to the presence of several effective factors. It is more highlighted when this parameter is not in regular proportion with some effective factors like clay content and plastic index (Figure 5). On the other hand, many studies (e.g., [41]) have shown that conducting feature validity is a reasonable way for reducing the complexity of such problems. Thus, we believe that optimizing the input configuration can be a helpful task for achieving more accurate prediction of the SCC. This idea along with comparing the LCA with other metaheuristic algorithms, can be potent suggestions for future studies in this field.
5. Conclusions
This study outlined a new application of league championship optimization which was optimizing ANFIS for prevailing its computational weaknesses. The studied subject was predicting soil compression coefficient by taking into consideration several soil parameters. The LCA was coupled with ANFIS and the optimization procedure revealed that the best values for the population size and probability of success were 200 and 0.99, respectively. Besides, the elite formation was found to be a more suitable basis for new formations, compared to the events of the previous week. The increase of R2, as well as the reduction of RMSE and MAE, showed the performance improvement of ANFIS as the results of LCA functioning. Similar to many previous studies which have conducted metaheuristic optimizations for predictive tools like ANFIS, it was concluded that the LCA is an efficient optimization technique in the field of SCC analysis. Consequently, along with ANFIS, it could be used as a robust predictive model for exploring the relationship between the SCC and soil parameters.
Author Contributions
H.M., D.T.B., A.D. wrote the manuscript, discussion and analyzed the data. H.M. and A.D., and P.T.T.N., edited, restructured, and professionally optimized the manuscript. All authors have read and agreed to the published version of the manuscript.
Funding
This research received no external funding.
Conflicts of Interest
The authors declare no conflict of interest.
References
- Koppula, S. Statistical estimation of compression index. Geotech. Test. J 1981, 4, 68–73. [Google Scholar] [CrossRef]
- Bayat, H.; Ebrahimi, E.; Fallah, M. Estimation of soil moisture using confined compression curve parameters. Geoderma 2018, 318, 64–77. [Google Scholar] [CrossRef]
- Mohammadzadeh, D.; Bazaz, J.B.; Alavi, A.H. An evolutionary computational approach for formulation of compression index of fine-grained soils. Eng. Appl. Artif. Intell. 2014, 33, 58–68. [Google Scholar] [CrossRef]
- Tahouni, S. Principle of Geotechnical Engineering. Vol. 1, Soil Mechanic; Pars Aeen Publications: Tehran, Iran, 2007. [Google Scholar]
- Namdarvand, F.; Jafarnejadi, A.; Sayyad, G. Estimation of soil compression coefficient using artificial neural network and multiple regressions. Int. Res. J. Appl. Basic. Sci. 2013, 4, 3232–3236. [Google Scholar]
- Gao, W.; Guirao, J.L.G.; Abdel-Aty, M.; Xi, W. An independent set degree condition for fractional critical deleted graphs. Discret. Contin. Dyn. Syst. S 2019, 12, 877–886. [Google Scholar] [CrossRef]
- Gao, W.; Guirao, J.L.G.; Basavanagoud, B.; Wu, J. Partial multi-dividing ontology learning algorithm. Inf. Sci. 2018, 467, 35–58. [Google Scholar] [CrossRef]
- Nguyen, H.; Mehrabi, M.; Kalantar, B.; Moayedi, H.; Abdullahi, M.A.M. Potential of hybrid evolutionary approaches for assessment of geo-hazard landslide susceptibility mapping. Geomat. Nat. Hazards Risk 2019, 10, 1667–1693. [Google Scholar] [CrossRef]
- Nhu, V.-H.; Hoang, N.-D.; Duong, V.-B.; Vu, H.-D.; Bui, D.T. A hybrid computational intelligence approach for predicting soil shear strength for urban housing construction: A case study at Vinhomes Imperia project, Hai Phong city (Vietnam). Eng. Comput. 2019, 1–14. [Google Scholar] [CrossRef]
- Kurnaz, T.F.; Dagdeviren, U.; Yildiz, M.; Ozkan, O. Prediction of compressibility parameters of the soils using artificial neural network. SpringerPlus 2016, 5, 1801. [Google Scholar] [CrossRef]
- Park, H.; Lee, S.R. Evaluation of the compression index of soils using an artificial neural network. Comput. Geotech. 2011, 38, 472–481. [Google Scholar] [CrossRef]
- Demir, A. New computational models for better predictions of the soil-compression index. Acta Geotech. Slov. 2015, 12, 59–69. [Google Scholar]
- Gao, W.; Wang, W.; Dimitrov, D.; Wang, Y. Nano properties analysis via fourth multiplicative ABC indicator calculating. Arab. J. Chem. 2018, 11, 793–801. [Google Scholar] [CrossRef]
- Gao, W.; Dimitrov, D.; Abdo, H. Tight independent set neighborhood union condition for fractional critical deleted graphs and ID deleted graphs. Discret. Contin. Dyn. Syst. S 2018, 12, 711–721. [Google Scholar] [CrossRef]
- Nhu, V.-H.; Samui, P.; Kumar, D.; Singh, A.; Hoang, N.-D.; Bui, D.T. Advanced soft computing techniques for predicting soil compression coefficient in engineering project: A comparative study. Eng. Compu. 2019, 1–12. [Google Scholar] [CrossRef]
- Pham, B.T.; Nguyen, M.D.; Van Dao, D.; Prakash, I.; Ly, H.-B.; Le, T.-T.; Ho, L.S.; Nguyen, K.T.; Ngo, T.Q.; Hoang, V. Development of artificial intelligence models for the prediction of Compression Coefficient of soil: An application of Monte Carlo sensitivity analysis. Sci. Total Environ. 2019, 679, 172–184. [Google Scholar] [CrossRef]
- Moayedi, H.; Mehrabi, M.; Kalantar, B.; Abdullahi Mu’azu, M.; A. Rashid, A.S.; Foong, L.K.; Nguyen, H. Novel hybrids of adaptive neuro-fuzzy inference system (ANFIS) with several metaheuristic algorithms for spatial susceptibility assessment of seismic-induced landslide. Geomat. Nat. Hazards Risk 2019, 10, 1879–1911. [Google Scholar] [CrossRef]
- Mohammadzadeh, D.; Bazaz, J.B.; Yazd, S.V.J.; Alavi, A.H. Deriving an intelligent model for soil compression index utilizing multi-gene genetic programming. Environ. Earth Sci. 2016, 75, 262. [Google Scholar] [CrossRef]
- Bui, D.T.; Nhu, V.-H.; Hoang, N.-D. Prediction of soil compression coefficient for urban housing project using novel integration machine learning approach of swarm intelligence and multi-layer perceptron neural network. Adv. Eng. Inform. 2018, 38, 593–604. [Google Scholar]
- Jang, J.-S. ANFIS: adaptive-network-based fuzzy inference system. IEEE Trans. Syst. Man Cybern. 1993, 23, 665–685. [Google Scholar] [CrossRef]
- Jang, J.-S.R.; Sun, C.-T.; Mizutani, E. Neuro-fuzzy and soft computing-a computational approach to learning and machine intelligence [Book Review]. IEEE Trans. Autom. Control 1997, 42, 1482–1484. [Google Scholar] [CrossRef]
- Dehnavi, A.; Aghdam, I.N.; Pradhan, B.; Varzandeh, M.H. A new hybrid model using step-wise weight assessment ratio analysis (SWARA) technique and adaptive neuro-fuzzy inference system (ANFIS) for regional landslide hazard assessment in Iran. Catena 2015, 135, 122–148. [Google Scholar] [CrossRef]
- Jang, J.-S.; Sun, C.-T. Neuro-fuzzy modeling and control. Proc. IEEE 1995, 83, 378–406. [Google Scholar] [CrossRef]
- Brown, M.; Harris, C.J. Neurofuzzy Adaptive Modelling and Control; Prentice Hall: Upper Saddle River, NJ, USA, 1994. [Google Scholar]
- Bui, D.T.; Moayedi, H.; Gör, M.; Jaafari, A.; Foong, L.K. Predicting Slope Stability Failure through Machine Learning Paradigms. ISPRS Int. J. Geo-Inf. 2019, 8, 395. [Google Scholar] [CrossRef]
- Moayedi, H.; Tien Bui, D.; Gör, M.; Pradhan, B.; Jaafari, A. The Feasibility of Three Prediction Techniques of the Artificial Neural Network, Adaptive Neuro-Fuzzy Inference System, and Hybrid Particle Swarm Optimization for Assessing the Safety Factor of Cohesive Slopes. ISPRS Int. J. Geo-Inf. 2019, 8, 391. [Google Scholar] [CrossRef]
- Chen, W.; Panahi, M.; Pourghasemi, H.R. Performance evaluation of GIS-based new ensemble data mining techniques of adaptive neuro-fuzzy inference system (ANFIS) with genetic algorithm (GA), differential evolution (DE), and particle swarm optimization (PSO) for landslide spatial modelling. Catena 2017, 157, 310–324. [Google Scholar] [CrossRef]
- Moayedi, H.; Raftari, M.; Sharifi, A.; Jusoh, W.A.W.; Rashid, A.S.A. Optimization of ANFIS with GA and PSO estimating α ratio in driven piles. Eng. Comput. 2019, 1–12. [Google Scholar] [CrossRef]
- Termeh, S.V.R.; Kornejady, A.; Pourghasemi, H.R.; Keesstra, S. Flood susceptibility mapping using novel ensembles of adaptive neuro fuzzy inference system and metaheuristic algorithms. Sci. Total Environ. 2018, 615, 438–451. [Google Scholar] [CrossRef]
- Gao, W.; Wu, H.; Siddiqui, M.K.; Baig, A.Q. Study of biological networks using graph theory. Saudi J. Biol. Sci. 2018, 25, 1212–1219. [Google Scholar] [CrossRef]
- Bui, D.T.; Pradhan, B.; Lofman, O.; Revhaug, I.; Dick, O.B. Landslide susceptibility mapping at Hoa Binh province (Vietnam) using an adaptive neuro-fuzzy inference system and GIS. Comput. Geosci. 2012, 45, 199–211. [Google Scholar]
- Kashan, A.H. League Championship Algorithm: A New Algorithm for Numerical Function Optimization. In Proceedings of the 2009 IEEE International Conference of Soft Computing and Pattern Recognition, Malacca, Malasya, 4–7 December 2009; pp. 43–48. [Google Scholar]
- Kashan, A.H. League Championship Algorithm (LCA): An algorithm for global optimization inspired by sport championships. Appl. Soft Comput. 2014, 16, 171–200. [Google Scholar] [CrossRef]
- Jalili, S.; Kashan, A.H.; Hosseinzadeh, Y. League championship algorithms for optimum design of pin-jointed structures. J. Comput. Civ. Eng. 2016, 31, 04016048. [Google Scholar] [CrossRef]
- Kashan, A.H. An efficient algorithm for constrained global optimization and application to mechanical engineering design: League championship algorithm (LCA). Comput. Aided Des. 2011, 43, 1769–1792. [Google Scholar] [CrossRef]
- Mahapatra, S.; Daniel, R.; Dey, D.N.; Nayak, S.K. Induction motor control using PSO-ANFIS. Procedia Comput. Sci. 2015, 48, 753–768. [Google Scholar] [CrossRef]
- Moayedi, H.; Mehrabi, M.; Mosallanezhad, M.; Rashid, A.S.A.; Pradhan, B. Modification of landslide susceptibility mapping using optimized PSO-ANN technique. Eng. Comput. 2019, 35(3), 967–984. [Google Scholar] [CrossRef]
- Lee, M.-J.; Park, I.; Lee, S. Forecasting and validation of landslide susceptibility using an integration of frequency ratio and neuro-fuzzy models: A case study of Seorak mountain area in Korea. Environ. Earth Sci. 2015, 74, 413–429. [Google Scholar] [CrossRef]
- Jaafari, A.; Panahi, M.; Pham, B.T.; Shahabi, H.; Bui, D.T.; Rezaie, F.; Lee, S. Meta optimization of an adaptive neuro-fuzzy inference system with grey wolf optimizer and biogeography-based optimization algorithms for spatial prediction of landslide susceptibility. Catena 2019, 175, 430–445. [Google Scholar] [CrossRef]
- Tien Bui, D.; Khosravi, K.; Li, S.; Shahabi, H.; Panahi, M.; Singh, V.; Chapi, K.; Shirzadi, A.; Panahi, S.; Chen, W. New hybrids of anfis with several optimization algorithms for flood susceptibility modeling. Water 2018, 10, 1210. [Google Scholar] [CrossRef]
- Gao, W.; Alsarraf, J.; Moayedi, H.; Shahsavar, A.; Nguyen, H. Comprehensive preference learning and feature validity for designing energy-efficient residential buildings using machine learning paradigms. Appl. Soft Comput. 2019, 84, 105748. [Google Scholar] [CrossRef]
© 2019 by the authors. Licensee MDPI, Basel, Switzerland. This article is an open access article distributed under the terms and conditions of the Creative Commons Attribution (CC BY) license (http://creativecommons.org/licenses/by/4.0/).

