1. Introduction
The beauty and proportion of the human face have always been an object of interest through the years, as evidenced by Greek sculptures, ancient Egyptian paintings, and even in prehistory [
1]. Some studies have also been carried on during the Renaissance period by well-known artists, such as Leonardo da Vinci [
2] and Michelangelo Buonarroti [
3], but it is from the 20th century that systematic studies focused on objective assessments began.
Several studies of facial aesthetics have focused on specific aspects, such as the role of the divine proportion legacy of ancient Greeks, [
4,
5,
6], the average intended as an instrument to delete imperfections [
7,
8], the average plus exaggerated sex-specific traits to discriminate between beauty and attractiveness [
9], and the relative importance of some traits of the face [
10]. The presence of a strong objective component in beauty assessment has been clearly shown by several experiments, including Iliffe’s [
11], Udry’s [
12] and Cunningham’s [
13].
Cultural influence on beauty assessment is very strong, as testified by different canons that have been adopted through the years to assess female beauty. During the Paleolithic period, statuettes of “Venus”, representing women, were sculpted in such a way that they looked full-figured to symbolize fecundation, fertility and regeneration [
14]. Ancient Egyptians considered a large forehead and well-defined mandibles attractive [
15]. On the contrary, Greeks preferred an oval facial shape for both men and women, and a forehead as small as possible to highlight the hair [
16]. In the middle age, there is evidence of a preference for larger foreheads and absence of wrinkles, even if the sign at the time was not considered ugly, as testified by contemporary positive reflections on grey hair [
17].
Cultural differences can also be found within the same period. In recent times, debates over femininity depicted by the media have been widely discussed [
18], suggesting that beauty relies on the eye of the beholder, but there are several experiments, including the above-mentioned, suggesting that beauty is assessed through quantitative tips, even if hidden, especially regarding the face.
As criteria for beauty assessment began to be presented to the scientific community [
19], several studies focusing on analyzing databases of attractive and common individuals have been conducted, from the identification of facial esthetic canons in Italian children in the deciduous and early mixed dentition [
20] to the soft-tissue analysis of adolescent boys’ and girls’ faces [
21]. There have also been studies on people of non-Caucasian ethnicity, such as Southern Chinese faces [
22]; nevertheless, women have been the most widely studied subset of the human population.
Several works show comparisons between
normal and
attractive women. The
normal term has been used in the literature to identify common, non-selected women, whereas
attractive is typically used to identify good-looking women, typically chosen among actresses [
23] or beauty contest participants [
24,
25]. Results appearing in these studies confirm the presence of objective elements defining beauty related to the concept of proportions between different parts of the face in terms of Euclidean distances and angular measurements. In those works, as in the current research, attractiveness is understood as the harmony between facial forms rather than the sexual impact on the observer.
Objective beauty would be the expression that fits best for defining the kind of attractiveness evaluated by human judges in beauty contests, which is the same faced by the current work. Nonetheless, it would be superficial to claim that beauty can be totally assessed from a quantitative point of view, thus it has been chosen to preserve the attractiveness acceptation intended in previously cited works in this field.
The medical field is the most interesting discipline in studying this topic, since some branches of surgery must intervene directly on face by modifying the shape, both for merely aesthetic and pathological reasons [
26]; therefore, it is not surprising that the study of two orthodontists, Peck and Peck [
27], was one of the first works aimed at discovering and gathering facial features.
Over the last two decades, there has been an incremental increase of 3D imaging, such as MRI, CT [
28] and stereophotogrammetry [
29,
30,
31], and 3D modelling [
32]. In this context, geometrical descriptors [
33] and landmarks [
34] proved to be highly effective tools, since they allow the observer to gather common traits that everybody shares to perform facial analysis. This evolution has provided the possibility of analyzing point clouds reproducing patients’ faces for diagnosis [
35,
36] and surgical intervention planning, for which handbooks are nowadays widely used [
37], but it has also allowed us to build virtual faces from scratch [
38]. Before the advent of 3D tools, face operation planning evaluations relied on two-dimensional images acquired on sagittal, coronal, and axial planes [
39,
40].
The idea for this research project was conceived to make a socially-responsible contribution to this field. In past months, a partnership with the maxillofacial department of Molinette hospital in Turin allowed the authors of this paper to review all findings linked to facial reconstruction due to pathological problems. Very general guidelines for tissue reconstruction after a surgical intervention exist, but they are not a valuable auxilium, and physicians need more accurate indications. Obviously, the reconstruction target is to obtain a good-looking face, and the present work has been directed on that need. Nonetheless, surgeons’ experience is irreplaceable.
Facial proportions and beauty are strongly interconnected concepts. However, while proportions can be evaluated mainly from a 3D point of view, beauty assessment is more complex; indeed, facial expression [
41] and all elements perceivable with color information cannot be ignored [
42]. Also, 2D information has been used to manipulate textures [
43], figuring out that not only attractiveness, but also other individual characteristics, such as age and health, are differently perceived because of colors cues [
44,
45]. Skin is the most studied element in terms of color and texture, because of the wide percentage of facial surface which recovers [
46,
47,
48], and it has been proved that factors such as makeup and photo quality have a strong influence on attractiveness [
49].
Some databases of human faces were built to be analyzed and to provide new suggestions for further feature extraction and proportion studies, but also to validate results already obtained. Two available databases are the 3D Facial Norm (3DFN) [
50] and the Bosphorus sets, employed in the development of the current research work, which provides faces belonging to more than one hundred subjects in various poses, expressions and different types of occlusions [
51].
The present work gathers facial measures that have been identified in previous studies as representative of female face attractiveness with the purpose of classifying female faces. After that, the Bosphorus, meaning a database of normal women, has been used to test whether the final set of canons is suitable and sufficient for women’s attractiveness evaluation. The novelties in this work are the development of a methodology capable of putting together data identified by different sources in the literature in order to obtain an expanded set of measures comprehensive of all the works published up-to-now, and to provide a ranking of the measures included in the expanded set to understand which are the most significant in attractiveness assessment. Results confirm that the evaluation of selected measures corresponds closely to human assessments, providing the opportunity to quantitatively analyze women’s beauty; moreover, a ranking showing the influence of measures in women’s facial beauty and proportion assessment has been drawn up. The importance of ratios between measures and the higher relevance of the vertical measures compared to the horizontal have been highlighted.
2. Materials and Methods
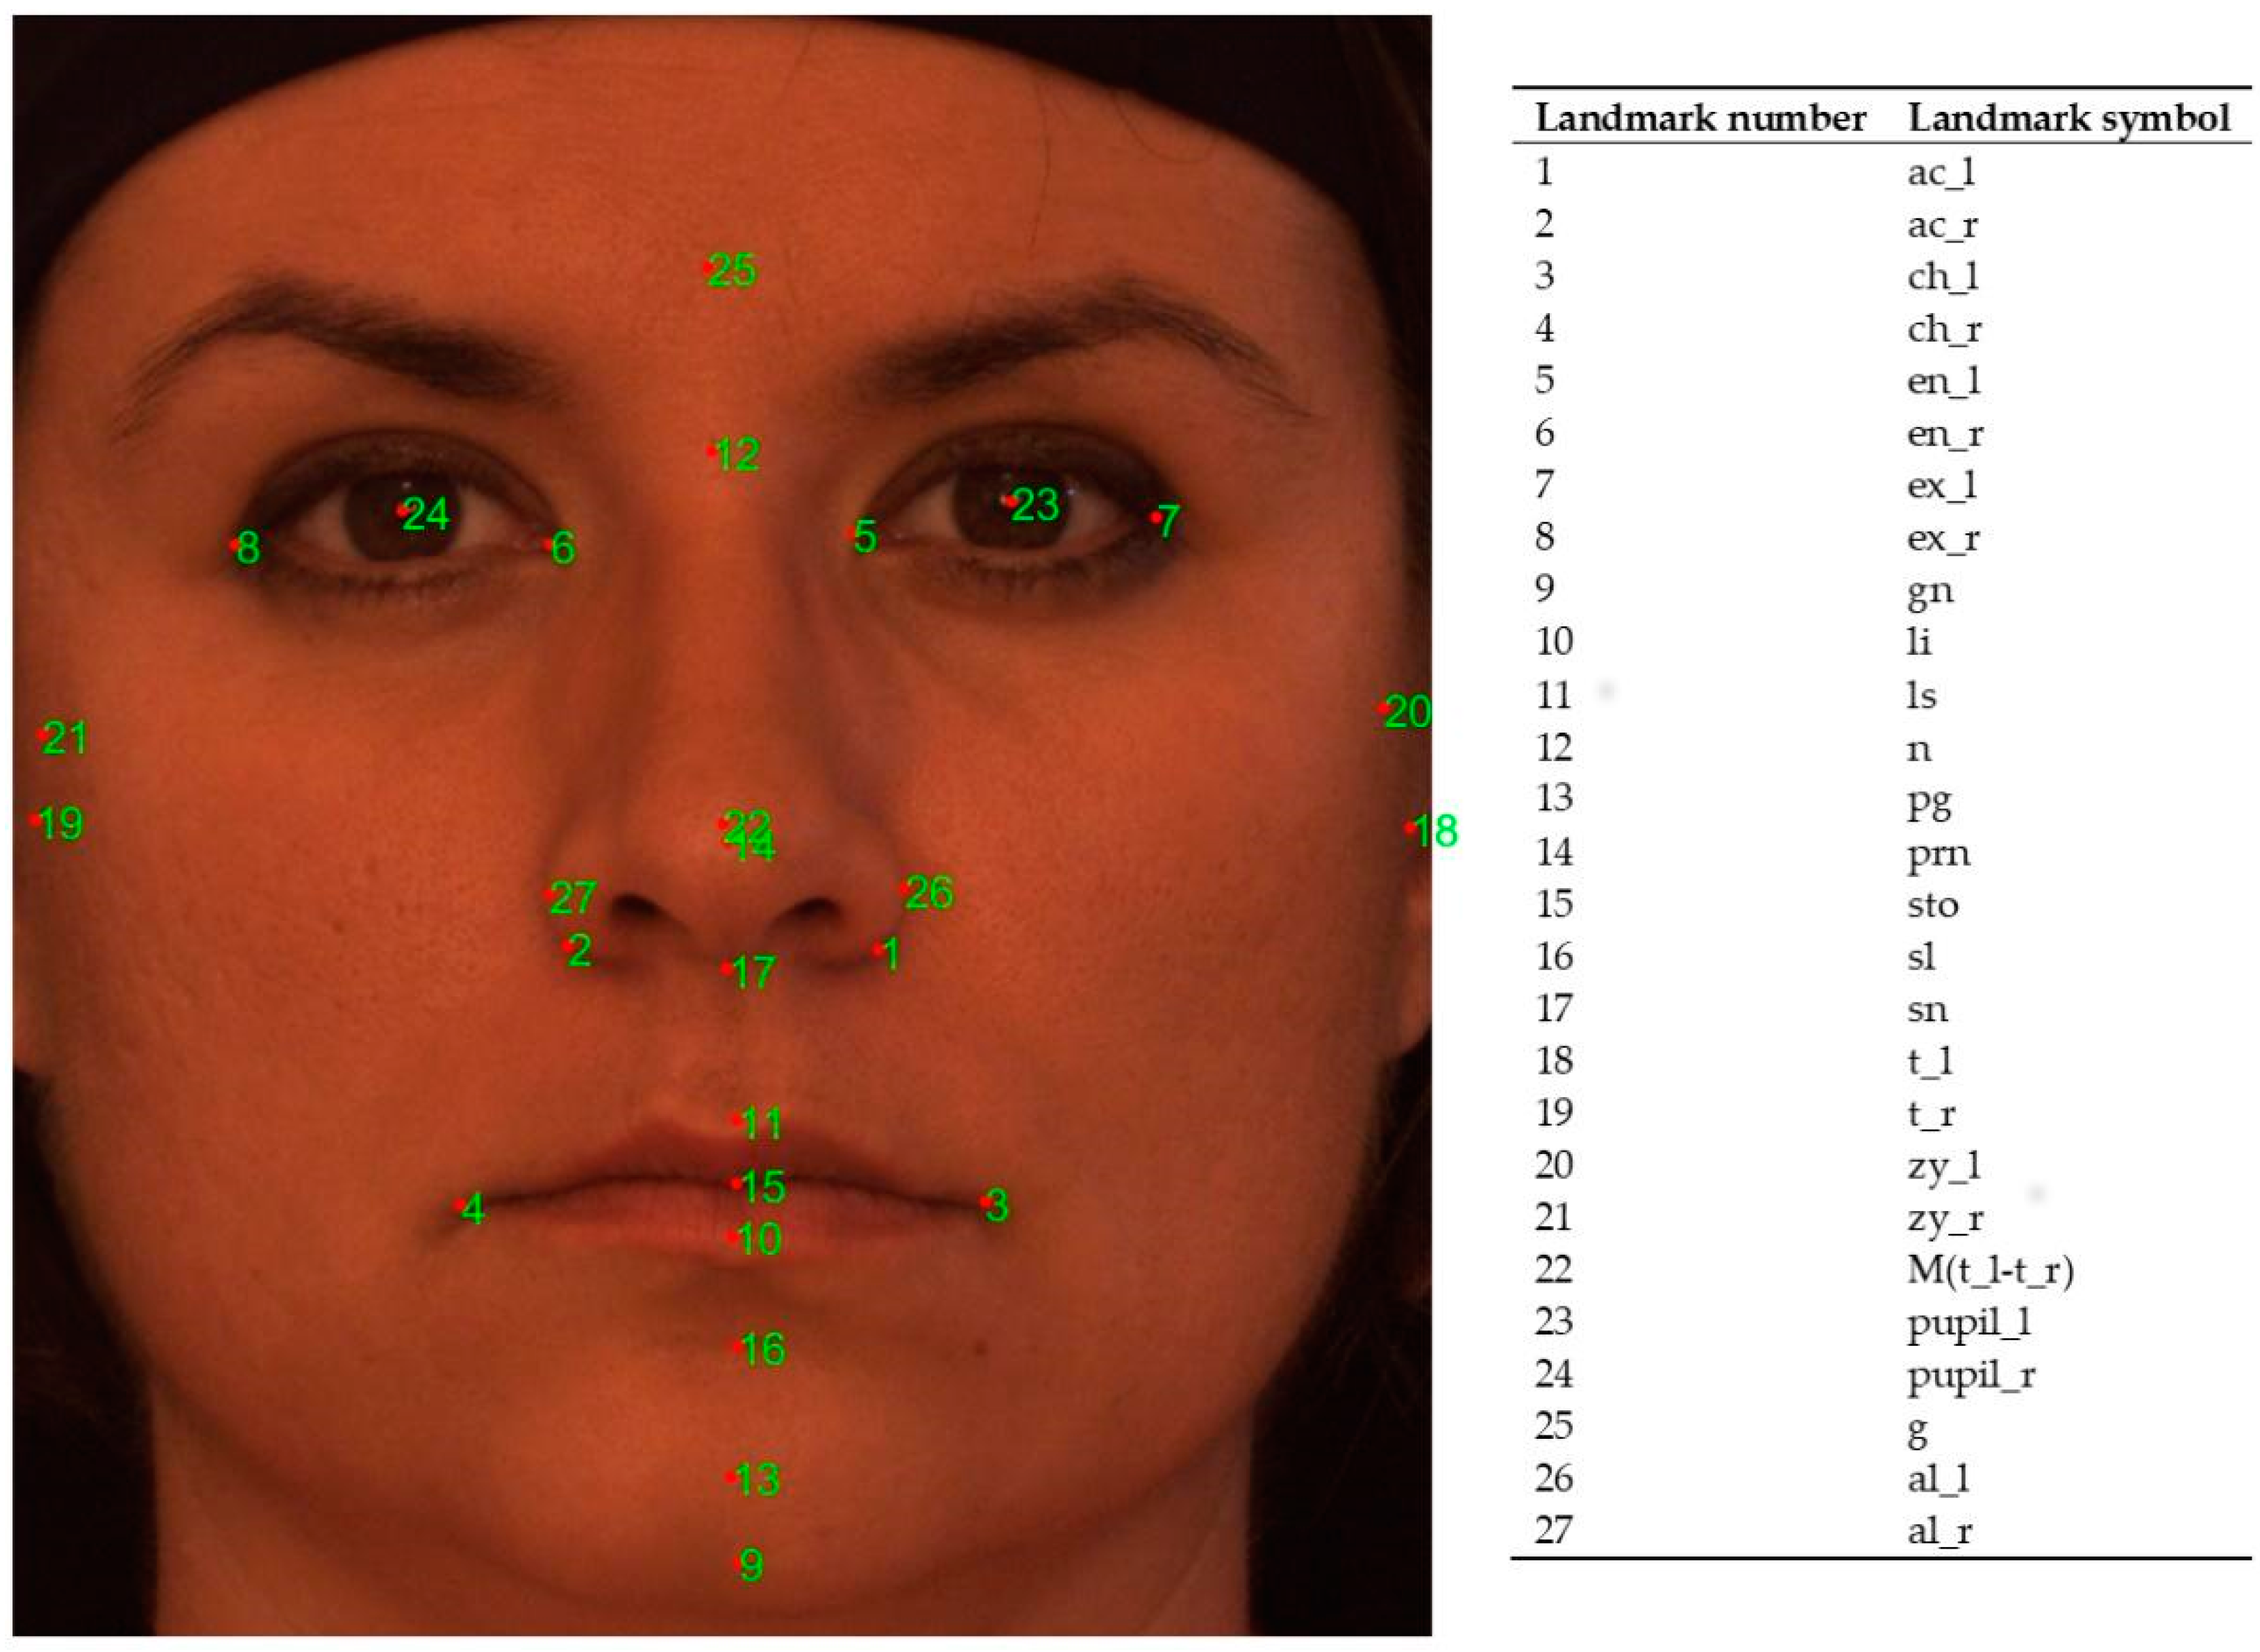
Face analysis is the discipline that studies human faces based on the identification of landmarks, specific points common to everyone that can be identified on the face. Landmarks can be recognized on the hard tissue through palpation or on the soft tissue through observation, even if some of the landmarks positioned on the soft tissue depend on landmarks positioned on the hard tissue. In order to evaluate women’s attractiveness from a quantitative point of view, an expanded set of measures, relying on landmark positions, has been defined.
The most difficult step in evaluating female beauty is to identify a ground truth that allows us to make considerations on measures of women’s faces. Significant experiments proving the presence of a strong objective component have been conducted; Iliffe’s [
11] and Udry’s [
12] works showed that almost identical classifications are obtained when people are asked to judge and rank the beauty in specific photo galleries, as well as Cunningham’s [
13], which stated that beauty cannot be defined as a quality resting only in the eye of the beholder.
In the past decades, several works aiming at establishing which human facial traits influence an observer’s assessment of beauty have been conducted. Works considered as the most incisive in this field, thus taken into greater account in the present work, have been carried out by Farkas et al. [
52], Ferrario et al. [
23], Sarver et al. [
37], Sforza et al. [
24] and Galantucci et al. [
25].
Each of those works has been carried out via live-positioning landmarks on female subjects before the acquisition of the point cloud required to compute measures. Manual allocation directly on subjects has been chosen in order to achieve the best accuracy possible. Acquisitions have been made using an RGB-D camera, namely cameras which allow to acquire both color and depth images. Subjects were actresses, participants to beauty contests, and common women; the latter have been chosen to validate the results. Going deeper into detail, the purpose of computing and comparing facial measures has been to highlight the correlation among some measures in the set of
attractive women and the differences with the same measures in the set of
normal women. Whenever the difference has been evaluated as significant, the measure related to that difference has been classified as influential for women’s facial beauty and proportion assessment. As it can be seen in
Table 1, the vast majority of measures belonging to the expanded set show a statistically significant difference between Galantucci’s
attractive and
normal women datasets.
All the information found by those studies were gathered here to obtain an expanded set of measures able to evaluate women’s attractiveness; then, the Bosphorus database was used to validate the expanded set of measures, comparing it with qualitative evaluations issued by human observers. There are 110 subjects in Bosphorus database, but only the 44 selected women have been analyzed in this work.
The landmark framework considered in this work is reported in
Table 2 and shown in
Figure 1.
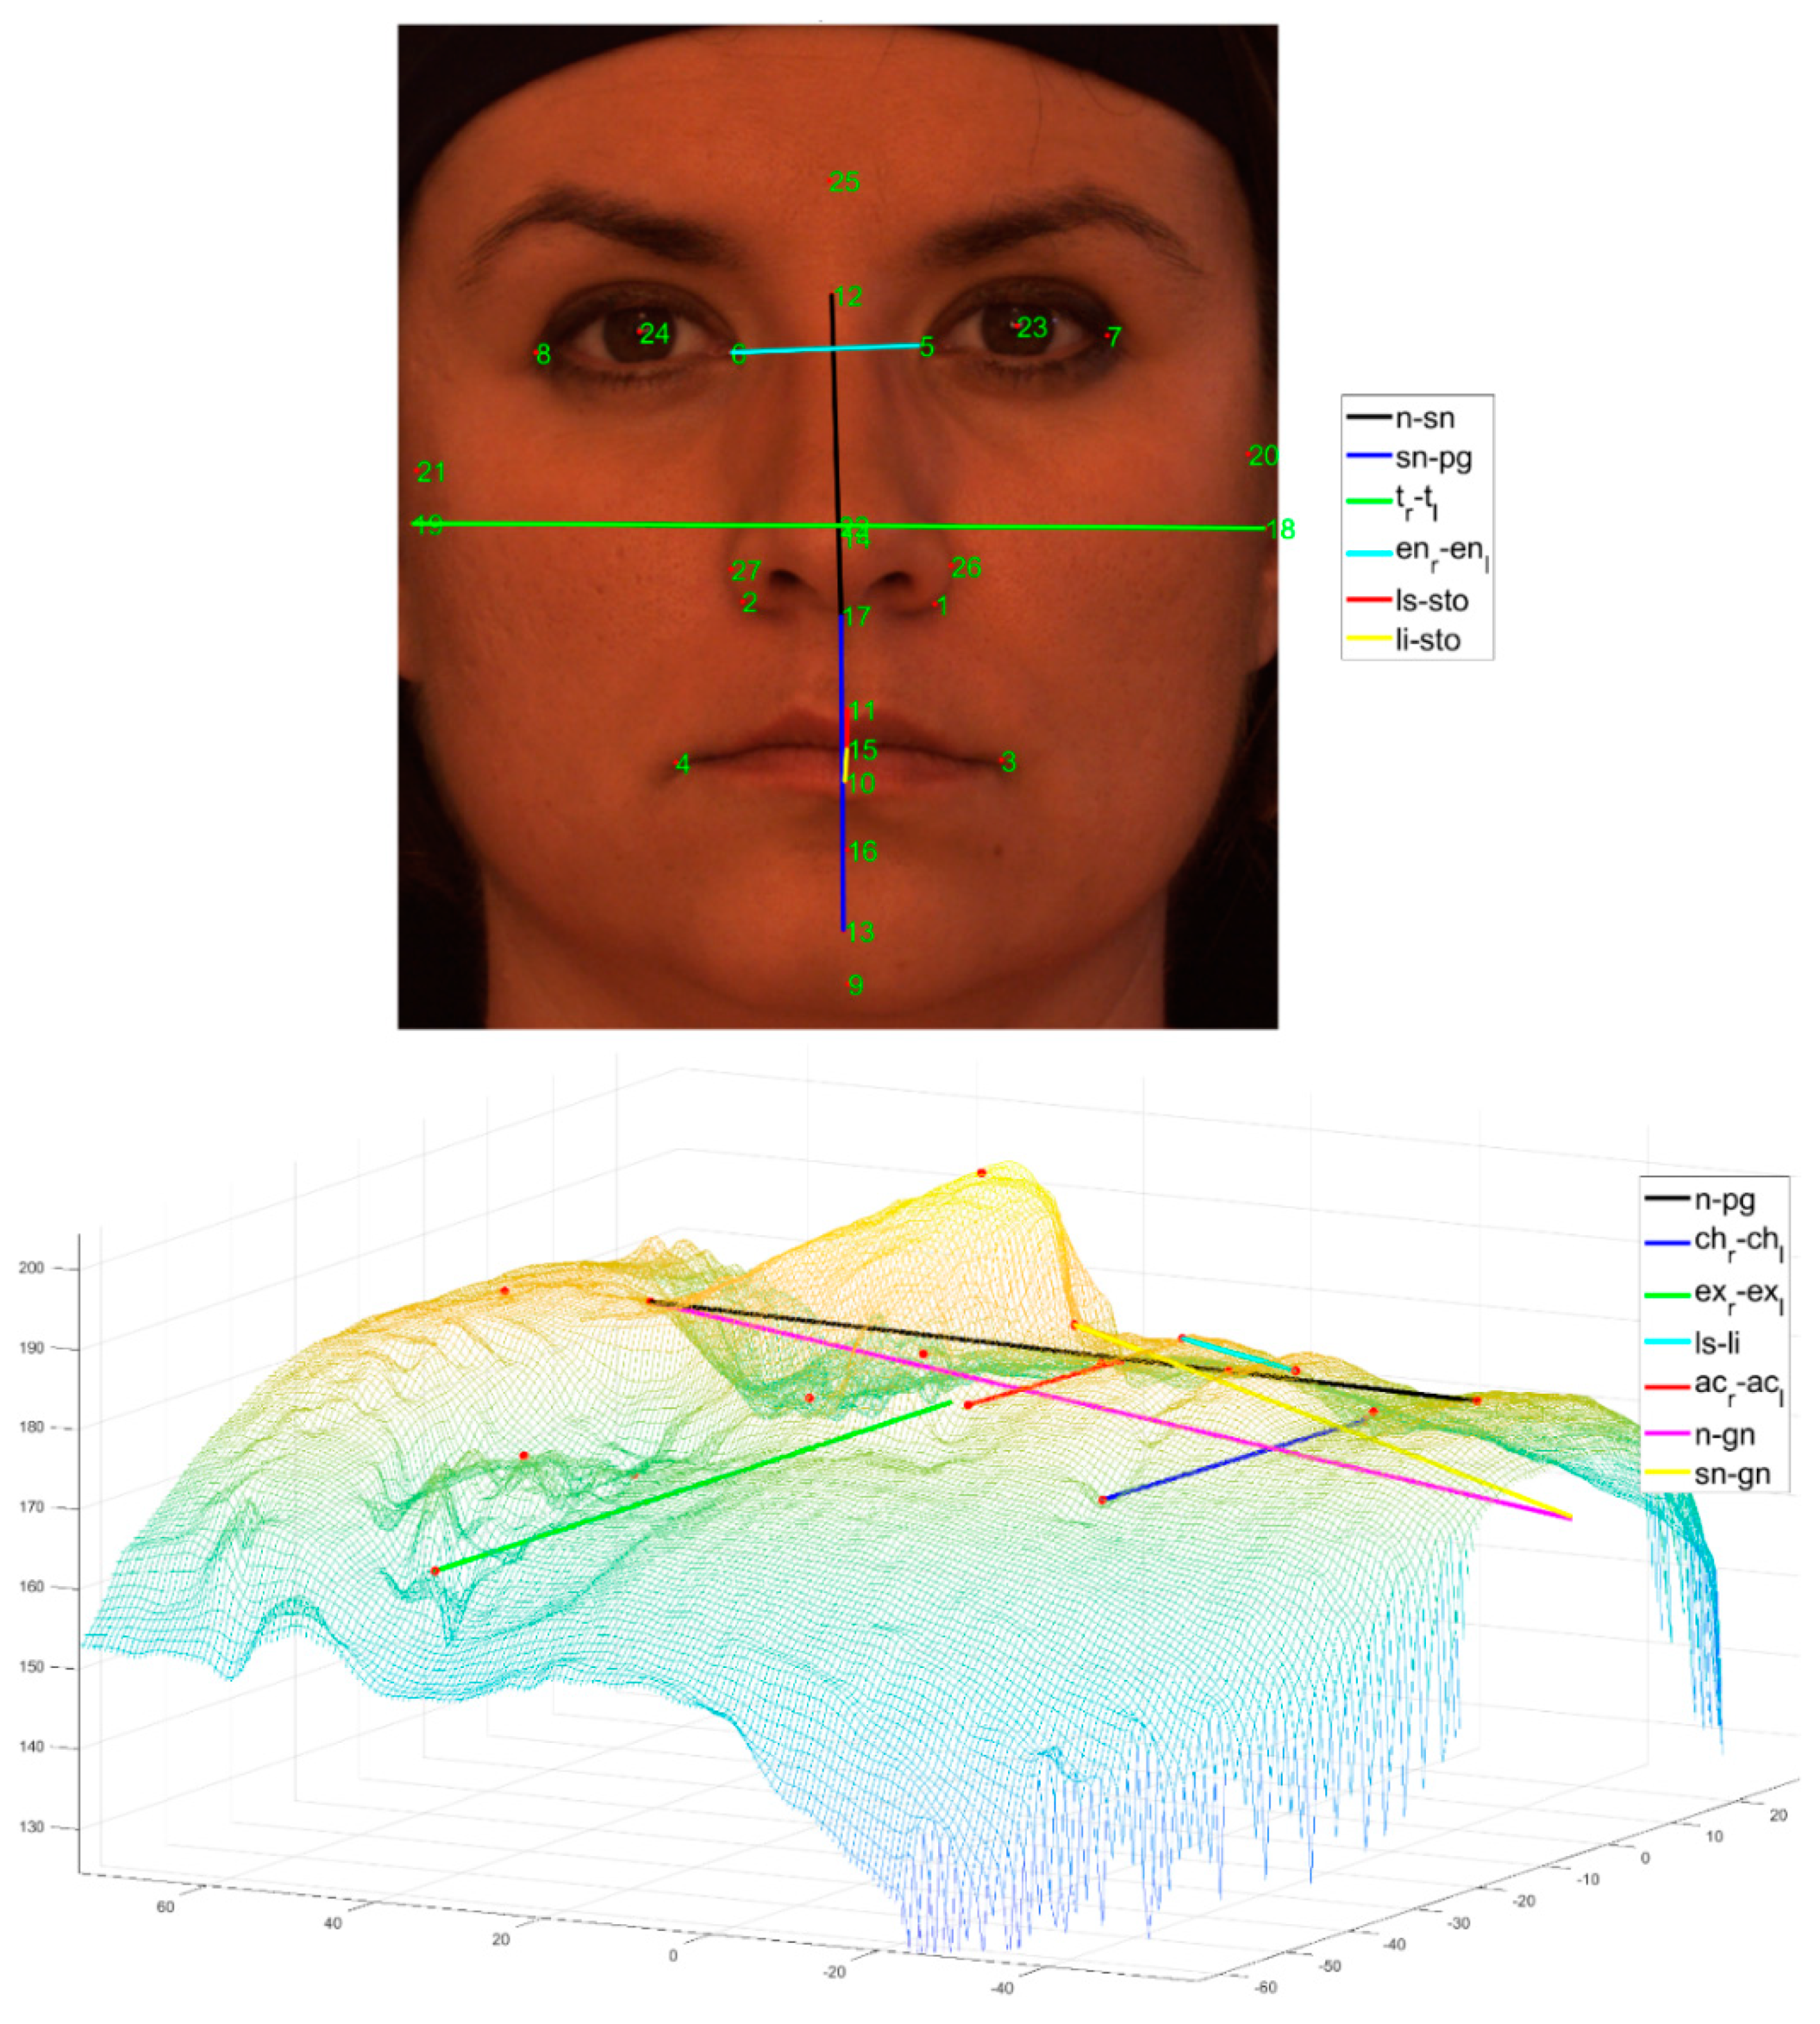
All the measures considered in this analysis have been acquired employing the above-mentioned landmarks and can be subdivided into three categories: Linear, angular, and ratios.
Linear measures described in
Table 3 and shown in
Figure 2 are Euclidean distances between two landmarks or between a landmark and another specific point. More specifically, one of those specific points is the point on the
E-line that minimizes the distance with
Labiale superius (or
Labiale inferius), where the
E-line is the line passing through the
Pronasal and the
Pogonion.
Angular measures described in
Table 4 and shown in
Figure 3 are angles subtended by a vertex identified by three landmarks or, exceptionally for the
Interlabial distance, by two lines lying on the same plane and identified by four landmarks, two for each line.
Ratios between linear distances (
Table 5) allow us to perform quantitative evaluations of proportions. The face analysis moves the focus from the local to the global point of view, since not only the absolute value of one single measure is considered, but rather the overall effect of two measures. Intuitively, ratios are the quantitative way to represent the big picture.
As a result of the literature review, twenty-nine measures have been identified. The present work employs data from the Bosphorus database, namely women’s pictures, 3D models, and relative landmark coordinates. Because all the studies previously cited were carried out by research groups with different expertise, slightly different sets of landmarks have been adopted. A landmarking expert identified some missing landmarks on 2D pictures and on 3D models on the Bosphorus database in order to complete the landmark framework. Nonetheless, some landmarks had to be discarded because they relied on the hard tissue, and the only way to identify them was through palpation. Thus, it has not been possible to include some measures into the expanded set. An example is the zygion (zy), which is the most lateral point on the soft tissue contour of each zygomatic arch.
The works of Galantucci et al. [
25], Farkas et al. [
52], Sarver et al. [
37], Ferrario et al. [
23] and Sforza et al. [
24] provided mean value and standard deviation for every measure. Some measures are common to different sources, even if the related mean value and standard deviation are slightly different depending on the study. The small sample size of
attractive sets of women is due to the complexity of finding available databases providing data, i.e., not only images, but also 3D models and information like landmarks position. Indeed, one of the purposes of the present study is to merge the information coming from these sources (
Figure 4) and build an overall measuring methodology.
A score, the result of the sum of penalties, has been computed for each woman present in the Bosphorus database. For each measure, if the value of the considered woman was within the range
mean value ± standard deviation, no penalty has been added. For the sake of clarity, it has to be highlighted that the mean value taken into consideration is the mean value of the measures belonging to the
attractive sets of women and not the mean value referred to a generic non-selected group of women (
normal women). Conversely, if the value was out of range, a penalty has been added, and the amount of penalty (1) has been computed as the ratio between the distance of the measure from the mean value normalized with the mean value.
In the case of more than one mean value, since there is more than one source in the literature that refers to the same measure, the computed penalty value has been then multiplied for weight (2).
This weight has been introduced to consider the different degree of confidence assigned to different studies found in the literature. Remembering that in those studies canons have been extracted from sets of attractive women, it was considered essential to evaluate more robustly the analysis using a greater number of subjects. Thus, the weights have been computed as the ratio between the number of women involved in a single study and the sum of all the women involved in all the studies related to the same measure. For instance, consider a hypothetical measure identified by two studies, A and B, which involves x and y women, respectively. The weight related to the study A will be x/(x+y), while the weight related to the study B will be y/(x+y).
After all the scores were obtained, a cluster analysis was performed through the usage of
k-means methodology, subdividing the datasets into five classes. The purpose of this step was to identify which women were closer to the well-proportioned standard face in terms of compliance with the measures in the expanded set; in other words, considering the descending order adopted, faces belonging to class 5 are closer to the well-proportioned standard face than the faces belonging to class 1. The number of classes has been chosen to have a correspondence with the Likert scale. Indeed, in parallel, a qualitative evaluation of the women present in Bosphorus has been made by a focus group using precisely the Likert scale. A comparison between the results obtained using the developed methodology and the qualitative evaluation performed by human observers has been performed (
Figure 5).
Finally, the results of the developed methodology in terms of cluster subdivision have been analyzed to rank the influence of each measure of the expanded set in women’s facial beauty and proportion assessment.
3. Results
The measures selected from literature and included in the expanded set are reported in
Table 6. For every measure, it is possible to have more than one mean value and one standard deviation due to the possibility of retrieving the same measure from different sources in literature; the last column reports the reference number of the considered source.
After the expanded set definition, each of the forty-four women in Bosphorus database were measured, and the scores were computed summing all the penalties. Scores were subdivided into five clusters so that it is easy to identify women’s faces closer to the well-proportioned standard face, remembering that clusters are arranged in descending order; namely, faces belonging to cluster 5 are the closest to the well-proportioned standard face, and conversely, faces belonging to cluster 1 are the furthest.
Hereafter, a focus group composed by 10 people, 6 men and 4 women aged between 19 and 39 years old met up to evaluate Bosphorus women attractiveness. For every face, a discussion between focus group members led to a final score. In other words, the whole group provided a single score for each face analyzed. The aim of that was to compare the developed methodology with human judgment. The results showed that the cluster label and the Likert’s scale label are the same; namely, the difference between those two values equals 0 for 15/44 women (very high correspondence); the difference is 1 for 16/44 women (high correspondence); the difference is 2 for 9/44 women (moderate correspondence); the difference is 3 for 3/44 women (low correspondence); and the difference is 4 for 1/44 women (very low correspondence).
Very high correspondence means that the result of the method matches the focus group’s outcome (a woman with very high correspondence label has been judged in the same way both by the method and by the focus group).
All those results are reported in
Table 7.
Finally, results obtained through cluster analysis were more deeply analyzed. The purpose of this step was to rank the measures to understand which are the most important in women’s facial beauty and proportion assessment. In particular, the focus was moved on cluster 4 and cluster 5, which contain
attractive and
very attractive women, respectively. Knowing the cardinality of each cluster, that is 17 if clusters 4 and 5 are taken together, values out of range have been computed for each measure; a measure must be considered influential if the smallest possible number of women has that measure out of range. For instance, referring to
Table 8, it is possible to notice that the Euclidean distance
ls-sto is the most influential measure, because only two women (12%) belonging to cluster 4 and cluster 5 are out of range; conversely,
ch_r-ch_l is one of the least influential measures because only 5 out of 17 women are within range.
4. Discussion
Results provided by literature analysis have led to the first outcome of this research, namely the expanded set of measures, each of which is characterized by a mean value and standard deviation. In the literature, a measure is considered relevant for women’s facial attractiveness if a statistically significant number of attractive women possess similar values of the same measure and, conversely, that measure assumes different values in subjects belonging to the normal woman set. The critical point is to define a ground truth, i.e., a set of measures distinctive for attractive women. All the studies carried out in this field agree upon considering attractive those women’s faces that are commonly positively evaluated in terms of facial beauty and proportion, and thus famous actresses or beauty contest participants, especially those that move on to the final stage of national competitions.
The present work has focused on gathering measures validated in past studies, building the expanded set of measures defined on facial landmarks and analyzing a public database of normal women, the Bosphorus. Unfortunately, some of the landmarks used in the literature were not present in the set of data of the Bosphorus database. For this reason, an expert has manually added those missing landmarks lying on soft tissue, but some of the hard tissue landmarks have not been considered due to the impossibility of identifying them without live palpation. Consequently, a limited set of measures that could have been included in the expanded set has been discarded.
In order to analyze the Bosphorus, a methodology able to integrate information provided by different sources was required. Thus, the algorithm based on the penalty mechanism has been developed, and the results have been clustered to provide the possibility of classifying faces into 5 different levels. The cluster numbering is from 5–1, that means it ranges from the most compliance with the well-proportioned standard face to the least. The cluster numbering is chosen this way so that the opportunity of comparing quantitative outcome and qualitative assessment is guaranteed. Likert’s 5-level scale has allowed us to analyze the correspondence between the developed methodology and people’s assessments.
Obtained results displayed in
Figure 6 show the levels of correspondence in women’s evaluation from very high to very low, namely from a 4-level difference to a 0-level difference between quantitative and qualitative evaluation. The 31/44 means slightly more than 70%, obtained the summing of high and very high correspondence, justifying the theories mentioned in the introduction stating the presence of objective elements that are unconsciously but incontrovertibly considered in evaluating women’s attractiveness.
Cluster analysis has led this study to discover part of those elements in terms of proportions between significant measures, ranking them from the most to the least influential. Some interesting observations have arisen from the ranking analysis. Firstly, vertical measures are typically more meaningful than the horizontal: Some examples of influential vertical measures are the thickness of the upper lip (ls-sto), the height of the central part of the face (n-sn), and the height of the lower part of the face (sn-gn). Going deeper into the detail, the lower part of the face in attractive women resulted as higher than the central part, coherently with the fact that if they have identical values, faces appear rounded, a characteristic not considered attractive. The upper lip was more meaningful than lower lip, but this does not mean it should be greater; rather, it means that it is more ordinary to have a full lower lip, while to have also a full upper lip is more uncommon, thus it is a peculiar feature of attractiveness. The angle between the two exterior corners of the eyes and the nasion, i.e., the point which separates the upper third of the face and the middle third of the face, (ex_l-n-ex_r), and the mouth width (ch_r-ch_l) at the end of the table are some examples of less meaningful horizontal measures. This does not retract the importance of mouth width in women’s faces assessment; simply, a not-so-relevant difference in mouth width between attractive and normal women has been shown by the analysis. Secondly, beauty turned out to be strictly connected to proportions; 5 out of 7 ratios present in the expanded set of measures are on the top half of the ranking, confirming that women’s beauty and well-proportioned faces are also given by relationships between measures, thus they involve a holistic process. Another indication is the relatively poor importance of the facial width absolute value, t_r-t_l, compared with the ratio between facial width and facial height, (t_r-t_l)/(n-pg), ranked in the top 10 most influential measures.
In total, 70% of high and very high correspondence between quantitative and qualitative evaluation is a not neglectable result, but the 30% non-similarity of the results needs to be investigated in future research. A larger set of attractive and normal women would allow us to enlarge the expanded set of measures, as well as the opportunity of live-acquiring all the needed landmarks, which would allow us to have uniform data in term of colors, poses, and expressions that could be more properly evaluated by humans. Moreover, texture analysis in terms of eye color and skin imperfections could further thin that percentage of non-correspondence and bridge the gap between perceived beauty and facial proportions.
5. Conclusions
The present study has been carried on considering experimental evidence proving that beauty assessment is not only subjective, but also relies on objective elements.
Several previous studies have identified relevant measures to assess women’s facial beauty and proportion, comparing sets of attractive and normal women by measuring Euclidean distances, and angular and ratio values; measures have been computed relying on landmarks live-identified on subject faces. All these works have considered different sets of measures to find differences in the normal and attractive populations.
The importance of the attractive women dataset size is evidenced by the development of the methodology, which is penalty-based. That methodology has been developed to consider data provided by different sets of attractive women, in order to consider a larger number of measures. Future work should focus exactly on that aspect. In the literature there is a lack of attractive women datasets, and establishing a larger database will allow us to deepen the analysis related to measures peculiar of attractiveness.
The current work has defined an expanded set of measures gathering all information presented in the literature and a methodology to merge the results and to classify faces. For each woman, the methodology provides a score, computed as a sum of penalties, and each penalty is given when a woman’s measure is not in the range identified by mean value and standard deviation. That procedure has been then used on the set of normal women of the Bosphorus public database, and after a cluster analysis, it has been possible to classify women’s faces considering their distance from the well-proportioned standard face, i.e., the expanded set of measures.
After that, a deeper investigation on results provided by the cluster analysis has permitted us to rank the measures from the most to the least influential, to understand which the most considered measures in women’s’ beauty assessment is. Vertical Euclidean distances were shown to be very impactful, as well as ratio measures; indeed, the direct comparison between measures resulted in being even more significant than the single measure value, as shown by the facial width. Upper lip thickness proved to be the most meaningful measure in the mouth area.
The present work could make a significant contribution to female beauty and proportion assessment and proposes some research hints for future works on female attractiveness, but also for other studies that have been discouraged by the misconception of considering beauty something merely, or mainly, subjective.


