Combustion Process of Canola Oil and n-Hexane Mixtures in Dynamic Diesel Engine Operating Conditions

 , , , and
Abstract
:1. Introduction
2. Materials and Methods
2.1. Fuels Tested
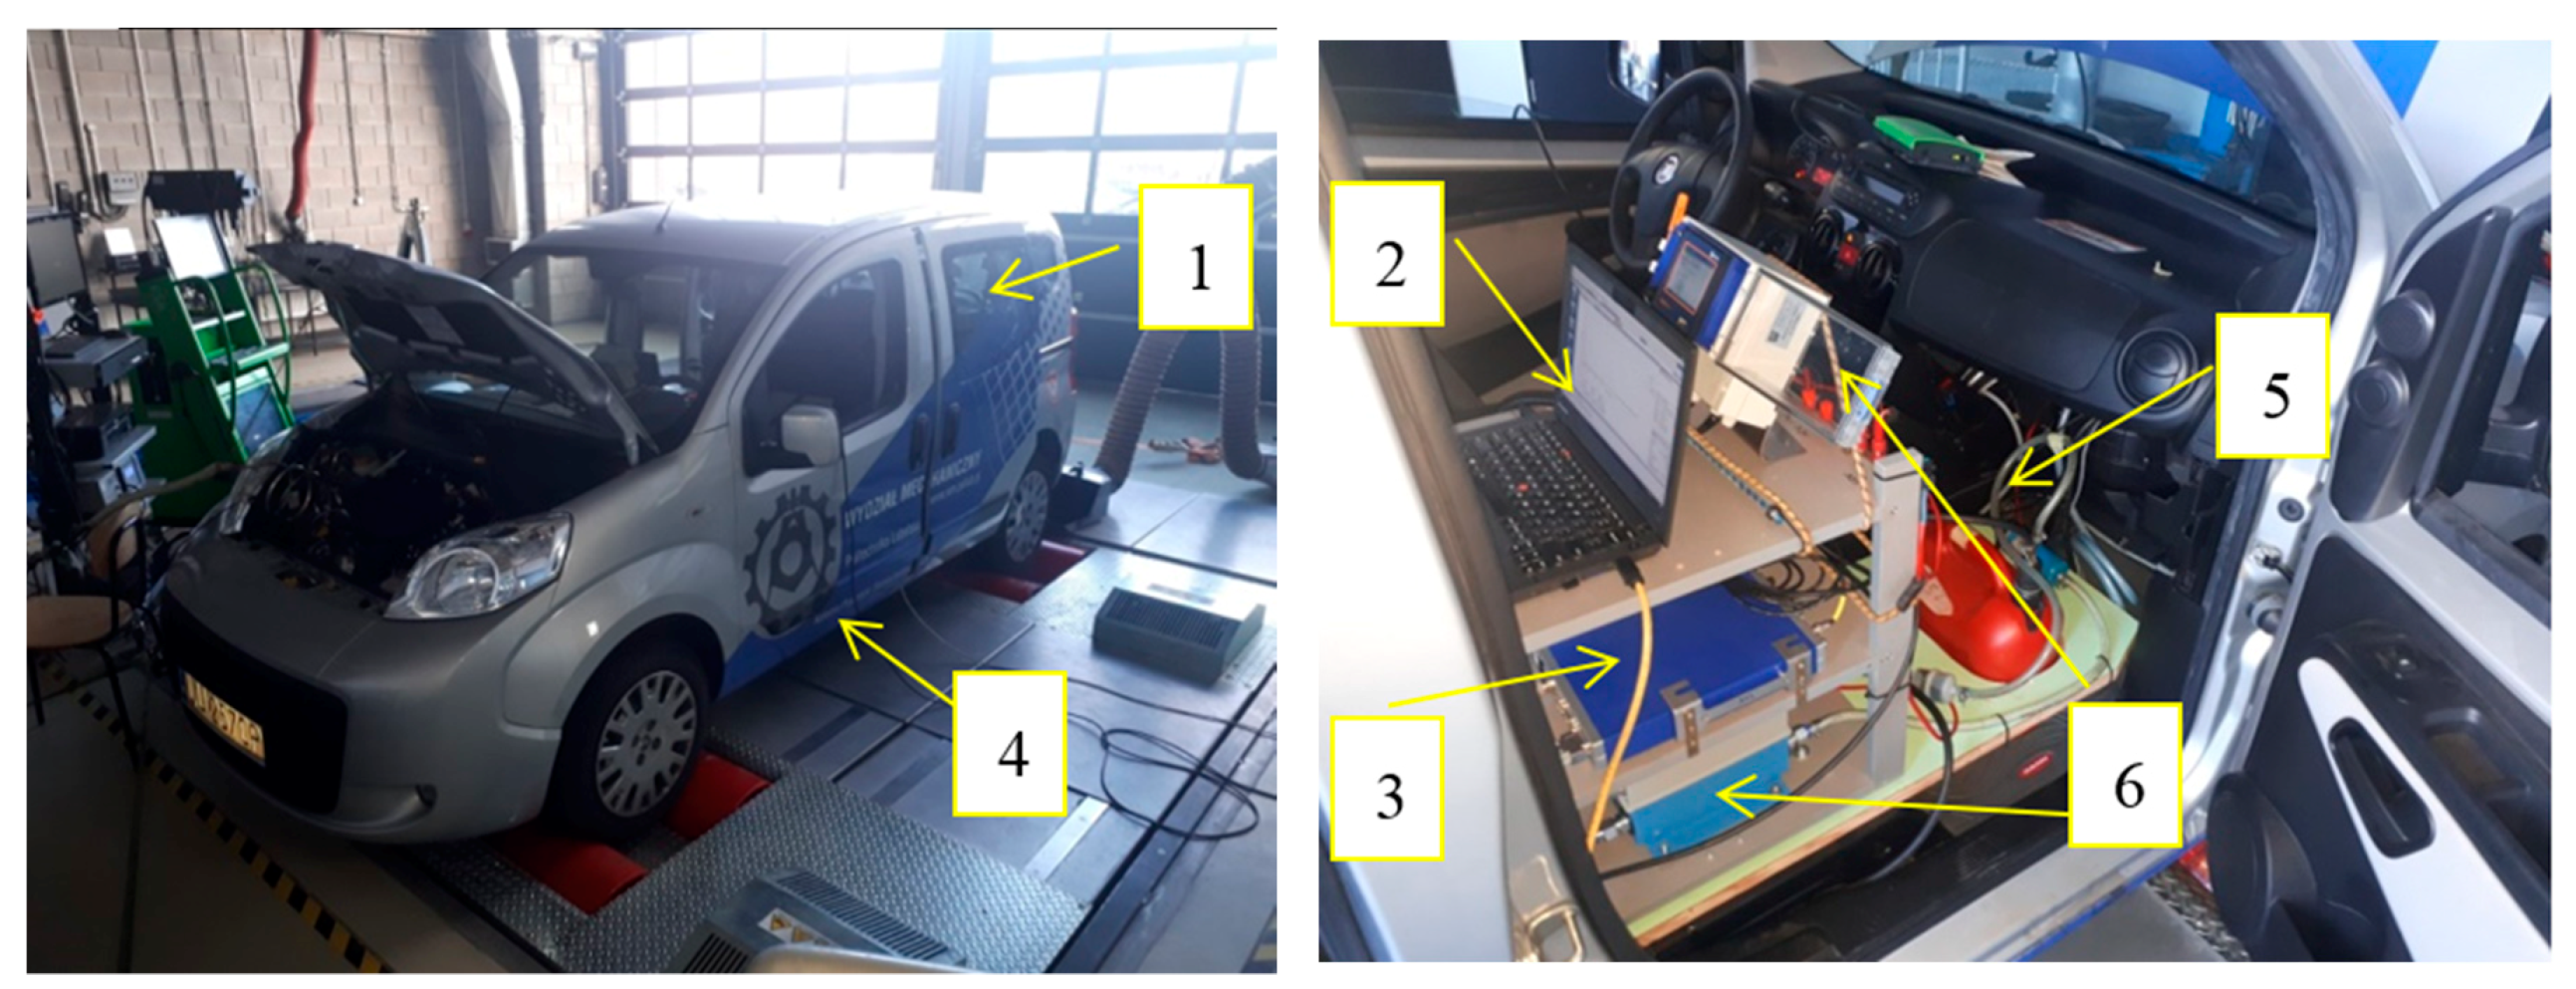
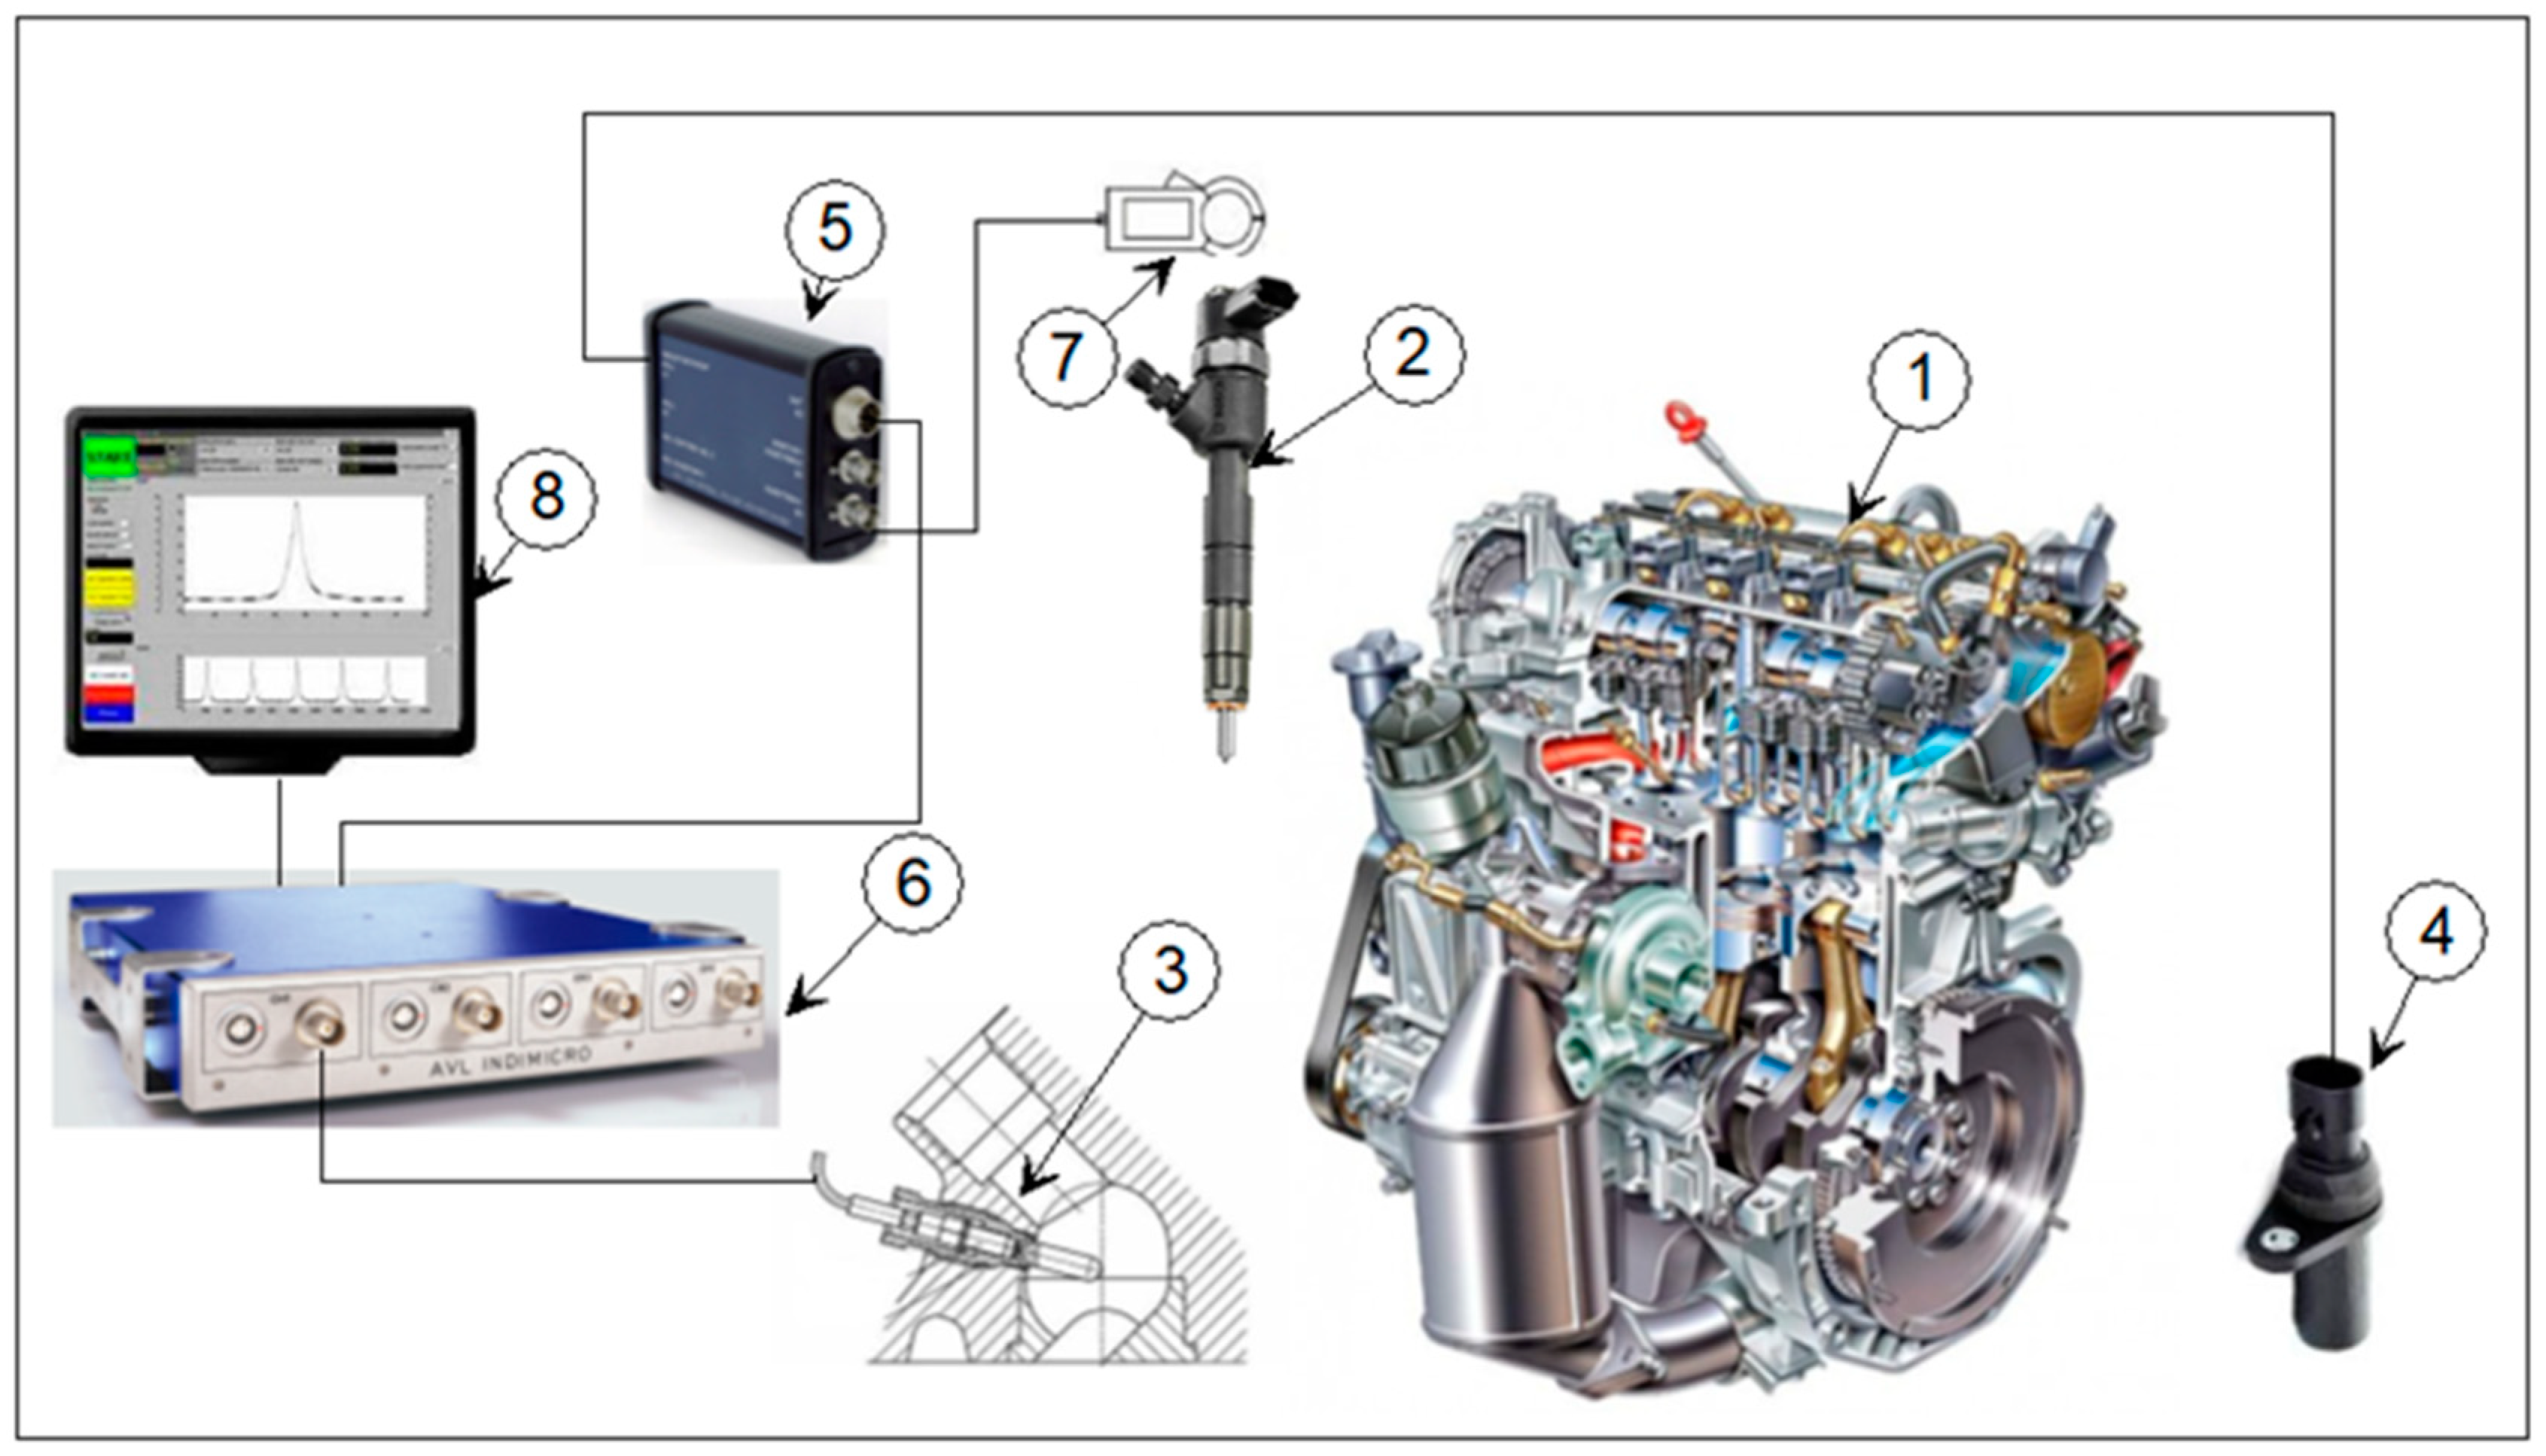
2.2. Research Methodology and Research Station
3. Results
4. Discussion
5. Conclusions
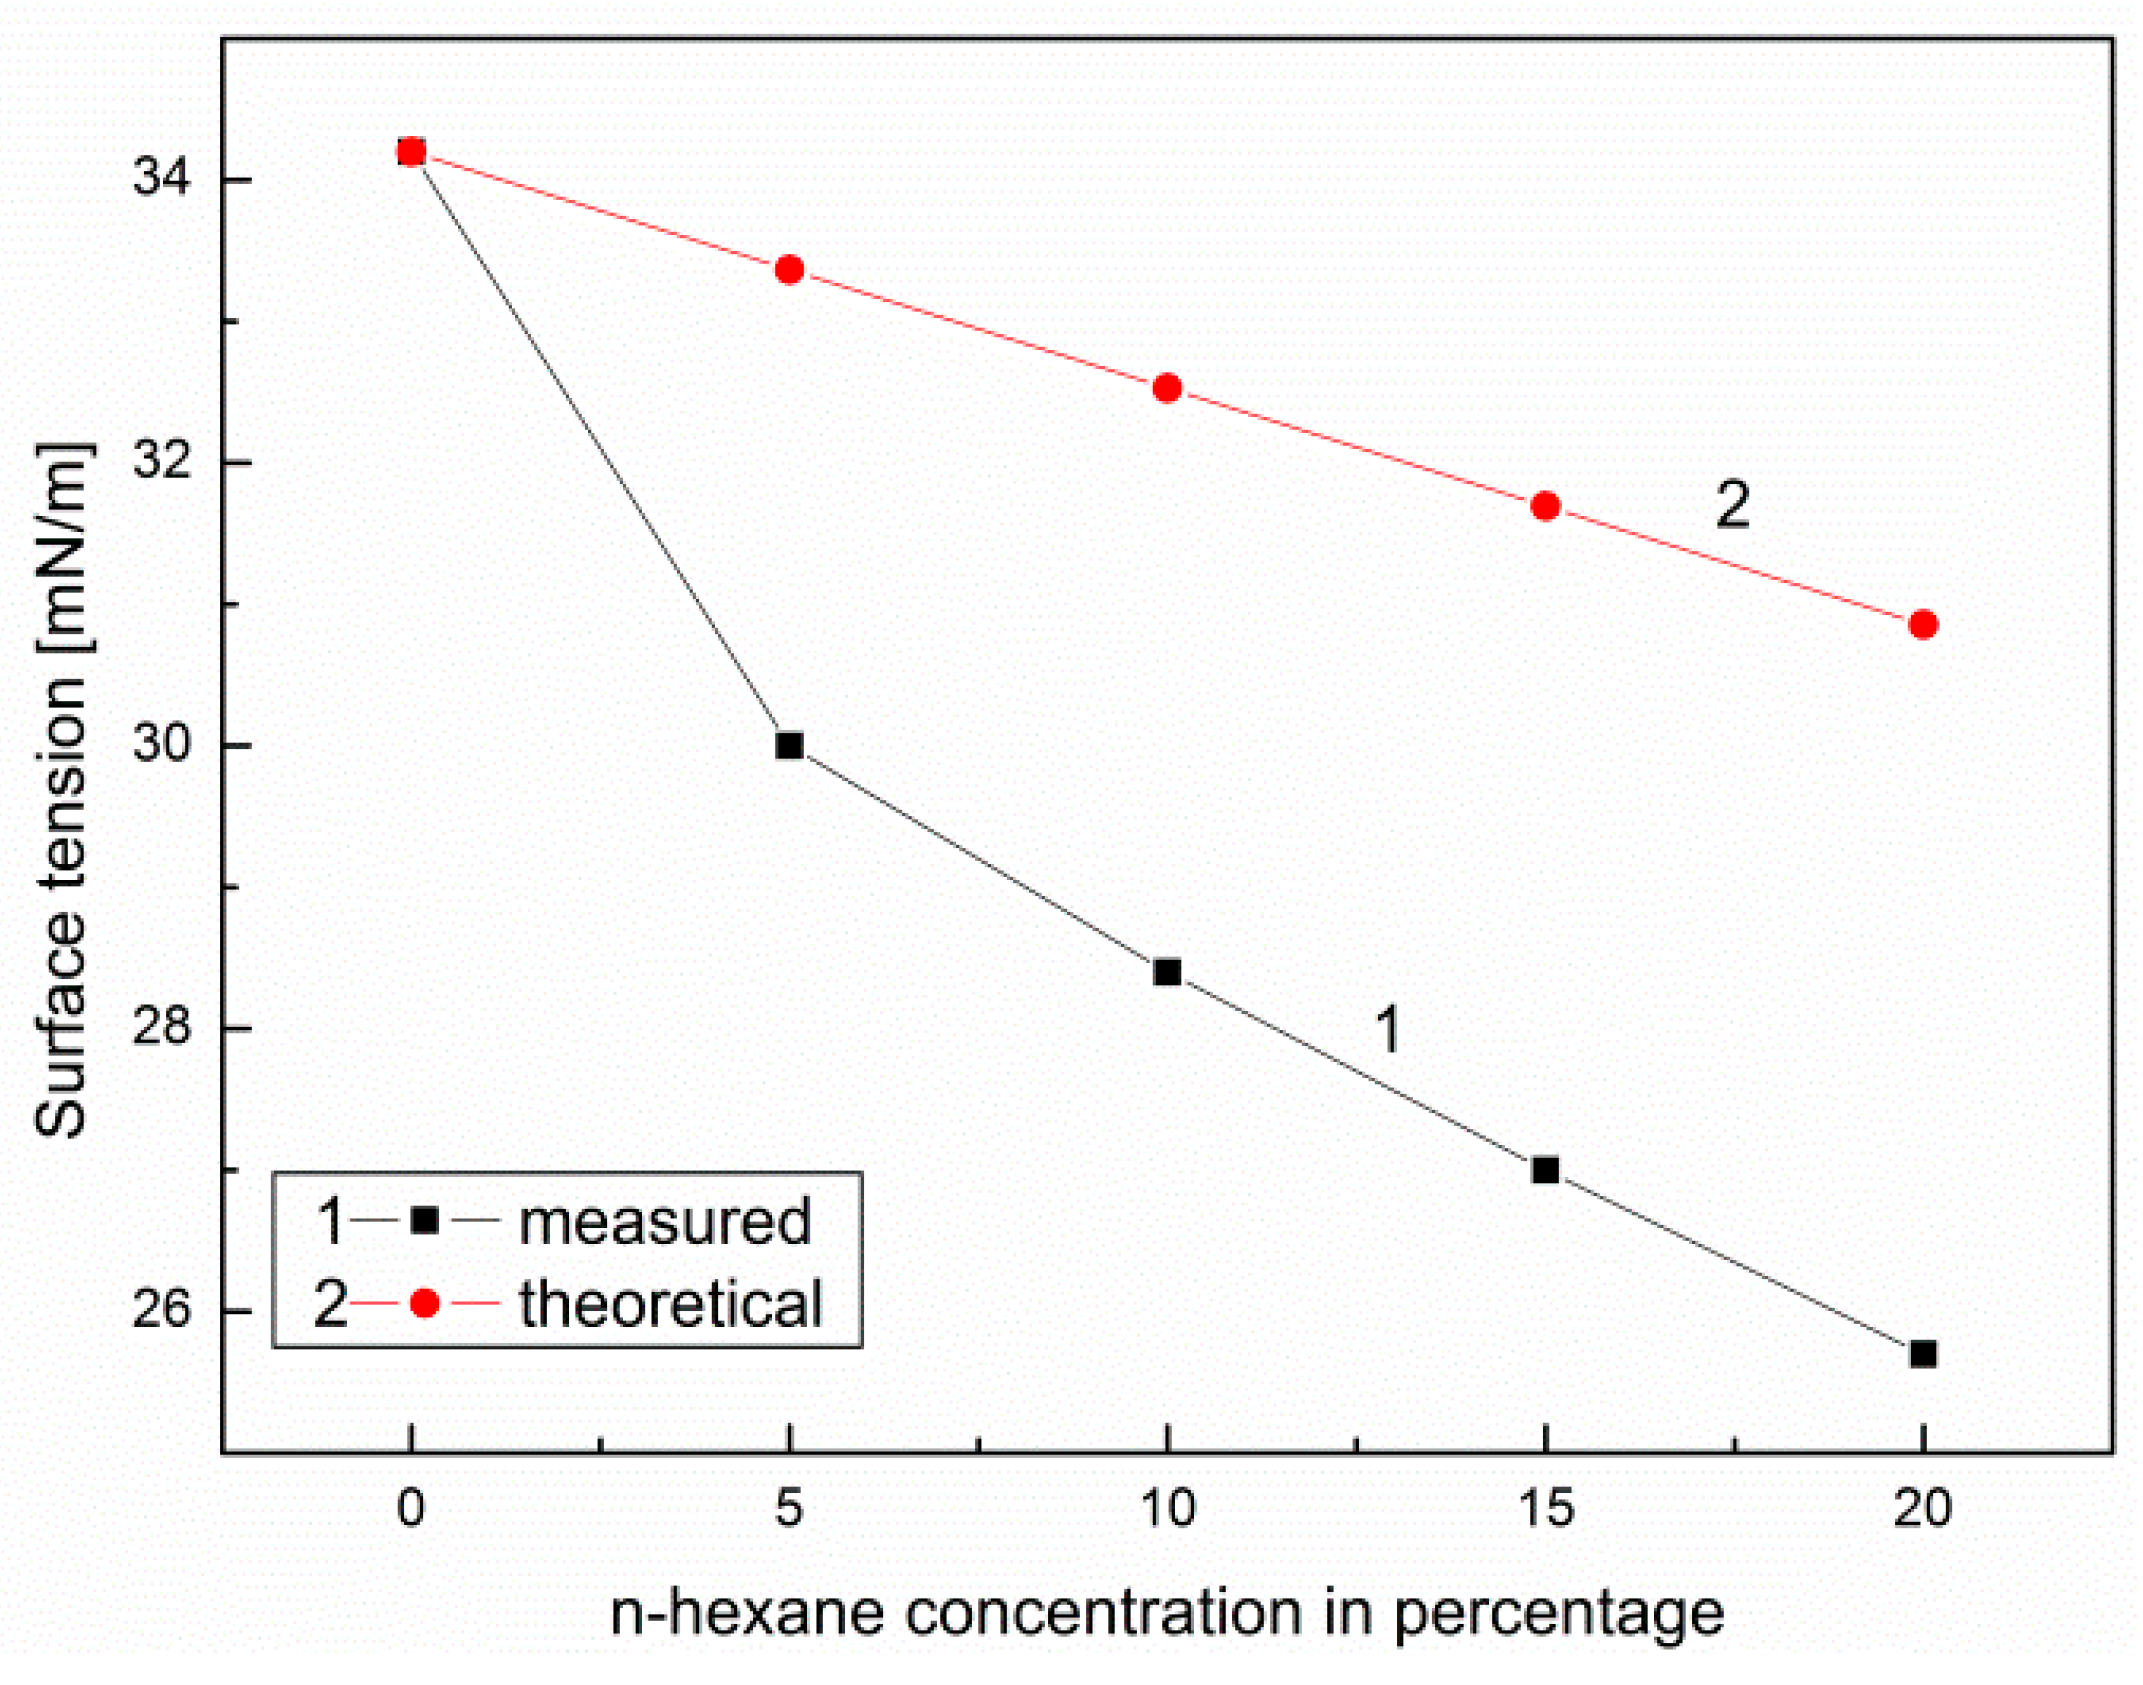
- The vapor pressure of n-hexane and canola oil components does not comply with Raoult law, and this in turn may have a significant influence on the obtained values of ignition temperature of the tested blends (<40°C); the reduction of surface tension of the canola oil mixture with n-hexane as a function of n-hexane volume concentration causes a decrease in the volume of mixture drops flowing out of the injector tip, which may have a significant influence on the injection process;
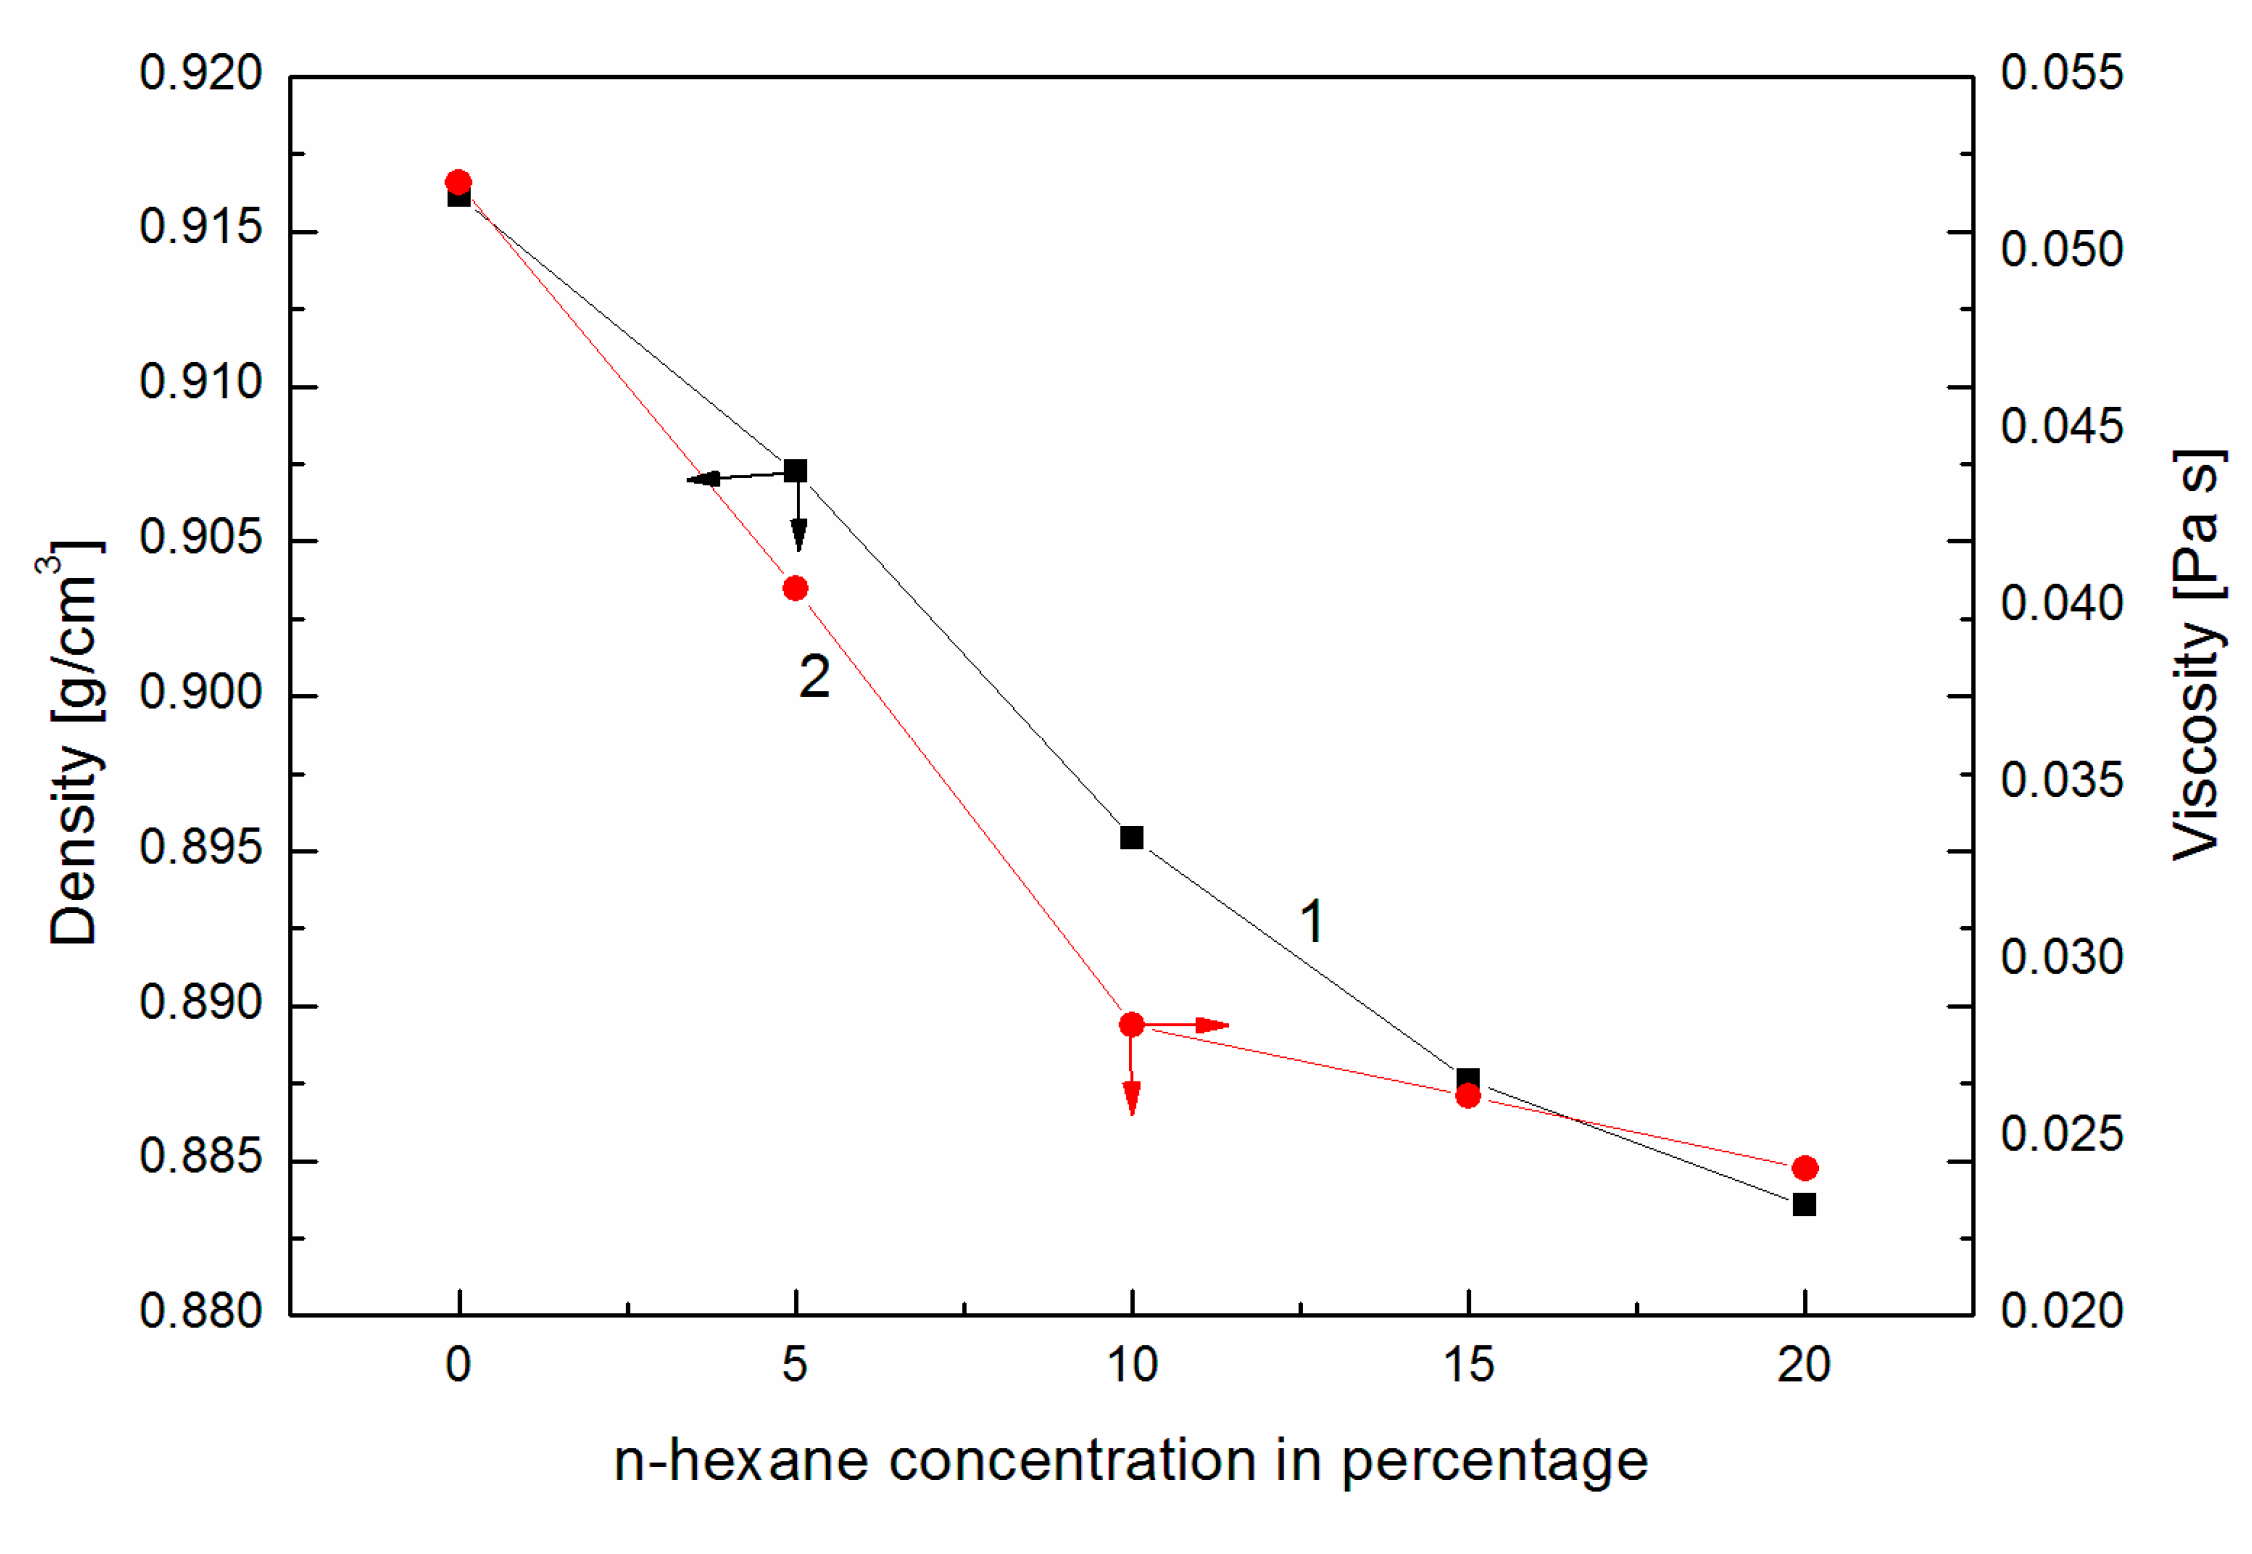
- Based on the calculations carried out, it can be concluded that the addition of n-hexane to canola oil slightly changed the heat of combustion of the same volume of the prepared mixture and significantly improved physicochemical properties such as the surface tension and viscosity;
- Under dynamic conditions of engine operation supplied with the tested fuels, the injection time was similar (the differences reached a maximum of 5%); this resulted in supplying the combustion chamber with a volume comparable amount of fuel;
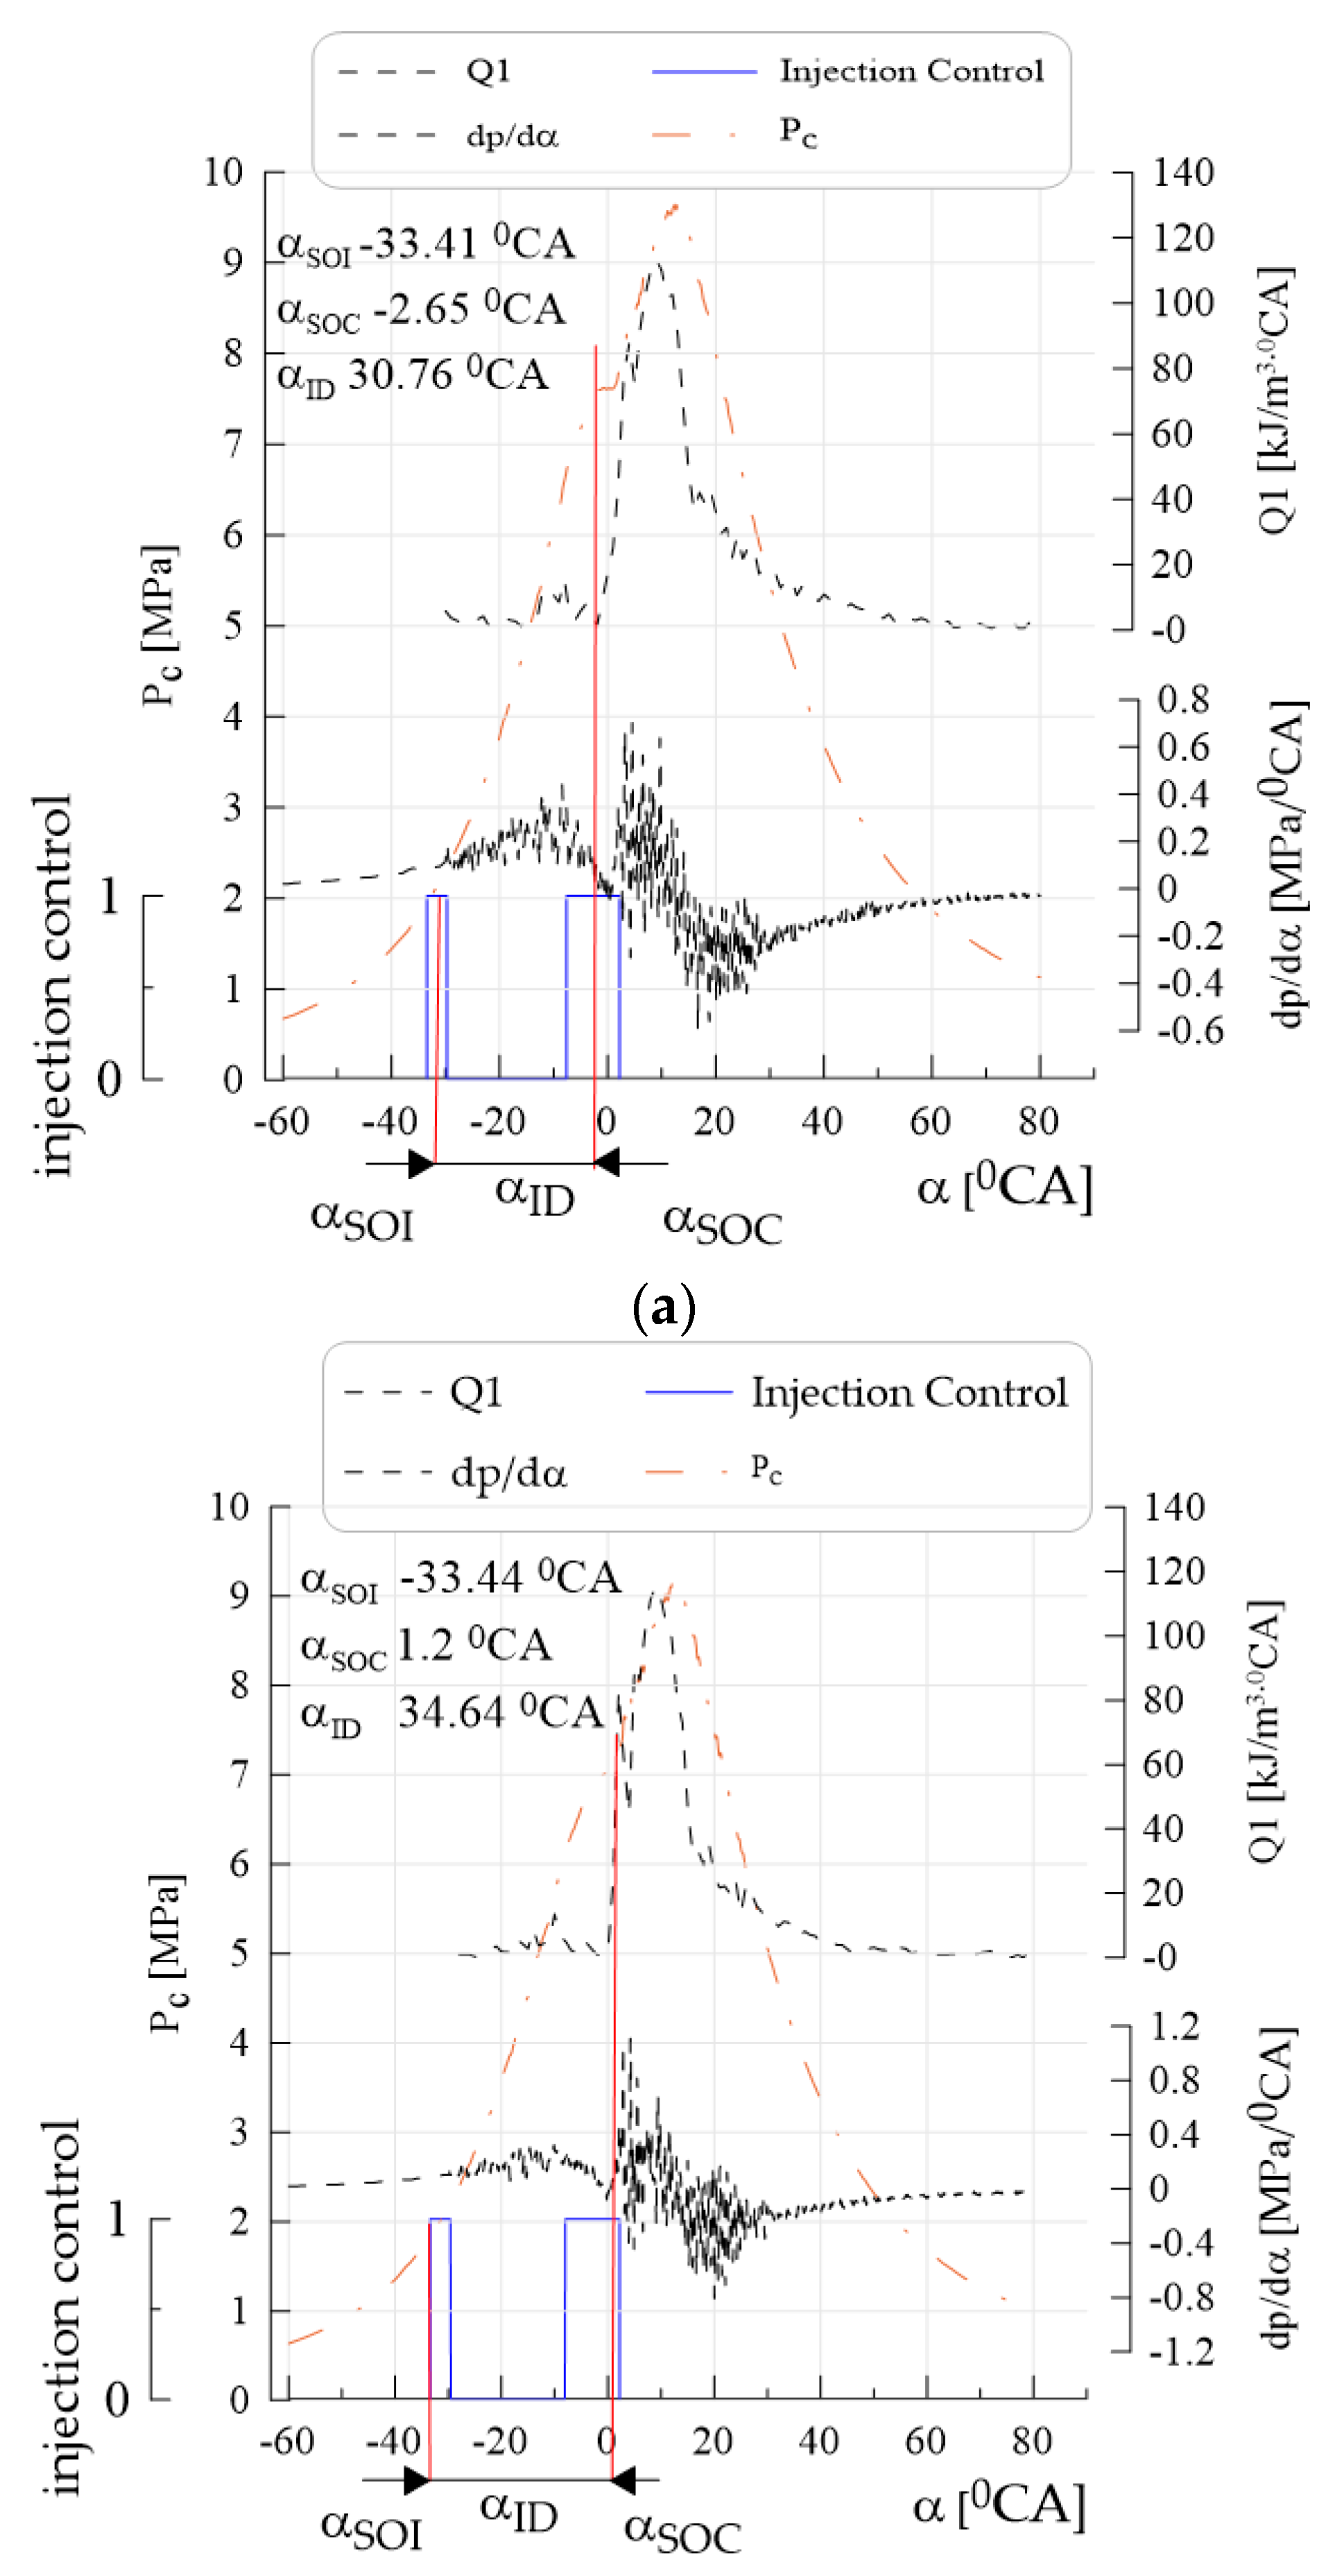
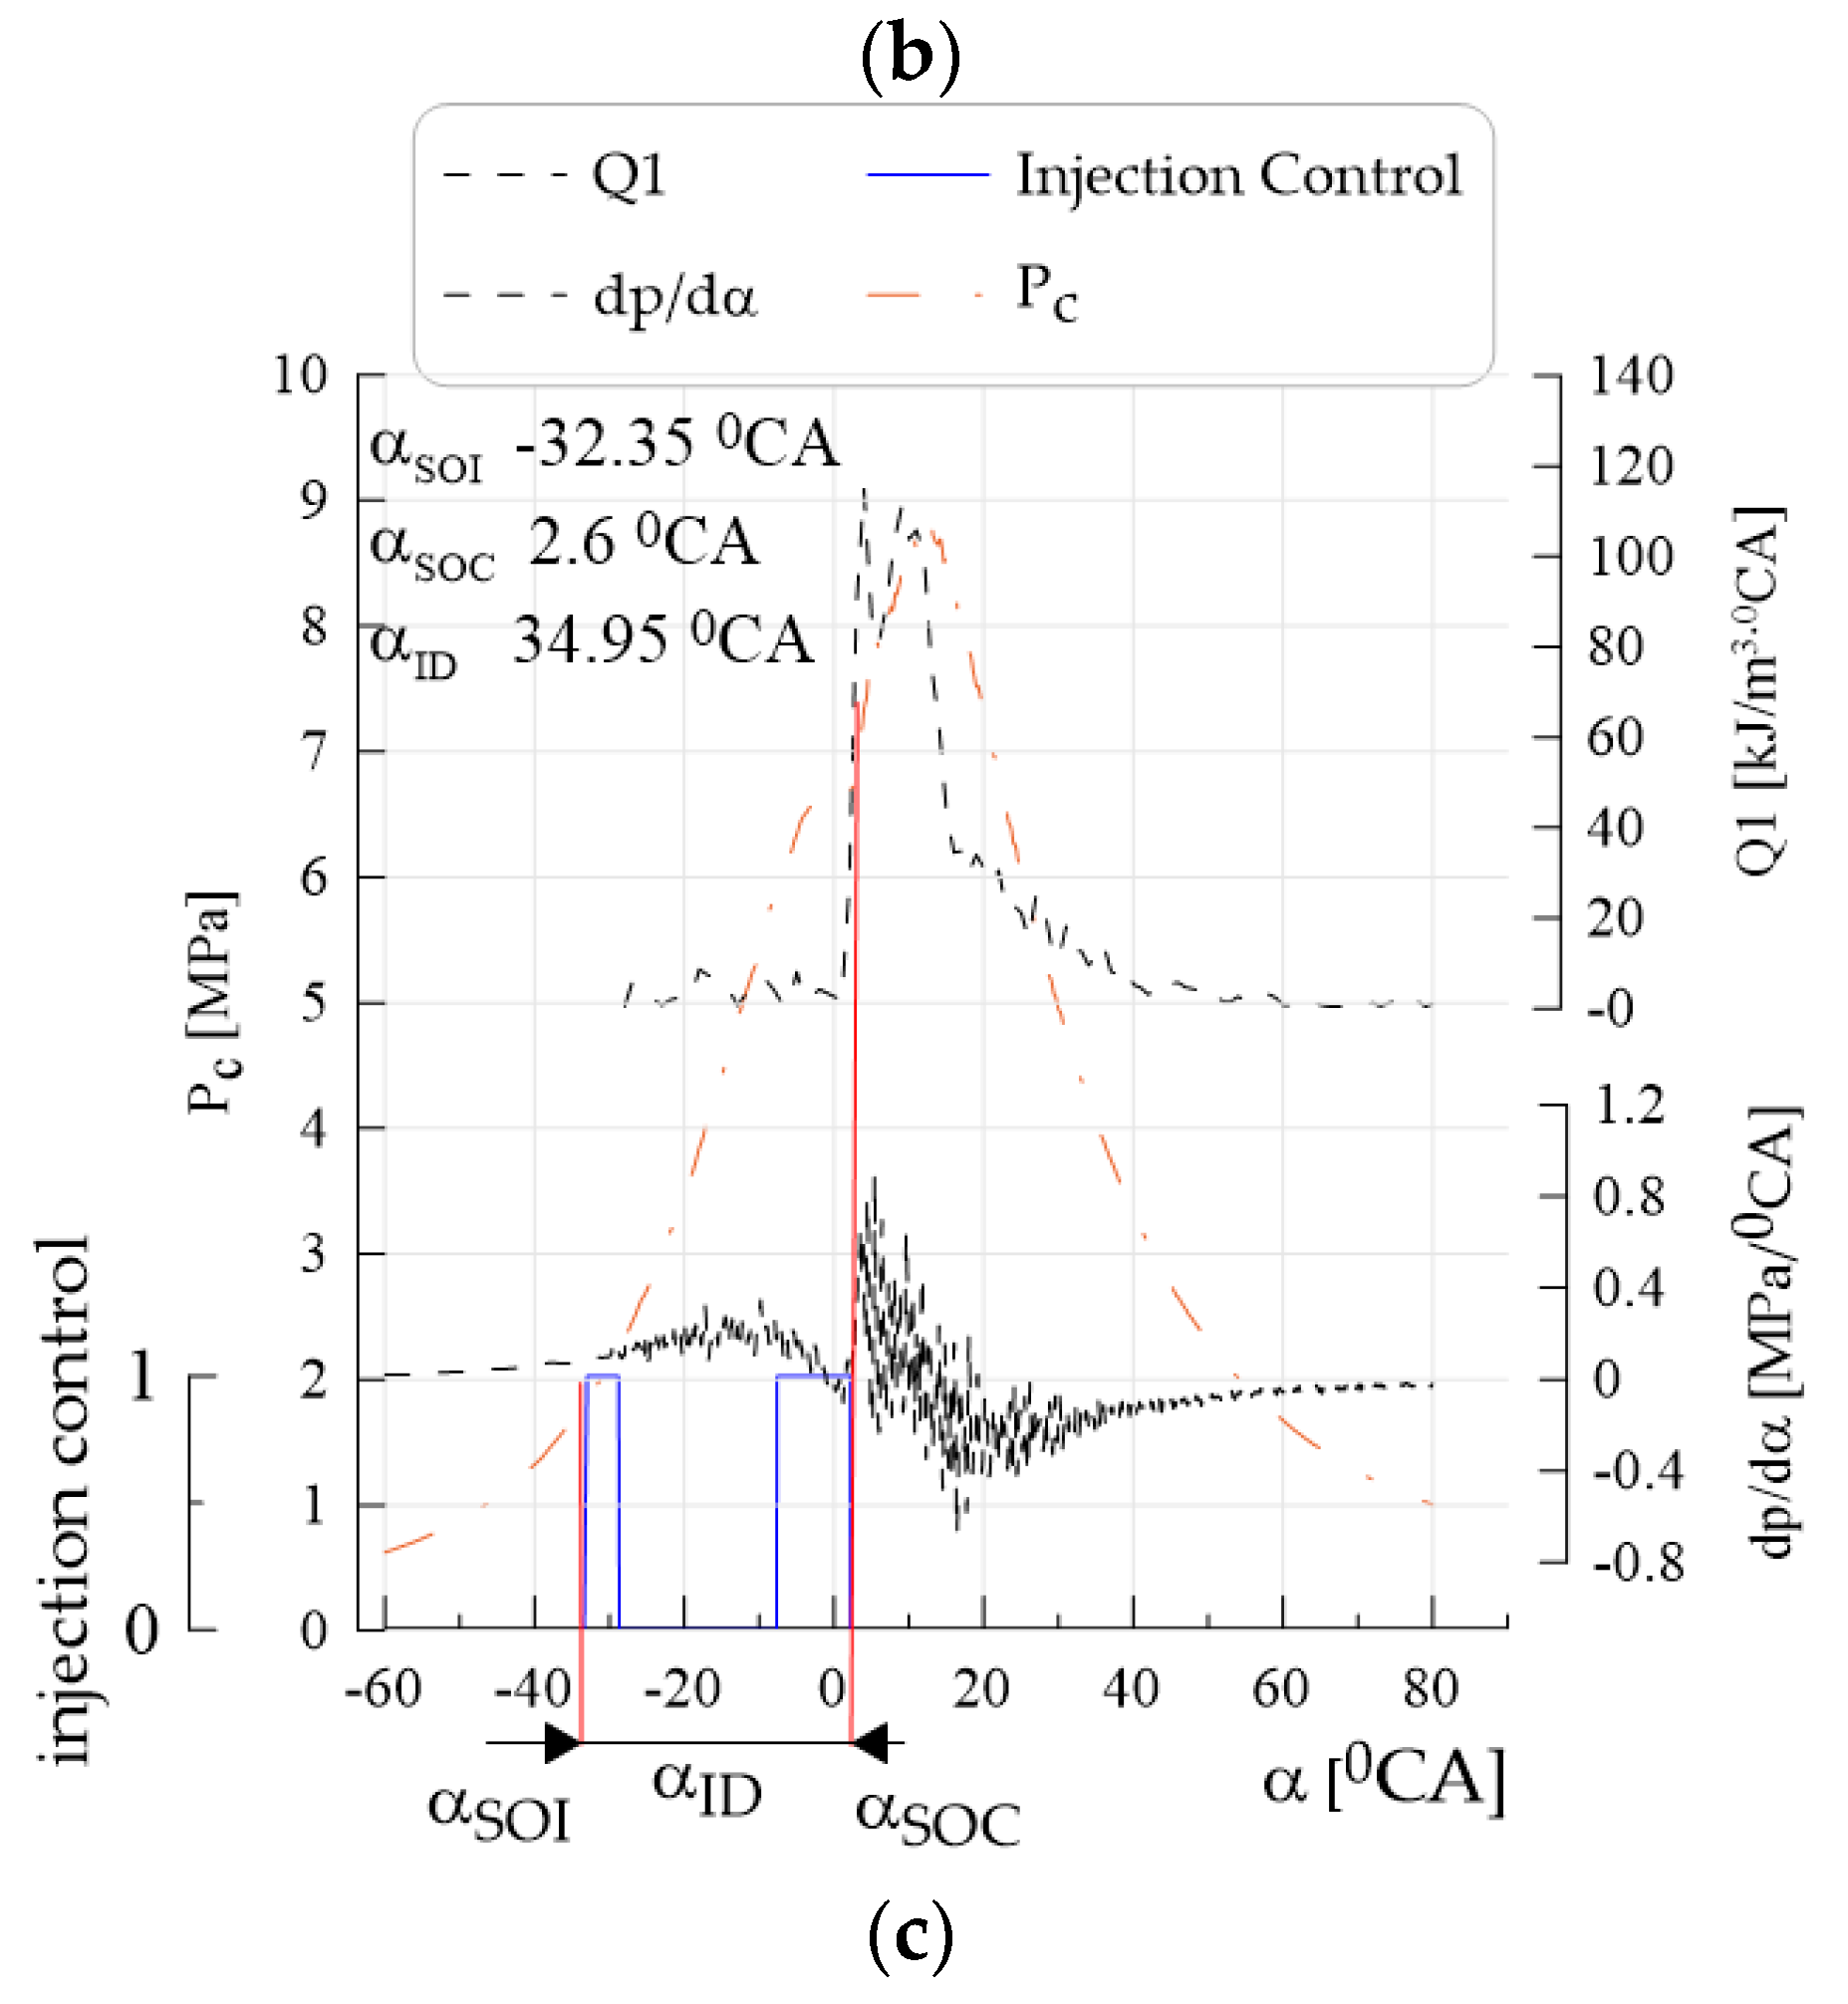
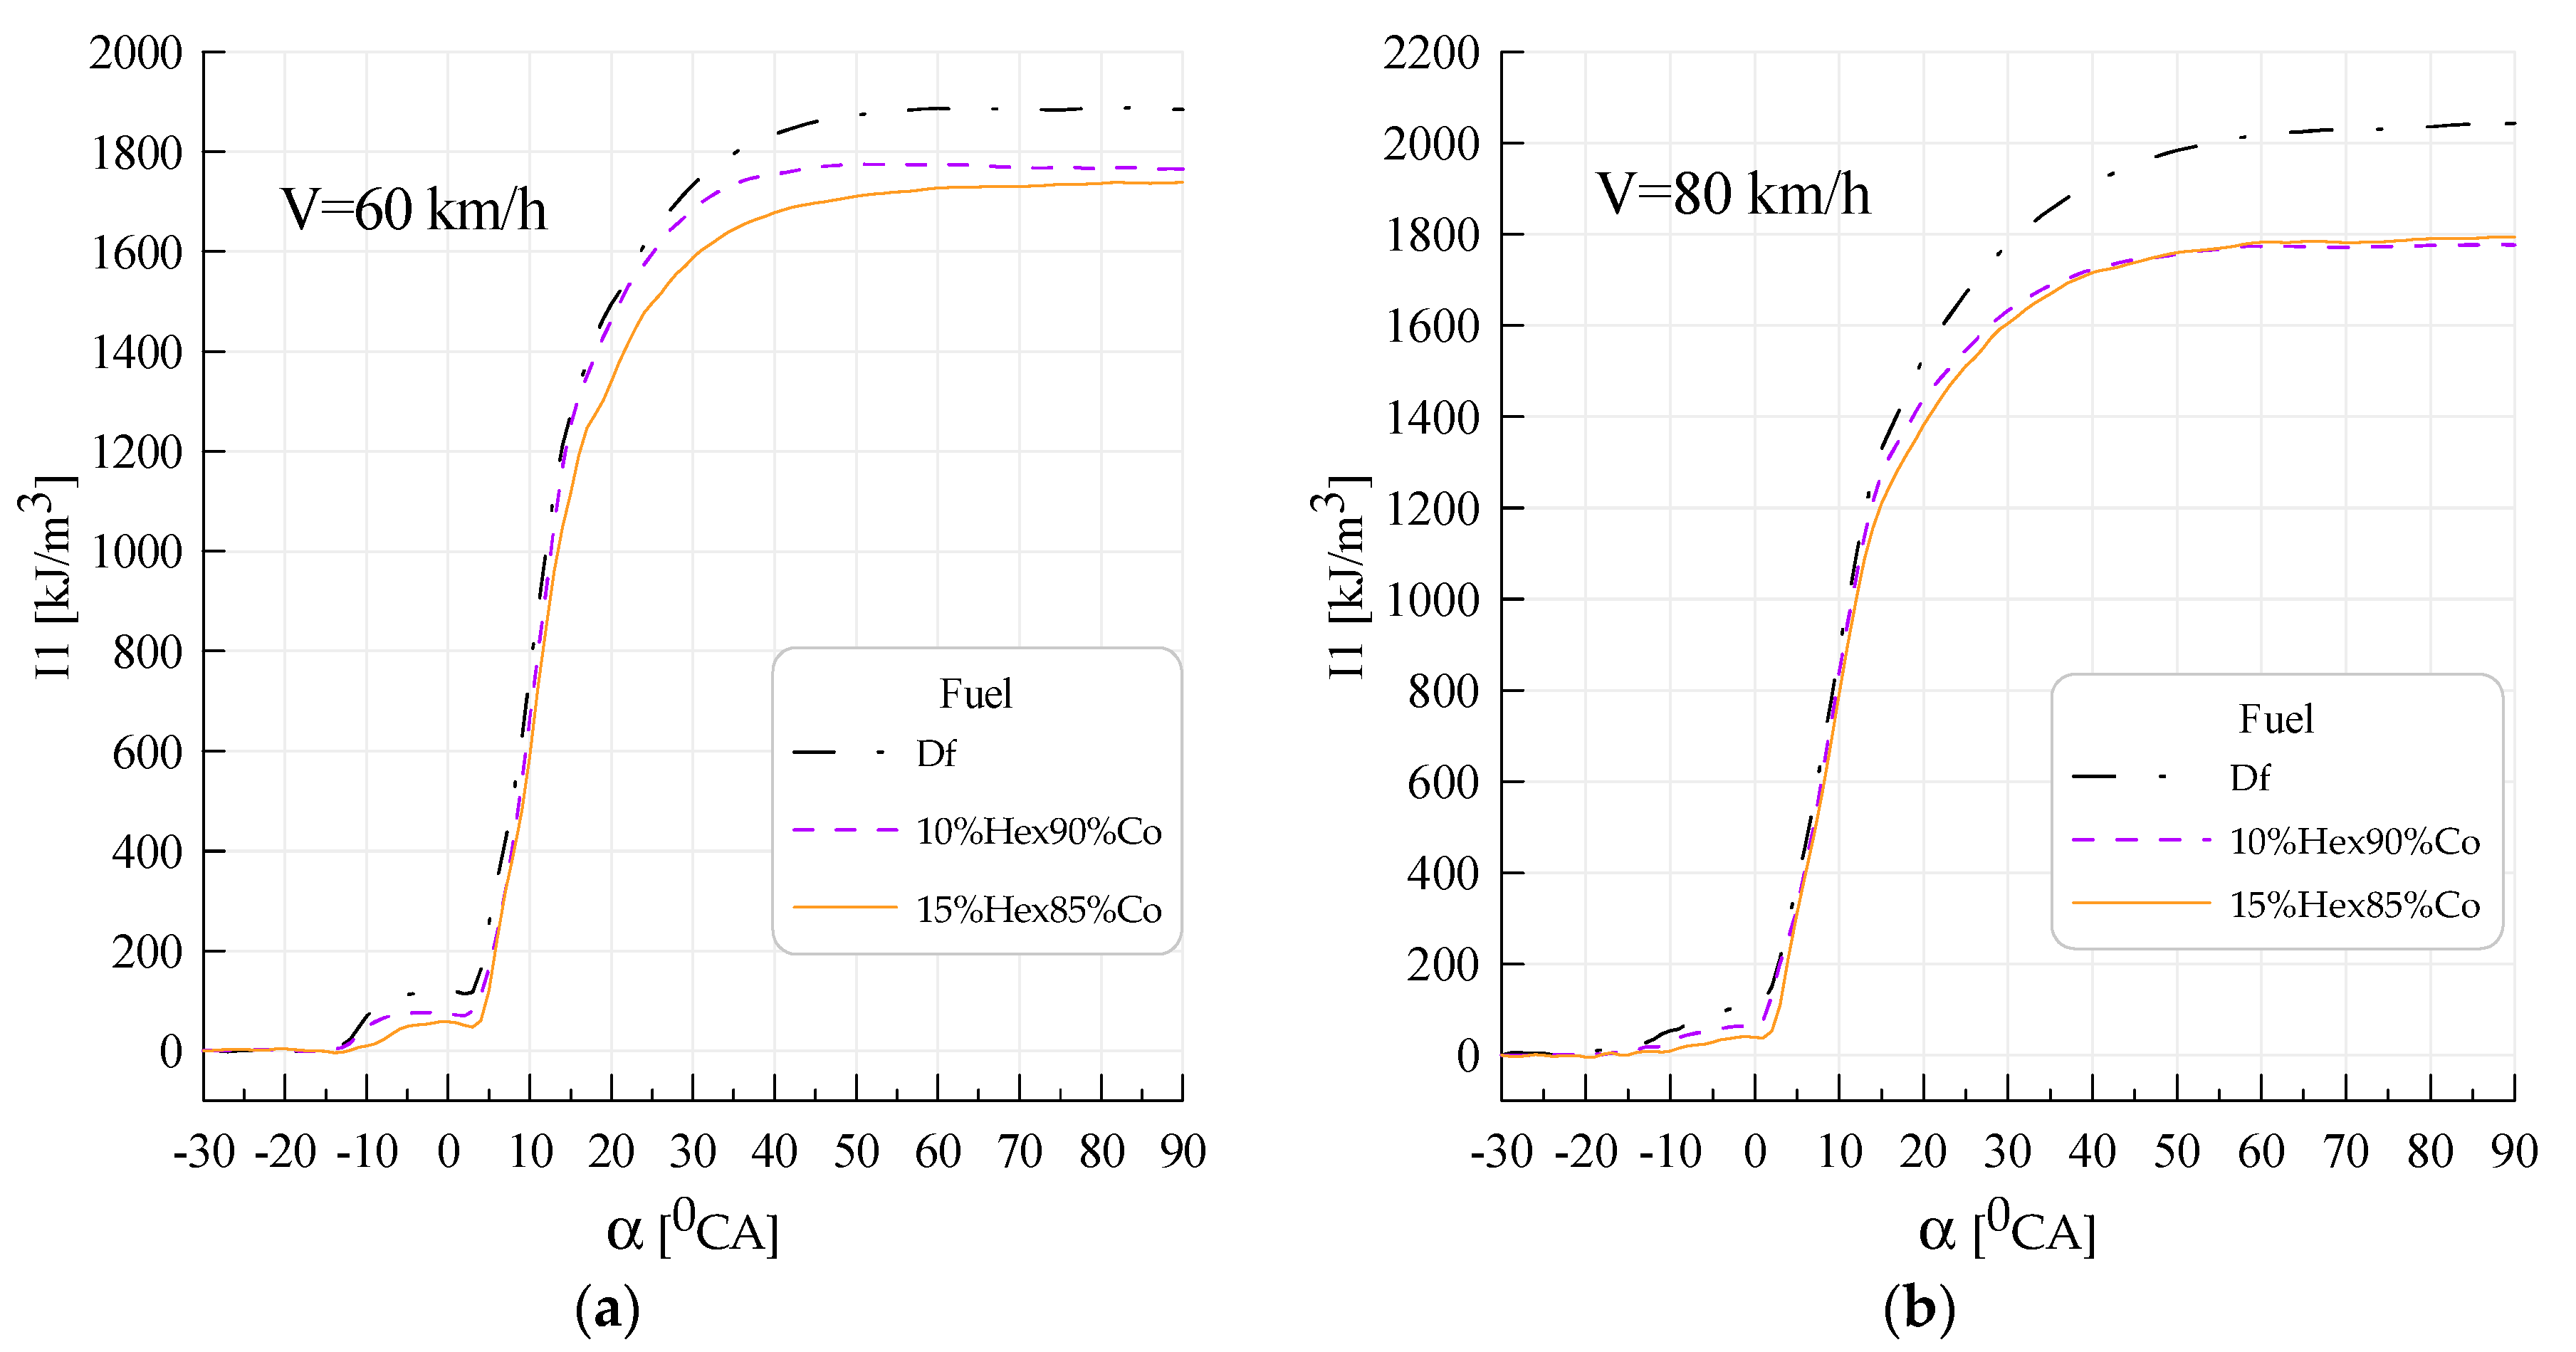
- Obtaining lower values of the average pressure indexed when supplying canola oil with n-hexane in relation to Df was caused by lower heat generation during combustion; during diesel combustion, the classical kinetic and diffusion phase could be distinguished on the heat transfer rate curves, whereas during the combustion of canola oil with n-hexane, the kinetic phase disappeared with increased n-hexane content, which resulted in higher pressure increase rates; for canola oil with n-hexane addition, the beginning of combustion occurred later by approximately 4–12°CA with respect to Df (depending on engine speed), while an increase in the share of n-hexane caused further delay in the beginning of combustion—a similar tendency was observed for the angle of self-ignition delay.
Author Contributions
Funding
Conflicts of Interest
References
- Kalghatgi, G. Is it really the end of internal combustion engines petroleum in transport? Appl. Energy 2018, 225, 965–974. [Google Scholar] [CrossRef]
- Ho, R.J.; Yusoff, M.Z.; Palanisamy, K. Trend future of diesel engine: Development of high efficiency low emission low temperature combustion diesel engine. IOP Conf. Ser. Earth Env. Sci. 2013, 16. [Google Scholar] [CrossRef] [Green Version]
- Bergthorson, J.M.; Thomson, M.J. A review of the combustion and emissions properties of advanced Transportation biofuels and their impact on existing and future engines. Renew. Sustain. Energy Rev. 2015, 42, 1393–1417. [Google Scholar] [CrossRef]
- Alptekin, E.; Canakci, M. Characterization of the key fuel properties of methyl ester–diesel fuel blends. Fuel 2009, 88, 75–80. [Google Scholar] [CrossRef]
- Chen, Z.; Wu, Z.; Liu, J.; Lee, C. Combustion and emissions characteristics of high n-butanol/diesel ratio blend in a heavy-duty diesel engine and EGR impact. Energy Convers Manag. 2014, 78, 787–795. [Google Scholar] [CrossRef]
- Gray, C.; Webster, G. A study of Dimethyl Ether (DME) as an alternative fuel for Diesel Engine, Aplications, Advanced Engine Technology LTD; Project No. 9493-94 Canada – Final Raport; Advanced Engine Technology Limited: Nepean, ON, Canada, 2001. [Google Scholar]
- Lapuerta, M.; Garcıa-Contreras, R.; Campos-Fernandez, J.; Dorado, M.P. Stability, Lubricity, Viscosity, and Cold-Flow Properties of Alcohol-Diesel Blends. Energy Fuels 2010, 24, 4497–4502. [Google Scholar] [CrossRef]
- Rakopoulos, D.C.; Rakopoulos, C.D.; Giakoumis, E.G.; Dimaratos, A.M.; Kyritsis, D.C. Effects of butanol–diesel fuel blends on the performance and emissions of a high-speed DI diesel engine. Energy Convers. Manag. 2010, 51, 1989–1997. [Google Scholar] [CrossRef]
- Bailey, B.; Eberhardt, J.; Goguen, S.; Erwin, J. Diethyl Ether (DEE) as a Renewable Diesel Fuel. SAE Pap. 1997, 106, 1578–1584. [Google Scholar]
- Sinha, S.; Agarwal, A.K. Performance Evaluation of a Biodiesel (Rice Bran Oil Methyl Ester) Fueled Transport Diesel Engines; SAE: Warrendale, PA, USA, 2005; pp. 1–9. [Google Scholar]
- Woźniak, G.; Longwic, R. Initial assessment of the course of combustion process in a diesel engine powered by diesel oil and Brown’s gas. IOP Conf. Ser. Mater. Sci. Eng. 2018, 421, 042085. [Google Scholar] [CrossRef]
- Atmanli, A.; Ileri, E.; Yuksel, B.; Yilmaz, N. Extensive analyses of diesel–vegetable oil–n-butanol ternary blends in a diesel engine. Appl. Energy 2015, 145, 155–162. [Google Scholar] [CrossRef]
- Yerrennagoudaru, H.; Manjunatha, K.; Nobin, K. Rapeseed oil blended with Methanol on Performances Emissions in Turbocharged Diesel Engine. IOSR J. Mech. Civ. Eng. (IOSR-JMCE) 2016, 13, 91–96. [Google Scholar]
- Ileri, E.; Atmanli, A.; Yilmaz, N. Comparative analyses of n-butanol-rapeseed oil-diesel engine blend with biodiesel diesel biodiesel-diesel fuels in a turbocharged direct injection diesel engine. J. Energy Inst. 2016, 89, 586–593. [Google Scholar] [CrossRef]
- Beroun, S.; Martins, J. The Development of Gas, (.C.N.G.; LPG; H2) Engines for Buses Trucks their Emission Cycle Variability Characteristics. SAE Pap. 2001. [Google Scholar] [CrossRef]
- Selim, M.Y. Pressure-time characteristics in diesel engine fueled with natural gas. Renew. Energy 2001, 22, 473–489. [Google Scholar] [CrossRef]
- Verhelst, S.; Turner, J.W.; Sileghem, L.; Vancoillie, J. Methanol as a fuel for internal combustion engines. Prog. Energy Combust. Sci. 2019, 70, 43–88. [Google Scholar] [CrossRef] [Green Version]
- Longwic, R.; Sander, P. The course of combustion process under real conditions of work of a traction diesel engine supplied by mixtures of canola oil containing n-hexane. IOP Conf. Ser. Mater. Sci. Eng. 2018, 421, 042050. [Google Scholar] [CrossRef] [Green Version]
- Górski, K.; Sander, P.; Longwic, R. The assessment of ecological parameters of diesel engine supplied with mixtures of canola oil with n-hexane. IOP Conf. Ser. Mater. Sci. Eng. 2018, 421, 042025. [Google Scholar] [CrossRef]
- Zdziennicka, A.; Szymczyk, K.; Jańczuk, B.; Longwic, R.; Sander, P. Adhesion of canola and diesel oils to some parts of diesel engine in the light of surface tension components and parameters of these substrates. Int. J. Adhes. Adhes. 2015, 60, 23–30. [Google Scholar] [CrossRef]
- Zdziennicka, A.; Szymczyk, K.; Jańczuk, B.; Longwic, R.; Sander, P. Surface, Volumetric, and Wetting Properties of Oleic, Linoleic, and Linolenic Acids with Regards to Application of Canola Oil in Diesel Engines. Appl. Sci. 2019, 9, 3445. [Google Scholar] [CrossRef] [Green Version]
- Polish Standard PN-EN 590; Fuels for motor vehicles - Gas oils - Requirements and test methods; European Committee: Poland, 2011.
- Safety Data Sheet for Preparation; update date 01.06; POCH LTD: Poland, 2008.
- Longwic, R.; Sander, P. The characteristics of the combustion process occurring under real operating conditions of traction. IOP Conf. Ser. Mater. Sci. Eng. 2016, 148, 012071. [Google Scholar] [CrossRef]
- Longwic, R.; Sen, A.K.; Górski, K.; Lotko, W.; Litak, G. Cycle-to-Cycle Variation of the Combustion Process in a Diesel Engine Powered by Different Fuels. J. Vibro Eng. 2011, 13, 120–127. [Google Scholar]
- Longwic, R.; Sander, P.; Nieoczym, A.; Lotko, W.; Krzysiak, Z.; Samociuk, W.; Bąkowski, H. Effect of some properties of hydrocarbon fuels on self-ignition delay. Przemysł Chem. 2017, 96, 1123–1127. [Google Scholar]
- Atkins, P.; de Paula, J.; Keeler, J. Physical Chemistry; Oxford University Press: Oxford, UK, 2017. [Google Scholar]
- Fowkes, F.M. Attractive forces at interfaces. Ind. Eng. Chem. 1964, 56, 40–52. [Google Scholar] [CrossRef]
- Van Oss, C.J.; Chaudhury, M.K.; Good, R.J. Monopolar surfaces. Adv. Colloid Interface Sci. 1987, 28, 35–64. [Google Scholar] [CrossRef]
- Liu, H.; Przybylski, R.; Dawson, K.; Eskin, N.A.M.C.; Biliaderis, G. Comparison of the composition and properties of canola and sunflower oil sediments with canola seed hull lipids. J. Am. Chem. Soc. 1996, 73, 493–498. [Google Scholar] [CrossRef]


| Parameter | Unit | Value |
|---|---|---|
| Kinematic viscosity index in 20 °C | Mm2/s | 0.50 |
| Vapour pressure in 20 °C | Mbar | 160 |
| Dynamic viscosity index in 20 °C | mPa∙s | 0.326 |
| Density in 20 °C | g/mL | 0.66 |
| Solubility in water in 20 °C | g/dm3 | 0.00095 |
| Ignition temperaturę | °C | −22 |
| Boiling point temperature | °C | 68 |
| Self-ignition temperature | °C | 240 |
| Melting temperature | °C | −94 |
| Explosiveness limits | % | low: 1.0 obj.; high: 8.1obj. |
| Parameter | Unit | Value | ||
|---|---|---|---|---|
| Df | 10%Hex | 15%Hex | ||
| Density in 15 °C | (kg/m3) | 835 | 895 | 887 |
| Kinematic viscosity in 40 °C | (mm2/s) | 2.7 | 19.6 | 15.2 |
| Cold filter block age temperature | (°C) | −12 | −3 | −7 |
| Ignition temperature | (°C) | 72 | <40 | <40 |
| Surface tension | (mN/m) | 29.2 | 28.4 | 27.0 |
| The Number of Cylinders | 4 |
|---|---|
| Cylinder diameter (mm) | 69.6 |
| Piston stroke (mm) | 82 |
| Total capacity (cm3) | 1248 |
| Maximum power (kW CEE) | 55 |
| Maximum power (HP CEE) | 75 |
| Operating at maximum power (rpm) | 4000 |
| Maximal moment (Nm CEE) | 190 |
| Maximal moment (kgm CEE) | 19.4 |
| Speed at maximum torque (rpm/1 min) | 1500 |
| Idle rotation speed (rpm) | 850 ± 20 |
| Compression degree | 16.8:1 |
| Fuel | ”I” 60 km/h | ”II” 70 km/h | ||||||
|---|---|---|---|---|---|---|---|---|
| N | pi | Pcmax | dp/dαmax | n | pi | Pcmax | dp/dαmax | |
| [rpm] | [Mpa] | [Mpa] | MPa/°CA | [rpm] | [Mpa] | [Mpa] | MPa/°CA | |
| Df | 1928.6 | 0.95 | 8.71 | 0.458 | 2242.2 | 1.04 | 8.52 | 0.406 |
| 10%Hex90%Co | 1928.6 | 0.953 | 9.05 | 0.314 | 2242.2 | 0.935 | 7.9 | 0.32 |
| 15%Hex85%Co | 1928.6 | 0.915 | 8.06 | 0.488 | 2242.2 | 0.943 | 7.78 | 0.336 |
| ”III” 74 km/h | ”IV” 80 km/h | |||||||
| N | pi | Pcmax | dp/dαmax | n | pi | Pcmax | dp/dαmax | |
| [rpm] | [Mpa] | [Mpa] | MPa/°CA | [rpm] | [Mpa] | [Mpa] | MPa/°CA | |
| Df | 2389.5 | 1.07 | 8.99 | 0.365 | 2509.4 | 1.06 | 9.61 | 0.399 |
| 10%Hex90%Co | 2389.5 | 0.936 | 8.49 | 0.359 | 2509.4 | 0.929 | 9.12 | 0.468 |
| 15%Hex85%Co | 2389.5 | 0.924 | 8.14 | 0.389 | 2509.4 | 0.931 | 8.8 | 0.516 |
| Parameter | Df | 10%Hex90%Co | 15%Hex85%Co |
|---|---|---|---|
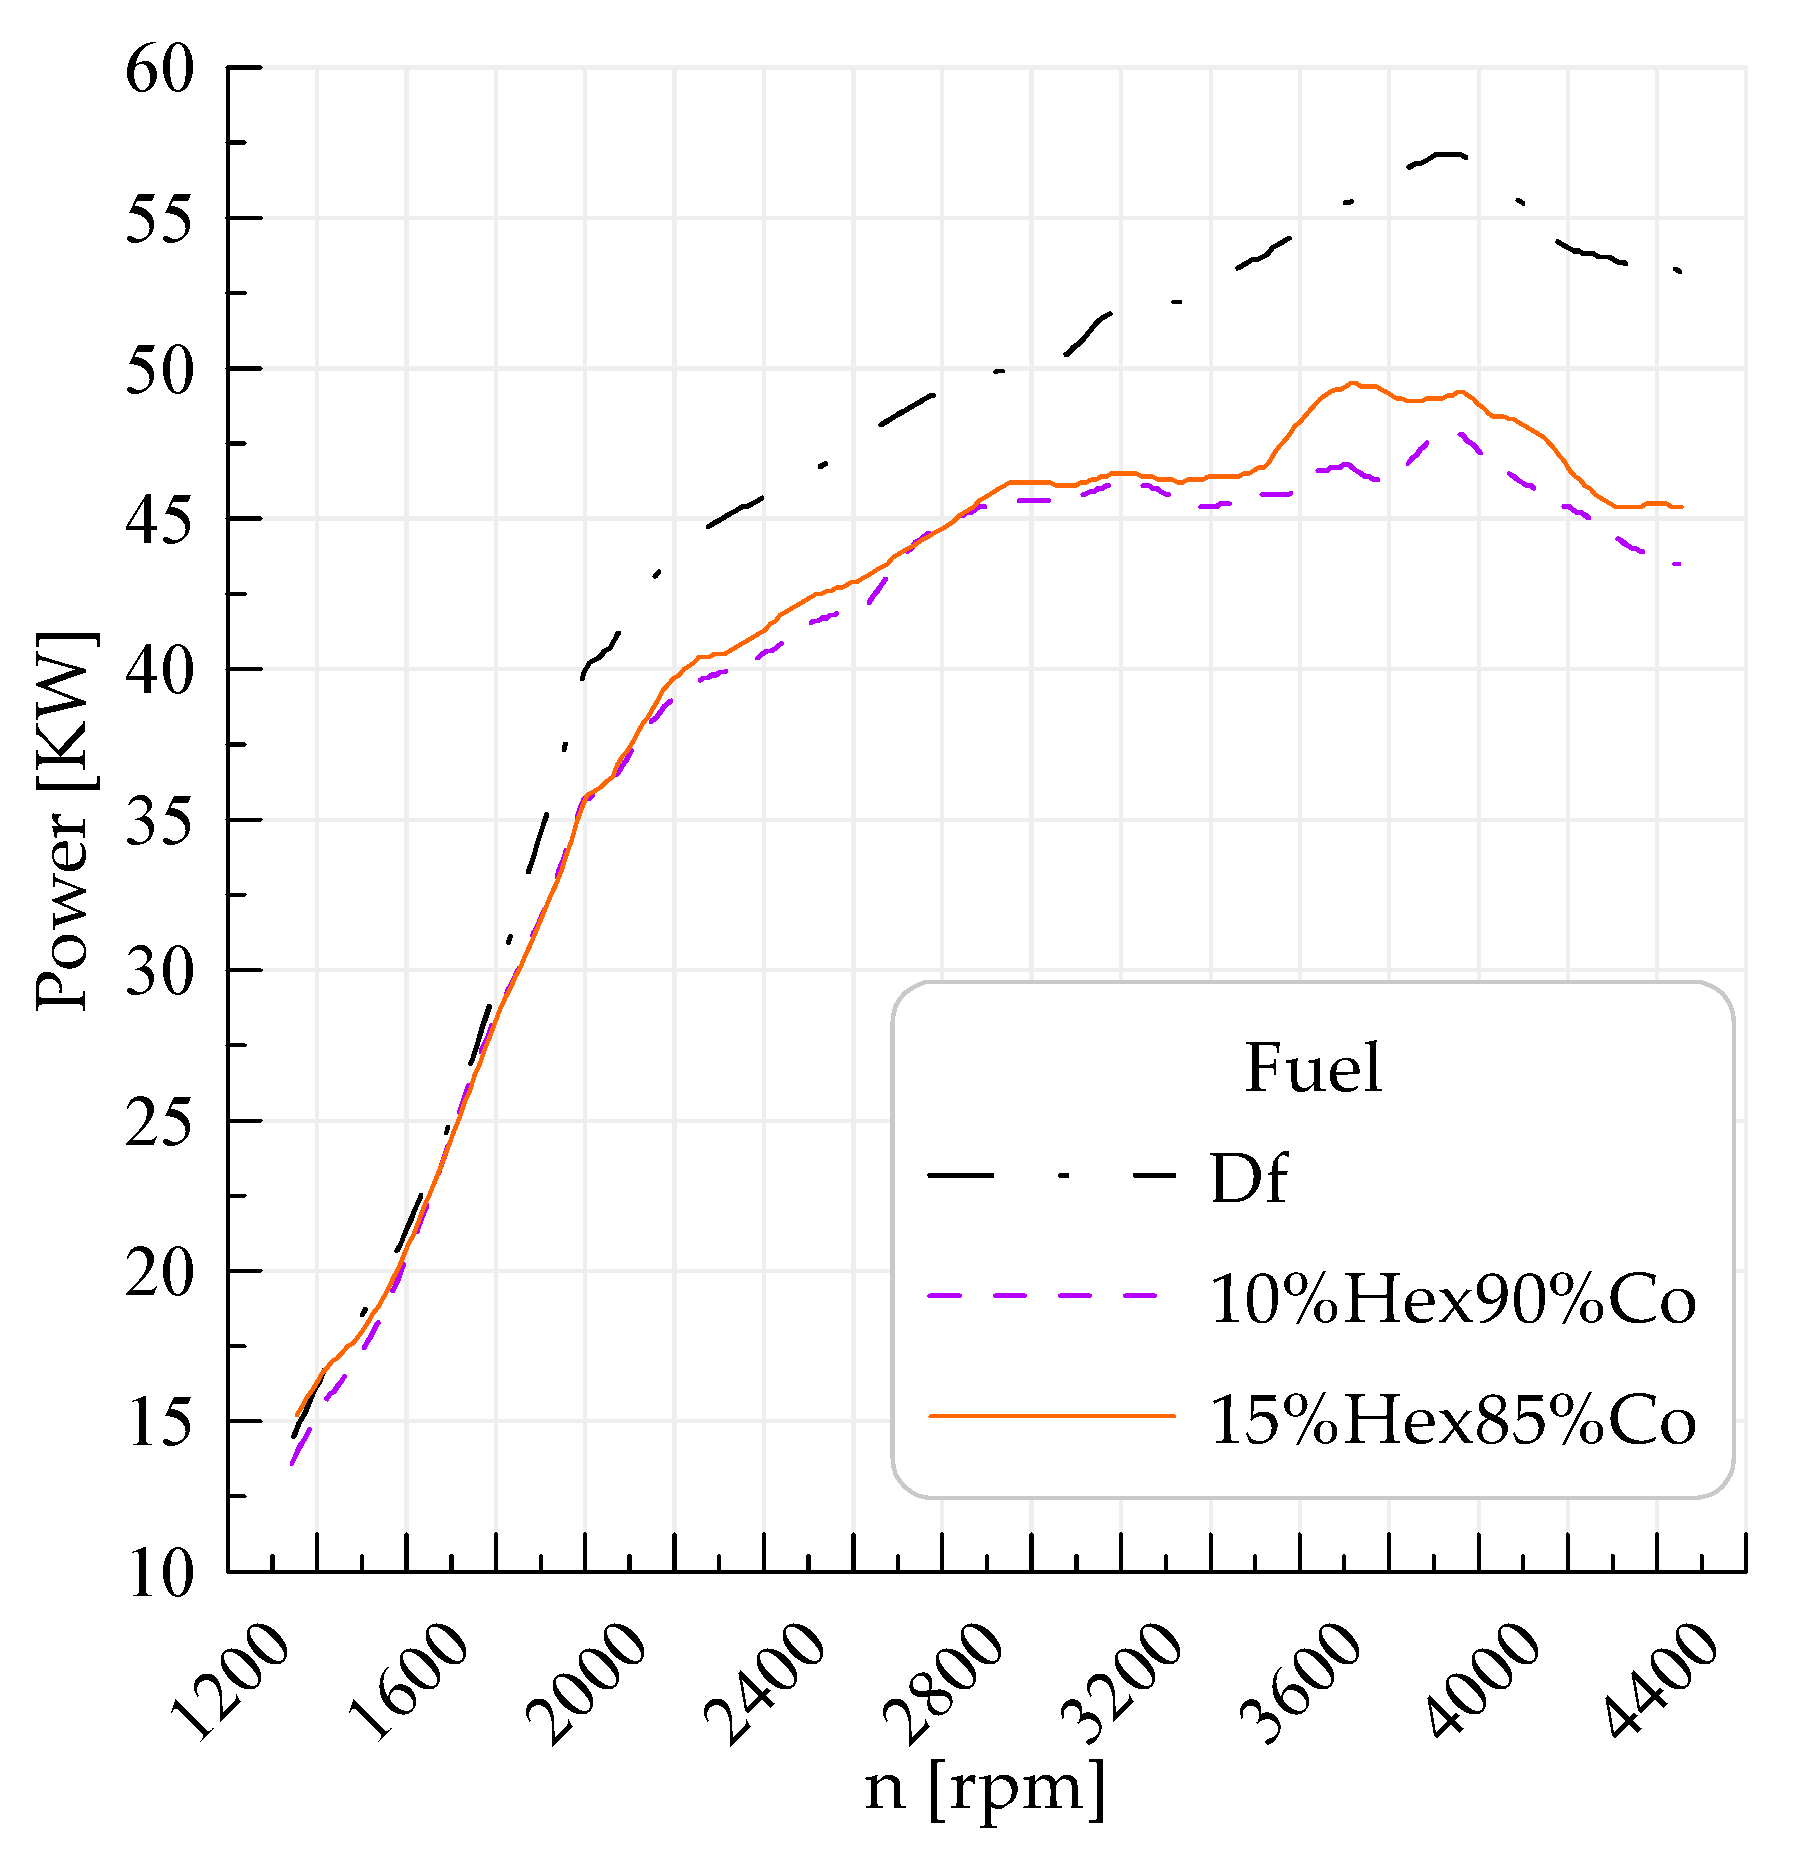
| Power of the vehicle | 57 KW/3916 rpm | 47.8 KW/3995 rpm | 49.5 KW/3714 rpm |
| Torque | 191.3Nm/2123 rpm | 170.5 Nm/1998 rpm | 172.8 Nm/2186 rpm |
| Power on the wheels | 45.5 KW/3893 rpm | 39.2 KW/2891 rpm | 40.3 KW/3703 rpm |
| Maximumspeed | 143km/h/4520 rpm | 143 km/h/4509 rpm | 143 km/h/4516 rpm |
| Acceleration time | 35.30s | 42.88s | 37.98s |
© 2019 by the authors. Licensee MDPI, Basel, Switzerland. This article is an open access article distributed under the terms and conditions of the Creative Commons Attribution (CC BY) license (http://creativecommons.org/licenses/by/4.0/).
Share and Cite
Longwic, R.; Sander, P.; Zdziennicka, A.; Szymczyk, K.; Jańczuk, B. Combustion Process of Canola Oil and n-Hexane Mixtures in Dynamic Diesel Engine Operating Conditions. Appl. Sci. 2020, 10, 80. https://doi.org/10.3390/app10010080
Longwic R, Sander P, Zdziennicka A, Szymczyk K, Jańczuk B. Combustion Process of Canola Oil and n-Hexane Mixtures in Dynamic Diesel Engine Operating Conditions. Applied Sciences. 2020; 10(1):80. https://doi.org/10.3390/app10010080
Chicago/Turabian StyleLongwic, Rafał, Przemysław Sander, Anna Zdziennicka, Katarzyna Szymczyk, and Bronisław Jańczuk. 2020. "Combustion Process of Canola Oil and n-Hexane Mixtures in Dynamic Diesel Engine Operating Conditions" Applied Sciences 10, no. 1: 80. https://doi.org/10.3390/app10010080