Abstract
Cyanobacterial proliferations display rapid spatiotemporal variations that can interfere in the assessment of water contamination levels by microcystins (MC), and make necessary the use of integrative tools. This study evaluates the pertinence of bivalves Anodonta anatina and Dreissena polymorpha as bioindicators of the presence of MC-producing cyanobacteria in water. Ingested MC accumulates into two fractions in bivalve tissues—the cellular free and the protein-bound fractions—both forming the total MC fraction. Mussels were exposed to the cyanobacteria Planktothrix agardhii at densities producing an equivalent of 1, 10 and 100 µg/L of intracellular MC, with the evaluation of: (i) cyanobacterial cells and MC daily intake by mussels, (ii) free and total MC kinetics in whole individuals (using all the tissues) or only in the digestive gland, during and after the exposure, (iii) bioaccumulation factors. For each species, the kinetics of the two accumulation fractions were compared to evaluate which one best reflect levels and dynamics of MC-producing cyanobacteria in water. Results showed that the dynamic of free MC in bivalve tissues better highlight the dynamic of intracellular MC in water. Using whole D. polymorpha may be appropriate to reveal and discriminate the water contamination levels above densities of cyanobacteria producing 1 µg MC/L. Digestive glands of A. anatina appeared more sensitive to reveal low environmental concentration, but without direct correlation with levels of water contamination. Further experimentations in situ are necessary to confirm those results in order to propose the use of freshwater bivalves for a biomonitoring of MC-producing cyanobacteria in fresh waters.
1. Introduction
Cyanobacterial proliferations often occur in reservoirs used for the supply of drinking water or recreational activities. As some species are able to synthetize harmful toxic compounds, cyanobacterial blooms represent a significant risk to ecosystems and human health [1,2,3]. Those proliferations are expected to be enhanced by eutrophication [2] and global warming [4]. In freshwater ecosystems, the hepatotoxins microcystins (MC) are the most frequently produced toxins by cyanobacteria [5]. MC are mainly intracellular during cyanobacterial proliferations, with less than 30% of the total concentration being extracellular, and are mainly dissolved in water only during bloom senescence [6]. MC have a tropism towards organs containing organic-anion-transporting polypeptides (OATPs). OATPs are a superfamily with some (OATP2A1, OATP3A1 and OATP4A1) expressed ubiquitously in humans, and others, as those involved in MC transport (e.g., OATP1B1, OATP1B3 and OATP1A2), are assumed to be organ specific (e.g., intestine, liver or digestive gland, kidney, heart, lung, spleen, pancreas, brain) [7,8,9,10]. In hepatic cells, MC can inactivate protein phosphatases (PPases) [11,12,13], causing an increase of cytoskeletal protein phosphorylation, an impairment of the cytoskeleton structure and loss of shape, leading to interstitial haemorrhage into the liver [10,14].
To evaluate the contamination of water by cyanobacteria and cyanotoxins, traditional surveys are based on a visual monitoring coupled with water sampling. The recommended sampling frequency is twice a month and should be increased when the appearance or turbidity of water is changing [1]. However, a twice-monthly sampling may not be representative of the level of water contamination by intracellular MC (in MC-producing cyanobacteria), as it is possible to miss either an entire bloom occurring in between [15] or one at its early stage. Indeed, pressure exerted by environmental factors can lead to rapid proliferation or sudden collapse of cyanobacterial populations [16]. Moreover, some cyanobacteria (e.g., Planktothrix sp.) are able to display daily vertical migratory cycle and can also move horizontally under the effects of winds and movements of water bodies [17,18]. Therefore, rapid spatial variations in the localisation of cyanobacterial populations in the water column may increase uncertainties in the representativeness of a punctual sample. Similarly, the toxin production may greatly vary depending on environmental factors or stages of cyanobacterial growth [19]. This study investigated the use of bioindicator species, temporally integrating water contamination levels by toxin-producing cyanobacteria, to overcome this sampling issue.
Freshwater bivalves, being filter-feeders of limited mobility, were already proposed as sentinel species [20], and used to detect the presence of metals [21,22,23], microplastics [24], organochlorine contaminants [25], parasites [26,27] and MC-producing cyanobacteria [28]. The zebra mussel Dreissena polymorpha (Pallas, 1771) is a small (below 50 mm) sessile bivalve originated from the Ponto-Caspian region and nowadays widespread in the northern hemisphere and therefore qualified as invasive [29]. On the opposite, the freshwater mussel Anodonta anatina (Linnaeus, 1758) is a vagile bivalve [30] present throughout Europe [31] and classified as least concern by the IUCN [32], although some population are declining [31]. Both A. anatina and D. polymorpha are known to filter colonial (i.e., Microcystis aeruginosa) and filamentous (i.e., P. agardhii) cyanobacteria [33,34,35,36].
After cyanobacterial cell ingestion, intracellular MC are liberated during the digestive process, and mainly accumulate in the digestive gland of invertebrates [37,38]. MC can bind to proteins through a reversible hydrophobic bond, forming covalent adducts after several hours [10]. Therefore, two fractions of MC accumulation can be studied: (i) ‘free MC’ representing the cell fraction of unbound MC, and (ii) ‘total MC’ including free and protein-bound MC in tissues. Studies performed in situ demonstrated the accumulation of free MC by the bivalves D. polymorpha and A. anatina [39,40]. Moreover, in the laboratory, D. polymorpha accumulated both free and bound MC from the first of a three-week exposure to the MC-producing cyanobacteria M. aeruginosa [41]. Free MC can be quantified in a biological matrix using high-pressure liquid chromatography (HPLC) alone [42,43], with single (LC–MS) or tandem (LC-MS/MS) mass spectrometry [41,44]. However, those methods require great expertise as opposed to the enzyme-linked immunosorbent assay (ELISA), which is increasingly used [1]. The ELISA method is rapid, sensitive [45], easy to use and interpret [46]. It has been pointed out to generate false-positive results [1], which was not confirmed for some mollusc matrix [47]. Since free MC may represent a small percentage of the total MC concentration in organisms [41,47], its measurement in sentinel species could be less accurate than that of total MC to reveal levels of water contamination by MC-producing cyanobacteria. However, the quantification of total MC is expensive and long as samples first need to be oxidized, using Lemieux oxidation [48] or ozonolysis [49], to release a compound called 2-methyl-3-methoxy-4-phenylbutyric acid (MMPB). Then MMPB is extracted and analysed by GC-MS or LC-MS/MS [1]. This allows all fractions (free and bound) in a sample to be quantified. However, as the protein-bound MC are known to remain longer in tissues than free MC after the end of exposure [47], the quantification of total MC in bivalves might not reflect short-term variations of environmental MC contamination. Therefore, following the kinetics of both accumulation fractions in bivalves during and after an exposure to MC-producing cyanobacteria is mandatory to evaluate their pertinence to highlight environmental contamination.
This study assesses if free or protein-bound MC accumulation by the freshwater bivalves A. anatina and D. polymorpha could be used as a tool to evaluate water contamination by MC-producing cyanobacteria. To study this, we compared the kinetics of accumulation and elimination of free and total MC in both bivalves exposed to three densities of the MC-producing cyanobacteria P. agardhii for three weeks, followed by two weeks of depuration. Concomitantly, the ingestion rate of cyanobacteria and of MC were measured daily to calculate a cumulative and a temporal accumulation factor. Owing to the size differential between the two mussel species, we study the kinetics of free and total MC accumulation in the digestive gland of A. anatina, to avoid MC biodissolution, and in the entire body of the smaller mussel D. polymorpha. Furthermore, at some specific dates, we also studied total MC contents in whole body of A. anatina and in the digestive glands of D. polymorpha, in order to compare the two species in terms of accumulation capacities.
2. Materials and Methods
2.1. Biological Materials
2.1.1. Anodonta anatina
Mussels were provided by Univers aquatique (Univers aquatique, Sartrouville, France). Overall, 450 mussels measuring 6.9 ± 0.1 cm were placed by groups of 75 at 18 ± 2 °C in aerated tanks containing 25 L of Cristalline® source water (Saint Yorre, France) with a cycle of 12 h of light and 12 h of darkness. To ensure a homogenization of the medium, each tank had a pipe pierced all along its immersed length, connected to an air pump (Zolux, Clisson, France), creating a homogeneous constant bubbling over the entire water volume. During the acclimatisation, the animals were fed twice a week with 3.7 × 10⁷ cells of Chlorella vulgaris Beijerinck, 1890/individuals/day (Greensea, Mèze, France), in order to obtain a food:body weight ratio of 0.7 cells/g of fresh weight (FW) of soft tissue. Algal density was measured with an optic microscope (Primovert, Zeiss, Oberkochen, Germany) and KOVA® slides following the manufacturer’s instructions (Kova slide, VWR, Fontenay-sous-Bois, France). To ensure that cyanobacteria were mainly a source of intracellular MC, only culture in an asymptotic growth state were used. Moreover, no sand sediment was added in aquariums and cyanobacteria stayed in the water column by bubbling, in order to prevent a cyanobacterial cell or a MC retention by benthic particles.
2.1.2. Dreissena polymorpha
Mussels were collected in March at the Lac-du-Der-Chantecoq (48°36′07.7″ N; 4°44′37.0″ E), and sorted according to their size. Then, 1080 individuals measuring 2 ± 0.2 cm were gently cleaned and put by groups of 180 into tanks containing 15 L of Cristalline® source water, the aerating system was the same as described for A. anatina. The temperature was then increased daily of 1 °C until reaching 18 ± 2°C. During the acclimatisation, animals were fed twice a week with 2 × 10⁶ cells of Chlorella vulgaris/indiv./day (Greensea, Mèze, France) in order to maintain the same food: body weight ratio as A. anatina.
2.1.3. Cyanobacteria
The cyanobacteria P. agardhii (Anagnostidis and Komárek, 1988), is one of the most occurring filamentous cyanobacteria and the more abundant in temperate zones of the northern hemisphere [50]. P. agardhii (PMC 75-02) was isolated and provided by the National Museum of Natural History (Paris, France). Cells culture were grown in 5 L of Erlenmeyer with BG 11 medium, at 20 ± 3 °C under constant light (Sylvania Grolux T8, Budapest, Hungary) and aerated by an air pump (Zolux, Clisson, France). No antibiotics were added. Cultures were replenished with a new medium weekly to ensure that the cyanobacteria remained in the exponential growth phase.
2.2. Experimental Design
Three days before the experiments, mussels were unfed to prevent a potential impact of the presence of food within guts on the ingestion rate of cyanobacteria. A. anatina and D. polymorpha were exposed to three densities of P. agardhii, producing an equivalent of 1, 10 and 100 µg MC/L (intracellular MC). The frequencies of cyanobacteria necessary to maintain a constant intracellular MC concentration of exposure were evaluated during preliminary experiments with both bivalve species. To prevent a potential effect of the addition of food particles on MC accumulation and detoxification by mussels [51,52], the only food material consisted in the MC-producing cyanobacteria P. agardhii added manually in aquaria animals were unfed during the depuration. The water was entirely renewed weekly with constant ratio of three A. anatina/L and 12 D. polymorpha/L, ensuring using the same ratio of tissues FW/L for both species.
Control tanks, exempt of mussels but containing similar densities of cyanobacteria, were used to evaluate the ingestion of cells by bivalves during the exposure through a daily enumeration of filaments (see Section 2.3). However, the enumeration of filaments in tanks containing the lowest cyanobacteria density of exposure (producing an equivalent of 1 µg MC/L) was tenuous and did not reflect the ingestion by mussels. Therefore, no control tank containing this density was used. The study was conducted in duplicate for each concentration and both conditions (with and without mussels). Overall, we estimated that A. anatina exposed to 1 µg MC/L were exposed to 2.0 × 10⁵ ± 5.0 × 10⁴ cells/L, those exposed to 10 µg MC/L were exposed to 2.4 × 10⁶ ± 5.0 × 10⁵ cells/L and those exposed to 100 µg MC/L were exposed to 2.0 × 10⁷ ± 4.3 × 10⁶ cells/L. Regarding D. polymorpha, mussels exposed to 1 µg MC/L were exposed to 2.0 × 10⁵ ± 4.0 × 10⁴ cells/L, those exposed to 10 µg MC/L were exposed to 1.8 × 10⁶ ± 5.0 × 10⁵ cells/L and those exposed to 100 µg MC/L were exposed to 1.4 × 10⁷ ± 2.3 × 10⁶ cells/L.
At days 0, 1, 3, 7, 14, 21 of exposure and of depuration, three pools of six D. polymorpha and three pools of three digestive glands of A. anatina per concentration were randomly collected among tanks replicates before the quantification of free and total MC contents. Additionally, at days 3, 7, 21 of exposure and day three of depuration, three pools of three whole A. anatina and three pools of 10 digestive glands of D. polymorpha were sampled. Mussels were put 24 h in clear water before being sacrificed, removed from their shells, dissected, and stored at −80 °C until being freeze-dried. This one-day starvation in clear water was performed to ensure that MC contents in tissues only reflect the fraction assimilated by mussels and not cyanobacterial filaments in guts. Samples were further grinded for 8 min at 30 Hz with a Mixer Mill MM400 (Retsch, Haan, Germany) using four beads and stored at 4 °C.
2.3. Measurement of Cyanobacteria and MC Ingestion by Bivalves
The ingestion of P. agardhii filaments was measured daily for mussels exposed to 10 and 100 µg MC/L, considering the growth of the cyanobacterial population in controls. Cyanobacteria densities were measured with an optic microscope (Primovert, Zeiss, Oberkochen, Germany) and KOVA® slides (Kova slide, VWR, Fontenay-sous-Bois, France). The daily ingestion rate was calculated by subtracting the number of cells present in tanks containing mussels from the number of cells present in control tanks, under the assumption of a similar daily growth rates in both conditions. MC production by cyanobacteria in cultures was determined weekly (2.4.1), in order to determine the MC content produced by a cyanobacterial cell. Associated with the number of cells ingested per mussel and per day, this cellular MC production allowed to estimate the daily ingestion of MC per individual mussel.
2.4. Quantification of Free MC by ELISA
2.4.1. Quantification of Free MC in Cyanobacterial Cultures
MC production by cyanobacteria was evaluated using enzyme-linked immunosorbent assay (ELISA) (Abraxis LLC, Warminister, PA, USA). In the cyanobacteria matrix, free MC measured by ELISA can account up to 99% of total MC measured by an analysis of MMPB [53]. After homogenization of cultures, 20 mL were sampled and filtered (1 µm Cyclopore track etched membrane, Whatman, Maidstone, United Kingdom). Free MC were extracted with 80% MeOH, and samples were first placed in an ultrasound water bath for 15 min at 35 kHz (Bioblock scientific, Strasbourg, France) and then subjected to three cycles of centrifugation-probe sonication (UP200S, Hielscher Ultrasonics GmbH, Germany). After centrifugation, ELISA tests were performed on the supernatant according to the manufacturer’s protocols. Analyses were performed in duplicate for each sample at various dilution factors (10, 50, 100). Fluorescence was measured at 450 nm using an absorbance microplate reader (Tecan, Männedorf, Switerland).
2.4.2. Quantification of Free MC in Bivalves’ Tissues
Free MC were extracted from 10 mg of freeze-dried bivalve tissue with 1 mL of 80% methanol. Samples were placed in an ultrasound water bath for 15 min at 35 kHz (UP200S, Bioblock scientific, Strasbourg, France), and then subjected to three cycles of centrifugation-probe sonication (sonication: 1 min, 30% amplitude and 50% duty cycle; centrifugation: 10 min, 2500 rpm). The supernatant was kept at 4 °C and another millilitre of 80% methanol was added to the pellet in order to repeat the extraction as described before. Then both supernatants were pooled together and stored at −80 °C until analysis in duplicate at various dilution factors (10, 50, 100) using ELISA test (Abraxis LLC, Warminister, PA, USA). To determine the recovery rate of MC in each species, unexposed mussels were sacrificed and removed from their shell. Tissues were freeze dried, grinded and spiked with 1, 10 and 100 µg of MC-LR standard, and analysed as described previously. The mean percentages of extraction and detection of free MC on these freeze dried tissues was 56.4 ± 14.1% for the digestive glands of A. anatina and 58.9 ± 4.6% for whole D. polymorpha. Measured concentration in mussels were then corrected by the recovery rate.
2.5. Quantification of Total MC in Bivalve Tissues by LC-MS/MS
2.5.1. Extraction of Total MC
The determination of total MC content was performed according to the literature [54] with some changes. Briefly, freeze-dried tissues were put in glass tubes containing Sörensen’s phosphate buffer (pH 7.5) and were hydrolysed two hours with a tryspin-EDTA mix at 37 °C on a stirring tray. Solutions were then oxidised 3 h at 37 °C with 0.025 M KMNO4/INAO4 solution (pH = 9) under continuous mild stirring. The reaction was quenched with the addition of sodium bisulfite until the liquid became fully transparent. Then, pH was checked and sulfuric acid (10% w/w) was added if the values were above three. Extraction was performed with 3-cc (60 mg) SPE cartridges (Waters, Milford, MA, USA), previously washed with 5 mL of Milli-Q water then 5 mL of 100% methanol. Cartridges were further washed with first water (5 mL) then 15% methanol (5 mL) and dried. The elution was done with 2 mL of 80% methanol, and the eluent was dried under azote at 35 °C [55]. Then samples were redissolved in 200 µL of 35% methanol and put in inserts, centrifuged and stored at 4 °C.
2.5.2. LC-MS/MS Analysis
The LC-MS/MS analysis of the released MMPB from tissue extraction was performed according to Neffling et al. (2010). The system consisted of a Waters Synapt mass spectrometer (Waters, Milford, MA, USA) coupled with Alliance e2695 separation module (Waters, Milford, MA, USA) and MassLynx software (vs. 4.1, Micromass, Manchester, UK). An agilent ZORBAX SB-C18 5 µm 3.0 × 250 mm (Agilent Technologies, Palo Alto, CA, USA) column was used and kept at 30 °C. The mobile phase consisted of solvent A: 0.1% formic acid in water and B: methanol. The gradient programme for MMPB detection was from 25% to 90% B over 12 min, held at 90% B for 2 min, flow rate 0.3 mL/min. The injection volume was 10 µL. The analysis was conducted in positive electrospray ionisation. The MS ion source was programmed as follows: desolvation gas flow 800 L/min, capillary voltage 4 kV, sampling cone voltage 5 V in MRM mode. The followed transition were m/z 209.2 to m/z 131.1 and 91.
The standard curve was performed by spiking unexposed tissues (n = 3) of each species. Tissues were extracted as described above and, after being redissolved in 35% methanol, samples were spiked with 2, 4, 8, 10, 12, 50, 150, 300 and 800 ng of MMPB. To determine the percentage of recovery of total MC in digestive glands or whole individuals of each species, we spiked non-exposed tissues with 1, 100 and 1000 µg of MC-LR before the oxidation. The mean percentages of extraction and detection of total MC on these freeze-dried tissues varied according to the range of doping concentrations used and was between 32.9 ± 0.02% and 58.8 ± 16.1% for the digestive glands of A. anatina and between 36.5 ± 1.2% and 67.0 ± 14.9% for whole D. polymorpha. Total MC concentrations were calculated by applying an extraction yield depending on the MC concentration range. Free MC were expressed in µg MC/g of dry weight (DW). Values obtained in tissues during this experiment were then expressed in µg/g DW and corrected by the recovery rate. The quantity of bound MC was evaluated per pool of mussels, by subtracting the amount of free MC measured by ELISA to the amount of total MC measured after oxidation and analysis by LC-MS/MS.
2.6. Calculation of MC Exposure, Percentage of Accumulation and Condition Index
The ingestion of cyanobacteria and of MC were quantified in order to evaluate percentages of accumulation. As free MC only represent a fraction of the total amount of MC measured in tissues, we used total MC values to calculate the two accumulation percentages.
The cumulated percentage of accumulation (cum % acc) was calculated for each sampling time, using the total MC content in tissues (µg/g DW) converted in µg/g FW using pre-established FW/DW ratios (A. anatina digestive gland: 6.4; whole A. anatina: 11.5; D. polymorpha digestive gland: 9.3; whole D. polymorpha: 14.1), the tissues’ weight (g) and the cumulative quantity of ingested MC (µg):
However, this ratio comparing the cumulated accumulation to the cumulated ingestion at each date does not reflect the potential dynamics of MC accumulation and detoxification within tissues during the exposure. To better represent those variations, we calculated the temporary percentage of accumulation (temp % acc), using means of accumulated total MC and of ingested MC for several considered periods during the intoxication (between day 0–1, 1–3, 3–7, 7–14, 14–21):
To assess a potential impact of the exposure to cyanobacteria on the overall mussel health condition, the condition index (CI) was measured using the total weight (non-dissected mussel with dried shell) and soft tissues weight as follows:
2.7. Statistics
Statistical analyses were performed with Statistica (Version 8.0, Statsoft, Tulsa, OK, USA, 2007). Data normality was evaluated with a Shapiro–Wilk test, and the homogeneity of variances was studied with a Levene test. Because data set did not display a normal distribution, non-parametric tests were used. The comparison of two independent samples was done with Bonferroni-corrected Mann–Whitney tests and the comparison of multiple independent samples was done with Kruskal–Wallis tests. For parametric data, one-way ANOVA-Tukey tests were used.
3. Results
3.1. Condition Index and Mortality
Neither A. anatina nor D. polymorpha condition indexes (CI) differed between densities of exposure during the experiment (Kruskal–Wallis test, p > 0.05 for each species). Mean A. anatina CI during the experiment were similar (0.4 ± 0.03) whatever the concentration of exposure. This was also observed in D. polymorpha, where mean CI were similar (0.1 ± 0.01) whatever the concentration of exposure. Regarding mussels’ mortalities, here no A. anatina died and no significant D. polymorpha death was observed during the experiment (Kruskal–Wallis test, p > 0.05).
3.2. Ingestion of MC-Producing Cyanobacteria P. agardhii
A. anatina ingested daily the MC-producing cyanobacteria P. agardhii for 21 days, as showed by the number of filaments ingested per day during the exposure (Figure 1A). The quantity of filaments ingested by A. anatina exposed to a density producing an equivalent of 100 µg MC/L was significantly higher compared to those exposed to 10 µg MC/L (ANOVA, p < 0.01).
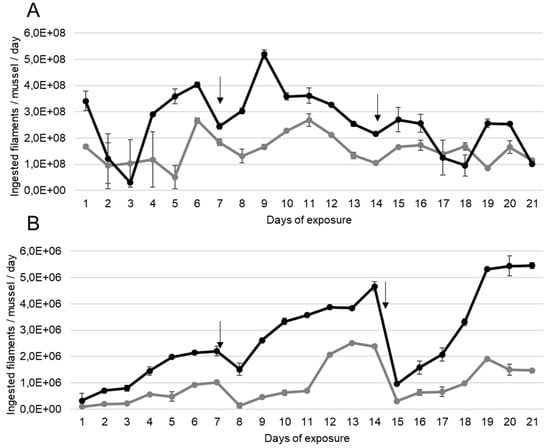
Figure 1.
Mean ± S.E.M number of filaments of P. agardhii ingested per day by (A) A. anatina and (B) D. polymorpha, during exposure to a density of filaments producing an equivalent of 10 µg (grey lines) and 100 µg (black lines) MC/L, n = 2 aquariums. Days for which the water was completely renewed are indicated with an arrow.
D. polymorpha also ingested the filamentous MC-producing P. agardhii continuously for 21 days when exposed to densities producing an equivalent to 10 and 100 µg MC/L (Figure 1B). In D. polymorpha exposed to a density equivalent to 10 µg MC/L, the number of ingested filaments per day increased weekly, from the first to the last day before the entire water renewal but this increase was not significant (ANOVA, p > 0.01). The minimum number of ingested filaments per day was observed at the first day of exposure (9.0 × 10⁴ ± 6.9 × 10³ filaments/day) and the maximum was observed at day 14 (2.4 × 10⁶ ± 5.6 × 10⁴ filaments/day). The same pattern seemed to emerge for those exposed to 100 µg MC/L. Also, D. polymorpha increased its consumption of MC-producing filament during the experiment, as the number of ingested filaments was significantly lower (ANOVA, p < 0.05) during the first week (mean number of ingested filaments: 5.0 × 10⁵ ± 1.4 × 10⁵) compared to the second (mean number of ingested filaments: 1.3 × 10⁶ ± 3.8 × 10⁵) and the third (mean number of ingested filaments: 6 × 10⁶ ± 2.2 × 10⁵) weeks.
3.3. Accumulation and Elimination of Free and Total MC by A. anatina
Free MC were rapidly accumulated by A. anatina as they were detected in tissues from the first day of exposure (Figure 2A). However, there were no significant differences in free MC concentration in A. anatina tissues between the exposure concentrations (Kruskal–Wallis, p > 0.05). Toxin contents in A. anatina exposed to densities of filaments producing an equivalent of 1, 10 and 100 µg MC/L increased from day one (respectively 0.10 ± 0.10; 1.4 ± 0.55 and 0.7 ± 0.3 µg MC/g DW) to a maximum at day 14 of exposure for mussels exposed to 10 and 100 µg MC/L (respectively 9.9 ± 0.5 and 14.05 ± 4.3 µg MC/g DW) and at day 21 for those exposed to 1 µg MC/L (12.0 ± 5.0 µg MC/g DW). During the depuration, the free MC contents in tissues decreased more rapidly in mussels exposed to a density of filaments producing an equivalent of 1 and 100 µg MC/L, compared to those exposed to an equivalent of 10 µg MC/L (Figure 2A).
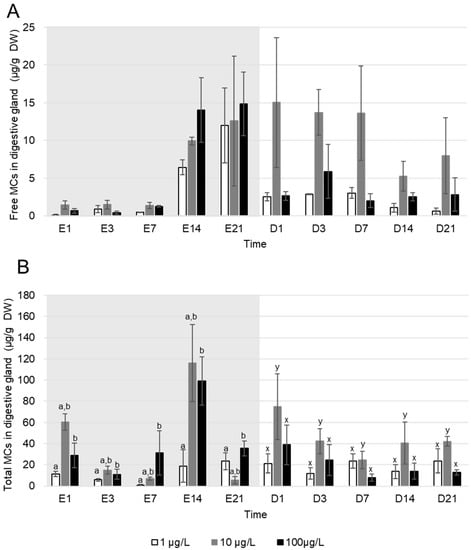
Figure 2.
Mean ± S.E.M concentrations (µg/g DW) of (A) free and (B) total MC accumulated in the digestive glands of A. anatina exposed to P. agardhii producing an equivalent of 1 (white), 10 (grey) and 100 (black) µg MC/L, during the exposure (days with the letter E, grey background) and the depuration (days with the letter D, white background), n = 3 pools of 6 individuals. No significant difference between concentrations of the same sampling time (Kruskal–Wallis test, p > 0.05). Letters indicate difference in MC accumulation (Kruskal–Wallis, p < 0.05) between exposure concentration series during the exposure (a and b), and the depuration (x and y).
Total MC (Figure 2B) were detected in digestive glands of A. anatina from the first day of exposure to the last day of depuration regardless of the exposure concentration. During the experiment, the mean percentage of bound MC in A. anatina was 70 ± 7% during the exposure and 74 ± 4% during the depuration. During the exposure, the total MC contents in A. anatina exposed to a density of filaments producing an equivalent 100 µg/L were significantly higher than in mussels exposed to 1 µg MC/L (Kruskal–Wallis, p < 0.05). However, MC concentration in mussels exposed to a density producing an equivalent to 10 µg MC/L did not differ significantly compared to the two other densities (Kruskal–Wallis, p > 0.05). The maximum total MC accumulation was observed at day 21 of exposure in A. anatina exposed to a density of filaments producing an equivalent of 1 µg MC/L (23.4 ± 8.0 µg MC/g DW), and at day 14 of exposure in mussels exposed to a density of cyanobacteria producing an equivalent of 10 and 100 µg MC/L (116.2 ± 36.5 µg MC/g DW and 99.1 ± 22.1 µg MC/g DW respectively) (Figure 2B). During the depuration, MC concentrations in mussels exposed to an equivalent of 10 µg MC/L were significantly higher compared to the two other exposure concentrations (Kruskal–Wallis, p < 0.05), and no differences were observed between those exposed to 100 and 1 µg MC/L (Kruskal–Wallis, p > 0.05). Thus, no direct correlation between free and total MC concentration in digestive glands of A. anatina and levels of water contamination were observed during the exposure nor during the depuration.
Regarding the accumulation of total MC in the entire body of A. anatina (Table 1), concentrations in the digestive gland were five times higher compared to whole individuals, a difference that was significant (Mann–Whitney test, p < 0.01). However, total MC concentrations in whole individuals displayed important variability within the same pool of three mussels (Table 1). Additionally, total MC concentrations in whole A. anatina did not differ significantly between densities during the experiment (Kruskal–Wallis, p > 0.05).

Table 1.
Total MC concentrations (µg MC/g DW) in whole A. anatina and digestive glands of D. polymorpha at days 3, 7 and 21 of exposure and day three of depuration in mussels exposed to a density of P. agardhii producing an equivalent of 1, 10 and 100 µg MC/L. Data not shown due to technical difficulties are referred as ND (Not Determined).
3.4. Accumulation and Elimination of Free and Total MC by D. polymorpha
Free MC were detected in D. polymorpha tissues only from the third day of exposure regardless of the exposure concentration (Figure 3A). Maximum concentrations of free MC in whole D. polymorpha occurred either at day 14 of exposure for mussels exposed to a density of filaments producing an equivalent of 1 (0.3 ± 0.1 µg MC/g DW) and 100 µg MC/L (6.4 ± 3.0 µg MC/g DW), or at the first day of depuration for mussels exposed to a density of filaments producing an equivalent of 10 µg MC/L (5.2 ± 3.8 µg MC/g DW). During the depuration, MC ceased to be detected in tissues asynchronously: in mussels exposed to 1 µg MC/L, only one sample out of three was positive (0.1 µg MC/g DW) at the first day of depuration and free MC ceased to be detected in all mussels from day three of depuration. In mussels exposed to 10 µg MC/L, free MC were detected in all pools at the first day of depuration. Then, no MC were detected from day seven to 21 of depuration, apart one positive pool at day 21 (mean concentration of 0.1 ± 0.1 µg MC/g DW) (Figure 3A). MC were still detected in D. polymorpha exposed to 100 µg MC/L after 21 days of depuration (0.4 ± 0.1 µg MC/g DW). Over the exposure and the depuration, free MC concentrations in mussels exposed to 100 µg MC/L were significantly higher compared to those exposed to 1 µg MC/L (Kruskal–Wallis, p < 0.01). However, even if MC concentration in mussels exposed to 10 µg MC/L tended to be intermediary, these concentrations were not were not statistically different from MC content in mussel exposed to 1 and 100 µg MC/L (Kruskal–Wallis, p > 0.051).
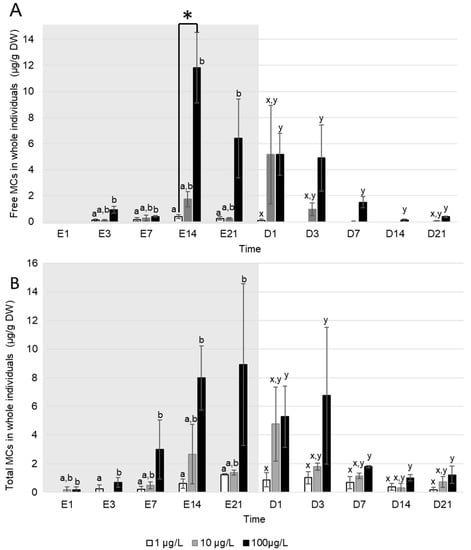
Figure 3.
Mean ± S.E.M concentrations (µg/g DW) of (A) free and (B) total MC accumulated in whole D. polymorpha exposed P. agardhii producing an equivalent of 1 (white), 10 (grey) and 100 (black) µg MC/L, during the exposure (days with the letter E, grey background) and the depuration (days with the letter D, white background), n = 3 pools of 6 individuals. * Indicates a significant difference between concentrations at the same time (Kruskal–Wallis test, p < 0.05). Letters indicate difference in MC accumulation (Kruskal–Wallis, p < 0.05) between exposure concentration series during the exposure (a and b), and the depuration (x and y).
Total MC (Figure 3B) were detected from the first day of exposure in whole D. polymorpha exposed to 10 and 100 µg MC/L (0.2 ± 0.2µg MC/g DW for each concentration) and from day three in those exposed to 1 µg MC/L (0.3 µg MC/g DW) but only in one sample. During the exposure, total MC concentrations in tissues were higher in D. polymorpha exposed to 100 µg MC/L compared to those exposed to 1 µg MC/L (Kruskal–Wallis, p < 0.05). No significant difference was observed between mussels exposed to a 10 µg MC/L and the two other exposure concentrations (Kruskal–Wallis, p > 0.05). Highest total MC concentrations in D. polymorpha were observed at different times of the intoxication depending on the exposure concentrations: at day 21 for the densities producing an equivalent of 1 (1.3 ± 0.05 µg MC/g DW) and 100 µg MC/L (8.9 ± 5.65 µg MC/g DW), and at day one of depuration for 10 µg MC/L (4.75 ± 2.6 µg MC/g DW). During the exposure, the mean percentage of bound MC in D. polymorpha was of 50 ± 9% during the accumulation and 75 ± 8% during the depuration. During the depuration, total MC concentrations were significantly higher in D. polymorpha exposed to 100 µg MC/L, compared to those exposed to 1 µg MC/L (Kruskal–Wallis, p < 0.05). No significant difference was observed between mussels exposed to 10 µg MC/L and the two other intracellular MC concentrations (Kruskal–Wallis, p > 0.05). After 21 days of depuration, total MC were still detected in tissues of D. polymorpha whatever the exposure concentration. At this day, mean total MC concentration were 0.2 ± 0.2 µg MC/g DW, 0.7 ± 0.4 µg MC/g DW and 1.2 ± 0.61 µg MC/g DW, respectively, in mussels exposed to 1, 10 and 100 µg MCs/L.
Total MC concentrations in digestive glands of D. polymorpha (Table 1) did not differ significantly between densities during the experiment (Kruskal–Wallis, p > 0.05). Moreover, these total MC concentrations in digestive glands of D. polymorpha were similar than those quantified in whole individuals during the experiment (Mann–Whitney test, p > 0.05).
3.5. Accumulation Factors
The cumulated percentages of accumulation (cum % acc) of A. anatina, representing the ratio between the amount of total MC in the digestive gland at a defined day and the cumulated amount of ingested MC at the same day is presented in Table 2. For mussels exposed to 10 µg MC/L, the cum % acc significantly decreased from day three (38.8 ± 16.5%) to day 21 (1.4 ± 0.5%) (Kruskal–Wallis test, p < 0.05). A decrease was also observed in mussels exposed to 100 µg MC/L, although not significant (Mann–Whitney, p > 0.05). The comparison of cum % acc for each day of exposure showed that overall, mussels exposed to 100 µg MC/L accumulated 1.2 ± 0.2 more ingested MC compared to those exposed to 10 µg MC/L (Mann–Whitney, p < 0.05).
Table 2.
Cumulated percentage of total MC accumulation (cum % acc), amount of ingested MC (ng) per mussel between two sampling times, difference in the amount of total MC accumulated (ng) between the same sampling times, and temporary percentage of total MC accumulation (temp % acc) of the same time range. Data not shown due to technical difficulties are referred as ND (not determined).
For D. polymorpha (Table 2), overall no differences of cum % acc were observed between concentrations (Mann–Whitney, p > 0.05) and no variation of cum % acc appeared between different sampling times for each concentration (Kruskal–Wallis test, p > 0.05). The only exception was observed on day 21, when mussels exposed to 10 µg MC/L accumulated more of ingested MC compared to those exposed to 100 µg MC/L (Mann–Whitney, p < 0.05).
The temporary percentage of total MC accumulation (temp % acc) of A. anatina displayed numerous variations over time for each concentration, from a minimum of −102.6% between day one and three to a maximum of 61.6% between days zero and one, both for mussels exposed to 100 µg MC/L and for those exposed to 10 µg MC/L (Table 2). On the contrary, few variations of the temp % acc were observed in D. polymorpha, comprised between −0.05% (between day one and three at 10 µg MC/L), which is the only negative value, and 0.63 (between day 14 and 21 at 10 µg MC/L) (Table 2).
4. Discussion
This study addresses whether D. polymorpha and A. anatina could be used to reveal the presence of MC-producing cyanobacteria in freshwater. In addition, we studied which MC analysis, the free or the total (free and protein-bound) fraction, in mussels’ tissues is more suitable to monitor MC-producing cyanobacteria. To achieve this, both species were exposed to a MC-producing strain of P. agardhii for 21 days followed by 21 days of depuration, and kinetics of free and total MC were studied in their tissues (i.e., in the digestive gland of the larger species A. anatina and in the entire body of D. polymorpha, representing whole mussels).
Bound MC were detected at the first day of exposure in D. polymorpha exposed to 10 and 100 µg MC/L and in A. anatina whatever the exposure concentration. This means that MC binding to intracellular proteins may have occurred in less than 24 h, as observed with purified proteins [12,56,57]. Free MC were detected within the first 24 h of exposure in digestive glands of A. anatina and from day 3 of exposure in whole D. polymorpha. This delayed detection of MC in whole individuals of D. polymorpha could be a result of a biodissolution among all organs, as the digestive gland is known to be MC target organ in invertebrates [37,38].
Here, MC accumulation tended to be concentration-dependent in whole D. polymorpha, for which MC concentration in individuals exposed to 10 µg MC/L was intermediary, between the concentration measured in those exposed to 1 and 100 µg MC/L. However, the differences in MC accumulation between exposure concentrations were not significant for both species and both accumulation fractions. Several hypotheses could explain this observation based on bivalves’ physiology.
First, a temporary decrease or stoppage of the ingestion of P. agardhii may have occurred during the exposure, but this hypothesis is not supported by the data. Indeed, both species continuously ingested the MC-producing cyanobacteria during the three-week exposure, and D. polymorpha even increased it consumption over time, demonstrating that the mussels do not seem to have reacted to the toxicity by closing their shells. Similarly, filtration rates of Limnoperna fortunei were not significantly different for toxic and non-toxic M. aeruginosa throughout a laboratory exposure [58]. Moreover, in our study, mussels exposed to 100 µg MC/L ingested more filaments compared to those exposed to 10 µg MC/L. However, short-term punctual changes in the filtration rates may be part of the variations of MC concentrations in tissues over time. Indeed, it is known that the filtration is not a constant phenomenon and inter-individual variations are high [59].
Secondly, the triggering of detoxication pathways may have fluctuated between exposure concentrations. The most described pathway of MC detoxification by bivalves involves the glutathione S-transferase (GST) and glutatione (GSH). MC can be conjugated to GSH [60], reducing MC toxicity and potentially enhancing its excretion [61]. This conjugation is catalysed by GSTs, a multigene family of enzymes responsible for phase II biotransformation processes, representing a defence mechanism against xenobiotics [62]. GST is known to catalyze the conjugation of MC to glutathione in bivalves [63]. Another mechanism involves the multi-xenobiotic-resistance (MXR) phenomenon, based on the overexpression of transmembrane P-glycoproteins that prevent the cellular accumulation of various substances by actively pumping them out of cells [64]. MXR was suggested as a possible explanation for the insensitivity of D. polymorpha towards MC [65]. Here, it is possible that the detoxification was triggered while A. anatina were exposed to 10 µg MC/L, as reflected by the variations of the cumulated accumulation factor over the exposure period. This hypothesis is also supported by A. anatina negative temporal accumulation ratio observed between some days (e.g., between day one and three in mussels exposed to an equivalent of 100 µg MC/L), whereas the ingestion of filaments continued during this time range. Therefore, A. anatina may not have decreased their ingestion rate of P. agardhii during this period but have far less accumulated MC, probably via MC metabolization and/or detoxification. The detoxification mechanisms were probably dynamic over time and not constant, being alternately activated and exhausted, explaining the great variations observed in the temporal accumulation rates of A. anatina. The cumulative accumulation factor being overall higher during exposure to 100 µg MC/L compared to 10 µg MC/L might be explained by exhaustion of detoxification processes at the highest concentration of exposure. Regarding D. polymorpha, its detoxification systems may have been more efficient, as illustrated by its constant and far lower MC accumulation factors than the ones of A. anatina. Moreover, our results suggest that the mechanisms of MC detoxification may have been triggered earlier and at a lower exposure concentration (from 1 µg MC/L) in D. polymorpha compared to A. anatina. This hypothesis is also supported by the literature. Indeed, D. polymorpha showed elevated sGST levels after 24-h exposure to 10 or 50 µg MC/L of a cyanobacterial crude extract, an increase still visible but not significant after seven days of exposure [66].
Here, A. anatina accumulated a higher percentage of ingested MC compared to D. polymorpha. However, the comparison was performed between the digestive gland of A. anatina, MC target organ, and whole individuals of D. polymorpha. We therefore also compared the total MC concentrations in whole A. anatina versus whole D. polymorpha, and in the digestive glands of both species. Results still showed a higher accumulation in A. anatina compared to D. polymorpha, which was previously reported and attributed to D. polymorpha selective feeding and its strong MC biotransformation capacities. [39].
4.1. Potential Use of the Two Bivalves as Bioindicators of the Presence of MC-Producing Cyanobacteria in Fresh Waters
The main criteria for a species to be qualified as a bioindicator is to be able to accumulate toxins in proportion with the level of the environmental contamination. The species should also be able to highlight the dynamic of this contamination. In addition, to detect cyanobacterial blooms’ onset, bioindicator species must accumulate MC from low densities of their producers in water.
Here, both bivalve species were able to reveal low contamination levels of intracellular MC. Indeed, MC were detected in digestive glands of A. anatina from the first day of exposure, when exposed to approximately 2.0 × 10⁵ ± 5.0 × 10⁴ cells/L (density of filaments producing an equivalent of 1 µg MC/L). This density is lower than the one used in a 24 h-exposure of Unio elongatulus Pfeiffer, 1825 to M. aeruginosa (2.0 × 10⁶ ± 4.5 × 10⁵ cells/L) where MC were detected in five out of six mussels [28]. D. polymorpha was able to reveal MC presence when exposed to approximately 2.0 × 10⁵ ± 4.0 × 10⁴ cells/L (producing an equivalent of 1 µg MC/L).
However, MC content in digestive gland of A. anatina was not time nor concentration dependent under these laboratory conditions. Thus, digestive glands of A. anatina might not be pertinent to evaluate levels of water contamination by cyanobacteria over a short timeframe. A. anatina mussels may, therefore, be useful to assess the presence or absence of MC-producing cyanobacteria in medium- or long-term studies with monthly animal samplings.
D. polymorpha started to accumulate later (from day three) at the lower concentration of exposure (1 µg MC/L), but was further able to accumulate both total and free MC more steadily (with few variations of accumulation ratios over time and among concentrations) and more proportionally to the concentration present in the medium than A. anatina. Thus, D. polymorpha could be more appropriate to estimate the levels of intracellular MC concentrations in fresh waters, pending further investigations to assess the stability of the correlation between both parameters.
4.2. Which MC Fraction, Free or Total, in Mussel Tissues Best Reveals the Level and Dynamic of MC-Producing Cyanobacteria in Fresh Waters?
Overall, as observed in the gastropod Lymnaea stagnalis (Linnaeus, 1758) exposed to P. agardhii, the percentage of bound MC was higher in D. polymorpha during the depuration compared to the end of the exposure [47]. This increase has been attributed to a high elimination of free MC during the depuration, associated with a slower elimination of covalently bound MC that may occur via the renewal of Ppases or the elimination of damages cells.
As expected, total MC concentration was considerably greater than free MC, which is consistent with previous studies [41,47,67,68,69]. Thus, the analysis of total MC allows more detailed information about the MC content in a biological matrix. However, for both species, this fraction did not represent short-term MC variations in the medium, as total MC were still detectable in bivalve tissues after three weeks of depuration. Therefore, the measurement of total MC in sentinel species could potentially induce a risk overestimation if it occurs until three weeks after the end of a cyanobacterial bloom. Moreover, the MC extraction with a Lemieux oxidation of tissue is time consuming and recovery rates remains variable and difficult to assess. Indeed, we found that extraction yields for both species were not constant and varied depending on MC concentration in tissues. Thus, the total MC extraction in biological matrix still requires to be improved. The analysis of free MC in bivalve tissues with ELISA seemed more reliable to represent the dynamic of MC-producing cyanobacteria in the medium, as a rapid and time-dependant elimination of free MC occurred after the exposure in D. polymorpha. Moreover, the analysis of free MC in bivalve tissues may be suitable to early detect low densities of MC-producing cyanobacteria in the medium, as they were detected from the first and the third day of exposure in digestive glands of A. anatina and in entire body of D. polymorpha exposed to 1 µg MC/L. The main critic about ELISA is its potential ability to generate false-positive results [1,14,46]. Although, in gastropods, no overestimation of the concentration of free MC measured by ELISA was observed compared to their measurement by LC-MS/MS [47]. In the present study, no MC were detected in controls (organisms unexposed to MC) using ELISA kits or LC-MS/MS.
4.3. Limitations
It is important to highlight that those experiments were carried out in controlled conditions, without influence of environmental factors, which may modify the bioaccumulation response. Thus, further in situ investigations are required to confirm the pertinence of both bivalves as bioindicators of the presence of MC-producing cyanobacteria in aquatic systems. Moreover, we used a filamentous cyanobacteria, but available studies suggest the ability of A. anatina and D. polymorpha to also filter colonial cyanobacteria and subsequently accumulate MC [33,34,39,40]. The relevance of using mussels when cyanobacterial genus of various size and shape (e.g., unicellular, filamentous or colonial) or various toxicity coexist would also require to be confirmed in situ.
5. Conclusions
This study shows that both A. anatina and D. polymorpha are able to accumulate free and bound MC when exposed to densities of the filamentous P. agardhii producing an equivalent of 1, 10 and 100 µg MC/L. Due to the spatio-temporal lability of cyanobacterial proliferations, filter-feeder mussels may be more informative about history of contamination of a waterbody than a punctual sampling of a few litres of water. The comparison of MC accumulation capacities of both species points out that A. anatina could potentially be used to reveal a contamination that occurred until three weeks before their sampling, and may therefore be used during medium- or long-term in situ studies to highlight low-level and/or intermittent presence of MC-producing cyanobacteria. D. polymorpha could be more appropriate during short-term investigations to estimate dynamics of a MC risk in water and rapidly revealing the end of a water contamination. The evaluation of the two accumulation fractions (free or total MC) confirmed that free MC reflected more rapidly and efficiently the environmental MC dynamics. Nonetheless, further laboratory and in situ exposures are required to study the relation between environmental and mussel MC concentrations in depth.
Author Contributions
Conceptualization, E.L. and A.L.; A.L., T.G. and S.J. performed the experiments and ran analysis. Data interpretation: A.L.; writing—original draft preparation A.L.; writing—review and editing E.L. and A.G.; supervision, E.L.; funding acquisition, E.L. All authors have read and agreed to the published version of the manuscript.
Funding
This study was supported jointly by the French EC2CO program of the Centre National de la Recherche (CNRS), BIEAUSUR project 2016–2017, and the PIREN-Seine funding.
Conflicts of Interest
The authors declare no conflict of interest.
References
- Meriluoto, J.; Spoof, L.; Codd, G.A.; Geoffrey, A. Handbook of Cyanobacterial Monitoring and Cyanotoxin Analysis; Meriluoto, J., Spoof, L., Codd, G.A., Eds.; John Wiley & Sons, Ltd.: Chichester, UK, 2016; ISBN 9781119068761. [Google Scholar]
- Paerl, H.W.; Otten, T.G. Harmful Cyanobacterial Blooms: Causes, Consequences, and Controls. Microb. Ecol. 2013, 65, 995–1010. [Google Scholar] [CrossRef]
- Weirich, C.A.; Miller, T.R. Freshwater Harmful Algal Blooms: Toxins and Children’s Health. Curr. Probl. Pediatr. Adolesc. Health Care 2014, 44, 2–24. [Google Scholar] [CrossRef]
- Manning, S.R.; Nobles, D.R. Impact of global warming on water toxicity: Cyanotoxins. Curr. Opin. Food Sci. 2017, 18, 14–20. [Google Scholar] [CrossRef]
- Humbert, J.-F.; Fastner, J. Ecology of Cyanobacteria. In Handbook of Cyanobacterial Monitoring and Cyanotoxin Analysis; John Wiley & Sons, Ltd.: Chichester, UK, 2017; pp. 9–18. ISBN 978-94-007-3854-6. [Google Scholar]
- Díez-Quijada, L.; Puerto, M.; Gutiérrez-Praena, D.; Llana-Ruiz-Cabello, M.; Jos, A.; Cameán, A.M. Microcystin-RR: Occurrence, content in water and food and toxicological studies. A review. Environ. Res. 2018, 168, 467–489. [Google Scholar]
- Fischer, W.J.; Altheimer, S.; Cattori, V.; Meier, P.J.; Dietrich, D.R.; Hagenbuch, B. Organic anion transporting polypeptides expressed in liver and brain mediate uptake of microcystin. Toxicol. Appl. Pharm. 2005, 203, 257–263. [Google Scholar] [CrossRef] [PubMed]
- Kim, R.B. Organic anion-transporting polypeptide (OATP) transporter family and drug disposition. Eur. J. Clin. Investig. 2003, 33, 1–5. [Google Scholar] [CrossRef] [PubMed]
- Hagenbuch, B.; Stieger, B. The SLCO (former SLC21) superfamily of transporters. Mol. Asp. Med. 2013, 34, 396–412. [Google Scholar] [CrossRef] [PubMed]
- Campos, A.; Vasconcelos, V. Molecular Mechanisms of Microcystin Toxicity in Animal Cells. Int. J. Mol. Sci. 2010, 11, 268–287. [Google Scholar] [CrossRef]
- MacKintosh, R.W.; Dalby, K.N.; Campbell, D.G.; Cohen, P.T.W.; Cohen, P.; MacKintosh, C. The cyanobacterial toxin microcystin binds covalently to cysteine-273 on protein phosphatase 1. FEBS Lett. 1995, 371, 236–240. [Google Scholar]
- Craig, M.; Luu, H.A.; McCready, T.L.; Williams, D.; Andersen, R.J.; Holmes, C.F.B. Molecular mechanisms underlying the interaction of motuporin and microycystins with type-1 and type-2A protein phosphatases. Biochem. Cell Biol. 1996, 74, 569–578. [Google Scholar] [CrossRef]
- Pereira, S.R.; Vasconcelos, V.M.; Antunes, A. The phosphoprotein phosphatase family of Ser/Thr phosphatases as principal targets of naturally occurring toxins. Crit. Rev. Toxicol. 2011, 41, 83–110. [Google Scholar] [CrossRef]
- van Apeldoorn, M.E.; van Egmond, H.P.; Speijers, G.J.A.; Bakker, G.J.I. Toxins of cyanobacteria. Mol. Nutr. Food Res. 2007, 51, 7–60. [Google Scholar] [CrossRef]
- Pobel, D.; Robin, J.; Humbert, J.F. Influence of sampling strategies on the monitoring of cyanobacteria in shallow lakes: Lessons from a case study in France. Water Res. 2011, 45, 1005–1014. [Google Scholar] [CrossRef]
- Hu, C.; Rzymski, P. Programmed Cell Death-Like and Accompanying Release of Microcystin in Freshwater Bloom-Forming Cyanobacterium Microcystis: From Identification to Ecological Relevance. Toxins 2019, 11, 706. [Google Scholar] [CrossRef]
- Hašler, P.; Poulíčková, A. Diurnal changes in vertical distribution and morphology of a natural population of Planktothrix agardhii (Gom.) Anagnostidis et Komárek (Cyanobacteria). Hydrobiologia 2003, 506, 195–201. [Google Scholar]
- Deng, J.; Chen, F.; Liu, X.; Peng, J.; Hu, W. Horizontal migration of algal patches associated with cyanobacterial blooms in an eutrophic shallow lake. Ecol. Eng. 2016, 87, 185–193. [Google Scholar] [CrossRef]
- Hoeger, S.J.; Shaw, G.; Hitzfeld, B.C.; Dietrich, D.R. Occurrence and elimination of cyanobacterial toxins in two Australian drinking water treatment plants. Toxicon 2004, 43, 639–649. [Google Scholar] [CrossRef]
- Oehlmann, J.; Schulte-Oehlmann, U. Chapter 17 Molluscs as bioindicators. Trace Met. Other Contam. Environ. 2003, 6, 577–635. [Google Scholar]
- Camusso, M.; Balestrini, R.; Muriano, F.; Mariani, M. Use of freshwater mussel Dreissena polymorpha to assess trace metal pollution in the lower River Po (Italy). Chemosphere 1994, 29, 729–745. [Google Scholar] [CrossRef]
- Zuykov, M.; Pelletier, E.; Harper, D.A.T. Bivalve mollusks in metal pollution studies: From bioaccumulation to biomonitoring. Chemosphere 2013, 93, 201–208. [Google Scholar] [CrossRef]
- Bourgeault, A.; Gourlay-Francé, C.; Vincent-Hubert, F.; Palais, F.; Geffard, A.; Biagianti-Risbourg, S.; Pain-Devin, S.; Tusseau-Vuillemin, M.-H. Lessons from a transplantation of zebra mussels into a small urban river: An integrated ecotoxicological assessment. Environ. Toxicol. 2010, 25, 468–478. [Google Scholar] [CrossRef] [PubMed]
- Su, L.; Cai, H.; Kolandhasamy, P.; Wu, C.; Rochman, C.M.; Shi, H. Using the Asian clam as an indicator of microplastic pollution in freshwater ecosystems. Environ. Pollut. 2018, 234, 347–355. [Google Scholar] [CrossRef] [PubMed]
- Baqar, M.; Sadef, Y.; Ahmad, S.R.; Mahmood, A.; Li, J.; Zhang, G. Organochlorine contaminants in freshwater mussels; occurrence, bioaccumulation pattern, spatio-temporal distribution and human health risk assessment from the tributaries of River Ravi, Pakistan. Hum. Ecol. Risk Assess. 2018, 24, 1268–1290. [Google Scholar] [CrossRef]
- Graczyk, T.K.; Conn, D.B.; Marcogliese, D.J.; Graczyk, H.; De Lafontaine, Y. Accumulation of human waterborne parasites by zebra mussels (Dreissena polymorpha) and Asian freshwater clams (Corbicula fluminea). Parasitol. Res. 2003, 89, 107–112. [Google Scholar]
- Palos Ladeiro, M.; Aubert, D.; Villena, I.; Geffard, A.; Bigot, A. Bioaccumulation of human waterborne protozoa by zebra mussel (Dreissena polymorpha): Interest for water biomonitoring. Water Res. 2014, 48, 148–155. [Google Scholar] [CrossRef]
- Lauceri, R.; Austoni, M.; Caviglia, F.; Kamburska, L.; Lami, A.; Morabito, G.; Pflueger, V.; Benavides, A.M.S.; Tonolla, M.; Torzillo, G.; et al. Coupling a bio-accumulator organism and MALDI-TOF MS: An early warning detection system for microcystins in water bodies. J. Appl. Phycol. 2017, 29, 2979–2988. [Google Scholar] [CrossRef]
- Ludyanskiy, M.L.; McDonald, D.; MacNeill, D. Impact of the Zebra Mussel, a Bivalve Invader. Bioscience 1993, 43, 533–544. [Google Scholar] [CrossRef]
- Swhalb, A.; Pusch, M. Horizontal and vertical movements of unionid mussels in a lowland river. J. N. Am. Benthol. Soc. 2007, 26, 261–272. [Google Scholar]
- Lopes-Lima, M.; Sousa, R.; Geist, J.; Aldridge, D.C.; Araujo, R.; Bergengren, J.; Bespalaya, Y.; Bódis, E.; Burlakova, L.; Van Damme, D.; et al. Conservation status of freshwater mussels in Europe: State of the art and future challenges. Biol. Rev. 2017, 92, 572–607. [Google Scholar] [CrossRef]
- Lopes-Lima, M. Anodonta Anatina. Available online: http://www.iucnredlist.org/details/155667/0 (accessed on 12 February 2016).
- Bontes, B.M.; Verschoor, A.M.; Pires, L.M.D.; van Donk, E.; Ibelings, B.W. Functional response of Anodonta anatina feeding on a green alga and four strains of cyanobacteria, differing in shape, size and toxicity. Hydrobiologia 2007, 584, 191–204. [Google Scholar] [CrossRef]
- Dionisio Pires, L.M.; Bontes, B.M.; Samchyshyna, L.; Jong, J.; Van Donk, E.; Ibelings, B.W. Grazing on microcystin-producing and microcystin-free phytoplankters by different filter-feeders: Implications for lake restoration. Aquat. Sci. 2007, 69, 534–543. [Google Scholar] [CrossRef]
- White, J.D.; Sarnelle, O. Size-structured vulnerability of the colonial cyanobacterium, Microcystis aeruginosa, to grazing by zebra mussels (Dreissena polymorpha). Freshw. Biol. 2014, 59, 514–525. [Google Scholar] [CrossRef]
- Juhel, G.; Davenport, J.; O’Halloran, J.; Culloty, S.C.; O’Riordan, R.M.; James, K.F.; Furey, A.; Allis, O. Impacts of microcystins on the feeding behaviour and energy balance of zebra mussels, Dreissena polymorpha: A bioenergetics approach. Aquat. Toxicol. 2006, 79, 391–400. [Google Scholar] [CrossRef] [PubMed]
- Chen, J.; Xie, P. Seasonal dynamics of the hepatotoxic microcystins in various organs of four freshwater bivalves from the large eutrophic Lake Taihu of subtropical China and the risk to human consumption. Environ. Toxicol. 2005, 20, 572–584. [Google Scholar] [CrossRef] [PubMed]
- Vasconcelos, V.M. Uptake and depuration of the heptapeptide toxin microcystin-LR in Mytilus galloprovincialis. Aquat. Toxicol. 1995, 32, 227–237. [Google Scholar] [CrossRef]
- Barda, I.; Kankaanpää, H.; Purina, I.; Balode, M.; Sjövall, O.; Meriluoto, J. Bioaccumulation of hepatotoxins—A considerable risk in the Latvian environment. Environ. Pollut. 2015, 196, 313–320. [Google Scholar] [CrossRef] [PubMed]
- Paldavičienė, A.; Zaiko, A.; Mazur-Marzec, H.; Razinkovas-Baziukas, A. Bioaccumulation of microcystins in invasive bivalves: A case study from the boreal lagoon ecosystem. Oceanologia 2015, 57, 93–101. [Google Scholar] [CrossRef]
- Dionisio Pires, L.M.; Karlsson, K.M.; Meriluoto, J.a.O.; Kardinaal, E.; Visser, P.M.; Siewertsen, K.; Van Donk, E.; Ibelings, B.W. Assimilation and depuration of microcystin–LR by the zebra mussel, Dreissena polymorpha. Aquat. Toxicol. 2004, 69, 385–396. [Google Scholar] [CrossRef]
- Ibelings, B.W.; Bruning, K.; De Jonge, J.; Wolfstein, K.; Dionisio Pires, L.M.; Postma, J.; Burger, T. Distribution of microcystins in a lake foodweb: No evidence for biomagnification. Microb. Ecol. 2005, 49, 487–500. [Google Scholar] [CrossRef]
- Yokoyama, A.; Park, H.D. Mechanism and prediction for contamination of freshwater bivalves (Unionidae) with the cyanobacterial toxin microcystin in hypereutrophic Lake Suwa, Japan. Environ. Toxicol. 2002, 17, 424–433. [Google Scholar] [CrossRef]
- Wood, S.A.; Briggs, L.R.; Sprosen, J.; Ruck, J.G.; Wear, R.G.; Holland, P.T.; Bloxham, M. Changes in concentrations of microcystins in rainbow trout, freshwater mussels, and cyanobacteria in Lakes Rotoiti and Rotoehu. Environ. Toxicol. 2006, 21, 205–222. [Google Scholar] [CrossRef] [PubMed]
- Metcalf, J.S.; Hyenstrand, P.; Beattie, K.A.; Codd, G.A. Effects of physicochemical variables and cyanobacterial extracts on the immunoassay of microcystin-LR by two ELISA kits. J. Appl. Microbiol. 2000, 89, 532–538. [Google Scholar] [CrossRef] [PubMed]
- Gaget, V.; Lau, M.; Sendall, B.; Froscio, S.; Humpage, A.R. Cyanotoxins: Which detection technique for an optimum risk assessment? Water Res. 2017, 118, 227–238. [Google Scholar] [CrossRef] [PubMed]
- Lance, E.; Neffling, M.R.; Gérard, C.; Meriluoto, J.; Bormans, M. Accumulation of free and covalently bound microcystins in tissues of Lymnaea stagnalis (Gastropoda) following toxic cyanobacteria or dissolved microcystin-LR exposure. Environ. Pollut. 2010, 158, 674–680. [Google Scholar] [CrossRef]
- Sano, T.; Nohara, K.; Shiraishi, F.; Kaya, K. A method for micro-determination of total microcystin content in waterblooms of cyanobacteria (blue-green algae). Int. J. Environ. Anal. Chem. 1992, 49, 163–170. [Google Scholar] [CrossRef]
- Harada, K.I.; Murata, H.; Qiang, Z.; Suzuki, M.; Kondo, F. Mass spectrometric screening method for microcystins in cyanobacteria. Toxicon 1996, 34, 701–710. [Google Scholar] [CrossRef]
- D’Alelio, D.; Salmaso, N. Occurrence of an uncommon Planktothrix (Cyanoprokaryota, Oscillatoriales) in a deep lake south of the Alps. Phycologia 2011, 50, 379–383. [Google Scholar] [CrossRef]
- Lance, E.; Brient, L.; Bormans, M.; Gérard, C. Interactions between cyanobacteria and Gastropods. Aquat. Toxicol. 2006, 79, 140–148. [Google Scholar] [CrossRef]
- Lance, E.; Bugajny, E.; Bormans, M.; Ge, C. Consumption of toxic cyanobacteria by Potamopyrgus antipodarum (Gastropoda, Prosobranchia) and consequences on life traits and microcystin accumulation. Harmful Algae 2008, 7, 464–472. [Google Scholar] [CrossRef]
- Foss, A.J.; Aubel, M.T. Using the MMPB technique to confirm microcystin concentrations in water measured by ELISA and HPLC (UV, MS, MS/MS). Toxicon 2015, 104, 91–101. [Google Scholar] [CrossRef]
- Neffling, M.-R.; Lance, E.; Meriluoto, J. Detection of free and covalently bound microcystins in animal tissues by liquid chromatography-tandem mass spectrometry. Environ. Pollut. 2010, 158, 948–952. [Google Scholar] [CrossRef]
- Sanan, T.T. Measurement of “total” microcystins using the MMPB method, and application to HAB impacted surface waters. In Proceedings of the Ohio AWWA Conference, Cincinnati, OH, USA, 13 September 2016. [Google Scholar]
- Hastie, C.; Borthwick, E.; Morrison, L.; Codd, G.; Cohen, P. Inhibition of several protein phosphatases by a non-covalently interacting microcystin and a novel cyanobacterial peptide, nostocyclin. Biochim. Biophys. Acta 2005, 1726, 187–193. [Google Scholar] [CrossRef] [PubMed]
- Maynes, J.T.; Luu, H.A.; Cherney, M.M.; Andersen, R.J.; Williams, D.; Holmes, C.F.B.; James, M.N.G. Crystal Structures of Protein Phosphatase-1 Bound to Motuporin and Dihydromicrocystin-LA: Elucidation of the Mechanism of Enzyme Inhibition by Cyanobacterial Toxins. J. Mol. Biol. 2006, 356, 111–120. [Google Scholar] [CrossRef] [PubMed]
- Gazulha, V.; Mansur, M.C.D.; Cybis, L.F.; Azevedo, S.M.F.O. Feeding behavior of the invasive bivalve Limnoperna fortunei (Dunker, 1857) under exposure to toxic cyanobacteria Microcystis aeruginosa. Braz. J. Biol. 2012, 72, 41–49. [Google Scholar] [CrossRef] [PubMed]
- Hartmann, J.T.; Beggel, S.; Auerswald, K.; Stoeckle, B.C.; Geist, J. Establishing mussel behavior as a biomarker in ecotoxicology. Aquat. Toxicol. 2016, 170, 279–288. [Google Scholar] [CrossRef]
- Kondo, F.; Ikai, Y.; Oka, H.; Okumura, M.; Ishikawa, N.; Harada, K.; Matsuura, K.; Murata, H.; Suzuki, M. Formation, Characterization, and Toxicity of the Glutathione and Cysteine Conjugates of Toxic Heptapeptide Microcystins. Chem. Res. Toxicol. 1992, 5, 591–596. [Google Scholar] [CrossRef]
- Hudnell, H.K. Cyanobacterial harmful algal blooms: State of the science and research needs. Proceedings of the Interagency, International Symposium on Cyanobacterial Harmful Algal Blooms (ISOC-HAB). Adv. Exp. Med. Biol. 2008, 619, 1–912. [Google Scholar]
- Hayes, J.D.; Flanagan, J.U.; Jowsey, I.R. Glutathione Transferases. Annu. Rev. Pharmcol. Toxicol. 2005, 45, 51–88. [Google Scholar] [CrossRef]
- Pflugmacher, S.; Wiegand, C.; Oberemm, A.; Beattie, K.A.; Krause, E.; Codd, G.A.; Steinberg, C.E. Identification of an enzymatically formed glutathione conjugate of the cyanobacterial hepatotoxin microcystin-LR: The first step of detoxication. Biochim. Biophys. Acta 1998, 1425, 527–533. [Google Scholar] [CrossRef]
- Bard, S.M. Multixenobiotic resistance as a cellular defense mechanism in aquatic organisms. Aquat. Toxicol. 2000, 48, 357–389. [Google Scholar] [CrossRef]
- Contardo-Jara, V.; Pflugmacher, S.; Wiegand, C. Multi-xenobiotic-resistance a possible explanation for the insensitivity of bivalves towards cyanobacterial toxins. Toxicon 2008, 52, 936–943. [Google Scholar] [CrossRef] [PubMed]
- Burmester, V.; Nimptsch, J.; Wiegand, C. Adaptation of freshwater mussels to cyanobacterial toxins: Response of the biotransformation and antioxidant enzymes. Ecotoxicol. Environ. Saf. 2012, 78, 296–309. [Google Scholar] [CrossRef] [PubMed]
- Suchy, P.; Berry, J. Detection of total microcystin in fish tissues based on lemieux oxidation and recovery of 2-methyl-3-methoxy-4-phenylbutanoic acid (MMPB) by solid-phase microextraction gas chromatography-mass spectrometry (SPME-GC/MS). Int. J. Environ. Anal. Chem. 2012, 92, 1443–1456. [Google Scholar] [CrossRef]
- Pham, T.L.; Shimizu, K.; Dao, T.S.; Hong-Do, L.C.; Utsumi, M. Microcystin uptake and biochemical responses in the freshwater clam Corbicula leana P. Exposed to toxic and non-toxic Microcystis aeruginosa: Evidence of tolerance to cyanotoxins. Toxicol. Rep. 2015, 2, 88–98. [Google Scholar] [CrossRef] [PubMed]
- Williams, D.E.; Dawe, S.C.; Kent, M.L.; Andersen, R.J.; Craig, M.; Holmes, C.F.B. Bioaccumulation and clearance of microcystins from salt water mussels, mytilus edulis, and in vivo evidence for covalently bound microcystins in mussel tissues. Toxicon 1997, 35, 1617–1625. [Google Scholar] [CrossRef]


© 2020 by the authors. Licensee MDPI, Basel, Switzerland. This article is an open access article distributed under the terms and conditions of the Creative Commons Attribution (CC BY) license (http://creativecommons.org/licenses/by/4.0/).