Article

Analysis of Distributed Measurement Method for Array Antenna Position

Key Laboratory of Micro-Inertial Instrument and Advanced Navigation Technology, Ministry of Education, School of Instrument Science and Engineering, Southeast University, Nanjing 210096, China
*
Author to whom correspondence should be addressed.
Appl. Sci. 2020, 10(10), 3480; https://doi.org/10.3390/app10103480
Submission received: 28 April 2020 / Revised: 10 May 2020 / Accepted: 15 May 2020 / Published: 18 May 2020
(This article belongs to the Special Issue Recent Advances in Fiber Gratings and Fiber-Grating-Based Devices)

Abstract

:
The measurement of the phase center of the airborne array antenna can directly affect the accuracy of the Earth observation system. However, the relationship between the relative motion of each sub-antenna cannot be accurately measured because of the adverse environment of the airborne platform. Therefore, it is necessary to find a suitable method to measure the motion parameters of distributed antennas and the phase center of each element antenna accurately in order to improve the imaging resolution of the Earth observation system. Distributed position and orientation system (POS) technology has high precision, but its measurement error will accumulate with time. So it needs to transfer and align continuously to achieve high-precision measurement. The paper introduces the distributed measurement method of measuring the array antenna position based on the combination of fiber Bragg grating (FBG) sensing technology and POS technology on the aircraft wing. The paper first introduces the technical scheme and principle, then carries out the structural design and method analysis. Next, the structural strength of the experimental model is checked and summarized.

Graphical Abstract

1. Introduction

The synthetic aperture radar (SAR) was first developed in the 1950s and used in the Earth observation system of airborne platforms [1]. The airborne high-resolution Earth observation system shown in Figure 1 is a comprehensive technology to obtain high-precision spatial information of the Earth’s surface by using the moving imaging load. It is of great significance to the monitoring and early warning of major natural disasters and it can solve a series of major problems that humans face such as environmental degradation and disasters facing [2]. With the increasing requirement of high-resolution imaging in aerial remote sensing, load array measurement technology has gradually become an effective means to improve the imaging resolution. SAR based on array technology can perform three-dimensional high-precision stereo imaging, and it has been widely valued in recent years [3,4].
The aircraft wing is the carrier of array antenna, in which there is phased array radar. Due to the influence of aircraft flying environment, the aircraft wing will produce large deformation, which will lead to the deformation of the array antenna conformal with the wing. The deformation of the aircraft wing changes the phase center of the array antenna, which affects the measurement accuracy of the array antenna [5]. When the airborne platform flies, it will produce severe jitter, and the load antenna will deform and flutter along with the deflection of the wing. Therefore, the relative motion relationship between the sub-antennas cannot be accurately determined [6]. Distributed position and orientation system (POS) technology is mainly based on the airborne-distributed inertial measurement system. In the 1990s, researchers first proposed the concept of an integrated inertial network. By sharing the information of flight control, attitude reference or navigation system on the carrier, several high-precision inertial measurement units (IMU) are arranged to form a complete set of airborne inertial navigation system networks. At present, the airborne distributed measurement technology is mainly used in initial attitude alignment of air-based missiles before launch and the relative motion information measurement of radar motion compensation. Airborne distributed measurement technology has the advantages of short measurement time, convergence and estimation of the filter. The airborne distributed system consists of the main inertial navigation system and the sub inertial navigation system. As a minimum distributed system including two sets of inertial navigation system (INS), the accuracy of sub-INS is guaranteed by fast transfer alignment technology. In order to improve the position and attitude accuracy of the subsystem, the transfer alignment method is used to constrain and calibrate the low-precision inertial navigation system. In order to obtain the phase center of the array antenna accurately, it is necessary to measure the deformation of the aircraft wing accurately. The paper presents measurement technology comprising the combination of airborne distributed POS technology and airborne optical fiber-sensing technology. The distributed POS technology and optical fiber-sensing technology are introduced, then the measurement process is analyzed, and finally the strength of the designed experimental model structure is checked to ensure the normal verification of the method.

2. Scheme and Principle

The deformation of an aircraft wing directly affects the reference datum of phase center, so only high-precision measurement of wing deformation can accurately obtain the reference of the phase center. At present, in the research of wing deformation measurement, researchers use laser measurement and visual imaging technology to measure wing deformation. Although the accuracy of this method is high, the method is based on the laser source and the laser source will have a short life after being used for a long time. Therefore, it is difficult to realize the full field measurement of the phase center of the array antenna on the large wing [7,8,9]. Some researchers also use the image pattern correlation technique (IPCT) to obtain the phase center of the airborne array antenna. This method can easily obtain the information of displacement vector field or strain field. However, when using high-speed cameras, noise and complex weather conditions will affect the measurement accuracy [10,11,12]. Therefore, to avoid the influence of the above adverse factors, the paper designs a real-time, high dynamic and high-precision method to measure the phase center of the array antenna. The method combines POS technology [13,14] and fiber Bragg grating (FBG) sensor technology, which is helpful to improve the accuracy of measuring the phase center of array antenna. The core idea of the paper is to use the advantages of FBG sensing technology to assist the application of distributed POS technology, so as to provide a high-precision benchmark for distributed POS technology.

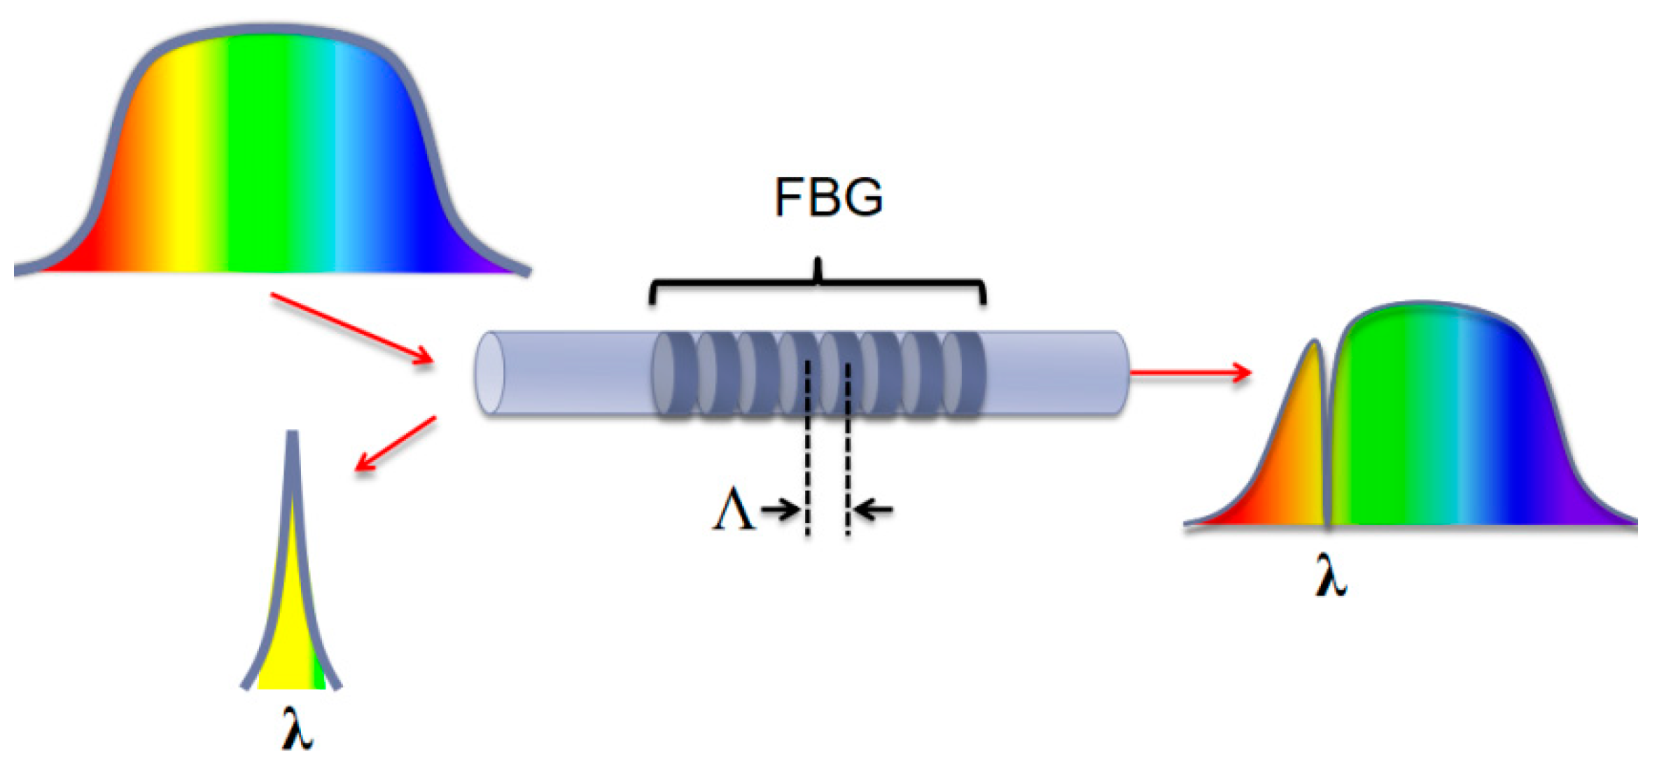
2.1. Fiber Bragg Grating (FBG) Sensing Technology

According to the different characteristics of the material and study from the research of Moe Amanzadeh et. al. [15], the classification of optical fiber sensors is shown in Figure 2.
The FBG sensor has been applied in different engineering fields for its advantages of light weight, small volume and anti electromagnetic interference [15,16,17,18], and FBG sensing technology is used in the paper. The resolution of deformation displacement measurement of FBG sensing technology can reach 0.3 mm. The sensing schematic diagram is shown in Figure 3.
In the calibration experiment [19], we used SM130 interrogation (Micron Optics, Inc., Atlanta, GA, USA) and the Electro-mechanical Universal Testing Machines (EUTM) (Shenzhen suns technology stock Co., Ltd, Shenzhen, China) to test the strain transfer characteristics of the FBG sensor, and the result showed that the strain transfer characteristics of the FBG sensor and strain gauge have good consistency. The researchers found that the appropriate type of interrogation can realize aircraft wing deformation monitoring based on the FBG sensor in flight, that is to say, the interrogation can normally obtain the data of the FBG sensor in flight state [20,21]. The working principle of the FBG sensor on the aircraft wing is to use the bending deformation of the wing, and the grating period or the refractive index of the core will change, so that the central wavelength of the Bragg grating will change. Through the mathematical model, we can obtain the change of physical parameters such as stress and strain, and then get the displacement change of each node of the FBG sensor.
The wavelength of the FBG sensor obeys the following formula [22]:
λ B = 2 n e f f Λ
where, λ B is the center wavelength of the fiber grating, n e f f is the effective refractive index of the fiber grating area, Λ is the period of refractive index in grating region.
The main influencing factors of the center wavelength offset of the FBG sensor on the aircraft wing are temperature and strain, and the relationship is as follows:
Δ λ B λ B = ( 1 P e ) ε + ( α + ζ ) Δ T
where, P e is the photoelastic coefficient, ε is strain, α is the coefficient of thermal expansion, ζ is the thermal optical coefficient, Δ T is the temperature change.
There are many methods of temperature compensation [23]. In order to study the relationship between strain and wavelength, the paper assumes that only constant temperature measurement is considered, so the formula can be simplified as follows:
Δ λ B λ B = ( 1 P e ) ε
Assuming that the deformation of the wing is pure bending, and the wing is composed of several micro elements, according to the pure bending theory of flexible beam, the transformation relationship between the curvature and strain of each node can be expressed as:
k = 1 / ρ = 2 h ε
where, k is the curvature, ρ is the radius of curvature, h is the thickness of the micro element.
Therefore, the relationship between the curvature k and the wavelength variation Δ λ B can be expressed as:
k = 2 h Δ λ B λ B ( 1 P e )
The λ B , P e and h of FBG sensors encapsulated on aircraft wings are all constant, so the curvature k is linear with Δ λ B .
The flexible plane of an aircraft wing can be regarded as a collection of multiple plane curves. The reconstruction of deformed wing surface can be realized by continuous reconstruction of multiple plane curves. First, the relationship between curvature and arc length is determined. Then, the adjacent continuous arc length is used to simulate the synthetic curve, and finally the multiple curves are used to simulate the synthetic surface, so as to accurately obtain the spatial position coordinates of each sub node on the distribution POS.
It can be seen from the definition of curvature that curvature is the quadratic differential value of the curve, and the coordinate value of each point on the curve can be recursively derived from the slope of each point. Suppose that the coordinates of point n and point n + 1 are ( x n , y n ) and ( x n + 1 , y n + 1 ) respectively, the slopes are k n and k n + 1 respectively, and the arc length between the two points is Δ s n :
{ x n + 1 = x n + Δ s n 1 + k n 2 y n + 1 = y n + k n Δ s n 1 + k n 2
The formula above is the recurrence formula of the coordinate value of each point, connecting each point to realize the reconstruction of the curve.

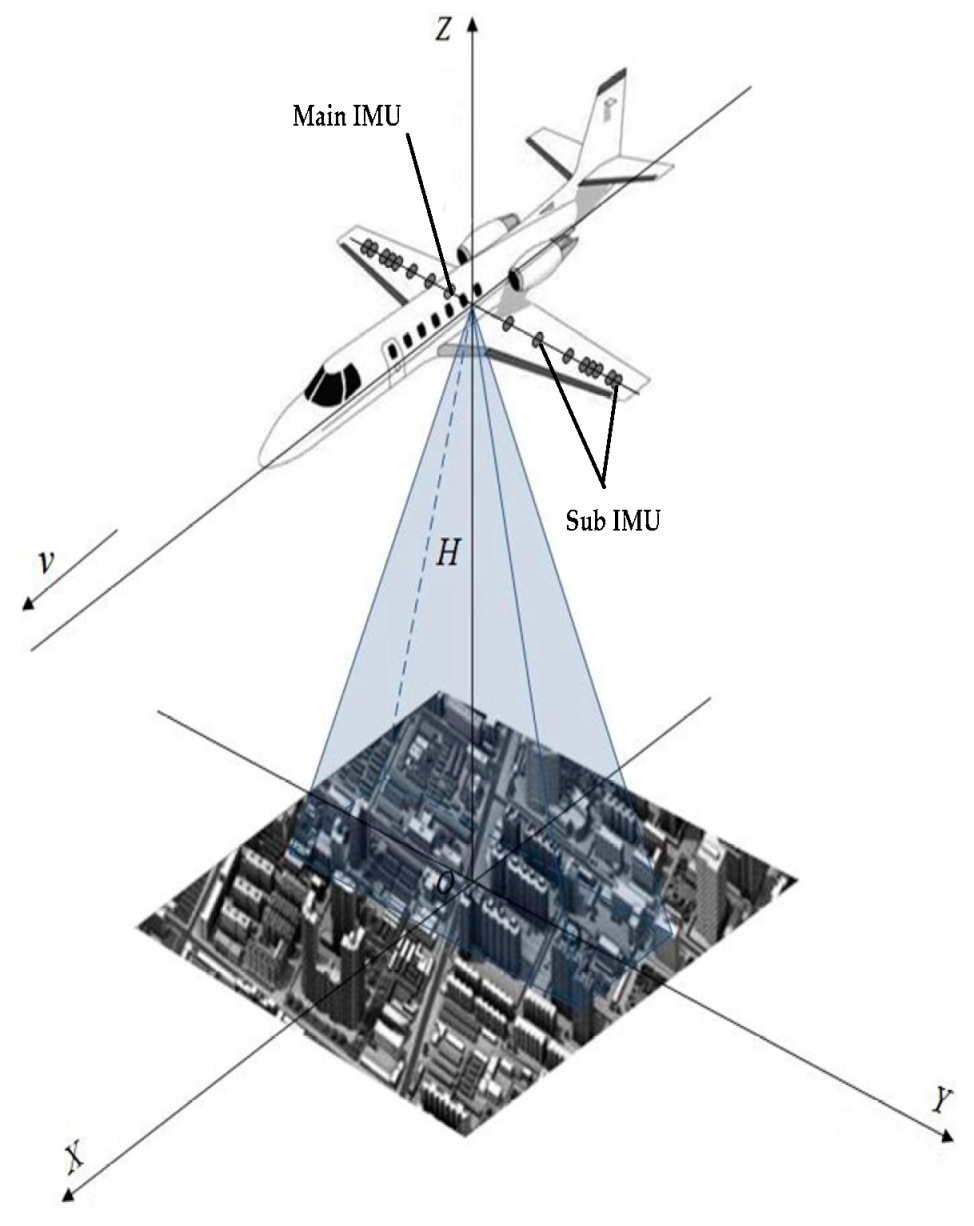
2.2. Distributed Position and Orientation System (POS) Technology

In order to obtain the phase center of the array antenna of each node with high precision, the paper first uses the distributed POS technology introduced by Fang Jiancheng et al. [6]. The working principle of distributed POS technology is shown in the figure below, which is composed of a main POS and sub-POS. The main POS uses the high-precision inertial measurement unit (IMU), which can accurately measure the motion parameters of the carrier. The sub POS uses low-precision IMU. In the distributed POS technology, the system’s accuracy is generally guaranteed by fast-transfer alignment technology, which can achieve the alignment accuracy of 3 angles in 5 s. As shown in Figure 4, the main POS and the sub-POS are respectively installed near different loads on both sides of the airframe or wing to measure the motion parameters of the load center. However, the accuracy of the sub-POS is not high, and the measurement error accumulates with time, so the main POS needs to transfer and align it continuously to achieve the high-precision measurement of the sub nodes.
Assuming that the aircraft wing is regarded as a flexible beam, the high-precision measurement of the deformation of the flexible beam is conducive to improving the measurement accuracy of distributed POS, so the deformation model of the flexible beam needs to be established.
Assuming that the flexible beam is composed of several small rectangular blocks, each rectangular block has four nodes, which are marked (i = 1,2,3,4) in turn anticlockwise; then the deflection ω of each rectangular block, the rotation θ x around the X axis and the rotation θ y around the Y axis are found; then the displacement vector of the four nodes is:
α e = [ a 1   a 2   a 3   a 4 ] T
where, α i = { ω i θ x i θ y i } = {   ω i   ( ω y ) i ( ω x ) i }   ( i = 1 ,   2 ,   3 ,   4 )
The displacement function ω formula of the flexible beam is as follows:
ω = a 1 + a 2 x + a 3 y + a 4 x 2 + a 5 x y + a 6 y 2 + a 7 x 3 + a 8 x 2 y + a 9 x y 2 + a 10 y 3 + a 11 x 3 y + a 12 x y 3
The formula can also be expressed as:
ω = P a
where, P = [ 1   x   y   x 2   x y   y 2   x 3   x 2 y   x y 2   y 3     x 3 y   x y 3 ] , a = [ a 1   a 2   a 3     a 12 ] T
It can be seen from the formula that a 1 + a 2 x + a 3 y is rigid body displacement of flexible beam, a 4 x 2 + a 5 x y + a 6 y 2 is constant strain of flexible beam in bending.
By taking the coordinates of four corner nodes into the formula above, we can get the matrix C a = α e , where C is a 12 × 12 matrix.
C = [ 1   x i     y i   x i 2   x i y i   y i 2   x i 3   x i 2 y i   x i y i 2   y i 3   x i 3 y i   x i y i 3   0   0   1   0   x i   2 y i   0   x i 2   2 x i y i   3 y i 2   x i 3   3 x i y i 2   0   1   0   2 x i   y i   0   3 x i 2   2 x i y i   y i 2   0   3 x i 2 y i   y i 3   ] 12
In the formula, ( x 1 , y 1 ) = ( a , b ) ; ( x 2 , y 2 ) = ( a , b ) ; ( x 3 , y 3 ) = ( a , b ) ; ( x 4 , y 4 ) = ( a , b ) .
The coefficient of displacement function can be obtained by matrix inversion:
a = C 1 α e
Therefore, we can deduce the formula of the displacement function of each point of flexible beam in a rectangular small area, which can be expressed as follows:
ω = P a = P C 1 α e
The displacement on the joint surface of the adjacent rectangular element is continuous. When the element partition is reduced, the derivative continuity can be satisfied, the calculation error will be reduced gradually, and the calculation result can converge to the exact solution. The main IMU and Global Positioning System (GPS) of the main POS can measure the phase center motion information of the main antenna through the integrated inertial/satellite navigation.
The sub-IMU is fixedly connected with the sub-antenna, and the phase center of the sub-antenna is measured through the transfer alignment between the main POS and the sub-IMU. However, the distributed POS belongs to the inertial measurement system, there are accumulated errors in the measurement of wing deformation, and the accumulated errors are difficult to accurately model and compensate. Therefore, it is difficult to measure the phase center of the array antenna with high precision only by using distributed POS technology. Based on the distributed POS technology, the paper uses the FBG sensing technology to assist in the measurement of wing deformation, so as to improve the measurement accuracy of the phase center.
The deflection and section angle of each node of flexible baseline can be measured by FBG. Therefore, the position, velocity and attitude information of high-precision main POS can be compensated by FBG measurement to transfer to the sub nodes for matching. The matching calculation process of position, velocity, attitude and flexible deformation between the main and sub-systems is as follows:
δ a = [ δ ψ   δ θ   δ γ   ] is the attitude measurement, which is the difference between the attitude angle of the main POS and the attitude angle of the sub IMU after being compensated by the deflection angle measured by the grating and the formula is shown as follows:
δ a = a s a m
where, a s is the attitude of the subsystem in navigation coordinates, a m is the attitude angle of the main system after the conversion of the deflection angle at the load point measured by the FBG, which can be obtained by the inverse solution of the attitude transfer matrix C b m n m = C θ C b m n m . C θ can be obtained from the deflection angle θ r b m at the load point measured by FBG.
δ V = [ δ V E   δ V N   δ V U ] is the speed measurement, which is the speed difference between the main POS and the sub IMU after speed compensation by lever arm and the formula is shown as follows:
δ V = V s V m V r n m
where, V s and V m are the speed of subsystem and main system in navigation coordinate respectively, V r n m is the lever arm speed, which can be calculated by the following formula:
V r n m = C b m n m ( ω i b m b m × r b m ) + C b m n m r ˙ b m
where, r b m is the deflection displacement measured by the FBG sensing technology, and deflection rate r ˙ b m can be obtained by differential operation.
δ P = [ δ L   δ λ   δ h ] is the position measurement, which is the difference between the latitude, longitude and height between the main POS and the sub IMU after the deflection compensation measured by the grating and it can also shown as follows:
δ P = P s P m C b m b m r b m
where, P s and P m are the positions of subsystem and main system in navigation coordinates respectively. The measurement of flexible deformation w can be obtained directly by FBG.
Through the position, velocity, attitude correction of the main system and the measurement of the FBG sensors, the accurate matching amount of the transfer alignment can be obtained, which is helpful to improve the measurement accuracy of the phase center.
The accurate matching amount’s formula can be shown as follows:
y = [ δ ψ   δ θ   δ γ   δ V E   δ V N   δ V U   δ L   δ λ   δ h   w ] T

2.3. Error Analysis of Distributed POS Technology

2.3.1. Lever Arm Effect Error

The main and sub-systems are installed at different positions on the carrier, when the carrier moves in different maneuvers, the dynamic changes of lever arm between the main and sub-systems affect the transfer alignment convergence time and alignment accuracy. The compensation method of arm error is usually to estimate the arm length by filtering, and then to modify the expression of velocity error directly by calculating the compensation method. In the airborne distributed measurement system, the deflection of the carrier is similar to the lever arm effect. However, compared with the compensation of arm error, the establishment of the deflection model and error compensation is more complex.
In order to reduce the influence of bending deformation on transfer alignment accuracy, Jones et al. used second-order Markov to simulate the dynamic bending deformation angle, and took the bending deformation angle as the state quantity of the Kalman filter [24]. The method effectively compensated the error introduced by the bending deformation. Spalding et al. decomposed the flexure motion into quasi-static flexure motion and high-frequency flexure motion [25]. The accuracy of this method is high, but the real-time performance of the algorithm is affected. Pehlivanoglu et al. divided the dynamic flexure movement into two parts, the first is high-frequency and low-amplitude vibration, and the second is low-frequency and high-amplitude bending [26]. The experimental results show that this method has both accuracy and real-time performance. In this paper, the vibration is regarded as white noise, and the second-order Markov model is used to reduce the influence of bending deformation on transfer alignment accuracy.

2.3.2. Navigation Equation of Strapdown Inertial Navigation System

The velocity of the vehicle relative to the earth is expressed as v e n in the navigation coordinate system, and its navigation equation is shown as follows.
v ˙ e n = C b n f b [ 2 ω i e n + ω e n n ] × v e n + g l n
where, C b n is the direction cosine matrix from carrier coordinate system to navigation coordinate system, f b is the specific force of the carrier measured by the accelerometer, ω i e n is the angular velocity of rotation of the geocentric fixed coordinate system e relative to the geocentric inertial coordinate system i under the navigation coordinate system n , ω e n n is the rotation angular velocity of the navigation coordinate system relative to the geocentric and fixed coordinate system in the navigation coordinate system, g l n is the gravity of the carrier.

2.3.3. Attitude Error Equation

In the navigation system, the attitude of the carrier coordinate system relative to the navigation coordinate system can be expressed by the direction cosine matrix C b n . The relationship between the calculated value C ˜ b n and the real value C b n of the matrix can be expressed as follows:
C ˜ b n = C b n + δ C b n = ( I [ Φ × ] ) C b n
where, Φ × = [ 0   δ γ   δ α δ γ   0   δ β δ α   δ β   0 ] is the skew symmetric matrix of attitude error angle in real coordinate system, δ α is the attitude error around the x-axis, δ β is the attitude error around the y-axis, δ γ is the attitude error around the z-axis, I is the unit matrix of 3 × 3.
In the navigation coordinate system n , the relationship between the calculated value and the real value of the rotation angular velocity ω i n n of the navigation coordinate system n relative to the geocentric inertial coordinate system i satisfies the following formula:
ω ˜ i n n = ω i n n + δ ω i n n
Assuming that only the drift error of the gyroscope is considered, the relationship between the measured carrier angular velocity and the real value of the gyroscope is as follows.
ω ˜ i b b = ω i b b + ε b
In carrier coordinate system b , the angular velocity ω n b b of carrier coordinate system b relative to navigation coordinate system n can be expressed as follows:
ω n b b = ω i b b C n b ω i n n
From the Poisson equation, the transfer equation of direction cosine matrix can be expressed as the following formula:
C ˙ b n = C b n [ ω n b b × ]
where, ω n b b × = [ 0 ω n b z b ω n b x b ω n b z b 0 ω n b y b ω n b x b ω n b y b 0 ] . By substituting Equation (22) into Equation (23), we can obtain:
C ˙ b n = C b n [ ( ω i b b C n b ω i n n ) × ]
Similarly, the calculated value of direction cosine matrix obeys Equation (25):
C ˜ ˙ b n = C ˜ b n [ ( ω ˜ i b b C ˜ n b ω ˜ i n n ) × ]
Combined with the above formula, we can obtain:
C ˙ b n + δ C ˙ b n = C ˜ b n [ ( ω ˜ i b b C ˜ n b ω ˜ i n n ) × ] = ( I [ Φ × ] ) C b n { [ ( ω i b b + ε b ) C n b ( I + [ Φ × ] ) ( ω i n n + δ ω i n n ) ] × }
δ C b n = [ Φ × ] C b n
By deriving the two ends of Equation (27) and combining Equation (23), we can obtain:
δ C ˙ b n = [ Φ ˙ × ] C b n [ Φ × ] C b n [ ω n b b × ]
The following formula can be obtained by neglecting the second order small quantity and substituting Equation (23) and Equation (28) into Equation (26):
( I [ Φ × ] ) C b n [ ω n b b × ] [ Φ ˙ × ] C b n = ( I [ Φ × ] ) C b n { [ ω n b b + ε b δ ω i n b C n b [ Φ × ] ω i n n ] × }
According to the vector operation relationship, Equation (29) is right multiplied at both ends, and then ignores the second-order small quantity, the following formula can be obtained:
[ Φ ˙ × ] [ C b n ε b δ ω i n b [ Φ × ] ω i n n ] ×
Equation (30) can also be expressed as the following formula:
Φ ˙ = [ ω i n n × ] Φ + δ ω i n b C b n ε b

2.3.4. Error Model of Inertial Device

The errors of inertial devices mainly include gyro drift error, accelerometer bias error, calibration coefficient error and calculation input error. These errors are usually colored noises. Among these errors, gyro drift error and accelerometer bias error have great influence on the navigation accuracy of the system. Therefore, the paper mainly introduces gyro drift error model and accelerometer zero drift error model.
(a) Gyro drift error model
The drift error of the gyroscope is equivalent to the random constant ε b , the random error ε r of the first-order Markov process and the Gaussian white noise ϖ g , and the formula is shown as follows:
ε = ε b + ε r + ϖ g
(b) Zero drift error model of accelerometer
= b + r + ϖ a
where, b is the random constant bias of accelerometer, r is the random noise of the first-order Markov process of accelerometer, ϖ a is Gaussian white noise.
Thus, the gyro and acceleration error model in the navigation coordinate system can be expressed as follows:
{ ε n = C b n ε b + ε r + ϖ g n = C b n b + r + ϖ a
Through the analysis above, we can find that the core of the measurement method designed in the paper is to use the FBG measurement technology to obtain the deflection of the wing in the dynamic environment and assist the distributed POS technology to improve the measurement accuracy, so as to achieve the purpose of measuring the phase center of the array antenna. In order to verify the feasibility of this method, further analysis should be carried out in a specific carrier environment. Therefore, based on the available aircraft, the paper designs the structure of the experimental device and checks the structural strength.

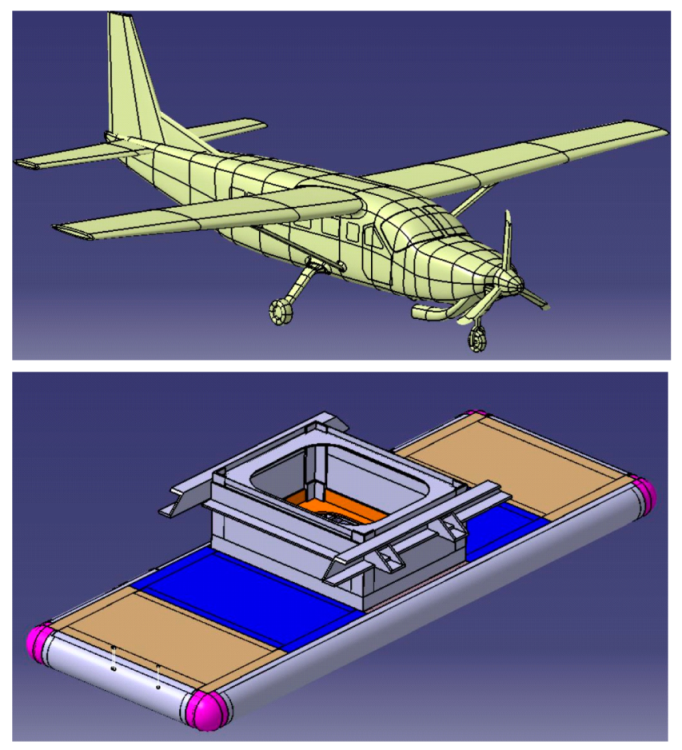
3. Structural Design and Method

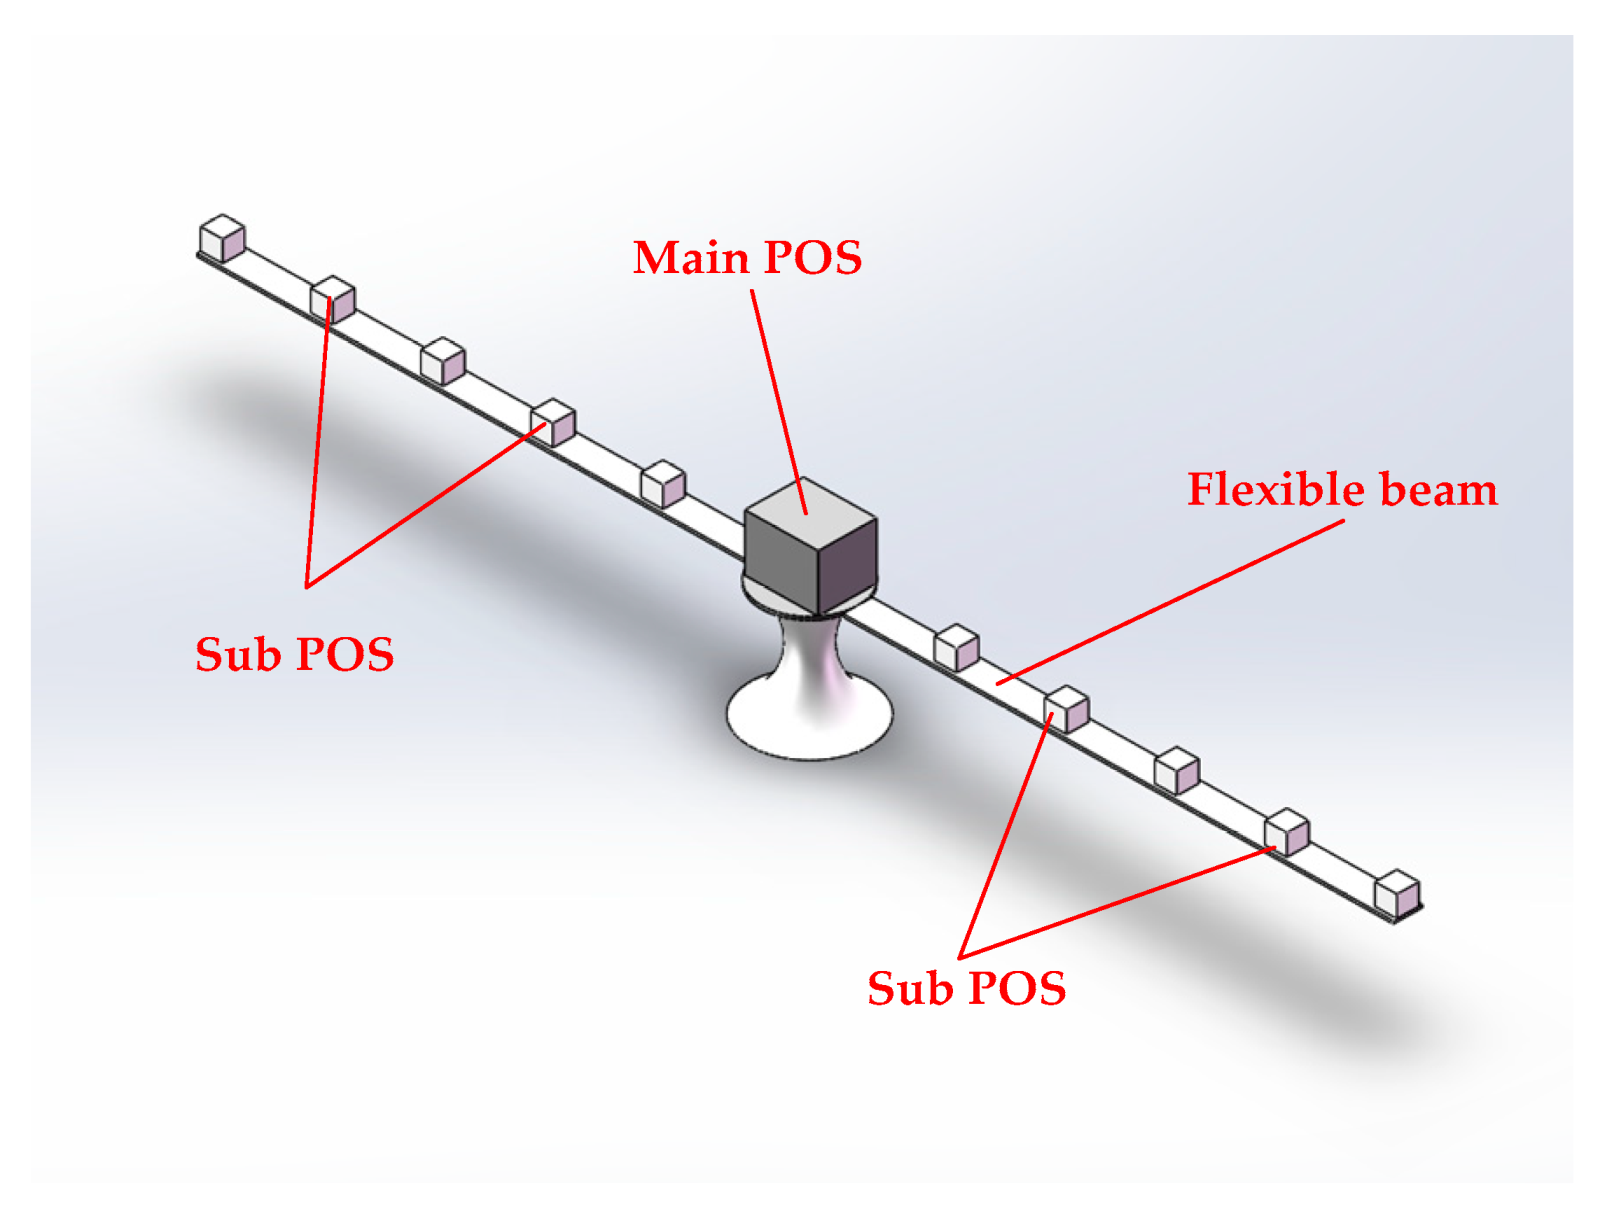
3.1. Structural Design

In order to verify the feasibility of the measurement method, the Y12 aircraft was chosen as the experimental aircraft, and its structure is shown in Figure 5. According to the structural dimensions of the Y12 aircraft, the experimental wing device was designed and its structure is shown as follows.
In order to simulate the real flight environment, the Y12 aircraft was refitted, and the experimental aircraft wing device was installed in the belly of the aircraft. The installation layout is shown in Figure 6. In order to improve design and the accuracy of manufacturing, we use the reference point system (RPS) so that when machining the aircraft wing model, the design datum point, process positioning point, and measurement datum point are unified, and can realize accurate coordinate control.

3.2. Measuring Method
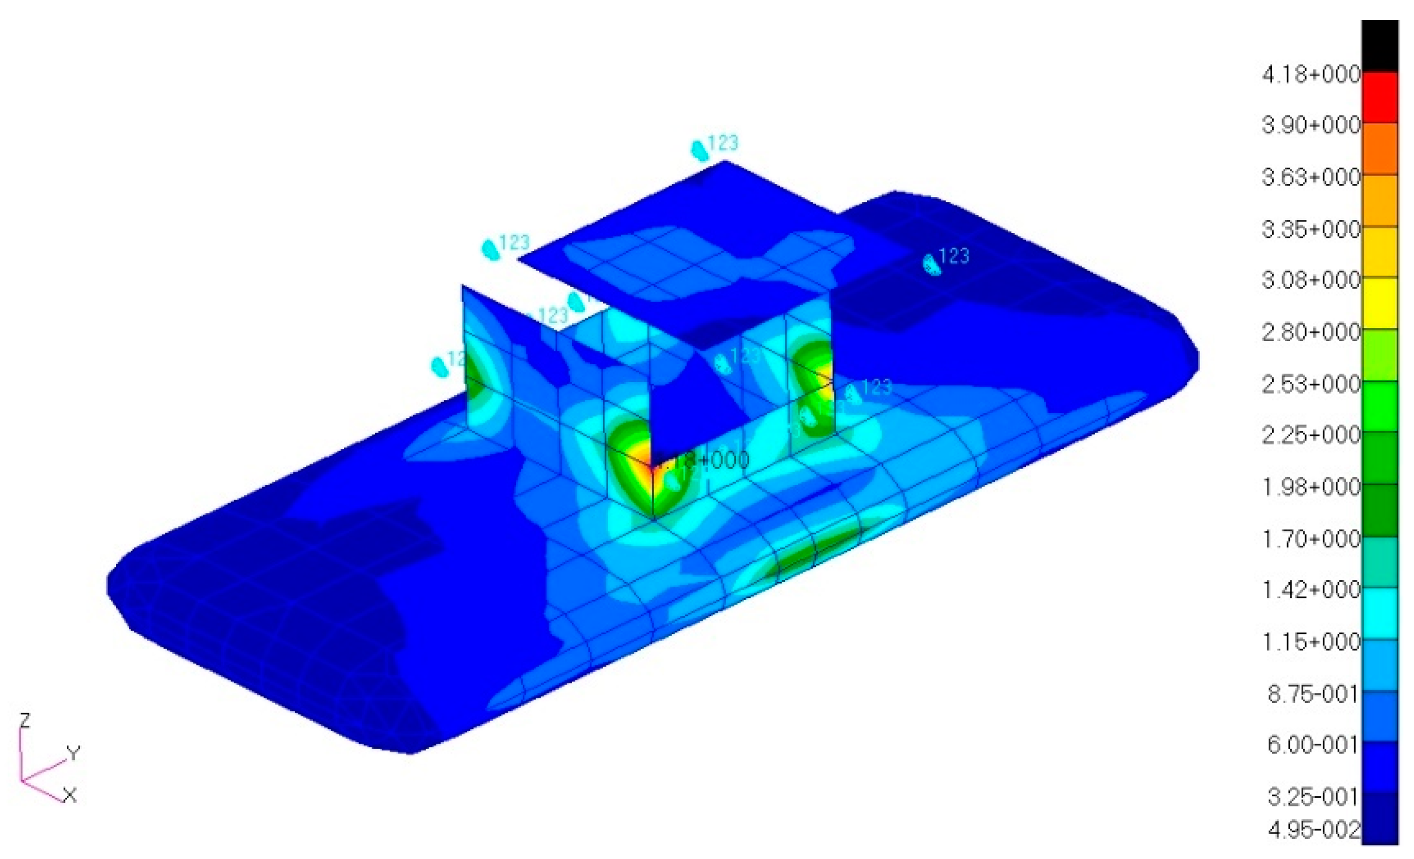
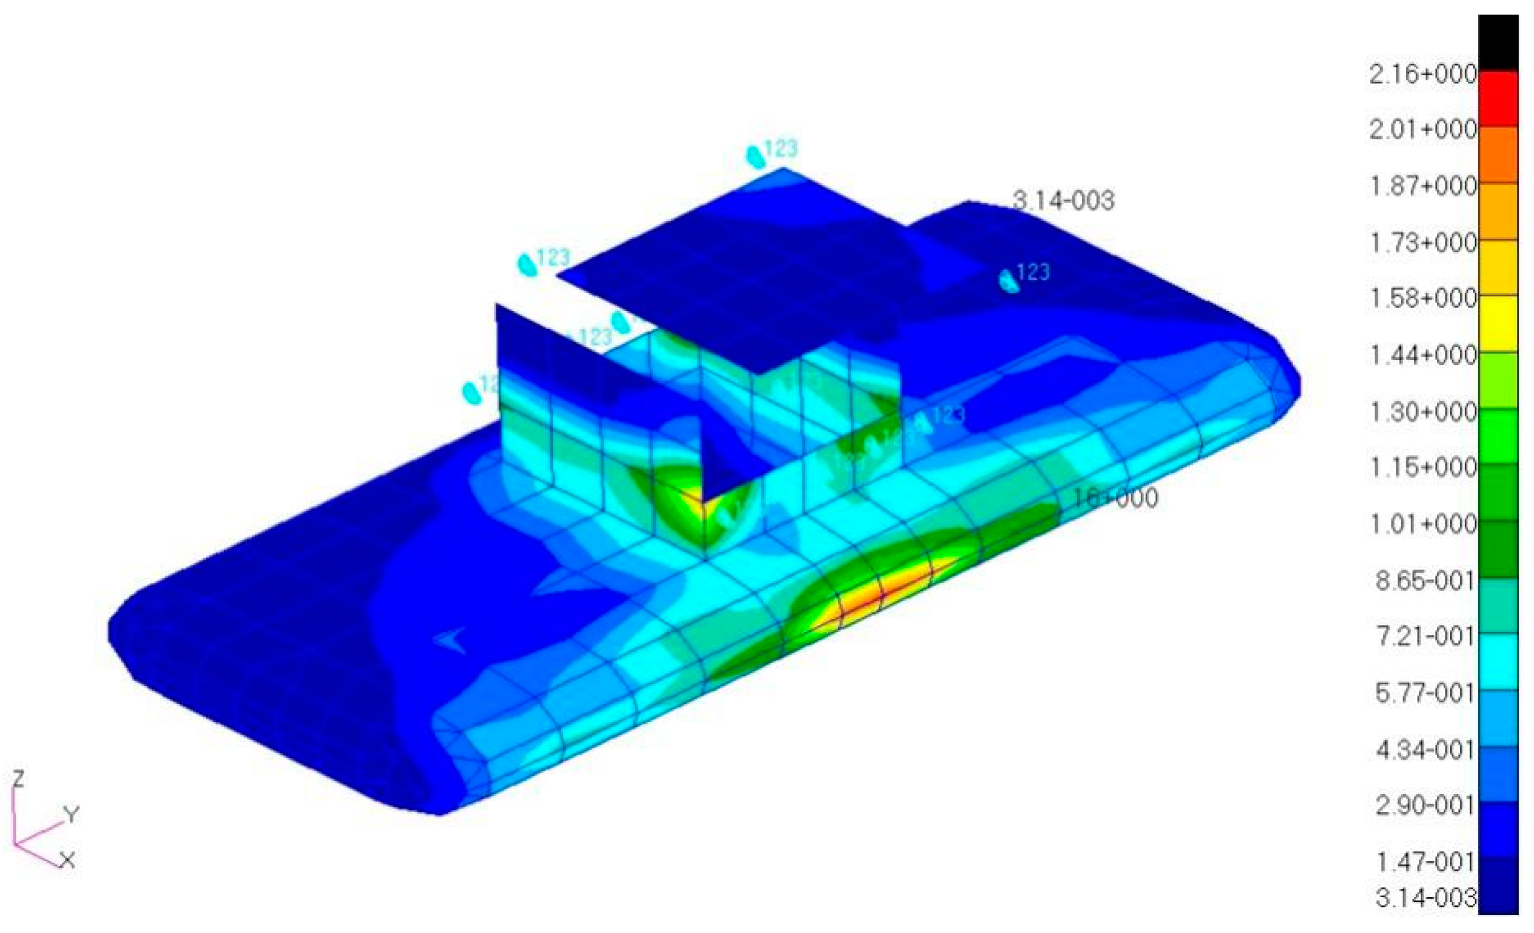
The measurement device of the array antenna phase center includes the FBG sensor system, main POS, sub-POS, phased array antenna and distributed POS computer system (DPCS). The FBG sensor system consists of several FBG sensor arrays evenly arranged on the wing surface, and the main POS is arranged in the middle of the wing model. Two sub POS are arranged symmetrically at both ends of the wing model. The phased array antennas are uniformly and symmetrically arranged under the wing model. A DPCS navigation computer is used to calculate the pose information of main POS and sub POS.
The spacing between two adjacent FBG sensor arrays in the FBG sensor array is determined according to the size of the wing model. In the experiment, each FBG sensor has 15 nodes, and the central wavelength range of each node is from 1529 mm to 1584 mm for gradient distribution. The bandwidth of the surface-attached FBGs is 0.232 nm, the length of gate area is 10 mm, and the reflectivity is 92.06%. The frequency of SM130 interrogator is 1 kHz, and the resolution is less than 1 pm. There will be severe jitter in the flight of the aircraft. When the main POS and the sub POS are installed, they need to be equipped with damping devices to ensure the stability of the IMU systems and reduce the error caused by the vibration. The output frequency of the main system inertial device is 200 Hz. The initial speed of the carrier is 0.001 m/s in all three directions. The layout of the main POS and sub POS is shown in Figure 7.
After the installation shown in Figure 8, the RPS datum point measurement system is used to obtain the boom value when the wing model naturally sags, which is used to determine the reference coordinate system at the initial stage. The displacement of each node of the aircraft wing model can be obtained by the wavelength value obtained by the FBG sensor, and then the displacement value provides a higher precision reference for POS technology, which is conducive to improving the accuracy of measuring the phase center. Thus, in the process of aircraft flying, the wing shakes and deforms and FBG sensors measure the wavelength change. The dynamic change curve of the wing model is obtained by fitting, which provides a reference coordinate system for the sub-POS. The sub-POS and the main POS work to obtain the spatial position and attitude information of the IMU systems in flight. Through the solution, the spatial coordinates of each phased array antenna in each node of the wing model are obtained, that is, the phase center of the phased array antenna is obtained.

3.3. Strength Check

In the real flight environment, gust will cause wing deformation, acceleration and inertial force which change with time. Under the interaction of elastic force and inertial force, the wing will vibrate. When the frequency of the external load is close to or coincides with the natural frequency of the structure, there will be periodic load on the aircraft, which may cause resonance. The gust load is the basis of strength analysis in the initial design of the structure. The relative accuracy of the load is very important for the initial design of the structure. In order to consider the safety of the flight test, it is necessary to check the strength of the inertial load in case of gusts.
During the flight test, the load of the wing model of the suspension mainly includes the aerodynamic load and the inertial load generated by the ground condition, the flight maneuver condition and the flight gust condition. Because the structure of the wing model is under the fuselage and its geometric size is not large, the aerodynamic load is estimated by the Bernoulli equation in this calculation, the aerodynamic force is 0.0032 MPa, which is uniformly applied on the leading edge skin. In addition, the wing model structure of the suspension is mainly used when the aircraft is flying horizontally, so this calculation only considers the inertial load in the case of gusts.
According to the actual use of the aircraft, the main gust conditions considered in the strength check are vertical gust and lateral gust.

3.3.1. Overload Increment in Case of Vertical Gust

When calculating the increment of vertical gust overload of the Y12 aircraft, the formula is as follows:
n = K g U d e V a 1.63 ( W g / S )
where, K g = 0.88 μ g 5.3 + μ g is gust mitigation factor, μ g = 2 ( W g / S ) ρ c ¯ a g is mass ratio of aircraft, c ¯ is average geometric chord length, g is gravitational acceleration, U d e is gust velocity, V is equivalent speed, a is the lift curve slope, W g / S is wing loading.
Referring to the aerodynamic performance and weight parameters of the Y12 aircraft, we can calculate that the vertical overload increment of a vertical gust is Δ n vertical   gust = ± 2.52 .
It can be seen from Figure 9 that the maximum stress calculated by the plate element in the case of vertical gust overload is below 5 MPa, which is far less than the yield limit of the material, so the strength of the structure does not need to be checked.

3.3.2. Overload Increment of Lateral Gust

The formula for calculating the lateral load of the vertical tail in the case of lateral gust is:
L V T = K g t U d e V a VT S V T 1.63
where L V T is vertical wing load, K g = 0.88 μ g 5.3 + μ g is gust mitigation factor, μ g = 2 W g ρ c ¯ t a V T g S V T K 2 L V T is lateral mass ratio, c ¯ t is average geometric chord length of vertical wing surface, S V T is area of vertical airfoil, g is gravitational acceleration, U d e is gust velocity, V is equivalent speed of aircraft, a is the lift curve slope, W is aircraft weight. The increment of lateral overload in the case of lateral gust is Δ n lateral   gust = ± 0.524 .
It can be seen from Figure 10 that the maximum stress is below 4 MPa, which is far less than the yield limit of the material, so the strength of the structure does not need to be checked.
By analyzing the increment of gust overload, we can get that the increment of vertical (Z-axis) gust overload is ±2.52, and the increment of lateral (Y-axis) gust overload is ±0.524, which meets the design requirements. The calculated stress of the wing model structure is very small and its strength meets the requirements.
The strength calculation shows that the strength of the experimental device meets the requirements. The U-shaped flight path shown in Figure 11 was tested continuously in Chengdu, Sichuan Province, and the test results show that the intensity meets the flight conditions, which proves the feasibility of the measurement method.

4. Conclusions

In the process of aircraft flying, the aircraft wing vibration directly affects the measurement accuracy of the Earth observation system. In order to provide a high-precision measurement method, a method of measuring the phase center of the array antenna based on FBG sensing technology and distributed POS technology combination is designed. The method combines distributed POS technology, FBG sensor technology, and finite element analysis. In order to verify the feasibility of the method, a verification experimental device installed on the belly of an aircraft is designed. Firstly, the system error is analyzed. Then, through a strength check, it is proved that the strength of the experimental structure meets the requirements. The test of the U-shaped flight path proves that the device can meet the requirements of the flight experiment. Therefore, the design method in the paper can meet the flight conditions in terms of structural strength. The measurement method proposed in the paper provides a reference for improving the Earth observation performance of SAR and lays a foundation for further verifying the effect of assistant transfer alignment of the FBG sensors. In the design of the paper, only the measurement method under a constant temperature environment is considered. The temperature changes greatly in the flight process, which will directly affect the measurement accuracy of the FBG sensor. So it is necessary to study the temperature compensation of the FBG sensor in a flight condition in the future.

Author Contributions

Z.M.; Conceptualization, methodology, formal analysis, writing—original draft preparation, X.C.; Conceptualization, writing—review and editing, supervision. All authors have read and agreed to the published version of the manuscript

Funding

This work was supported by the National Natural Science Foundation of China (No. 61873064 and No. 51375087) and the Scientific Research Foundation of Graduate School of Southeast University (No. YBPY1982).

Acknowledgments

This work is supported by the National Natural Science Foundation of China (No. 61873064 and No. 51375087) and the Scientific Research Foundation of Graduate School of Southeast University (No. YBPY1982).

Conflicts of Interest

The author declares no conflict of interest.

References

  1. Wiley, C.A. Pulsed Doppler Radar Methods and Apparatus. U.S. Patent No. 3,196,436, 20 July 1965. [Google Scholar]
  2. Tong, X.; Zhao, W.; Xing, J. Status and development of china high-resolution earth observation system and application. In Proceedings of the 2016 IEEE International Geoscience and Remote Sensing Symposium (IGARSS), Beijing, China, 10–15 July 2016; pp. 3738–3741. [Google Scholar]
  3. Pedlar, D.N.; Coe, D.J. Target Geolocation Using SAR. IEEE Radar Sonar Navig. 2015, 152, 35–42. [Google Scholar] [CrossRef]
  4. Jiang, L.M.; Lin, H. Integrated analysis of SAR interferometric and geological data for investigating long-term reclamation settlement of ChekLapKokAirport, Hong Kong. Eng. Geol. 2010, V110, 77–92. [Google Scholar] [CrossRef]
  5. Arnold, E.J.; Yan, J.B.; Hale, R.D. Identifying and compensating for phase center errors in wing-mounted phased arrays for ice sheet sounding. IEEE Trans. Antennas Propag. 2014, 62, 3416–3421. [Google Scholar] [CrossRef]
  6. Fang, J.C.; Liu, Z.C. In-flight alignment of POS based on state-transition matrix. IEEE Sens. J. 2015, V15, 3258–3264. [Google Scholar] [CrossRef]
  7. Bakunowicz, J.; Meyer, R. In-flight wing deformation measurements on a glider. Aeronaut. J. 2014, 120, 1917–1931. [Google Scholar] [CrossRef] [Green Version]
  8. Pallek, D.; Butefisch, K.A.; Quest, J.; Strudthoff, W. Model deformation measurement in ETW using the Moire technique. In Proceedings of the International Congress on Instrumentation in Aerospace Simulation Facilities, Gottingen, Germany, 25–29 August 2003; pp. 110–114. [Google Scholar]
  9. Boden, F.; Jentink, H.; Petit, C. IPCT Wing Deformation Measurements on a Large Transport Aircraft. In Advanced In-Flight Measurement Techniques; Springer: Berlin/Heidelberg, Germany, 2013; pp. 93–115. [Google Scholar]
  10. Klinge, F. Cross correlation based optical measurement techniques for fluid dynamics and structure analysis BOS, IPCT. In Proceedings of the Lecture in Tampere University of Technology, Tampere, Finland, 11 October 2004. [Google Scholar]
  11. Kompenhans, J.; Schroder, A.; Engler, R.; Klinge, F.; Stasicki, B. Development and application of image based measurements techniques for aerodynamic investigation in wind tunnels. In Proceedings of the International Conference High Speed Flow: Fundamental Problems, Zhukovsky, Russia, 2–24 September 2004. [Google Scholar]
  12. AIM² Newsletter No. 3 Available NOW. Available online: http://aim2.dlr.de/project/index.html (accessed on 28 January 2020).
  13. Fang, J.C.; Zhang, Z.; Gong, X. Modeling and simulation of transfer alignment for distributed POS. J. Chin. Inert. Technol. 2012, 20, 379–385. [Google Scholar]
  14. Zhu, Z.; Guo, T. Effect of distributed POS transfer alignment on InSAR interferometic measurement. J. Chin. Inert. Technol. 2014, 22, 432–438. [Google Scholar]
  15. Amanzadeh, M.; Aminossadati, S.M.; Kizil, M. Recent developments in fibre optic shape sensing. Measurement 2018, 128, 119–137. [Google Scholar] [CrossRef] [Green Version]
  16. Ma, Z.; Chen, X.Y. Fiber Bragg gratings sensors for aircraft wing shape measurement: Recent applications and technical analysis. Sensors 2019, 19, 55. [Google Scholar] [CrossRef] [PubMed] [Green Version]
  17. Di, S.R. Fiber optic sensors for structural health monitoring of aircraft composite structures: Recent advances and applications. Sensors 2015, 15, 18666–18713. [Google Scholar]
  18. Vorathin, E.; Hafizi, Z.M.; Ghani, S.C.; Lim, K.S. Real-time monitoring system of composite aircraft wings utilizing Fibre Bragg Grating Sensor. Innov. Aerosp. Eng. Technol. 2016, 152, 12024. [Google Scholar] [CrossRef]
  19. Ma, Z.; Chen, X.Y. Strain Transfer Characteristics of Surface-attached FBGs in Aircraft Wing Distributed Deformation Measurement. Optik 2020, 207, 164468. [Google Scholar] [CrossRef]
  20. Alvarez, M.J.; Carvajal, C.A.; Sierra, P.J. In-flight and wireless damage detection in a UAV composite wing using fiber optic sensors and strain field pattern recognition. Mech. Syst. Signal Process. 2020, 136, 106526. [Google Scholar] [CrossRef]
  21. Chan, P.H.M. Fiber Optics Sensing System (FOSS) at NASA Armstrong Flight Research Center (AFRC): Summary and Recent Deployments. In Proceedings of the 3rd Edwards Technical Symposium, Edwards AFB, Edwards, CA, USA, 10 September 2018. [Google Scholar]
  22. Hill, K.; Meltz, G. Fiber Bragg grating technology fundamentals and overview. J. Lightw. Technol. 1997, 15, 1263–1276. [Google Scholar] [CrossRef] [Green Version]
  23. Iwashima, T.; Inoue, A.; Shigematsu, M. Temperature compensation technique for fibre Bragg gratings using liquid crystalline polymer tubes. Electron. Lett. 1997, 33, 417–419. [Google Scholar] [CrossRef]
  24. Jones, D.; Roberts, C.; Tarrant, D.; Chun, Y.; Ching-Fang, L. Transfer Alignment Design and Evaluation Environment. In Proceedings of the First IEEE Regional Conference on Aerospace Control Systems, Westlake Village, CA, USA, 25–27 May 1993. [Google Scholar]
  25. Spalding, K.; Missouri, S.L. An efficient rapid transfer alignment filter. In AIAA Guidance, Navigation and Control Conference; AIAA: Hilton Head Island, SC, USA, 1992; pp. 1276–1286. [Google Scholar]
  26. Pehlivanoglu, A.G.; Ercan, Y. Investigation of flexure effect on transfer alignment performance. J. Navig. 2013, 66, 1–15. [Google Scholar] [CrossRef] [Green Version]
Figure 1. Airborne ground-observation system.
Applsci 10 03480 g001
Figure 2. Classification of optical fiber strain sensors [15].
Applsci 10 03480 g002
Figure 3. Schematic diagram of working principle of fiber Bragg grating (FBG) sensor.
Applsci 10 03480 g003
Figure 4. Schematic diagram of distributed position and orientation system (POS) technology scheme.
Applsci 10 03480 g004
Figure 5. Y12 aircraft and experimental aircraft wing device.
Applsci 10 03480 g005
Figure 6. Installation layout.
Applsci 10 03480 g006
Figure 7. Distributed layout of measurement scheme.
Applsci 10 03480 g007
Figure 8. Physical layout of measurement scheme. (a) Location of distributed array antenna, (b) location of the interior mounted sub-POS.
Applsci 10 03480 g008
Figure 9. Cloud chart of plate element calculation stress in the case of vertical gust overload.
Applsci 10 03480 g009
Figure 10. Cloud chart of plate element calculation stress in the case of lateral gust.
Applsci 10 03480 g010
Figure 11. Flight path.
Applsci 10 03480 g011

