Abstract
Bonded natural stone pavement has been typically used in historical neighborhoods to satisfy functional and architectural aesthetic standards. Despite its advantages, it has been barely applied to places for heavy traffic volume or high travelling speed because of various structural failures in joints and bedding courses. Ultra-rapid-hardening mortar for natural stone pavement was considered as an alternative to minimize these failures. The objective of this study is to develop bound stone pavement using the ultra-rapid-hardening mortar for high traffic volume and evaluate throughout by carrying out material tests, plate load test, accelerated pavement test (APT), and falling weight deflectometer (FWD) test. For the tests, four types of pavements, asphalt, concrete block, and two bound stone pavements, were produced in a testing facility. The bearing capacity of the sub-base course, which was asphalt and concrete, showed values 1.62 and 2.64 times higher than deemed satisfactory. Additionally, rut depth was measured using a transverse profile logger during the APT test and the test was terminated at 1.97 million cumulative equivalent single axle loads (ESALs). In the rut depth measurements, the deepest deflection (16.0 mm) was made in the asphalt pavement and the depth of the concrete block pavement was 4.5 mm. Vertical displacements of 3.0 and 1.5 mm were obtained in stone pavements A and B, respectively. The maximum pavement vertical deflection response was recorded at 0, 0.4, and 1.97 million ESALs. The response results revealed that they were influenced by the material types of either bedding or sub-base courses. With these outcomes, it would be possible to apply the baseline data for designing rigid small element pavement for heavy traffic volume or high travelling speed roads.
1. Introduction
Natural stones have generally been introduced as pavers for specific areas with low traffic volumes such as car parks, sidewalks, and historically preserved sites [1,2,3]. In particular, stone pavements are frequently required in historic areas or cities because of their architectural beauty and environmental aspects [1,4,5,6]. Generally, the use of stone pavers for a historical aesthetic is suggested for areas with light traffic volume. As the quantity and weight of vehicles have increased, the deterioration of structured pavement has also increased many-fold.
Cracks in stone-paved structures are usually generated in various ways depending upon the source of distress. The majority of structural failures occur at the surface course, specifically at the laying course and grouting filled in the gaps amongst stone elements. Once repetitive wheel loading is exerted on the surface, vertical displacement of the pavers often develops at the jointing material because of insufficient resistance of punching shear between the joints and bedding. As the matrix of stones collapses, vertical and lateral movements of the pavers are the consequences of cracks in the bedding course that originated from high traction forces, for instance, braking, accelerating, and cornering. The surface elements are eventually displaced from the bound stone pavement.
BS 7533-Part 10 and National Stone Surfacing (NSS) from the Society of Chief Officers of Transportation in Scotland (SCOTS) recommend that a rigid pavement construction be capable of carrying heavy loadings over a long service life with minor maintenance. For this reason, bound stone pavement, which is rigidly bonded with joint filling, surface elements, and bedding course could be used as a substitute owing to its efficiency, comfort, enhanced performance, and cost-effectiveness to prevent the above-mentioned problems caused by heavy traffic loading [7].
Although various studies have been conducted that evaluated the performance of a variety of pavement constructions, empirical determinations from long-term experience, and field tests have been needed in pavement design procedures [8,9,10,11,12]. Additionally, full-scale accelerated pavement testing (APT) has become a reliable and realistic acceleration simulation to predict the long-term serviceability of a road over a short time. Many highway agencies around the world have adopted testing facilities due to these numerous advantages [12,13,14]. First of all, the facilities offer a secure testing environment for the researchers. Secondly, APT can be performed quickly and in a controlled manner. Finally, the accuracy of tests can be increased owing to the management of the quantity of wheel load applications and the loading positions [13,14,15]. However, the long-term performance of bound stone pavement has not been specifically studied by introducing the APT, and it should be determined for further development of the stone element pavement.
For these reasons, the objective of this study is to establish the baseline data and performance of the proposed profile of bonded stone pavement using rapid-hardening mortar for heavy traffic volume or high travelling speed. In this study, four pavement structures such as asphalt, concrete block interlocking pavement, two different types of stone-paved roads were constructed for the material tests and accelerated simulation by meeting corresponding design specifications. The mechanical properties of materials used in the pavement structures were verified before the APT. Additionally, the falling weight deflectometer (FWD) test and rut depth measurements were conducted to determine the changes in vertical deflection response and rutting of the testing pavements during the simulation.
2. Pavement Profiles and Material Tests
2.1. Pavement Profiles
To compare the long-term serviceability of natural stone bound pavement for less than 1000 annual daily truck traffic (AADTT) and travelling speed of 60 km/h, four different types of road designs with asphalt, concrete block pavement, and two different stone-paved road sections were implemented for APT. The surface layer, laying course, and base course were considered as the experimental variables in this study, and material descriptions and cross-sectional profiles are provided in Figure 1.
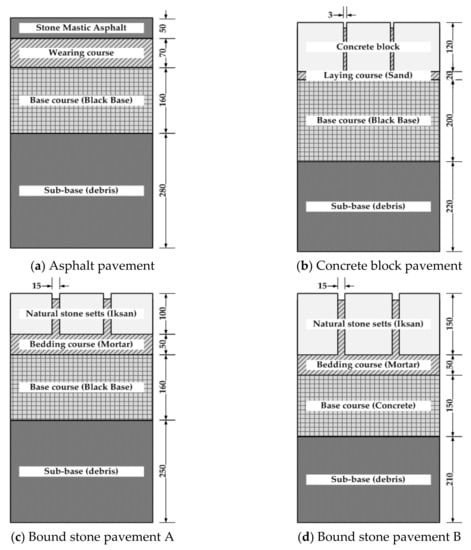
Figure 1.
Pavement cross-sectional profiles for accelerated pavement testing.
In case of the asphalt road, as illustrated in Figure 1a, it was designed based on the category III (not used for bus lanes) road profile in the Asphalt Pavement Design Guideline published by the Seoul Metropolitan Government. The road design in this category is designated for normal roads that require a California Bearing Ratio (CBR) in a range of 5%–10% and exceed 1075 AADTT. Due to the traffic volume of heavy vehicles, a stone mastic asphalt (SMA) mixture and wearing course were paved with a thickness of 120 mm for the surface layer. To support the surface structure, an asphalt concrete layer was cured with dimensions of 160 mm for the base course.
The design of concrete block pavement (Figure 1b) followed the standard pavement profile for heavy traffic load from the Belgian Road Research Centre. The concrete block for the surface layer had dimensions of 200 × 100 × 120 mm (length × width × height). The pavers were supported by bedding sand with a thickness of 20 mm. The concrete blocks were interlocked with the surrounding sand for joint filling. Asphalt concrete for the base course with a depth of 200 mm was layered over the top of the sub-base course.
In terms of bound stone pavement structures (Figure 1c,d), the load-dependent pavements with bound natural stones were designed based on the guideline for standardization of vehicular pavements (Richtlinien für die Standardisierung des Oberbaues von Verkehrsflächen (RStO 01)) from the Road and Transportation Research Association (Forschungsgesellschaft für Straßen- und Verkehrswesen e. V. (FGSV)) in Germany. Both pavement structures were designed to meet 1000 AADTT and 60 km/h travelling speed. For the first one, its profile is a typical bound stone pavement that is composed of natural stone, bedding course, and road base with a thickness of 100, 50, and 160 mm, respectively. However, bound stone pavement B was the proposed design profile with a base course cast in concrete that consisted of materials that were different from the other stone pavement. The natural stones in both cases were granite quarried from Iksan, Jeollabuk-do, South Korea. The stone pavers for bound stone pavement A and B had different dimensions of 120 × 180 × 100 mm and 120 × 180 × 150 mm, respectively. The surfacing material was bonded with mortar using rapid hardening cement.
2.2. Material Tests
2.2.1. Asphalt
The asphalt mixtures for the base course, wearing course, and SMA implemented in the test track were designed by considering the aggregate gradation as summarized in Table 1 from Korean Construction Specification (KCS) 44 50 05: Anti-frost layer, sub-base, and base course construction, KCS 44 50 10: Asphalt concrete paving construction and Express Construction Specification (EXCS) 44 50 10: Asphalt concrete paving construction. The bitumen type used in the present study was PG (performance graded bitumen) 76–22, which had viscosity of 1248 cP at 135 °C and dynamic shear of 1516 G•/sin δ at 76 °C in the original binder status specified by the Ministry of Land, Infrastructure and Transport in Korea. The quality control of asphalt for all purposes was ensured by property test items following the above-mentioned recommendations as shown in Table 2.

Table 1.
Aggregate gradation of asphalt.
Table 2.
Asphalt mix design recommendation.
2.2.2. Sand
To determine the quality of the sand for both bedding course and joint material in concrete block pavement, sieve analysis of aggregates was conducted according to the Design and Maintenance of Permeable Block Pavement from the Seoul Metropolitan Government. The properties of sand for bedding course and joint material were ensured by the corresponding recommendation as shown in Table 3.
Table 3.
Properties of sand for bedding course and joint material.
2.2.3. Mortar
This study used ultra-rapid-hardening (URH) cement and retardant for bedding course and joint filling. URH cement is typically applicable to numerous construction applications such as grouting, shoe installations, and quick concrete repairs. The mix design of mortar was discovered in an earlier investigation that evaluated mechanical properties [3]. The compressive strength and flexural strength of mortar for laying course and joint filling are tabulated in Table 4. Under BS 7533-4 and Natural Stone Surface (NSS) in the UK, it is recommended that a rigid bound course should be constructed when a rigid surface layer is applied. The minimum requirements of compressive strength at 28 days are 30 and 15 MPa for laying course and 40 and 15–40 MPa for jointing material, respectively, in both specifications. In the case of flexural strength, fine concrete for jointing material at 28 days requires more than 6 MPa in NSS. As described in both specifications, the mortar mixture had appropriate conditions for bedding course and joint filling.
Table 4.
Test outcome of mortar for laying course and joint (Han and Gong et al. [3]).
2.2.4. Concrete
Table 5 shows the mix design of the concrete applied for a base course in bound stone pavement B. To analyze the properties of designed concrete, air content and slump tests were conducted based on KS (Korean Standard) F 2421 and KS F 2402. The test results were 4.9% and 120 mm, respectively, and both outcomes satisfied KCS 14 20 10: Concrete construction. Additionally, Table 6 shows that the compressive strength test result and the concrete strength after 7 days was 18.1 MPa, which demonstrated a higher value of the specification from KCS 44 55 20: Materials for road pavement.
Table 5.
Mix design of concrete for base coarse (kg/m3).
Table 6.
Compressive strength test results.
2.2.5. Natural Stone Sett
Granite quarried from Iksan, Korea was used for finishing surface materials in both bound stone pavement structures. The compressive strength and water absorption of the sett were also evaluated in the former investigation [3]. Both mechanical properties were investigated by KS F 2519: Standard test method for compressive strength of natural building stone and 2518: Standard test method for absorption and bulk specific gravity of stone, and the outcomes were assessed by KS F 2530: Stone materials, as indicated in Table 7.
Table 7.
The test result of natural surface stone (Han and Gong et al. [3]).
2.2.6. Concrete Block
The permeable concrete block pavers were evaluated by examining compressive strength and flexural strength. Flexural strength is a fundamental consideration in terms of concrete block pavers, and it should be estimated by the core compressive strength. As described in the Design and Maintenance of Permeable Block Pavement from the Seoul Metropolitan Government, the strength estimation is 25% of the compressive strength. Table 8 shows the outcome and requirements of each testing criteria, and both strength outcomes met the corresponding acceptances.
Table 8.
The test result of concrete block paver.
3. Experimental Methods
The objective of this study was to examine the long-term serviceability of bound stone pavement for heavy vehicles and to compare it with other types of pavement structures. For this reason, the evaluation criteria were divided into two different measurements. Firstly, the bearing capacity of the sub-base course was validated as described in KS F 2310: Standard test method for plate load test on soils for roads. For the final evaluation item, rut depth was analyzed by using a transverse profile logger for surveying the differences in rutting caused by the APT.
3.1. Plate Load Test
To determine the uniform bearing capacity of the sub-base course in the test track, a plate load test of soil for the road was conducted after finishing sub-base construction and the vertical reaction was determined to validate the design requirements. The modulus of reaction can be calculated by measuring settlements of the soil resulting from the imposed pressure of standard plates that were 300, 400, and 750 mm in diameter and more than 25 mm in thickness. The load induced to the plate incrementally increases with a ratio of 35 kN/m2 until the measuring settlements are less than 1%.
3.2. Accelerated Pavement Test
In terms of evaluating the long-term pavement performance of a pavement structure, it is usually difficult to employ testing apparatus because the structure is placed on the ground. For this reason, APT is normally introduced to determine the long-term serviceability of layered structural pavements under an accelerated accumulation of damage. The APT is carried out in a specially designed track where heavy vehicle simulators are driven across testing pavement sections. In this application, it is more convenient to use a single number to express traffic loading by using equivalent standard axle loads (ESALs) from data collected in the American Association of State Highway Officials (AASHO) Road Test. For instance, a single axle load with dual tires weighing 8.16 ton is equivalent to one ESAL.
In this study, the Korea Expressway Corporation Research Institute (KECRI) in Hwaseong-si, Gyeonggi-do, South Korea, which has a Korea Accelerated Loading Environment Simulator (KALES) system (Figure 2a) was designated as a testing site. This simulation system with a total area of 2060 m2 was specially developed for the acceleration simulation by the KECRI in 1999 [16]. The heavy vehicle simulators (HVSs) were operated by triaxle with dual tires going 20–22 km/h and were driven across as illustrated in Figure 3. A single axle load was increased as shown in Figure 2b and the ESALs were accumulated as the day of the APT progressed. The APT was terminated after about 2 million ESALs for 70 days.
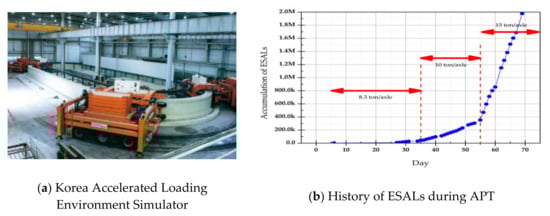
Figure 2.
Korea Accelerated Loading Environment Simulator and history of equivalent single axle loads (ESALs).
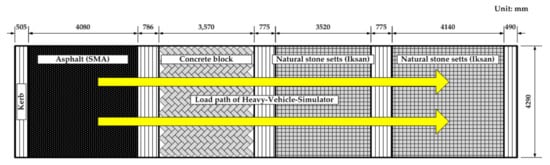
Figure 3.
Layout of the test track.
3.3. Transverse Profile Measurement
The rut depth of both wheel path and non-wheel path of designed pavements was logged after finishing the APT by using a transverse profile logger (Figure 4). This device with laser displacement meters recorded the rutting by driving along in the same direction as the HVSs. The measurements were made to compare relative vertical deflection at the end of the APT.
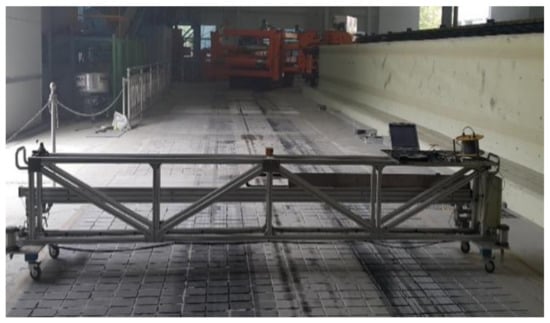
Figure 4.
Transverse profile logger.
3.4. Falling Weight Deflectometer Test
The falling weight deflectometer test was introduced to examine pavement vertical deflections for response to a stationary dynamic load imposed by a moving wheel load. The response data can be used to identify the bearing capacity of pavements for design and maintenance purposes. The measurements were collected by complying with ASTM D 4694-09: Standard Test Method for Deflections with a Falling-Weight-Type Impulse Load Device. The loading plate was 450 mm in diameter and force pulse was exerted with a half-sine wave and a peak force of 40 kN. The maximum vertical deflection values were obtained by measurements under the center of the load plate. The response of testing pavements was investigated at 0, 0.4, and 1.97 million ESALs of the APT.
4. Results and Discussion
4.1. Plate Load Test
The plate load test was performed to identify whether the uniform bearing capacity of the sub-base course was measured before the upper layers were constructed. This was because the homogeneous bearing capacity should be determined for the analysis of long-term performance depending on the type of surface layer. The capacity was measured by the test method specified in KS F 2310. From the measurements, the capacity was determined with a range of 474–518 MN/m3 as listed in Table 9. The bearing capacity of the sub-base course was 1.62 and 2.64 times higher, deemed satisfactory by KCS 44 50 05 for asphalt and concrete for base course construction, respectively. Considering the data collected, the sub-base course had sufficient bearing capacity to support a passing wheel load during the APT.
Table 9.
Bearing capacity of sub-base course.
4.2. Rut Depth Measurement and Visual Inspection
To obtain rut depth data, the transverse profile logger recorded the transverse profiles of surface layers using high-quality single point laser sensors with a measuring range and tolerance of ±100 and ±0.5 mm, respectively. Figure 5 shows the logged transverse profiles of the testing pavements. Additionally, the blue and red lines indicate the measurements taken before and after the APT, respectively, and the black boxes show the driving wheel paths. The rut depth measurements were recorded by measuring the depth differences of surface courses at wheel paths during the APT.
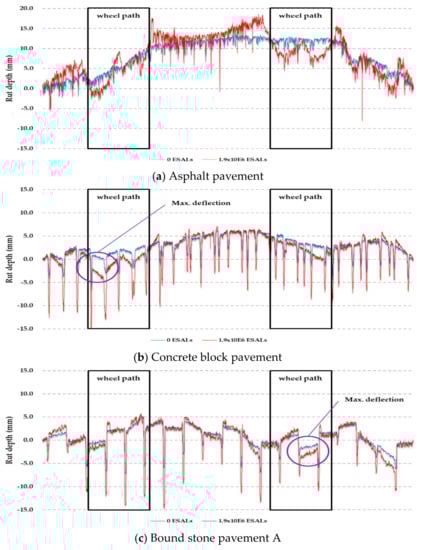
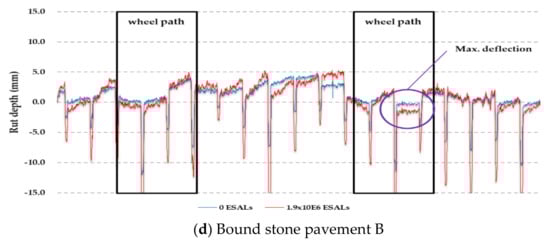
Figure 5.
Transverse profiles of testing pavements.
In the case of asphalt pavement, the maximum rut depth was 16.0 mm and the rut depth measurements at various points ranged from 13.0 to 16.0 mm. As shown in Figure 5a, significant ruts were discovered at wheel paths and an upward movement inevitably occurred in the middle of two-wheel tracks. This was because the asphalt pavement was a flexible pavement and the wheel loads induced severe horizontal stresses on the surface course during the APT. Consequently, the lateral movement of asphalt led to the ascendance at the gap between driving paths.
For the concrete block pavement, as shown in Figure 5b, the maximum vertical deflection of surface pavers caused by the accumulation of wheel load was 4.5 mm at the wheel paths. Additionally, there were plenty of steep fluctuations along with the logged profile. These occasional fluctuations represented the joints filled with sand and the depth of the joints notably increased at the end of the APT. Although an inclined movement of the surface developed in the asphalt profile, a small amount of rutting difference was discovered due to the disconnected surface course.
Regarding bound stone pavement A (Figure 5c), the greatest rut depth difference at the wheel paths was 3.0 mm. The rutting indicated that it was generated by the loss of adhesive strength between the stone elements and joint mortar. Moreover, the induced wheel load was directly transferred throughout the dislodged stone elements to bedding and base courses. Due to the flexible base course, the laying mortar affected the rutting of surface elements.
Finally, the maximum rut depth in bound stone pavement B (Figure 5d) was 1.5 mm, and it showed a smaller value compared to bound stone pavement A. The deeper stone pavers and different material of base courses used in both stone pavements influenced the bearing capacity of these pavement structures. As a result of conducting a visual inspection after the accelerated simulation, there was partial damage in numerous places and loss at the top of joint mortar in the wheel travelling sections. Owing to the defeat of joint material, a deeper rut depth at joints was logged compared to the original measurements. The distinctive deterioration was not recognized further in this type of pavement, excluding the loss in the joint mortar.
Figure 6 shows plotted data of rut depth measurements depending upon the number of cumulative ESALs. As illustrated in the graph below, rutting continuously increased over the ESALs. The largest and smallest rut depths were measured in bound stone pavement B and asphalt pavement, respectively. Bound stone pavement A showed relatively greater rutting compared to stone pavement B. In this circumstance, the different application of material types of base courses would lead to the difference. In the case of concrete block pavement, the great amount of rutting (3.0 mm) rapidly developed until 100,000 ESALs and the rut depth linearly increased up to 4.5 mm. The initial damage progressed because of the compaction of laying sand caused by wheel loading. Regarding asphalt pavement, it presented the fastest ratio of rutting among the tested pavements. In practice, the rutting ratio would be accelerated by the additional rut depth created by high temperature.
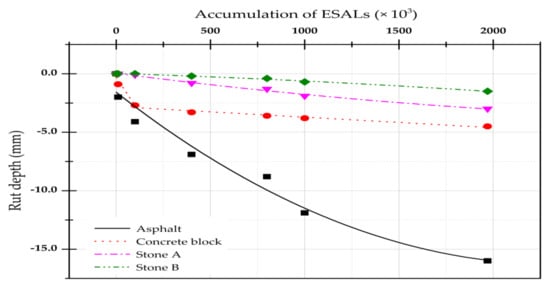
Figure 6.
Rut depth measurement.
4.3. Falling Weight Deflectometer Test
To examine pavement vertical deflection response along with the accumulation of ESALs, the FWD test was conducted by following the test method of ASTM D 4694-09. The data were collected at 0, 0.4, and 1.97 million ESALs of the APT. As summarized in Table 10, all the testing pavements straight after construction had similar vertical deflection responses, excluding the concrete block pavement. However, there were sudden changes in the responses in concrete block and bound stone pavement A at 0.4 million ESALs. For the concrete block, the response rapidly declined and gradually stabilized from the second measurement to the end of the APT. This was primarily generated by the initial settlement caused by compaction of laying sand from the driving wheel loads. In the case of both stone pavements, there was a stable vertical response by bound stone pavement B. This was affected by the mechanical properties of the materials used for base courses, which were asphalt and concrete. As can be seen in the asphalt pavement, the response peaked at 0.4 million ESALs and declined to 2.84 μm/kN.
Table 10.
Maximum vertical deflection result.
5. Conclusions
To implement stone pavements in heavy traffic volume or high travelling speed roads, bound stone pavement with rapid-hardening mortar has been developed to minimize the limitations. Although there have been numerous studies of asphalt and concrete block pavements, limited research has been conducted by reviewing the performance using the APT. The current study presented an evaluation of pavement performance for the proposed bound stone pavement profile, and test pavements with asphalt, concrete block, and two types of stone pavements were constructed by mitigating the corresponding design specifications. Initially, a plate load test was conducted to determine the bearing capacity of the sub-base course. The test results were found to satisfy the recommendation. The accelerated simulation with KALES was progressed by 1.97 million ESALs. The rut depth was measured using a transverse profile logger and the data collected at specific phases of the APT. The maximum terminal rut depth of asphalt, concrete block, stone A, and stone B were recorded as 16.0, 4.5, 3.0, and 1.5 mm, respectively. Furthermore, the calculation of pavement condition index (PCI) [17], which is used to identify the extensive condition of pavement structures, is required for further study to determine the numerical evaluation of the proposed pavement profile design in practice.
Author Contributions
Conceptualization, E.-S.H. and D.C.; Methodology, E.-S.H., J.G., H.J. and D.C.; Experiment, E.-S.H., J.G., and H.J.; Validation, D.C; Formal Analysis, E.-S.H. and J.G.; Investigation, E.-S.H., J.G., H.J. and D.C.; Data Curation, E.-S.H. and J.G; Writing—Original Draft Preparation, E.-S.H. and J.G; Writing—Review and Editing, D.C.; Visualization, H.J.; Supervision, D.C.; Project Administration, D.C. All authors have read and agreed to the published version of the manuscript.
Funding
This research was funded by the National Research Foundation of Korea (NRF) [2018R1D1A3B07049698]. The authors gratefully acknowledge this support.
Conflicts of Interest
The authors declare no conflict of interest.
References
- Coni, M.; Portas, S.; Maltinti, F.; Pinna, F. Sealing of paving stone joints. Int. J. Pavement Res. Technol. 2018, 11, 819–828. [Google Scholar] [CrossRef]
- Zoccali, P.; Moretti, L.; Mascio, P.D.; Loprencipe, G.; D’Andrea, A.; Bonin, G.; Teltayev, B.; Caro, S. Analysis of natural stone block pavements in urban shared areas. Case Stud. Constr. Mater. 2018, 8, 498–506. [Google Scholar] [CrossRef]
- Han, E.S.; Gong, J.; Cho, D.; Park, S.K. Experimental investigation on the application of ultra-rapid-hardening mortar for rigid small element pavement. Adv. Mater. Sci. Eng. 2019, 2625437. [Google Scholar] [CrossRef]
- Miccoli, S.; Finucci, F.; Murro, R. Social evaluation approaches in landscape projects. Sustainability 2014, 6, 7906–7920. [Google Scholar] [CrossRef]
- Moretti, L.; Mascio, P.D.; D’Andrea, A. Environmental impact assessment of road asphalt pavements. Mod. Appl. Sci. 2013, 7, 1–11. [Google Scholar] [CrossRef]
- Miccoli, S.; Finucci, F.; Murro, R. Assessing project quality: A multidimensional approach. Adv. Mater. Res. 2014, 1030–1032, 2519–2522. [Google Scholar] [CrossRef]
- Nobili, A.; Lanzoni, L.; Tarantino, A.M. Experimental investigation and monitoring of a polypropylene-based fiber reinforced concrete road pavement. Constr. Build. Mater. 2013, 47, 888–895. [Google Scholar] [CrossRef]
- Harvey, J.; Popescu, L. Accelerated pavement testing of rutting performance of two caltrans overlay strategies. Transp. Res. Rec. 2000, 1716, 116–125. [Google Scholar] [CrossRef]
- Erlingsson, S. Performance of two thin pavement structures during accelerated pavement testing using a Heavy Vehicle Simulator. In Proceedings of the 2nd Int. Conferences on Accelerated Pavement Testing, Minneapolis, MN, USA, 26–29 September 2004. [Google Scholar]
- Romanoschi, S.A.; Metcalf, J.B.; Li, Y.; Rasoulian, M. Assessment of pavement life at first full-scale accelerated pavement test in Louisiana. Transp. Res. Rec. 1999, 1655, 219–226. [Google Scholar] [CrossRef]
- Kogbara, R.B.; Masad, E.A.; Kassem, E.; Scarpas, A.; Anupam, K. A state-of-the-art review of parameters influencing measurement and modeling of skid resistance of asphalt pavements. Constr. Build. Mater. 2016, 114, 602–617. [Google Scholar] [CrossRef]
- Gokhale, S.; Choubane, B.; Byron, T.; Tia, M. Rut initiation mechanisms in asphalt mixtures as generated under accelerated pavement testing. Transp. Res. Rec. 2005, 1940, 136–145. [Google Scholar] [CrossRef]
- Du Plessis, L.; Ulloa-Calderon, A.; Harvey, J.T.; Coetzee, N.F. Accelerated pavement testing efforts using the Heavy Vehicle Simulator. Int. J. Pavement Res. Technol. 2018, 11, 327–338. [Google Scholar] [CrossRef]
- Hugo, F.; Martin, A.E. NCHRP Synthesis 325: Significant Findings from Full-Scale Accelerated Pavement Testing; NCHRP Synthesis 325, Transportation Research Board: Washington DC, USA, 2004. [Google Scholar]
- Metcalf, J.B. NCHRP Synthesis 235: Application of Full-Scale Accelerated Pavement Testing; Transportation Research Board: Washington DC, USA, 1996. [Google Scholar]
- Yang, S.-C.; You, T.-S.; Eom, J.-Y. Development status of Korea accelerated loading and environment simulator (KALES). Int. J. Highw. Eng. 2000, 2, 139–148. [Google Scholar]
- Zoccali, P.; Loprencipe, G.; Galoni, A. Sampietrini stone pavements: Distress analysis using pavement condition Index Method. Appl. Sci. 2017, 7, 669. [Google Scholar] [CrossRef]


© 2020 by the authors. Licensee MDPI, Basel, Switzerland. This article is an open access article distributed under the terms and conditions of the Creative Commons Attribution (CC BY) license (http://creativecommons.org/licenses/by/4.0/).