Spectral Reflectance Characteristics and Chlorophyll Content Estimation Model of Quercus aquifolioides Leaves at Different Altitudes in Sejila Mountain
Abstract
1. Introduction
2. General Situation and Research Methods of the Research Area
2.1. Survey of Research Area
2.2. Leaf Reflectance Spectrum Collection and Chlorophyll Determination
2.3. Data Processing Method
3. Results and Analysis
3.1. Chlorophyll Content and Spectral Characteristics of Quercus aquifolioides at Different Altitudes
3.2. Spectral Characteristics of Quercus aquifolioides with Different Altitude Gradient
3.3. Dynamic Changes of Spectral Characteristic Parameters of Quercus aquifolioides at Different Altitudes
3.4. Correlation between Leaf Spectra and Derivative Spectra and Chlorophyll Content in Leaves
3.5. Correlation between Leaf Spectral Parameters and Chlorophyll Relative Values of Quercus aquifolioides at Different Altitudes
3.6. Estimation Model of Chlorophyll Content in Plant Leaves Based on Spectral Parameters
4. Conclusions and Discussion
- (1)
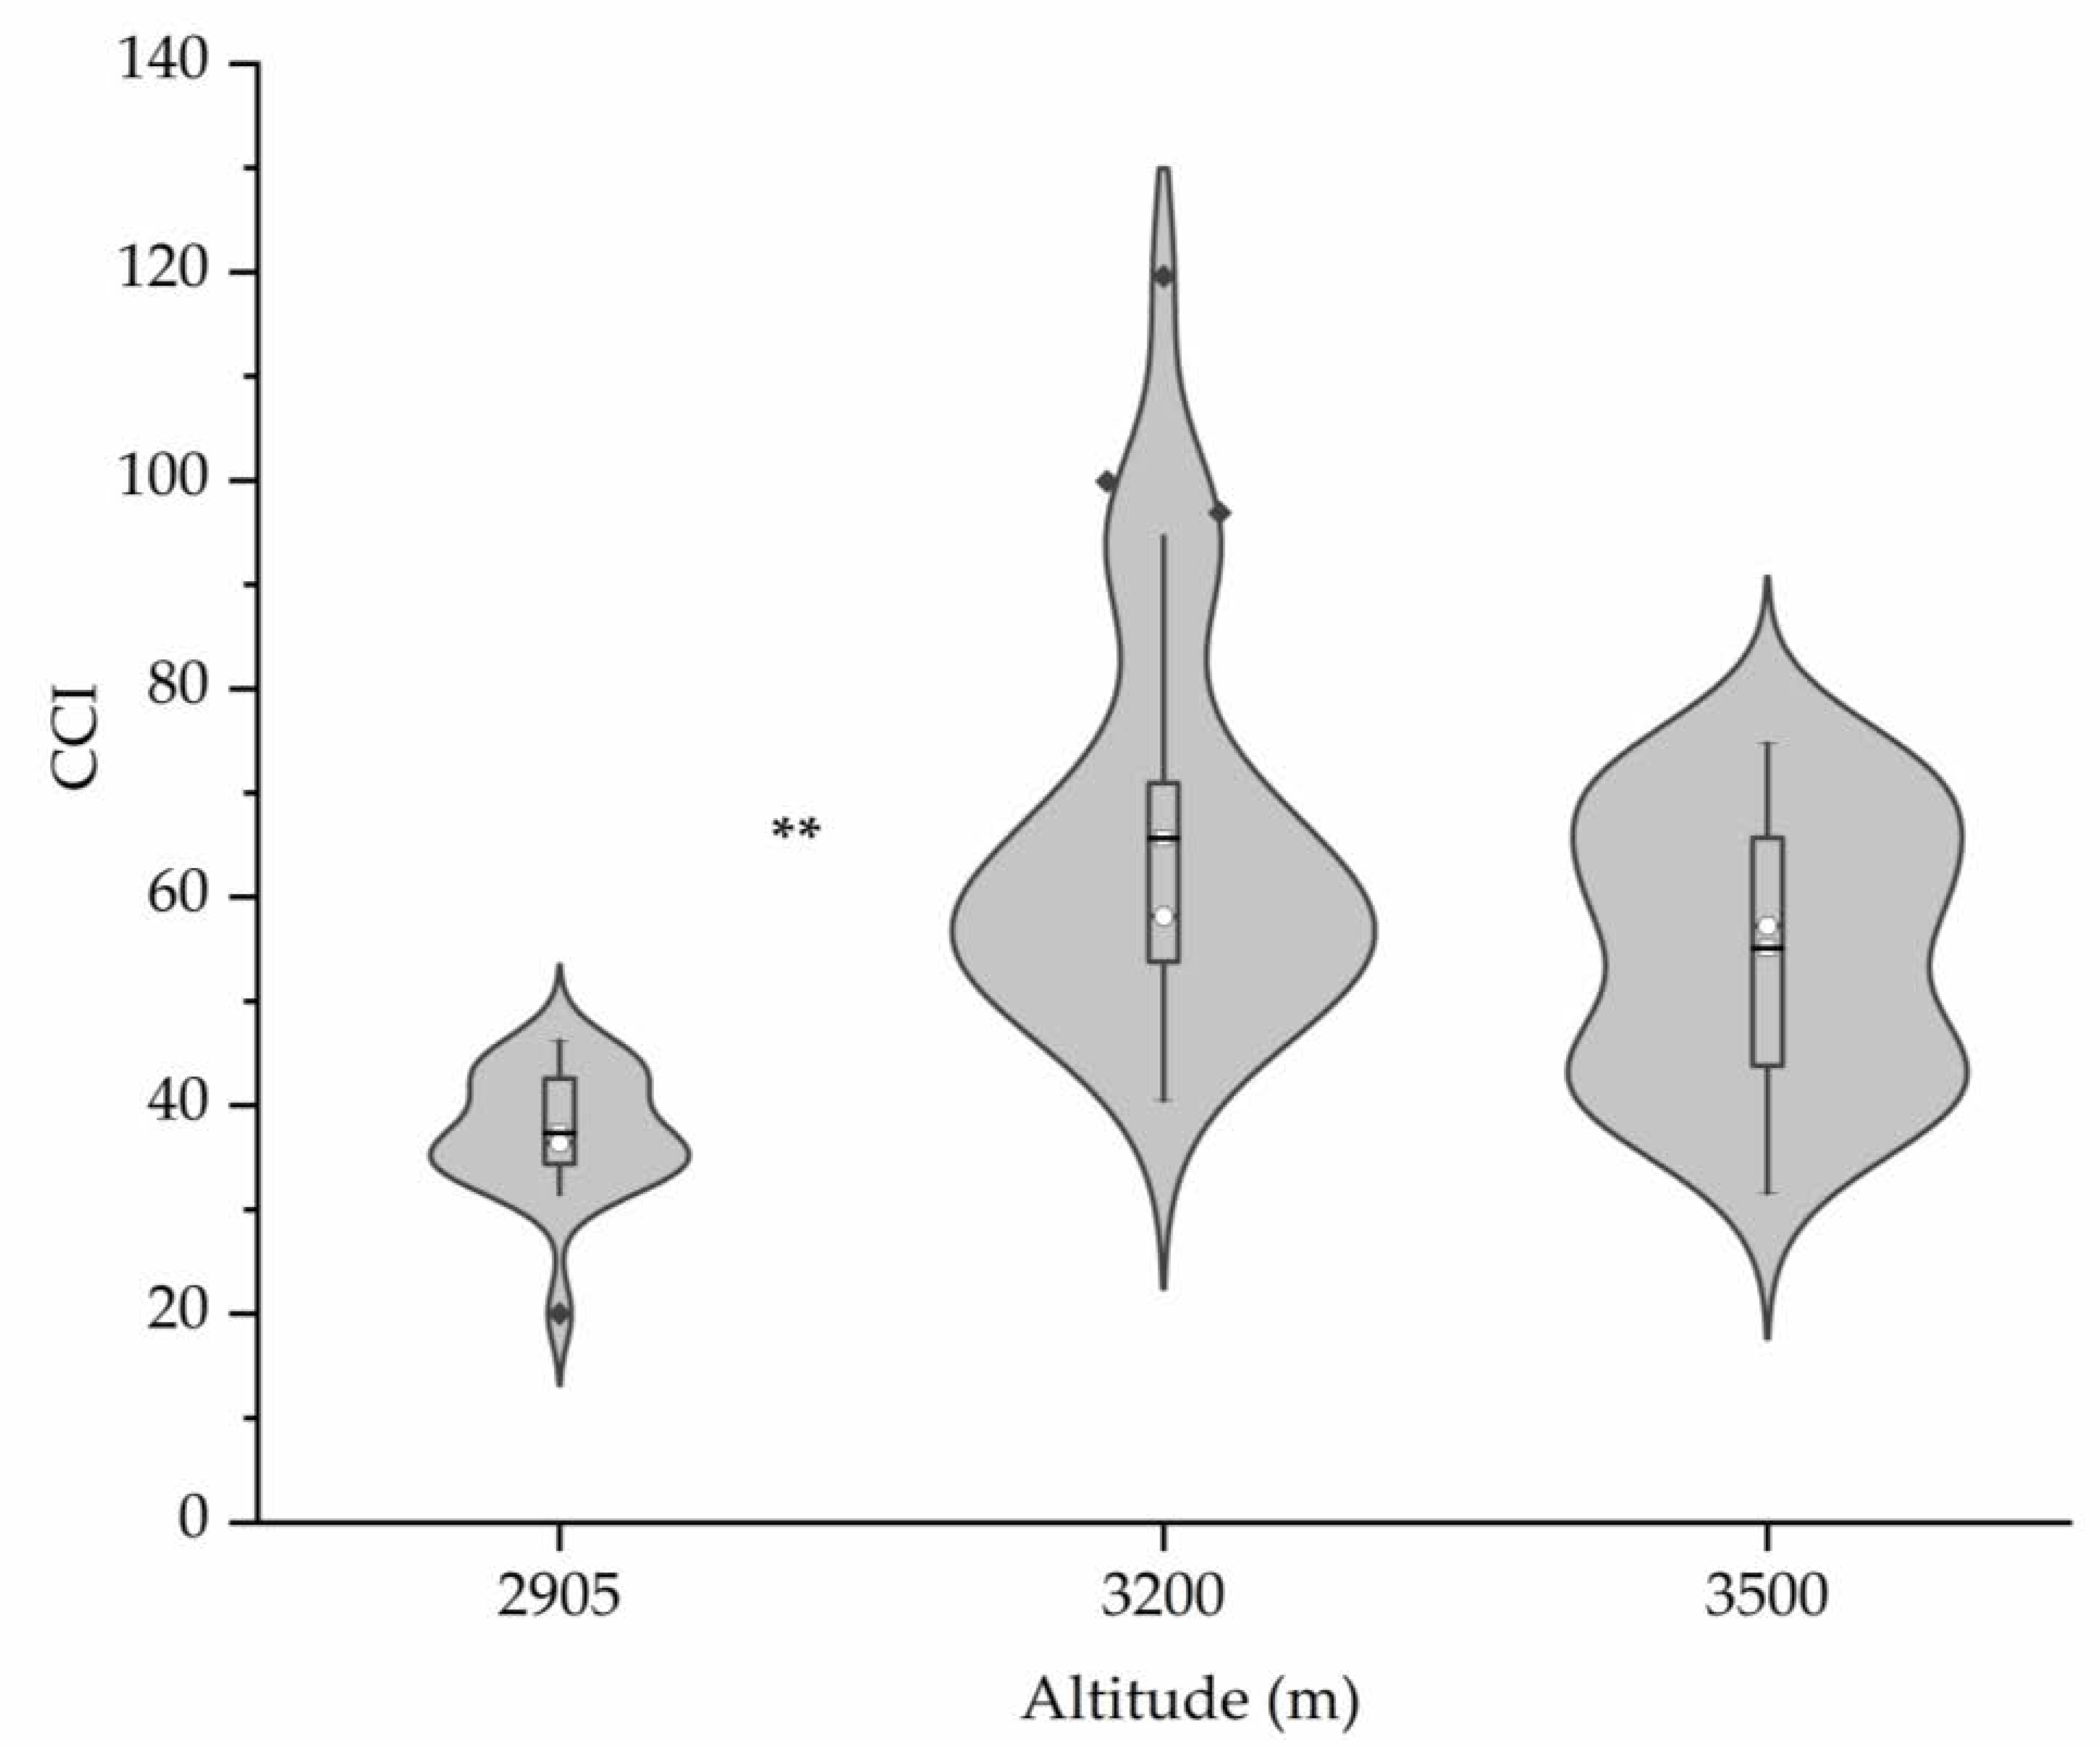
- The relative values of chlorophyll content of Quercus aquifolioides at different altitude gradients were significantly different. From 2905 m to 3500 m, the relative chlorophyll content of Quercus aquifolioides showed a trend of increasing first and then decreasing, which indicated that the environment at lower altitude or higher altitude was not conducive to chlorophyll synthesis and accumulation. At a low altitude of 2905 m, due to insufficient light and human destruction, its chlorophyll content was reduced. 3300 m above sea level was the most suitable growth area for Quercus aquifolioides. However, with the further increase in altitude (3500 m), due to the aggravation of unfavorable environment such as low temperature, thin atmosphere or strong ultraviolet radiation, the plant’s resistance ability is limited, which also limits the growth and development of Quercus aquifolioides.
- (2)
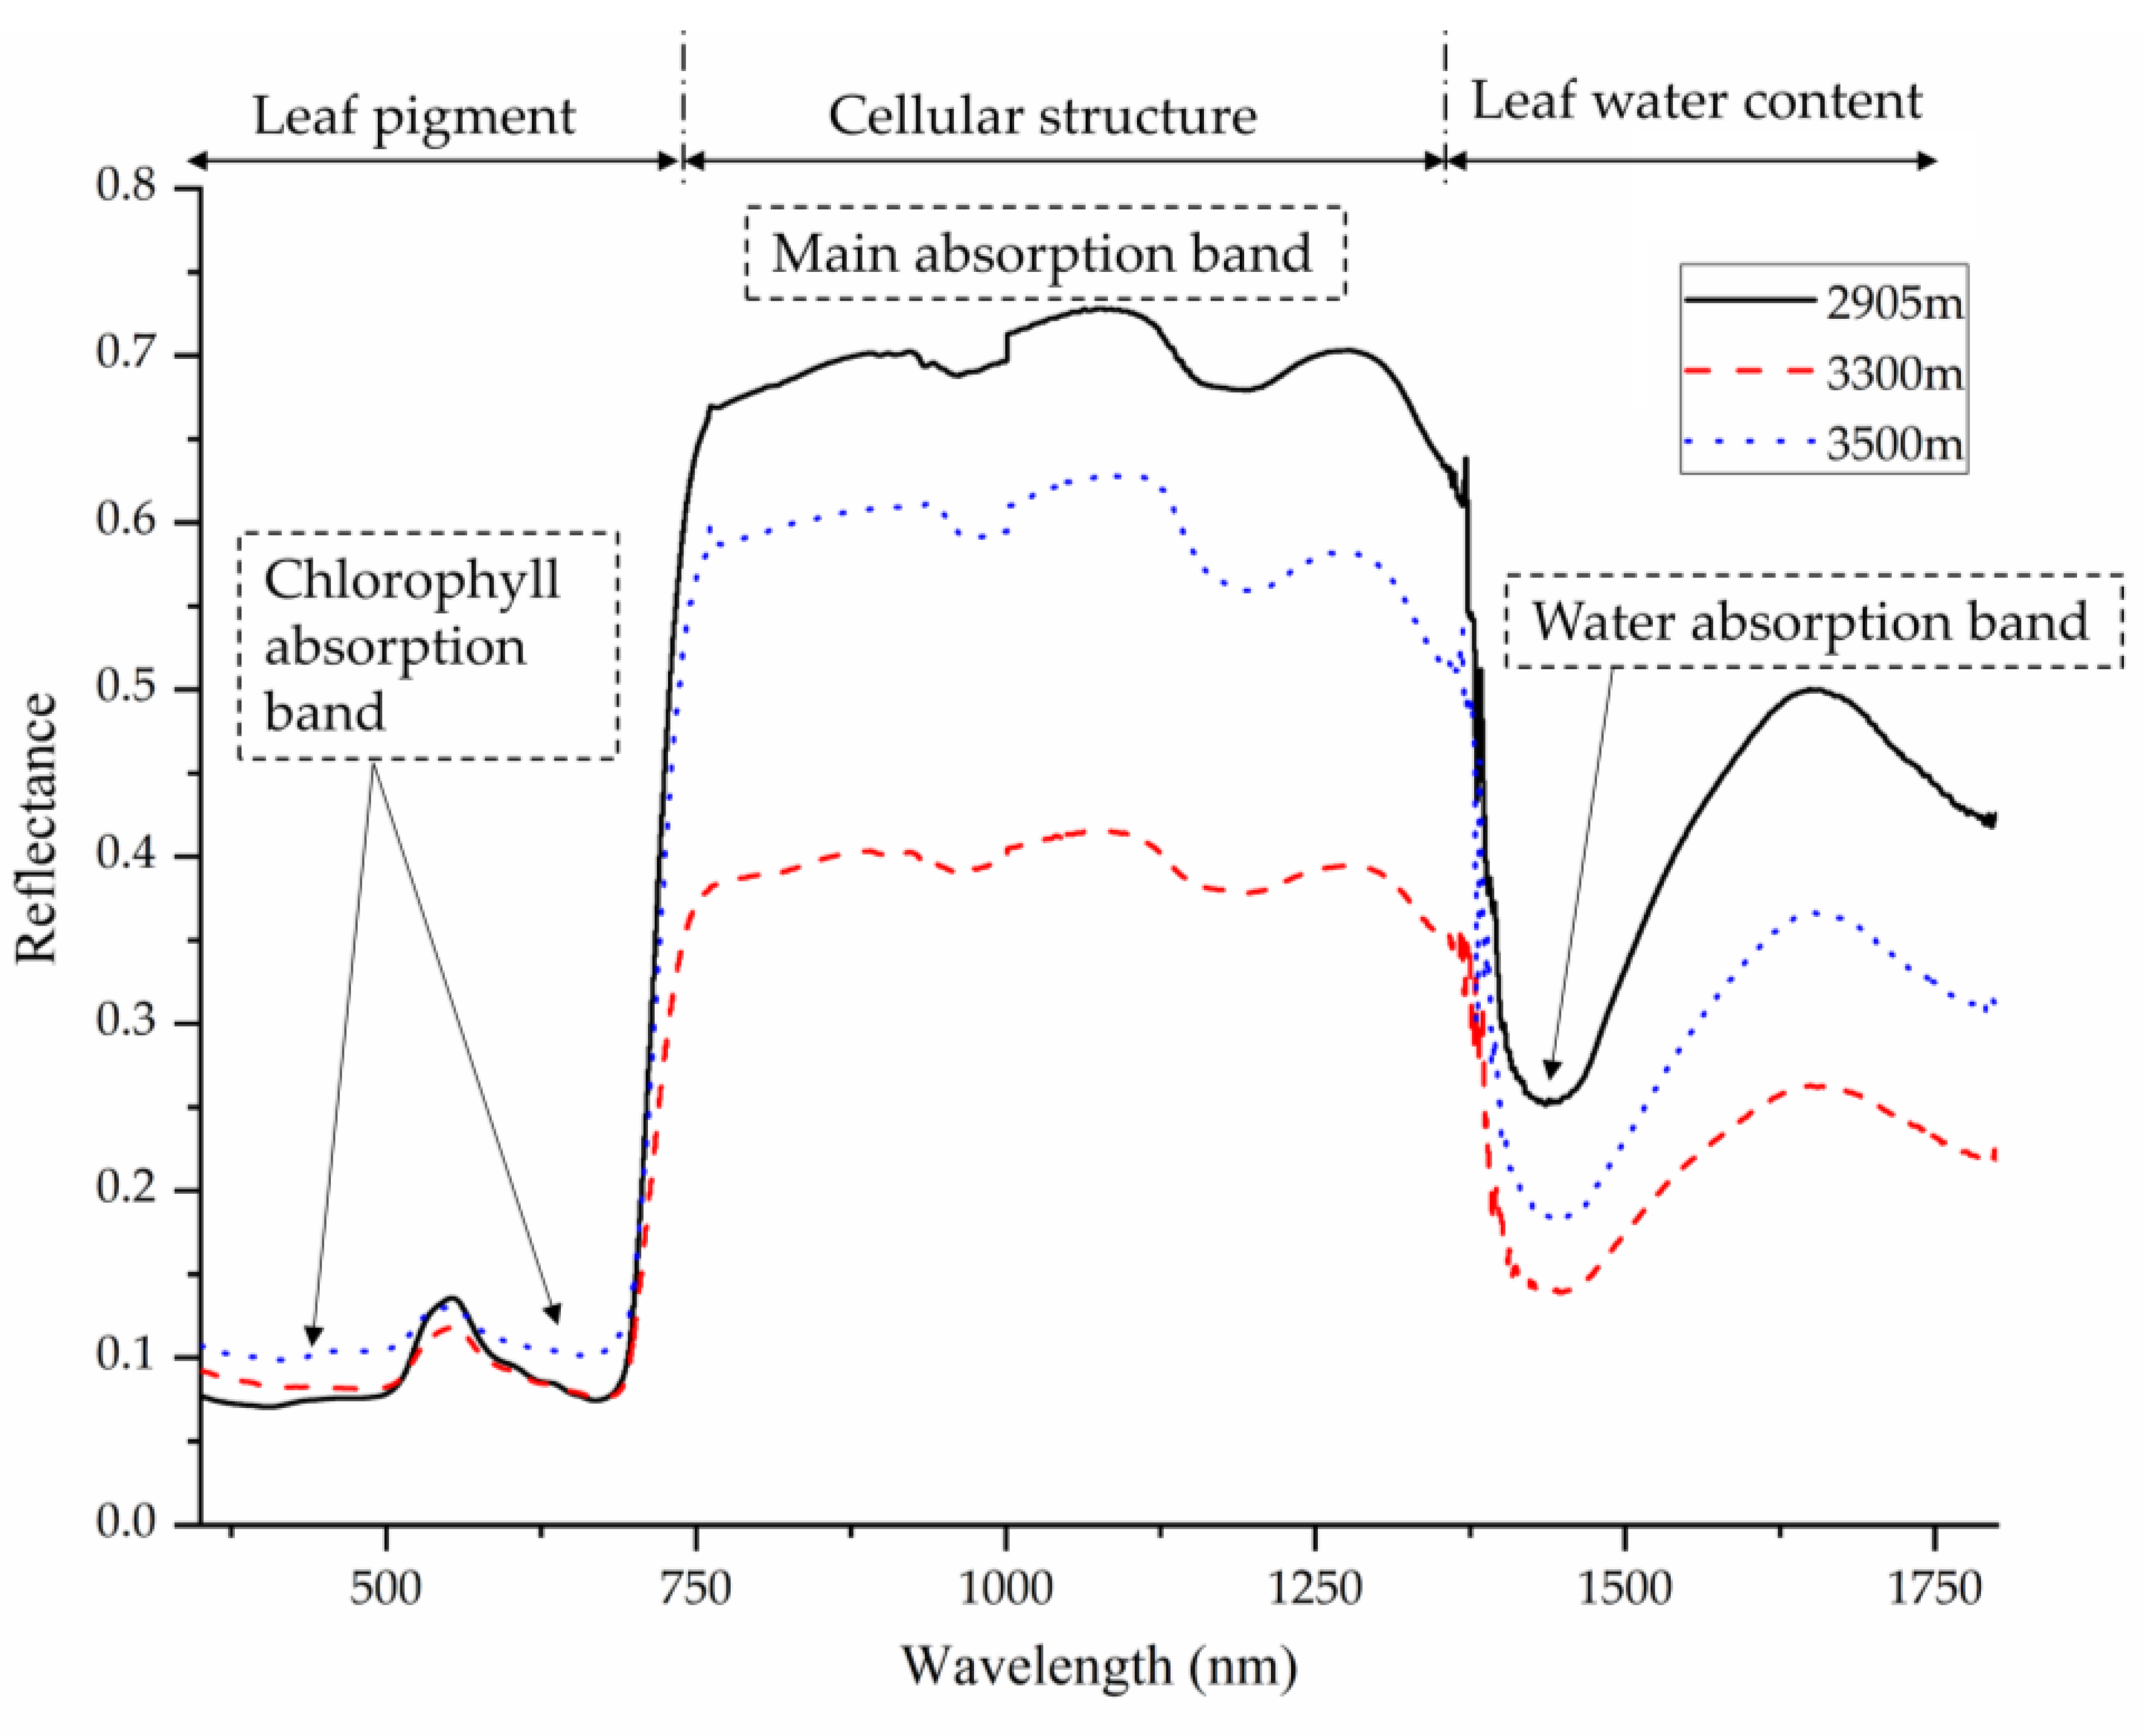
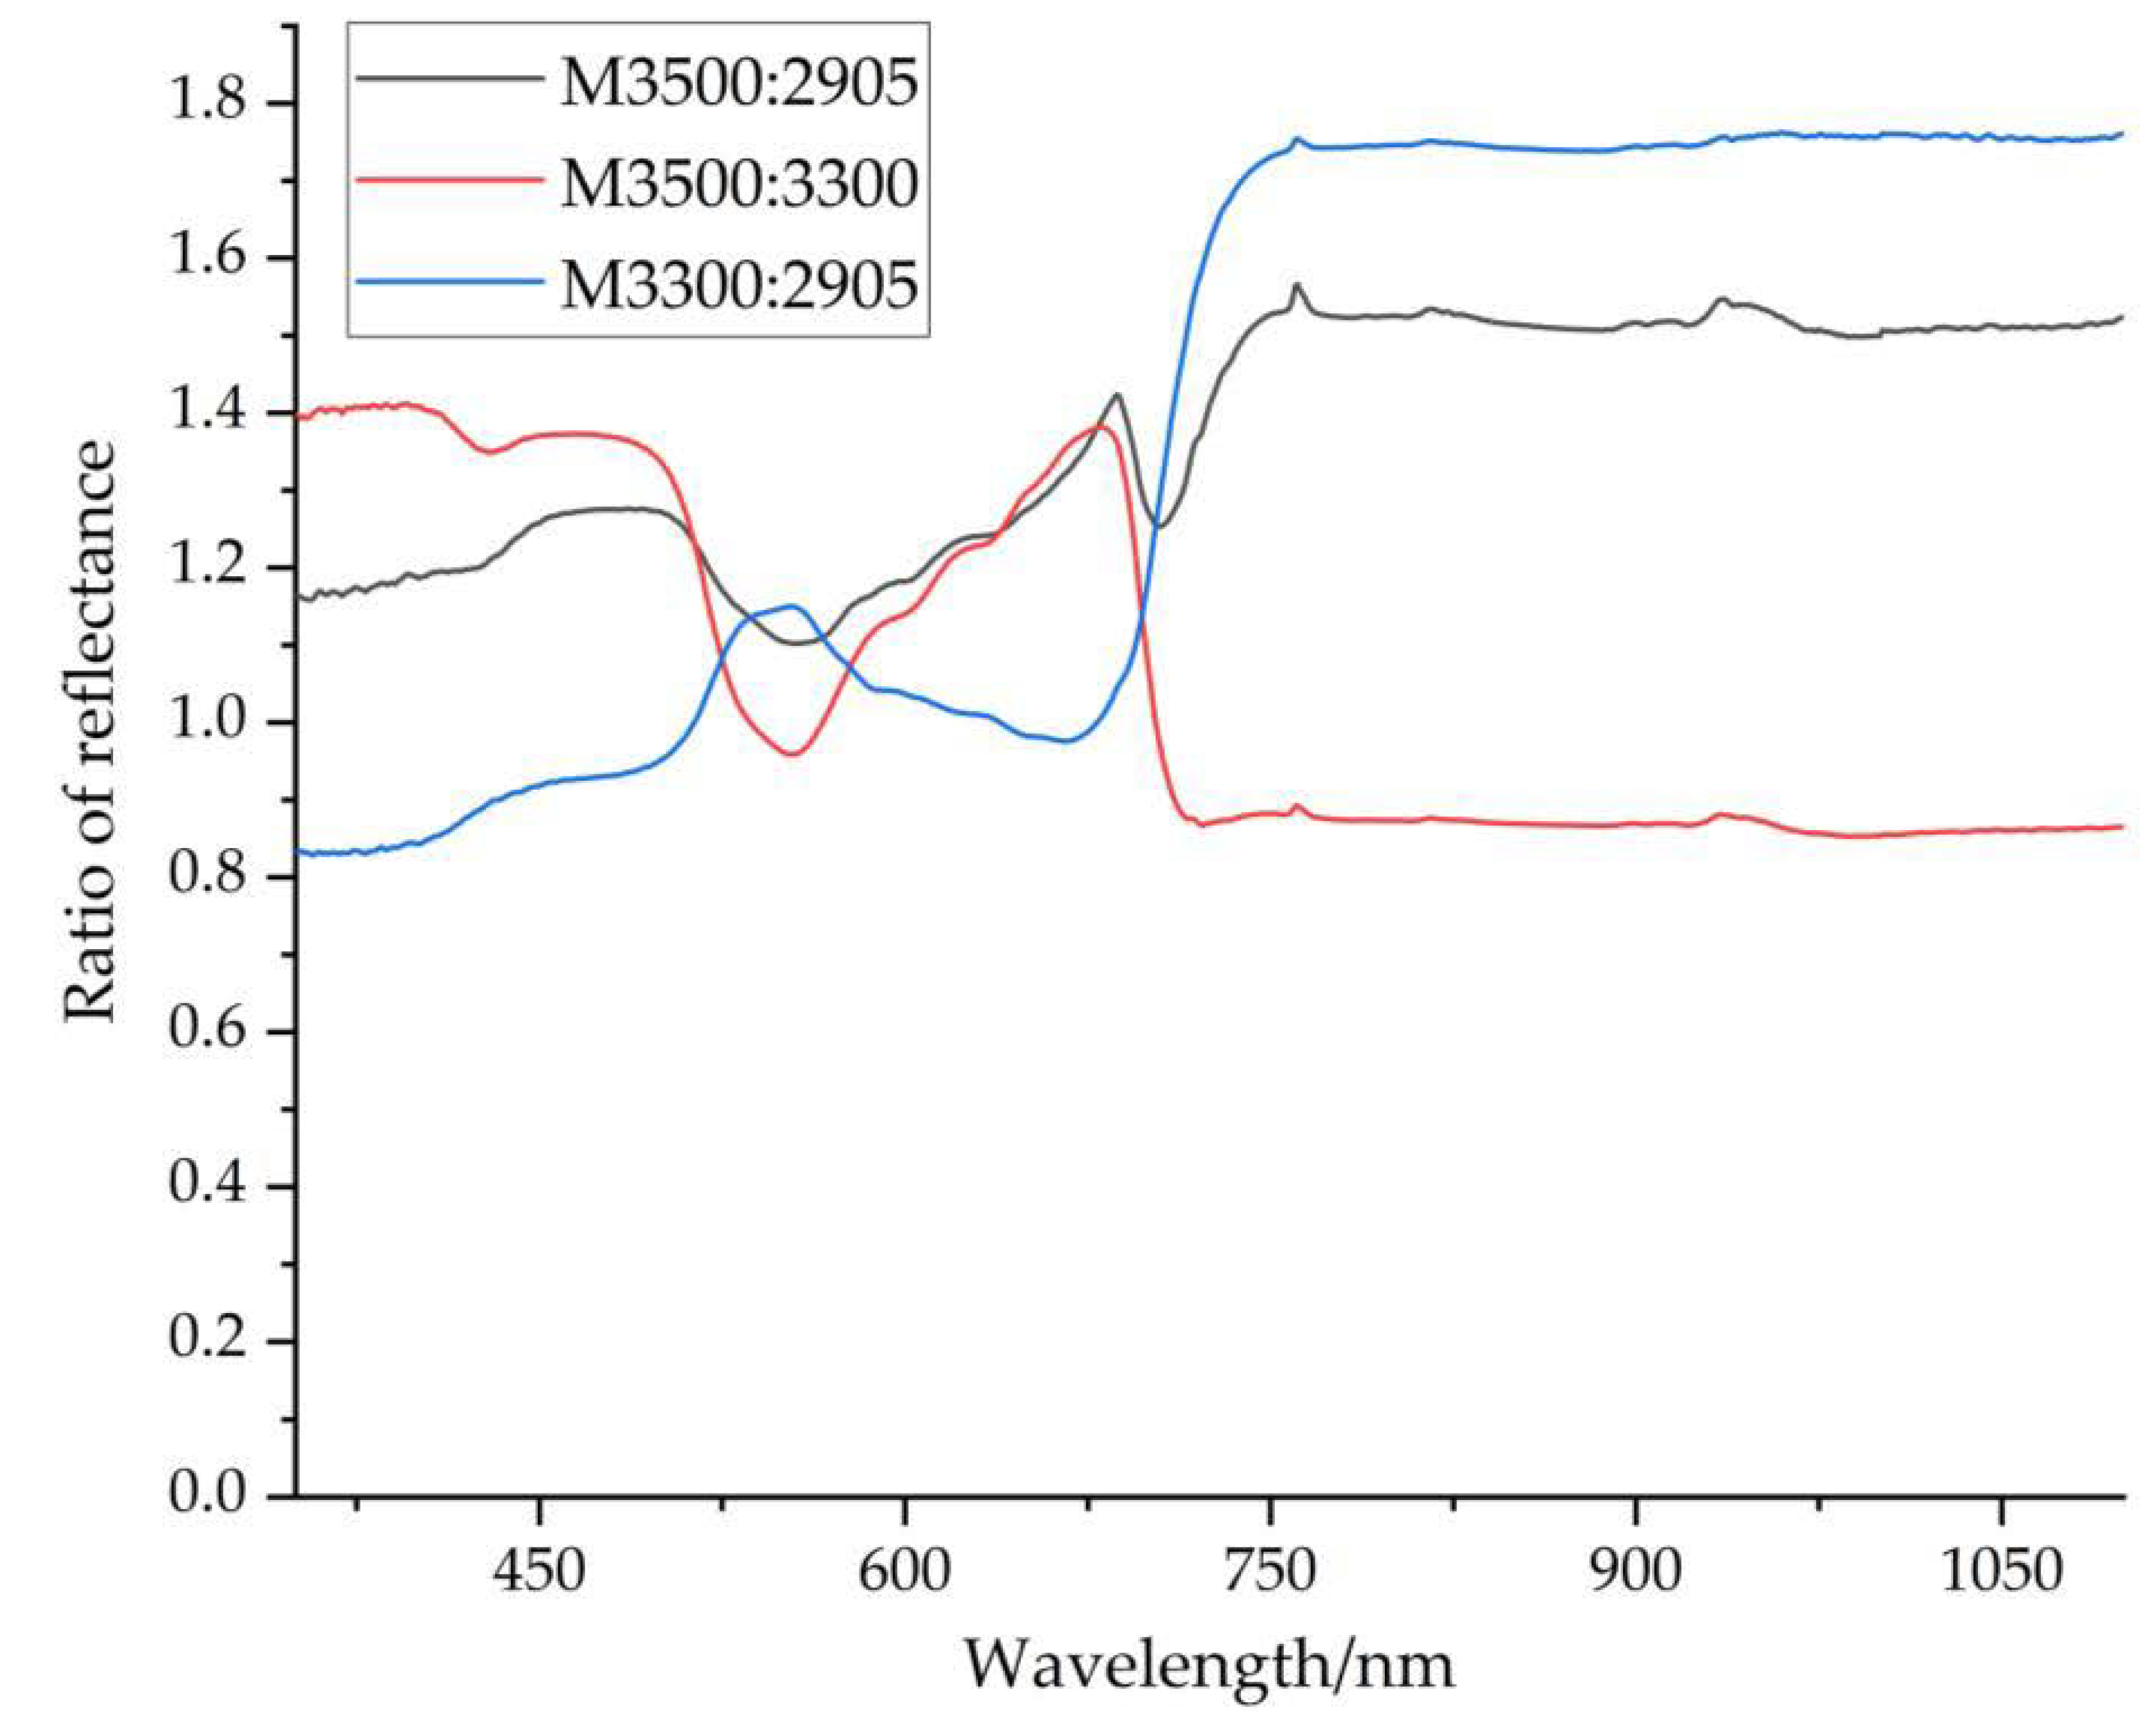
- The trend changes of leaf spectral reflectance curves of Quercus aquifolioides were generally consistent under different altitude gradients. In the visible light band (350~550 nm), the spectral reflectance was 3500 m > 3300 m > 2905 m. In the range of 550~700 nm, the reflectivity was 3500 m > 2905 m > 3300 m. In the near infrared band (750~1100 nm), the reflectivity was 2905 m > 3500 m > 3300 m.
- (3)
- In the range of 350~1800 nm, there were 4 main reflection peaks and five main absorption valleys in the leaf surface spectral reflection curve of Quercus aquifolioides, and their positions were basically the same. Visible light band was difficult to reflect the damage of host plants, while near infrared band (750~1400 nm) has the greatest degree of spectral reflectance discrimination. This band was the sensitive range of leaf spectral response of Quercus aquifolioides. At the same time, such variation characteristics were universal under different altitude conditions.
- (4)
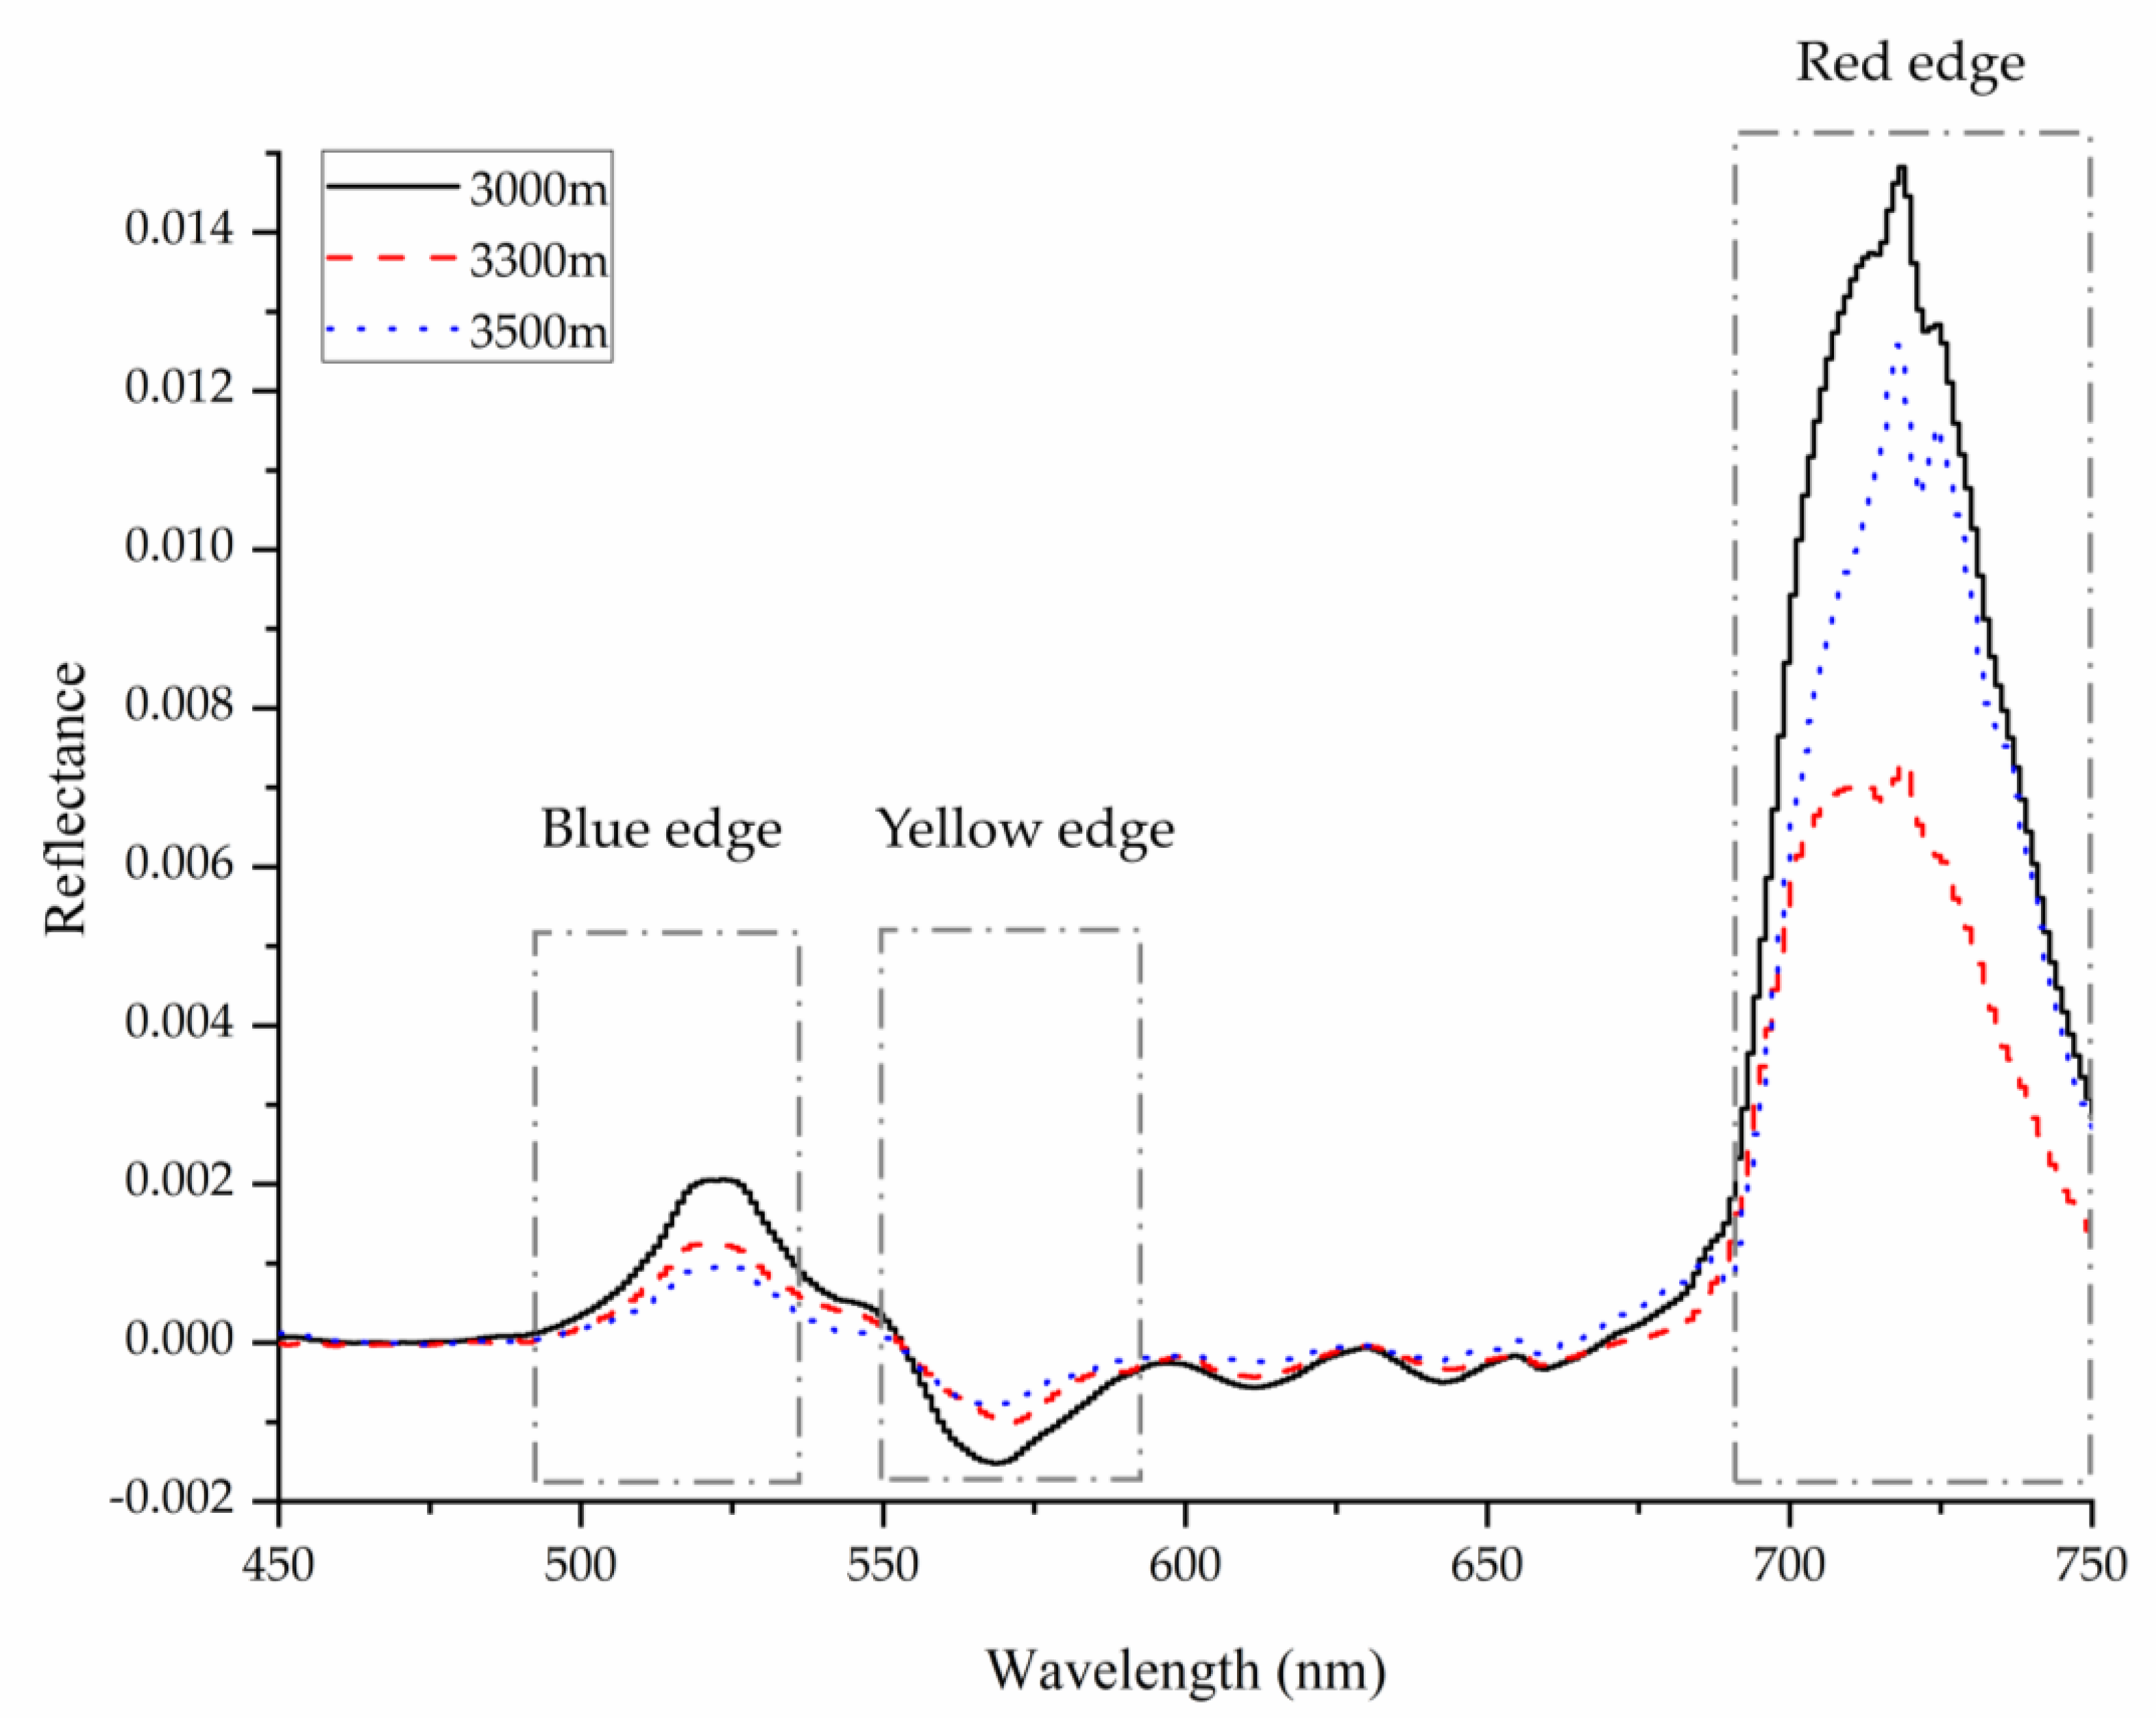
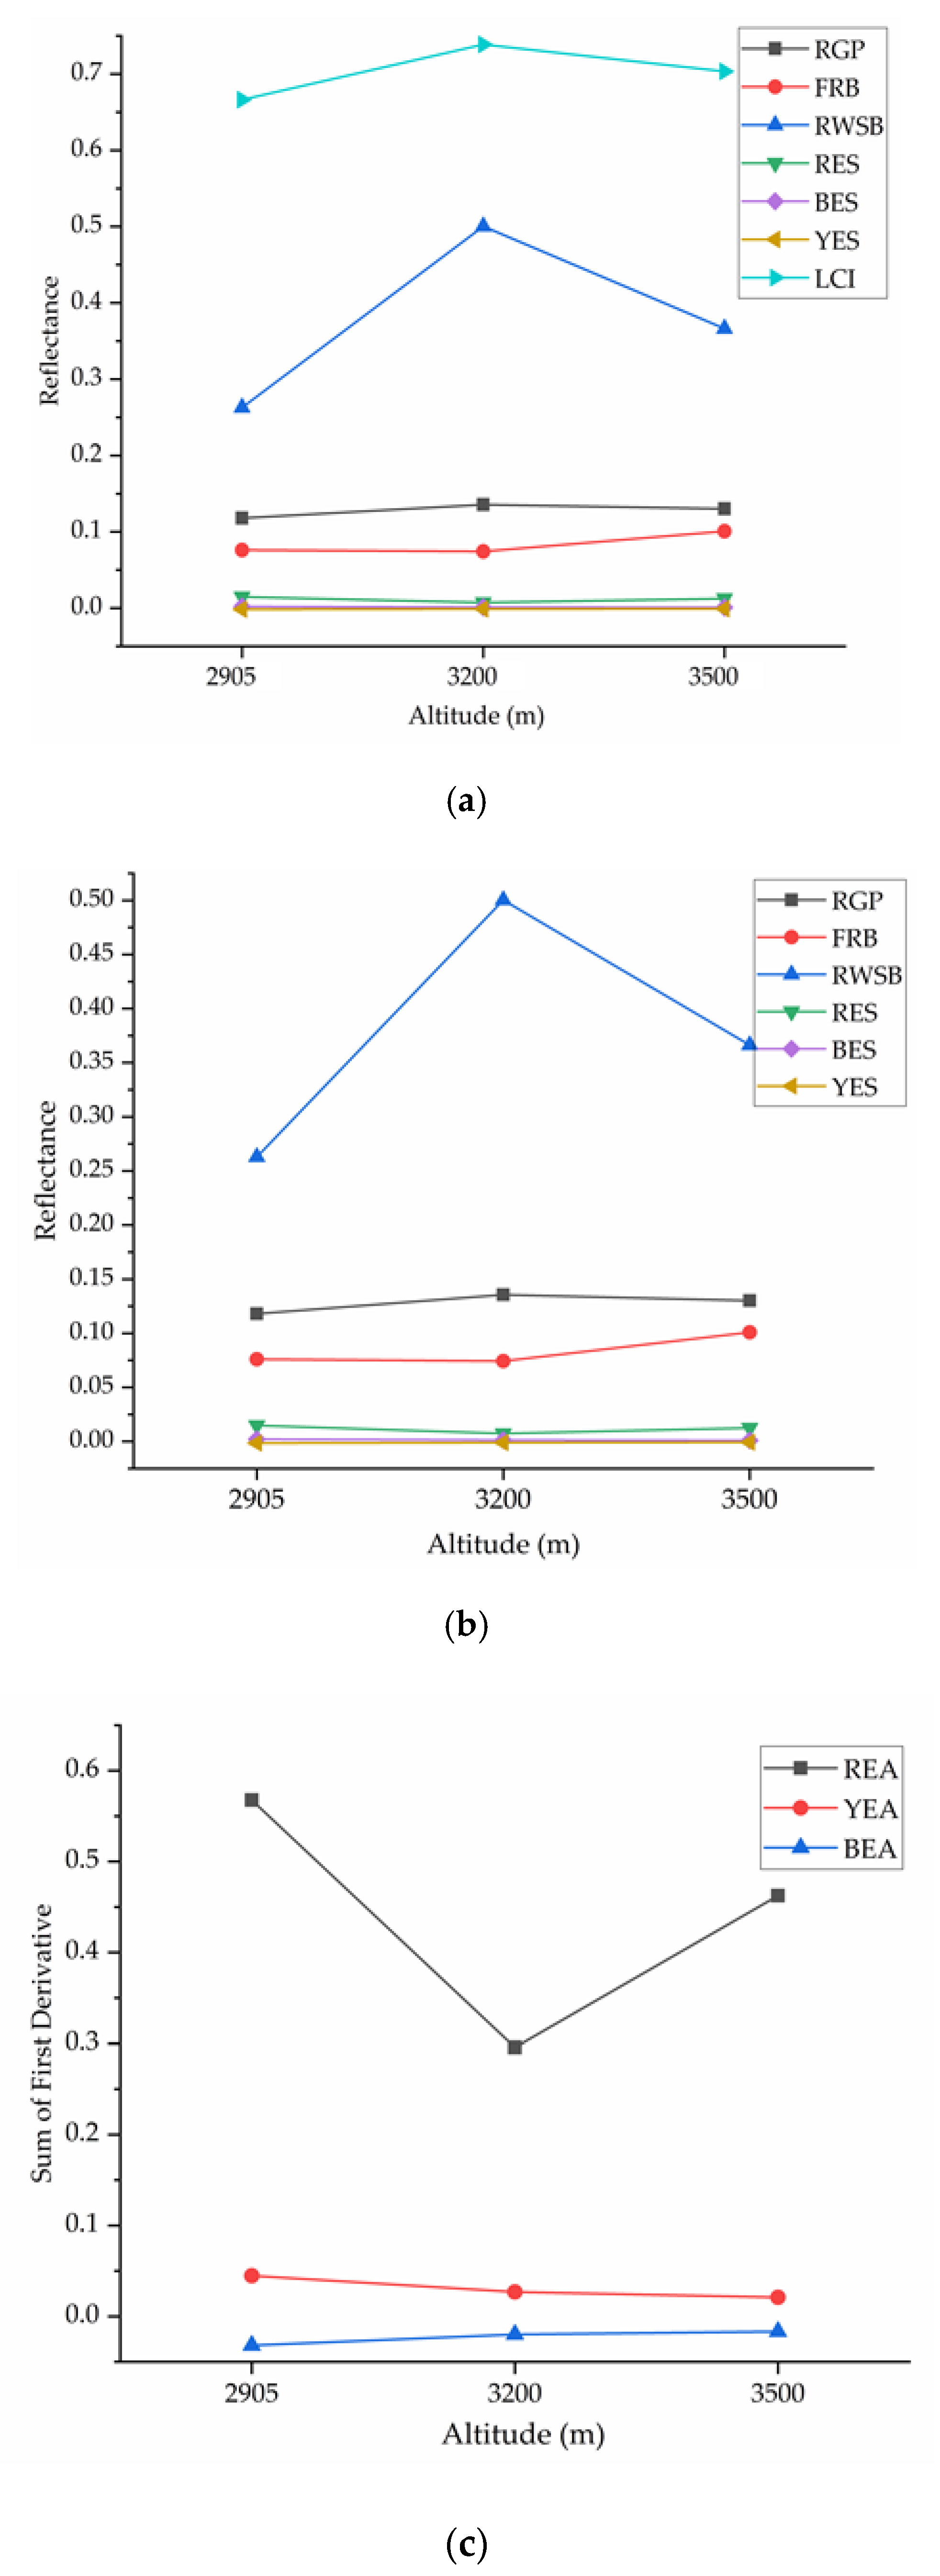
- The red edge position and red valley position of leaf surface spectral curve move towards short wave direction with the elevation. This showed that, with the increase in altitude, the effect on the position of red edge and red valley on leaf surface becomes more severe. However, the yellow edge position and the green peak position move to the long wave direction first, and then to the short wave direction with the elevation. With the increase of altitude, the red edge area first decreases and then increases, the yellow edge area decreases and the blue edge area increases.
- (5)
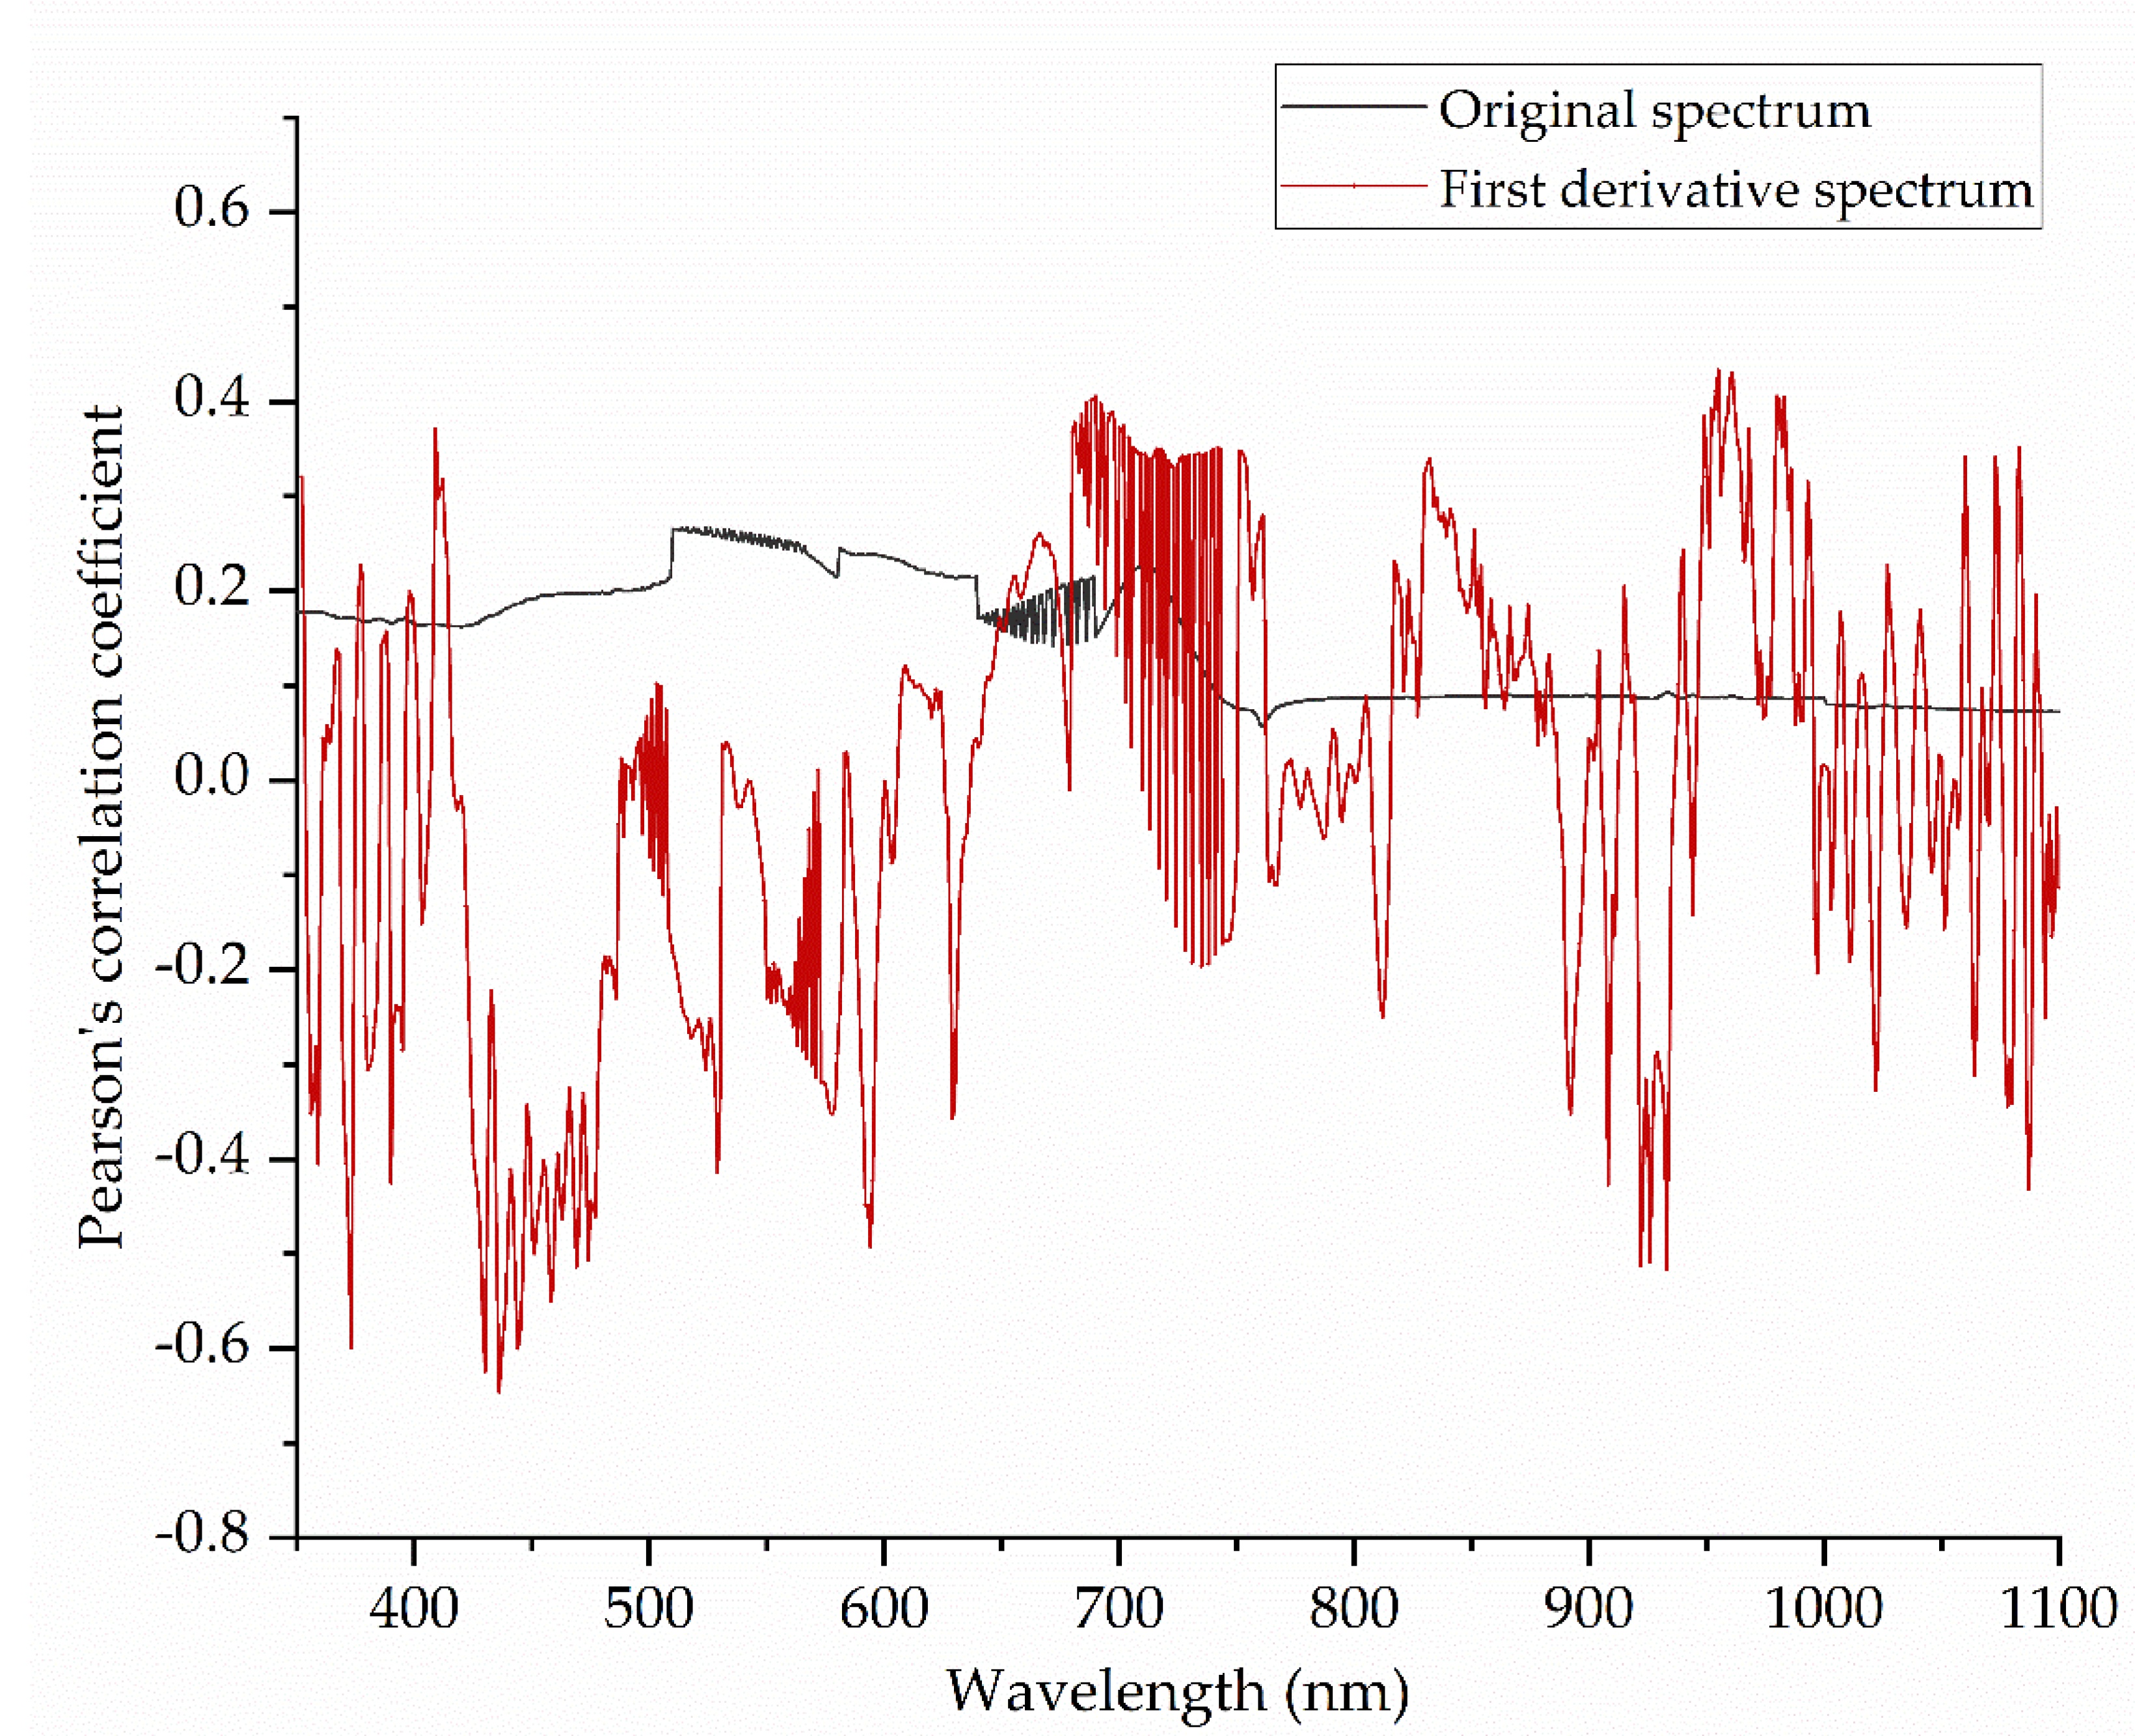
- The correlation curve between the original spectrum of Quercus aquifolioides leaves and chlorophyll relative content was the best between the wavelengths 509~650 nm, and the original spectrum hardly reflects the chlorophyll content information after 761 nm. The correlation between the first derivative spectrum and CCI value was the best and most stable at 450~500 nm, and the correlation in other spectral channels fluctuates greatly.
- (6)
- The correlation between red edge slope, blue edge slope, yellow edge slope, yellow edge position, green peak reflectance, water stress wave band reflectance, red edge area, yellow edge area and blue edge area and chlorophyll relative content value reached significant level. The correlation degree of green peak reflectance is the largest among all spectral parameters, which showed that green peak reflectance is most sensitive to the relative chlorophyll content of Quercus aquifolioides. The estimation model R2 of green peak reflectivity was the highest (y = 206.98e−10.85x, R2 = 0.8523), and the prediction accuracy was 95.85%.
Author Contributions
Funding
Acknowledgments
Conflicts of Interest
References
- Permana, H.H.; Widyastuti, Y.; Samanhudi, Y.A. Response of Artemisia annua L. to shade and manure fertilizer application in lowland altitude. Iop Conf. Ser. Earth Environ. Ence 2018, 142, 12–43. [Google Scholar]
- Ghafari, S.; Ghorbani, A.; Moameri, M.; Mostafazadeh, R.; Bidarlord, M. Composition and structure of species along altitude gradient in moghan-sabalan rangelands, iran. J. Mt. Sci. 2018, 15, 1209–1228. [Google Scholar] [CrossRef]
- Meinzer, F.C.; Rundel, G.H.G.W. Morphological changes along an altitude gradient and their consequences for an Andean Giant Rosette plant. Oecologia 1985, 65, 278–283. [Google Scholar] [CrossRef] [PubMed]
- Yin, C.; Duan, B.; Wang, X.; Li, C. Morphological and physiological responses of two contrasting poplar species to drought stress and exogenous abscisic acid application. Plant Sci. 2004, 167, 1091–1097. [Google Scholar] [CrossRef]
- Wang, J.R.; Hawkins, C.D.; Letchford, T. Relative growth rate and biomass allocation of paper birch (Betula papyrifera) populations under different soil moisture and nutrient regimes. Can. J. For. Res. 2011, 28, 44–55. [Google Scholar] [CrossRef]
- Takahashi, K. Effects of altitude and competition on growth and mortality of the coniferAbies sachalinensis. Ecol. Res. 2010, 25, 801–812. [Google Scholar] [CrossRef]
- Nikki, I.; Ushiyama, M.; Morita, I. Effects of the Altitude on the Growth and the Chemical Composition of Some Forage Crops. Jpn. J. Crop Sci. 1960, 28, 309–310. [Google Scholar] [CrossRef][Green Version]
- Wildi, B.; Lütz, C. Antioxidant composition of selected high alpine plant species from different altitudes. Plant Cell Environ. 1996, 19, 138–146. [Google Scholar] [CrossRef]
- Buchner, O.; Neuner, G. Variability of Heat Tolerance in Alpine Plant Species Measured at Different Altitudes. Arct. Antarct. Alp. Res. 2003, 35, 411–420. [Google Scholar] [CrossRef]
- Wang, Z.; Liu, H.; Wei, N.; Xu, W.; Liu, S. Effects of stand regeneration management regimes and age on genetic structure of Quercus aquifolioides (Sclerophyllous Oak) in southwestern china. For. Sci. 2009, 55, 142–148. [Google Scholar]
- Zhang, X.J.; Korpelainen, H.; Li, C.Y. Microsatellite Variation of Quercus aquifolioides Populations at Varying Altitudes in the Wolong Natural Reserve of China. Silva Fenn. 2006, 40, 407–415. [Google Scholar] [CrossRef]
- Panaiotis, C.; Carcaillet, C.; M’Hamedi, M. Determination of the natural mortality age of an holm oak (Quercus ilex L.) stand in Corsica (Mediterranean Island). Acta Oecologica 1997, 18, 519–530. [Google Scholar] [CrossRef]
- Panaiotis, C.; Loisel, R.; Roux, M. Analysis of vegetation response to naturally occurring gaps in old-growth forests of Quercus ilex L. in Corsica. Can. J. For. Res. 1998, 28, 1125–1134. [Google Scholar]
- Wang, X.F.; Lesi, M.C.; Zhang, M.M. Ecosystem pattern change and its influencing factors of “two barriers and three belts”. Chin. J. Ecol. 2019, 38, 2138–2148. [Google Scholar]
- Plieninger, T.; Pulido, F.J.; Schaich, H. Effects of land-use and landscape structure on holm oak recruitment and regeneration at farm level in Quercus ilex L. dehesas. J. Arid Environ. 2004, 57, 345–364. [Google Scholar] [CrossRef]
- Zhu, J.; Yu, Q.; Zhu, H.; He, W.; Xu, C.; Liao, J.; Zhu, Q.; Su, K. Response of dust particle pollution and construction of a leaf dust deposition prediction model based on leaf reflection spectrum characteristics. Environ. Sci. Pollut. 2019. [Google Scholar] [CrossRef]
- Liang, L.; Yang, M.; Zhang, L.; Lin, H.; Zhou, X. Chlorophyll content inversion with hyperspectral technology for wheat canopy based on support vector regression algorithm. Trans. Chin. Soc. Agric. Eng. 2012, 28, 162–171. [Google Scholar]
- Li, J.B.; Wang, F.J.; Ying, Y.B.; Rao, X.Q. Application of hyperspectral fluorescence image technology in detection of early rotten oranges. Spectrosc. Spectr. Anal. 2012, 32, 142–146. [Google Scholar]
- Zhu, J.; Yu, Q.; Liu, X.; Yu, Y.; Yao, J.; Su, K.; Niu, T.; Zhu, H.; Zhu, Q. Effect of leaf dust retention on spectral characteristics of Euonymus japonicus and its dust retention prediction. Spectrosc. Spectr. Anal. 2020, 40, 517–522. [Google Scholar]
- Gamon, J.A.; Surfus, J.S. Assessing leaf pigment content and activity with a reflectometer. New Phytol. 1999, 143, 105–117. [Google Scholar] [CrossRef]
- Richardson, A.D.; Berlyn, G.P. Spectral reflectance and photosynthetic properties of Betula papyrifera (Betulaceae) leaves along an elevational gradient on Mt. Mansfield, Vermont, USA. Am. J. Bot. 2002, 89, 88–94. [Google Scholar] [CrossRef] [PubMed]
- Madeira, A.C.; Mentions, A.; Ferreira, M.E.; De Lourdes Taborda, M. Relationship between spectroradiometric and chloropuyll measurements in green beans. Commun. Soil Sci. Plant Anal. 2000, 31, 631–643. [Google Scholar] [CrossRef]
- Poulos, H.M.; Goodale, U.M.; Berlyn, G.P. Drought response of two Mexican oak species, Quercus laceyi and Quercus sideroxyla (Fagaceae), in relation to elevational position. Am. J. Bot. 2007, 94, 809–818. [Google Scholar] [CrossRef] [PubMed]
- Jiang, Y.W.; Duncan, R.R.; Carrow, R.N. Assessment of low light tolerance of seashore paspalum and bermudagrass. Crop Sci. Soc. Am. 2004, 44, 587–594. [Google Scholar] [CrossRef]
- Stylinski, C.D.; Gamon, J.A.; Oechel, W.C. Seasonal patterns of reflectance indices, catotemoid pigments and photosynthesis of evergreen chaparral species. Ecophysiology 2002, 131, 366–374. [Google Scholar]
- Pietrzykowski, E.; Stone, C.; Pinkard, E.; Mohammed, C. Effects of My cosphaerella leaf disease on the spectral reflectance properties of juvenile Eucalyptus globulus foliage. For. Pathol. 2006, 36, 334–348. [Google Scholar] [CrossRef]
- Fuentes, D.A.; Gamon, J.A.; Cheng, Y.F.; Claudio, H.C.; Qiu, H.L.; Mao, Z.Y.; Sims, D.A.; Rahman, A.F.; Oechel, W.; Luo, H.Y. Mapping carbon and water vapor fluxes in a chaparral ecosystem using vegetation indices derived from AVIRIS. Remote Sens. Environ. 2006, 103, 312–323. [Google Scholar] [CrossRef]
- Garty, J.; Kloog, N.; Wolfson, R.; Cohen, Y.; Karnieli, A.; Avni, A. The influence of air pollution on the concentration of mineral elements, on the spectral reflectance response and on the production of stress-ethylene in the lichen Ramalina duriaei. New Phytol. 1997, 137, 587–597. [Google Scholar] [CrossRef]
- Richardson, A.D.; Berlyn, G.P.; Gregoire, T.G. Spectral reflectance of Picea rubens (Pinaceae) and Abies balsamea (Pinaceae) needles along an elevational gradient, Mt. Moosilauke, New Hampshire, USA. Am. J. Bot. 2001, 88, 667–676. [Google Scholar] [CrossRef]
- Richardson, A.D.; Duigan, S.P.; Berlyn, G.P. An evaluation of noninvasive methods to estimate foliar chlorophyll content. New Phytol. 2002, 153, 185–194. [Google Scholar] [CrossRef]
- Pike, C.S.; Norman, H.A.; Kemmerer, E.C.; Wessner, D.R.; Ellis, A.A. Effects of acclimation to low temperature and to water stress on photosynthesis and on physical and chemical properties of lipids from thylakoids of cucumber and cotton. Plant Sci. 1990, 68, 189–196. [Google Scholar] [CrossRef]
- Kofidis, G.; Bosabalidis, A.M.; Moustakas, M. Combined effects of altitude and season on leaf characteristics of Clinopodium vulgare L. (Labiatae). Environ. Exp. Bot. 2007, 60, 69–76. [Google Scholar] [CrossRef]
- Wu, C.Y.; Wang, X.F. Research of foliar dust content estimation by reflectance spectroscopy of Euonymus japonicus Thunb. Environ. Nanotechnol. Monit. Manag. 2016, 5, 54–61. [Google Scholar] [CrossRef][Green Version]
- Yan, X.; Shi, W.Z.; Zhao, W.J.; Luo, N. Mapping dust-fall distribution in urban areas using remote sensing and ground spectral data. Sci. Total Environ. 2015, 506, 604–612. [Google Scholar] [CrossRef]
- Manzo, C.; Salvini, R.; Guastaldi, E.; Nicolardi, V.; Protano, G. Reflectance spectral analyses for the assessment of environmental pollution in the geothermal site of mt. amiata (Italy). Atmos. Environ. 2013, 79, 650–665. [Google Scholar] [CrossRef]
- Sridhar, B.B.M.; Han, F.X.; Diehl, S.V.; Monts, D.L.; Su, Y. Spectral reflectance and leaf internal structure changes of barley plants due to phytoextraction of zinc and cadmium. Int. J. Remote Sens. 2007, 28, 1041–1054. [Google Scholar] [CrossRef]
- Mahlein, A.K.; Steiner, U.; Christian, H.; Dehne, H.W.; Oerke, E.C. Hyperspectral imaging for small-scale analysis of symptoms caused by different sugar beet diseases. Plant Methods 2012, 8, 3. [Google Scholar] [CrossRef]
- Gong, Z.N.; Zhao, Y.L.; Zhao, W.J.; Lin, C.; Cui, T.X. Estimation model for plant leaf chlorophyll content based on the spectral index content. Acta Ecol. Sin. 2014, 34, 5736–5745. [Google Scholar]
- Daniel, A.S.; Gamon, J.A. Estimation of vegetation water content and photosynthetic tissue area from spectral reflectance: A comparison of indices based on liquid water and chlorophyll absorption features. Remote Sens. Environ. 2003, 84, 526–537. [Google Scholar]
- Zarco-Tejada, P.J.; Rueda, C.A.; Ustin, S.L. Water content estimation in vegetation with MODIS reflectance data and model inversion methods. Remote Sens. Environ. 2003, 85, 109–124. [Google Scholar] [CrossRef]
- Singh, S.K.; Hoyos-Villegas, V.; Ray, J.D.; Smith, J.R.; Fritschi, F.B. Quantification of leaf pigments in soybean (Glycine max (L.) merr.) based on wavelet decomposition of hyperspectral features. Field Crop. Res. 2013, 149, 20–32. [Google Scholar] [CrossRef]
- Verrelst, J.; Schaepman, M.E.; Malenovs’y, Z.; Clevers, J.G.P.W. Effects of woody elements on simulated canopy reflectance: Implications for forest chlorophyll content retrieval. Remote Sens. Environ. 2010, 114, 647–656. [Google Scholar] [CrossRef]
- Wu, D.; Huang, L.X.; He, Y.; Pan, J.Z.; Zhang, B. Visible- near infrared reflection spectroscopy for crop- weed discrimination. Acta Opt. Sin. 2008, 28, 1618–1622. [Google Scholar]
- Song, K.S.; Zhang, B.; Wang, Z.M.; Liu, H.J.; Duan, H.T. Inverse model for estimating soybean chlorophyll concentration using in-situ collected canopy hyperspectral data. Trans. Chin. Soc. Agric. Eng. 2006, 22, 16–21. [Google Scholar]
- Yi, Q.X.; Huang, J.F.; Wang, X.Z.; Qian, L. Hyperspectral remote sensing estimation models for chlorophyll concentration in corn. Bull. Sci. Technol. 2007, 23, 83–87. [Google Scholar]
- Tang, Y.L.; Wang, R.C.; Huang, J.F.; Kong, W.S.; Cheng, Q. Hyperspectral data and their relationships correlativee to the pigment contents for rice under different nitrogen support level. J. Remote Sens. 2004, 8, 185–192. [Google Scholar]
- Yang, J.; Tian, Y.C.; Yao, X.; Cao, W.X.; Zhang, Y.S.; Zhu, Y. Hyperspectral estimation model for chlorophyll concentrations in top leaves of rice. Acta Ecol. Sin. 2009, 29, 6561–6571. [Google Scholar]
- Kakani, V.; Reddy, K.; Zhao, D.; Gao, W. Senescence and hyperspectral reflectance of cotton leaves exposed to ultraviolet-b radiation and carbon dioxide. Physiol. Plantarum 2004, 121, 250–257. [Google Scholar] [CrossRef]


| Spectral Parameters | Definition |
|---|---|
| Red edge position, REP | The wavelength position corresponding to RES |
| Red edge slope, RES | The largest first-order derivative value in the red edge (680~750 nm) |
| Blue edge position, BEP | The wavelength position corresponding to BES |
| Blue edge slope, BES | The largest first-order derivative value in the blue edge (490~530 nm) |
| Yellow edge position, YEP | The wavelength position corresponding to YES |
| Yellow edge slope, YES | The largest first-order derivative value in the yellow edge (560~640 nm) |
| Red valley position, RVP | The wavelength position corresponding to RRV |
| Reflectance of red valley, RRV | Minimum reflectance in the wavelength range of 640~700 nm |
| Green peak position, GPP | The wavelength position corresponding to RGP |
| Reflectance of green peak, RGP | Maximum reflectance in the wavelength range of 510~580 nm |
| Reflectance of water stress band, RWSB | Maximum reflectivity in the wavelength range of 1550~1750 nm |
| Red edge area, REA | Sum of first derivative in red edge (680~750 nm) |
| Yellow edge area, YEA | Sum of first derivative in yellow edge (490~530 nm) |
| Blue edge area, BEA | Sum of first derivative in blue edge (560~640 nm) |
| Leaf chlorophyll index, LCI | (R850-R710)/(R850-R680) |
| Spectral Parameter | Correlation Coefficient |
|---|---|
| REP | 0.162 |
| RES | −0.292 * |
| BEP | −0.031 |
| BES | −0.484 ** |
| YEP | −0.098 |
| YES | −0.270 * |
| YEP | −0.421 * |
| RGP | −0.892 ** |
| GPP | −0.023 |
| RWSB | −0.623 ** |
| REA | −0.318 * |
| BEA | 0.461 * |
| YEA | −0.264 * |
| LCI | −0.335 * |
| Spectral Parameter | Regression Model | Decisive Coefficient |
|---|---|---|
| RES | y = 75.5e−37.56x | R2 = 0.0908 |
| y = −2107.9x + 76.099 | R2 = 0.0852 | |
| y = 639,164x2 – 15,453x + 140.95 | R2 = 0.1403 | |
| BES | y = 23.476e−891x | R2 = 0.2892 |
| y = −46,608x + 13.537 | R2 = 0.2357 | |
| y = −5E+06x2 – 55,192x + 10.031 | R2 = 0.2359 | |
| YES | y = 87.435e−319.2x | R2 = 0.0634 |
| y = −19,288x + 86.605 | R2 = 0.0690 | |
| y = –6E+06x2 + 1654.4x + 69.045 | R2 = 0.0701 | |
| YEP | y = 1E + 06e−0.019x | R2 = 0.0147 |
| y = −0.9134x + 530.86 | R2 = 0.0097 | |
| y = −0.0474x2 + 48.545x – 12,373 | R2 = 0.0097 | |
| RGP | y = 220.99e−11.36x | R2 = 0.8523 |
| y = −563.33x + 128.09 | R2 = 0.7368 | |
| y = 3124.9x2 − 1411.9x + 181.94 | R2 = 0.7840 | |
| RWSB | y = 92.18e−1.88x | R2 = 0.4570 |
| y = −100.42x + 85.736 | R2 = 0.3885 | |
| y = 172.71x2 − 220.49x + 103.77 | R2 = 0.4046 | |
| REA | y = 80.529e−1.114x | R2 = 0.1094 |
| y = −62x + 79.517 | R2 = 0.1009 | |
| y = 420.51x2 − 403.98x + 144.75 | R2 = 0.1412 | |
| YEA | y = 107.49e19.595x | R2 = 0.2037 |
| y = 1160.1x + 98.23 | R2 = 0.2129 | |
| y = 72,497x2 + 6679.1x + 198.72 | R2 = 0.2811 | |
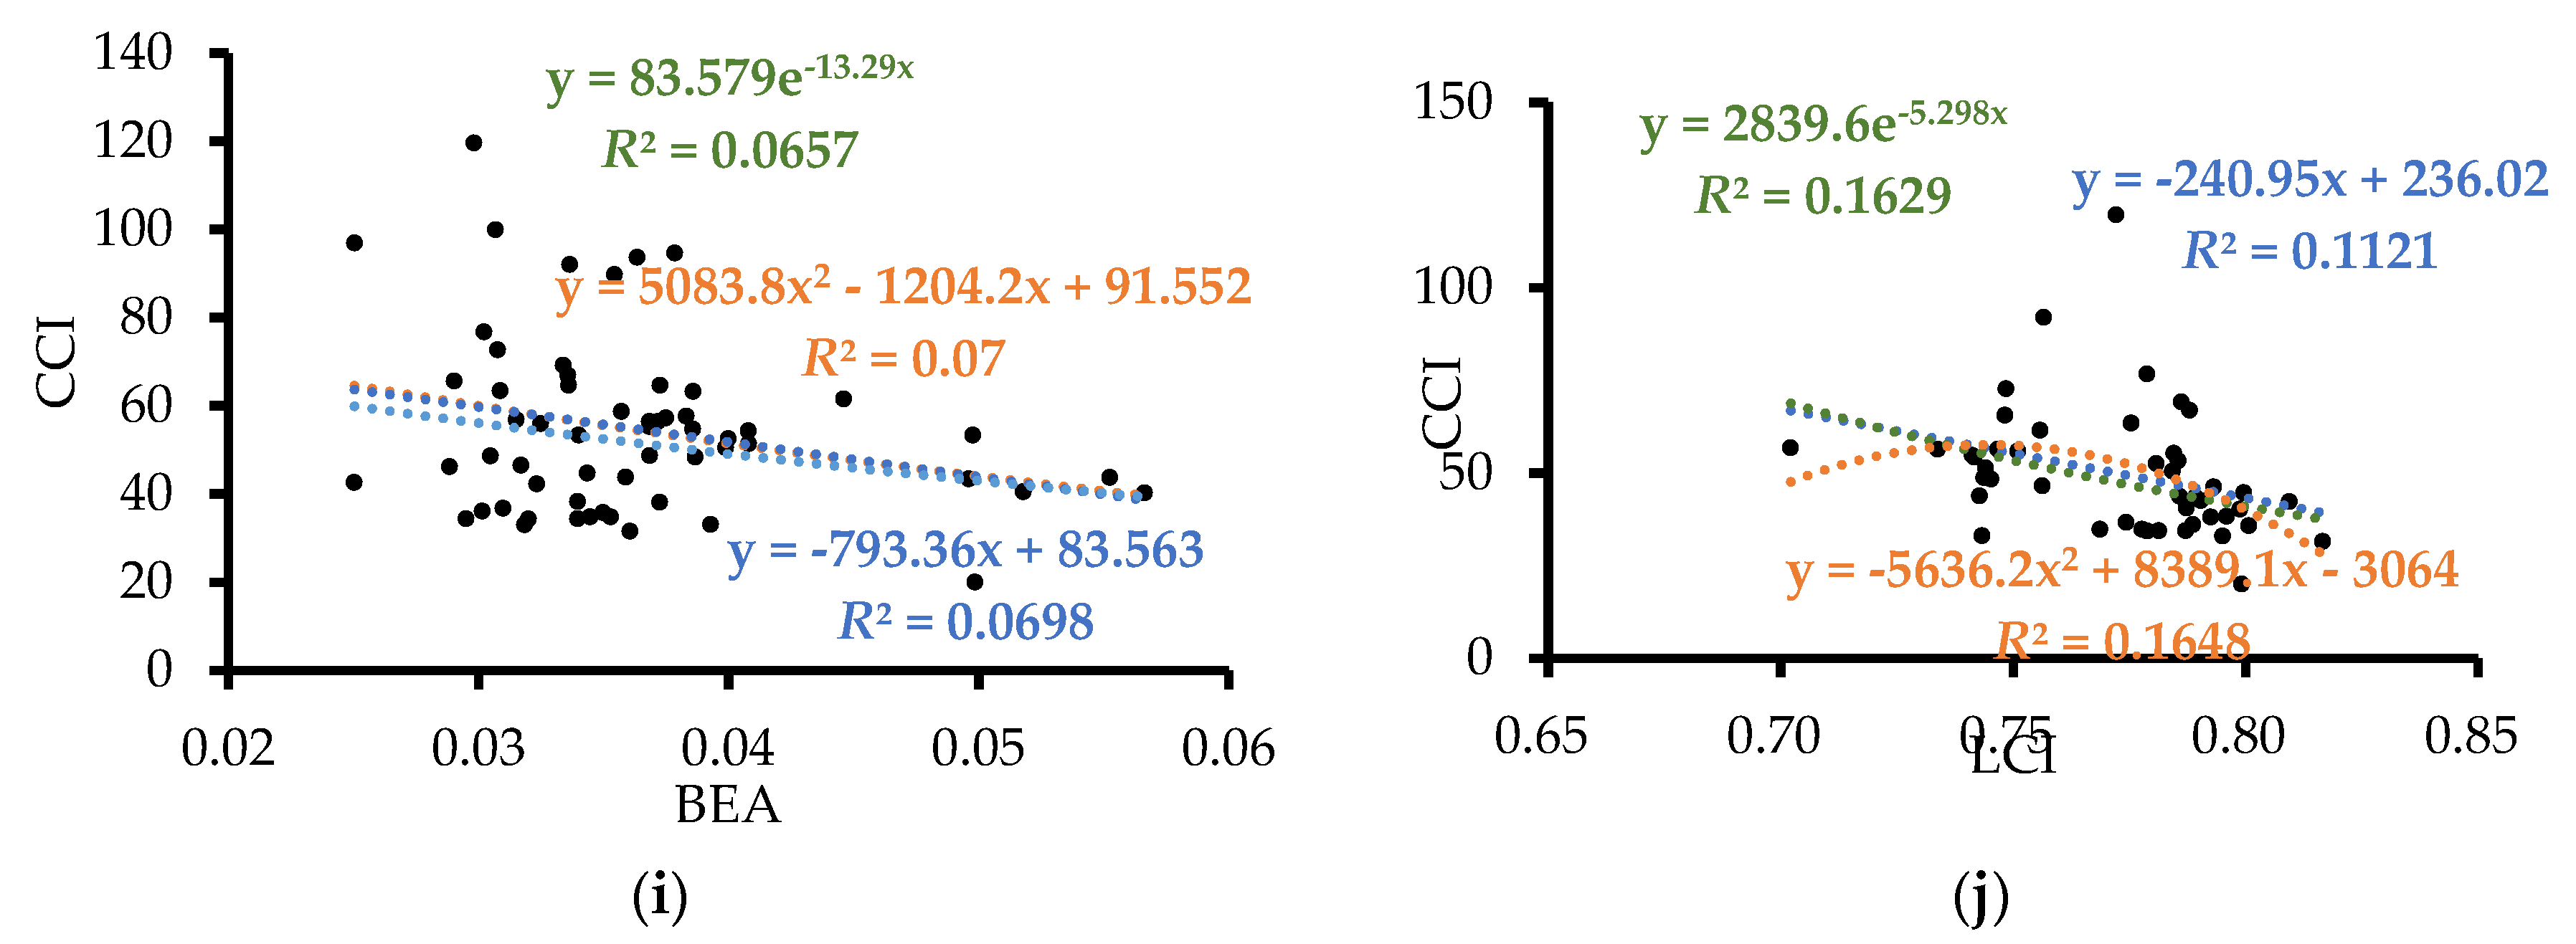
| BEA | y = 83.579e−13.29x | R2 = 0.0657 |
| y = −793.36x + 83.563 | R2 = 0.0698 | |
| y = 5083.8x2 − 1204.2x + 91.552 | R2 = 0.0700 | |
| LCI | y = 2839.6e−5.298x | R2 = 0.1629 |
| y = −240.95x + 236.02 | R2 = 0.1121 | |
| y = −5636.2x2 + 8389.1x−3064 | R2 = 0.1648 |
| Regression Equation | R2 (Determination Coefficient) | RMSE (Root Mean Square Error) | MRE% (Min Relative Entropy) | RE% (Relative Error) |
|---|---|---|---|---|
| y = 0.7812x + 9.1464 | 0.8024 | 3.0512 | 9.1721 | 6.13 |
© 2020 by the authors. Licensee MDPI, Basel, Switzerland. This article is an open access article distributed under the terms and conditions of the Creative Commons Attribution (CC BY) license (http://creativecommons.org/licenses/by/4.0/).
Share and Cite
Zhu, J.; He, W.; Yao, J.; Yu, Q.; Xu, C.; Huang, H.; Mhae B. Jandug, C. Spectral Reflectance Characteristics and Chlorophyll Content Estimation Model of Quercus aquifolioides Leaves at Different Altitudes in Sejila Mountain. Appl. Sci. 2020, 10, 3636. https://doi.org/10.3390/app10103636
Zhu J, He W, Yao J, Yu Q, Xu C, Huang H, Mhae B. Jandug C. Spectral Reflectance Characteristics and Chlorophyll Content Estimation Model of Quercus aquifolioides Leaves at Different Altitudes in Sejila Mountain. Applied Sciences. 2020; 10(10):3636. https://doi.org/10.3390/app10103636
Chicago/Turabian StyleZhu, Jiyou, Weijun He, Jiangming Yao, Qiang Yu, Chengyang Xu, Huaguo Huang, and Catherine Mhae B. Jandug. 2020. "Spectral Reflectance Characteristics and Chlorophyll Content Estimation Model of Quercus aquifolioides Leaves at Different Altitudes in Sejila Mountain" Applied Sciences 10, no. 10: 3636. https://doi.org/10.3390/app10103636
APA StyleZhu, J., He, W., Yao, J., Yu, Q., Xu, C., Huang, H., & Mhae B. Jandug, C. (2020). Spectral Reflectance Characteristics and Chlorophyll Content Estimation Model of Quercus aquifolioides Leaves at Different Altitudes in Sejila Mountain. Applied Sciences, 10(10), 3636. https://doi.org/10.3390/app10103636


