Critical Examination of the Parametric Approaches to Analysis of the Non-Verbal Human Behavior: A Case Study in Facial Pre-Touch Interaction

 ,
, 

Abstract
1. Introduction
2. Materials and Methods
2.1. Participants
- “female” touchers and “female” evaluators
- “female” touchers and “male” evaluators
- “male” touchers and “female” evaluators
- “male” touchers and “male” evaluators
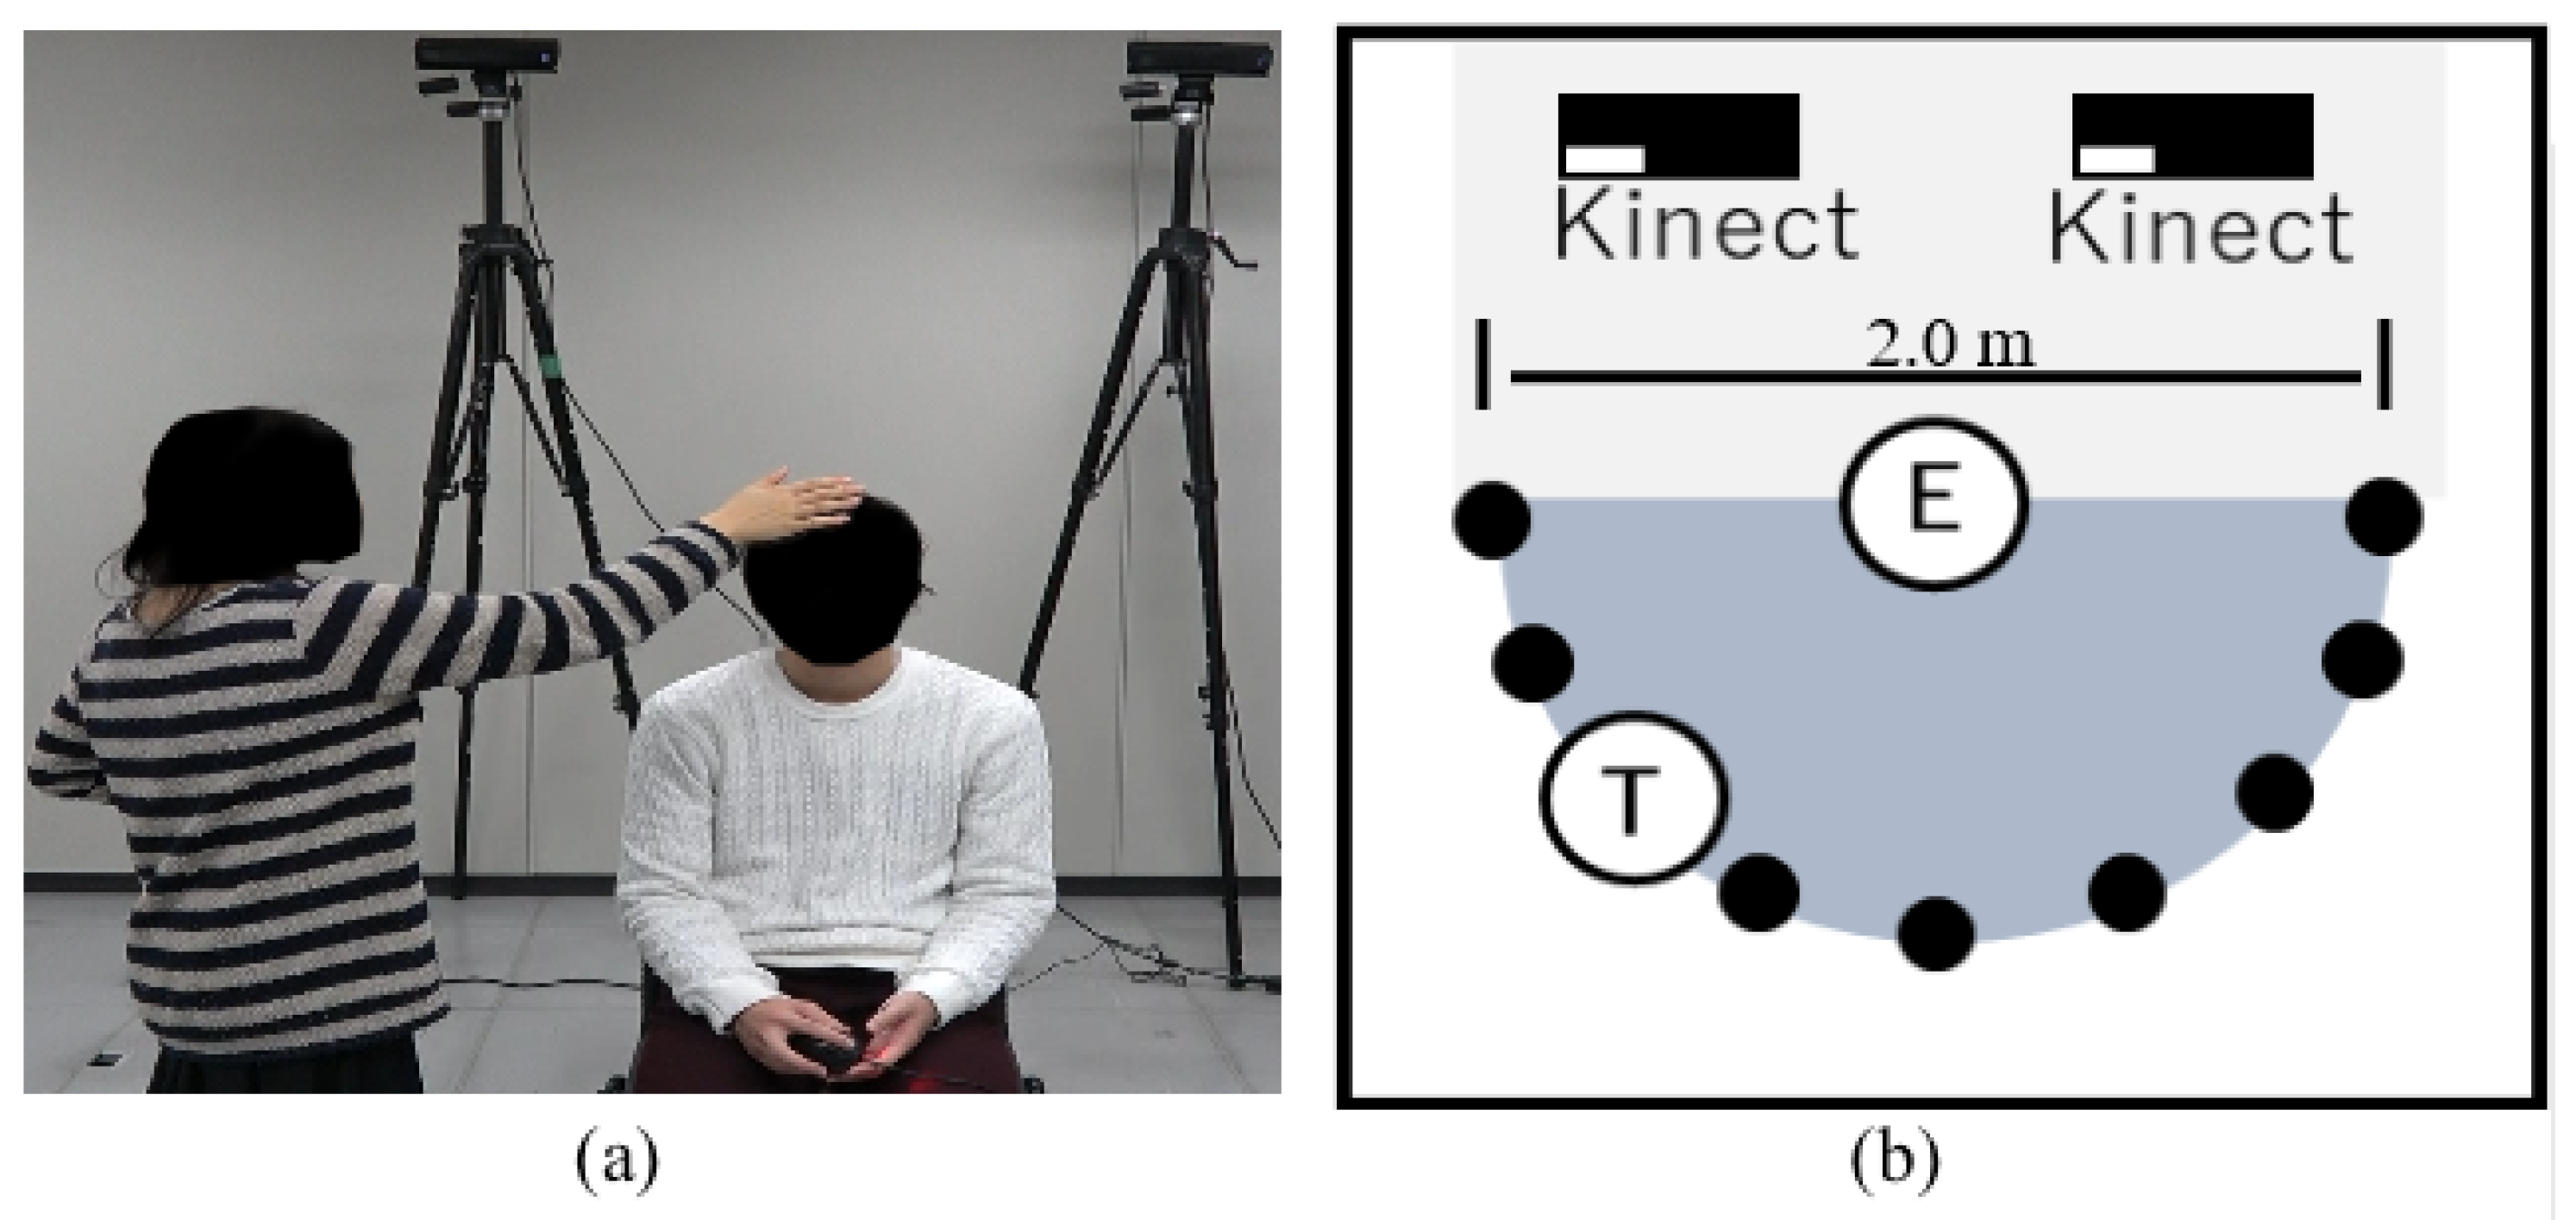
2.2. Paradigm
2.3. Data Acquisition
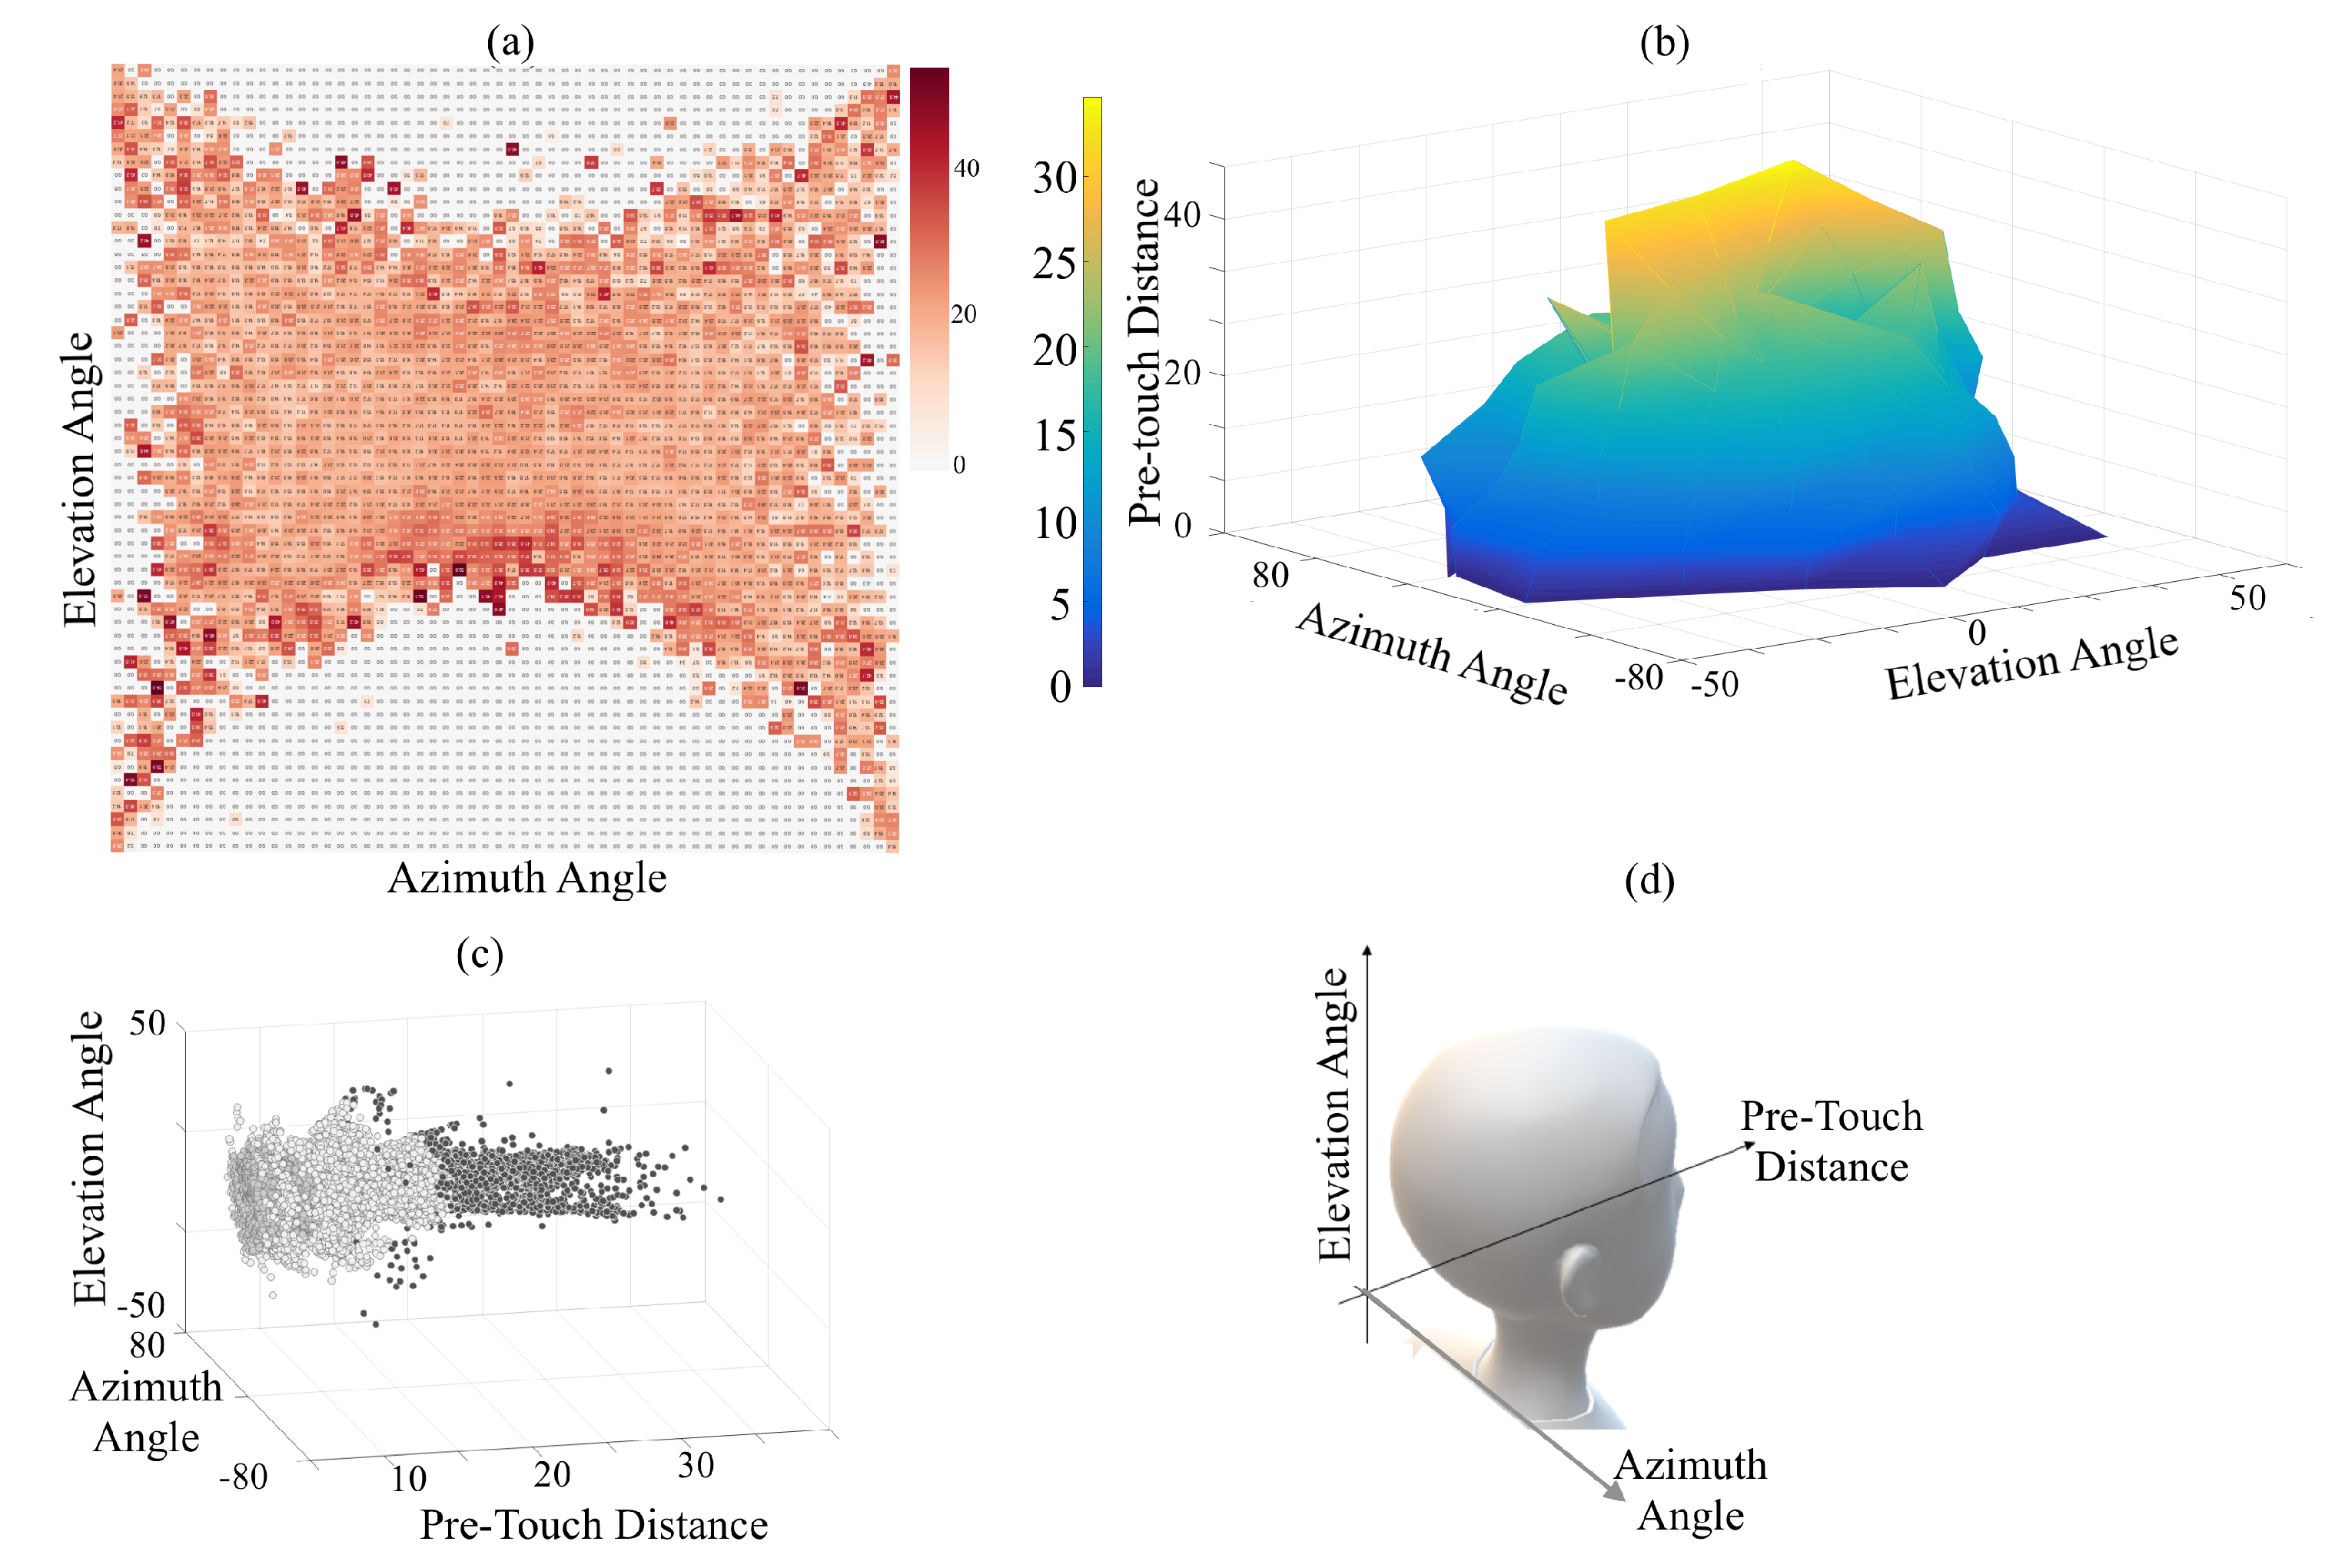
2.4. Analysis
2.5. Ethics Statement
3. Results
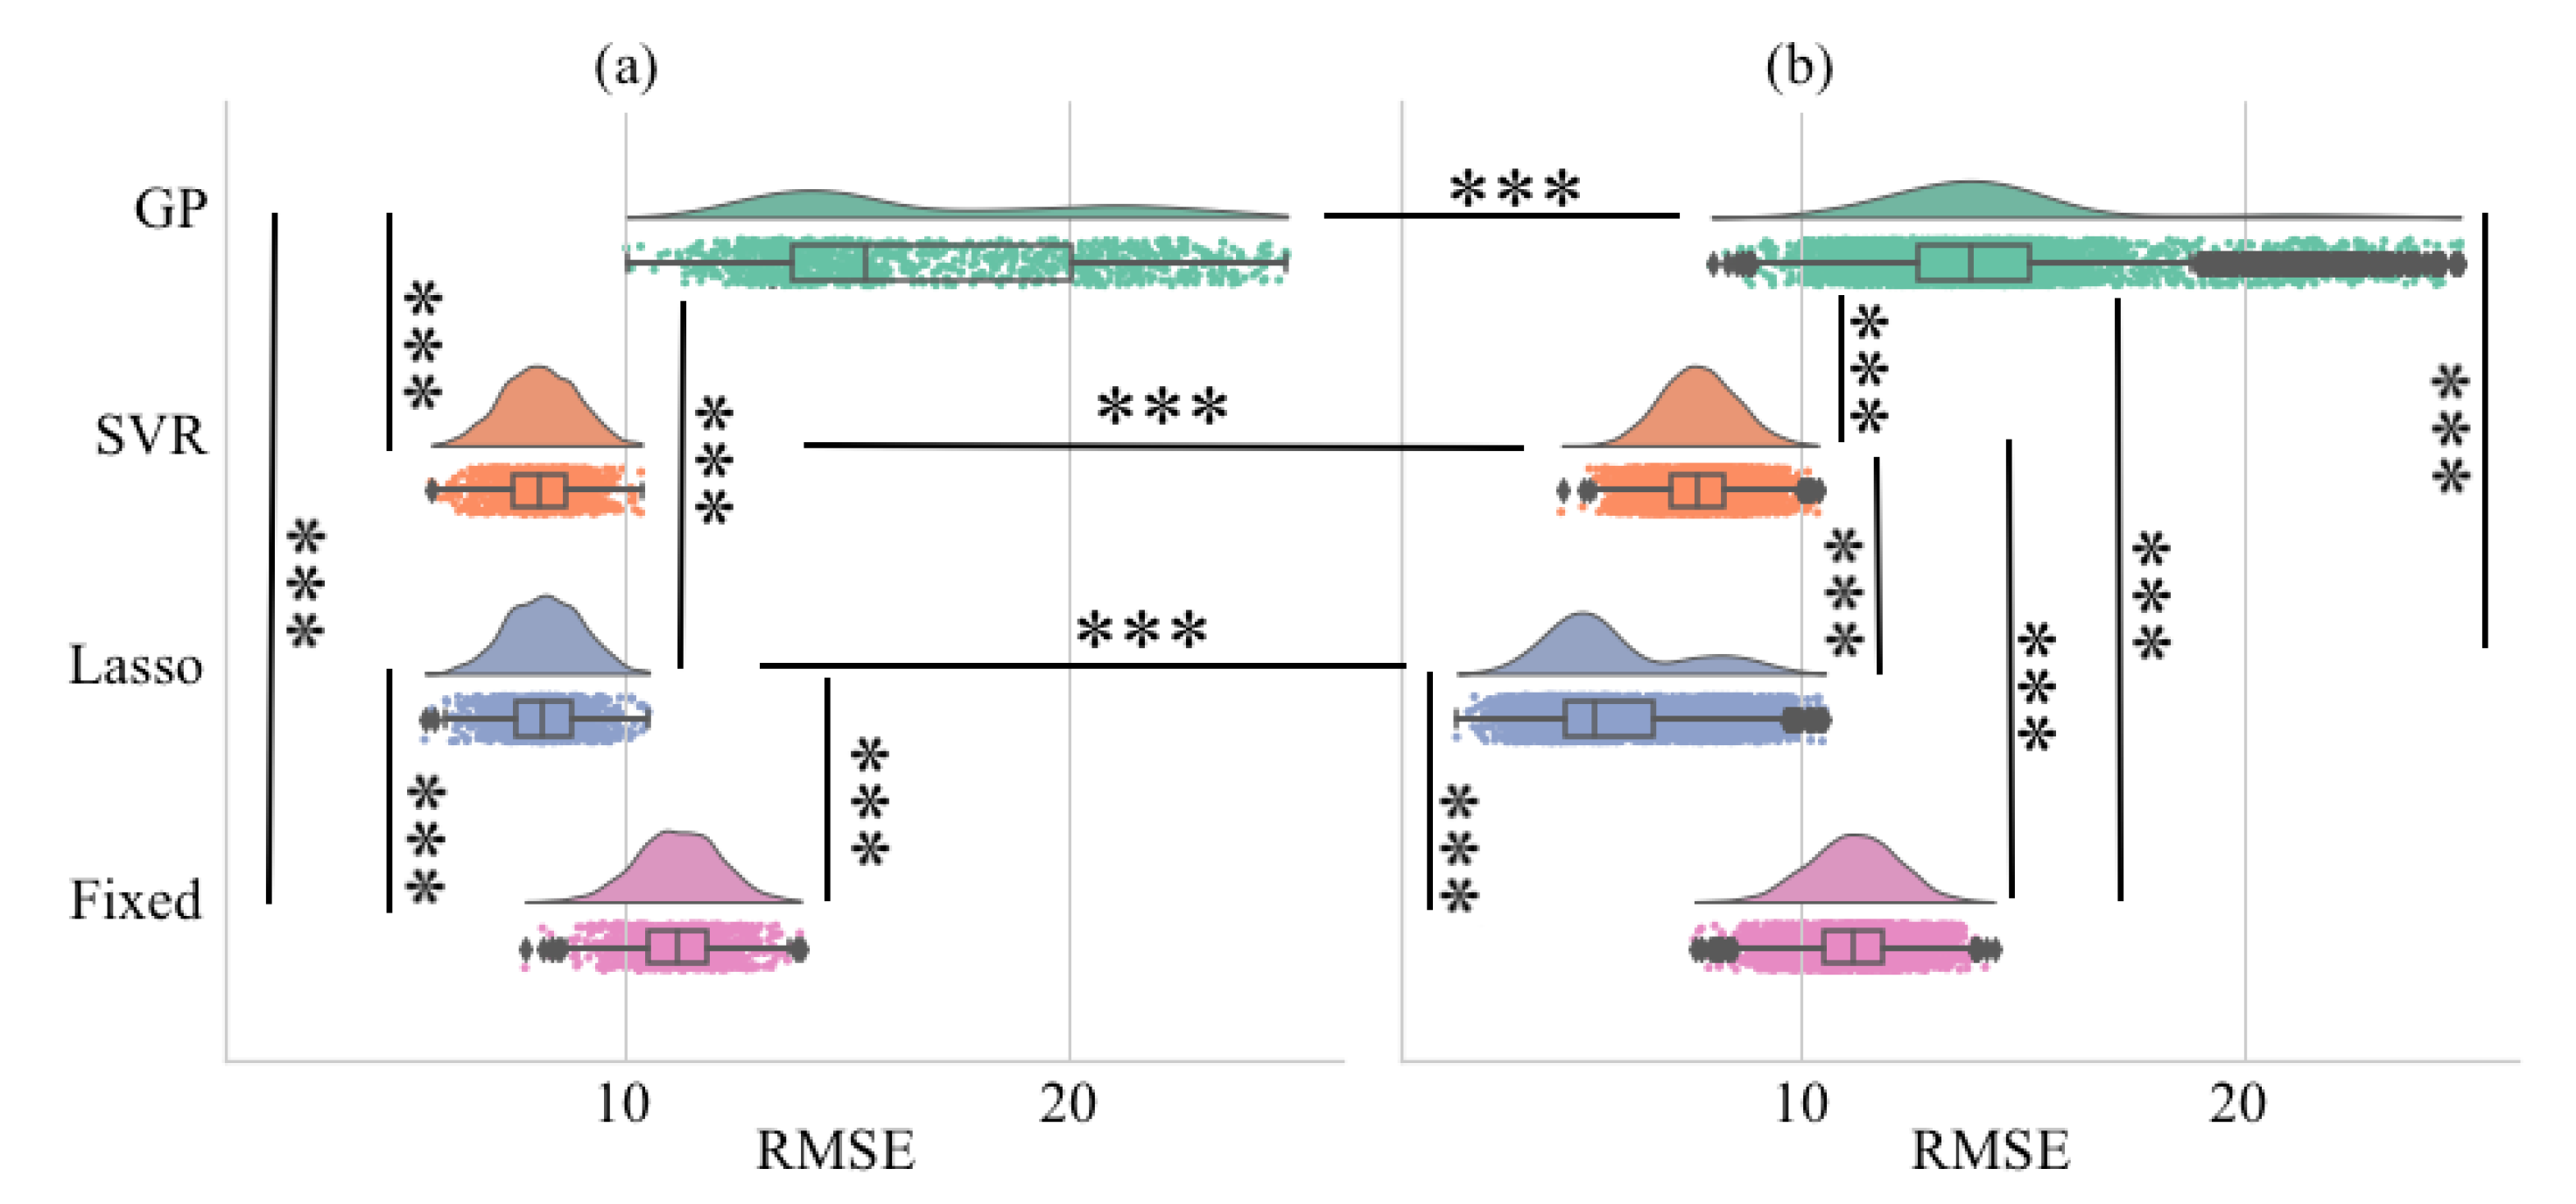
3.1. Rmse
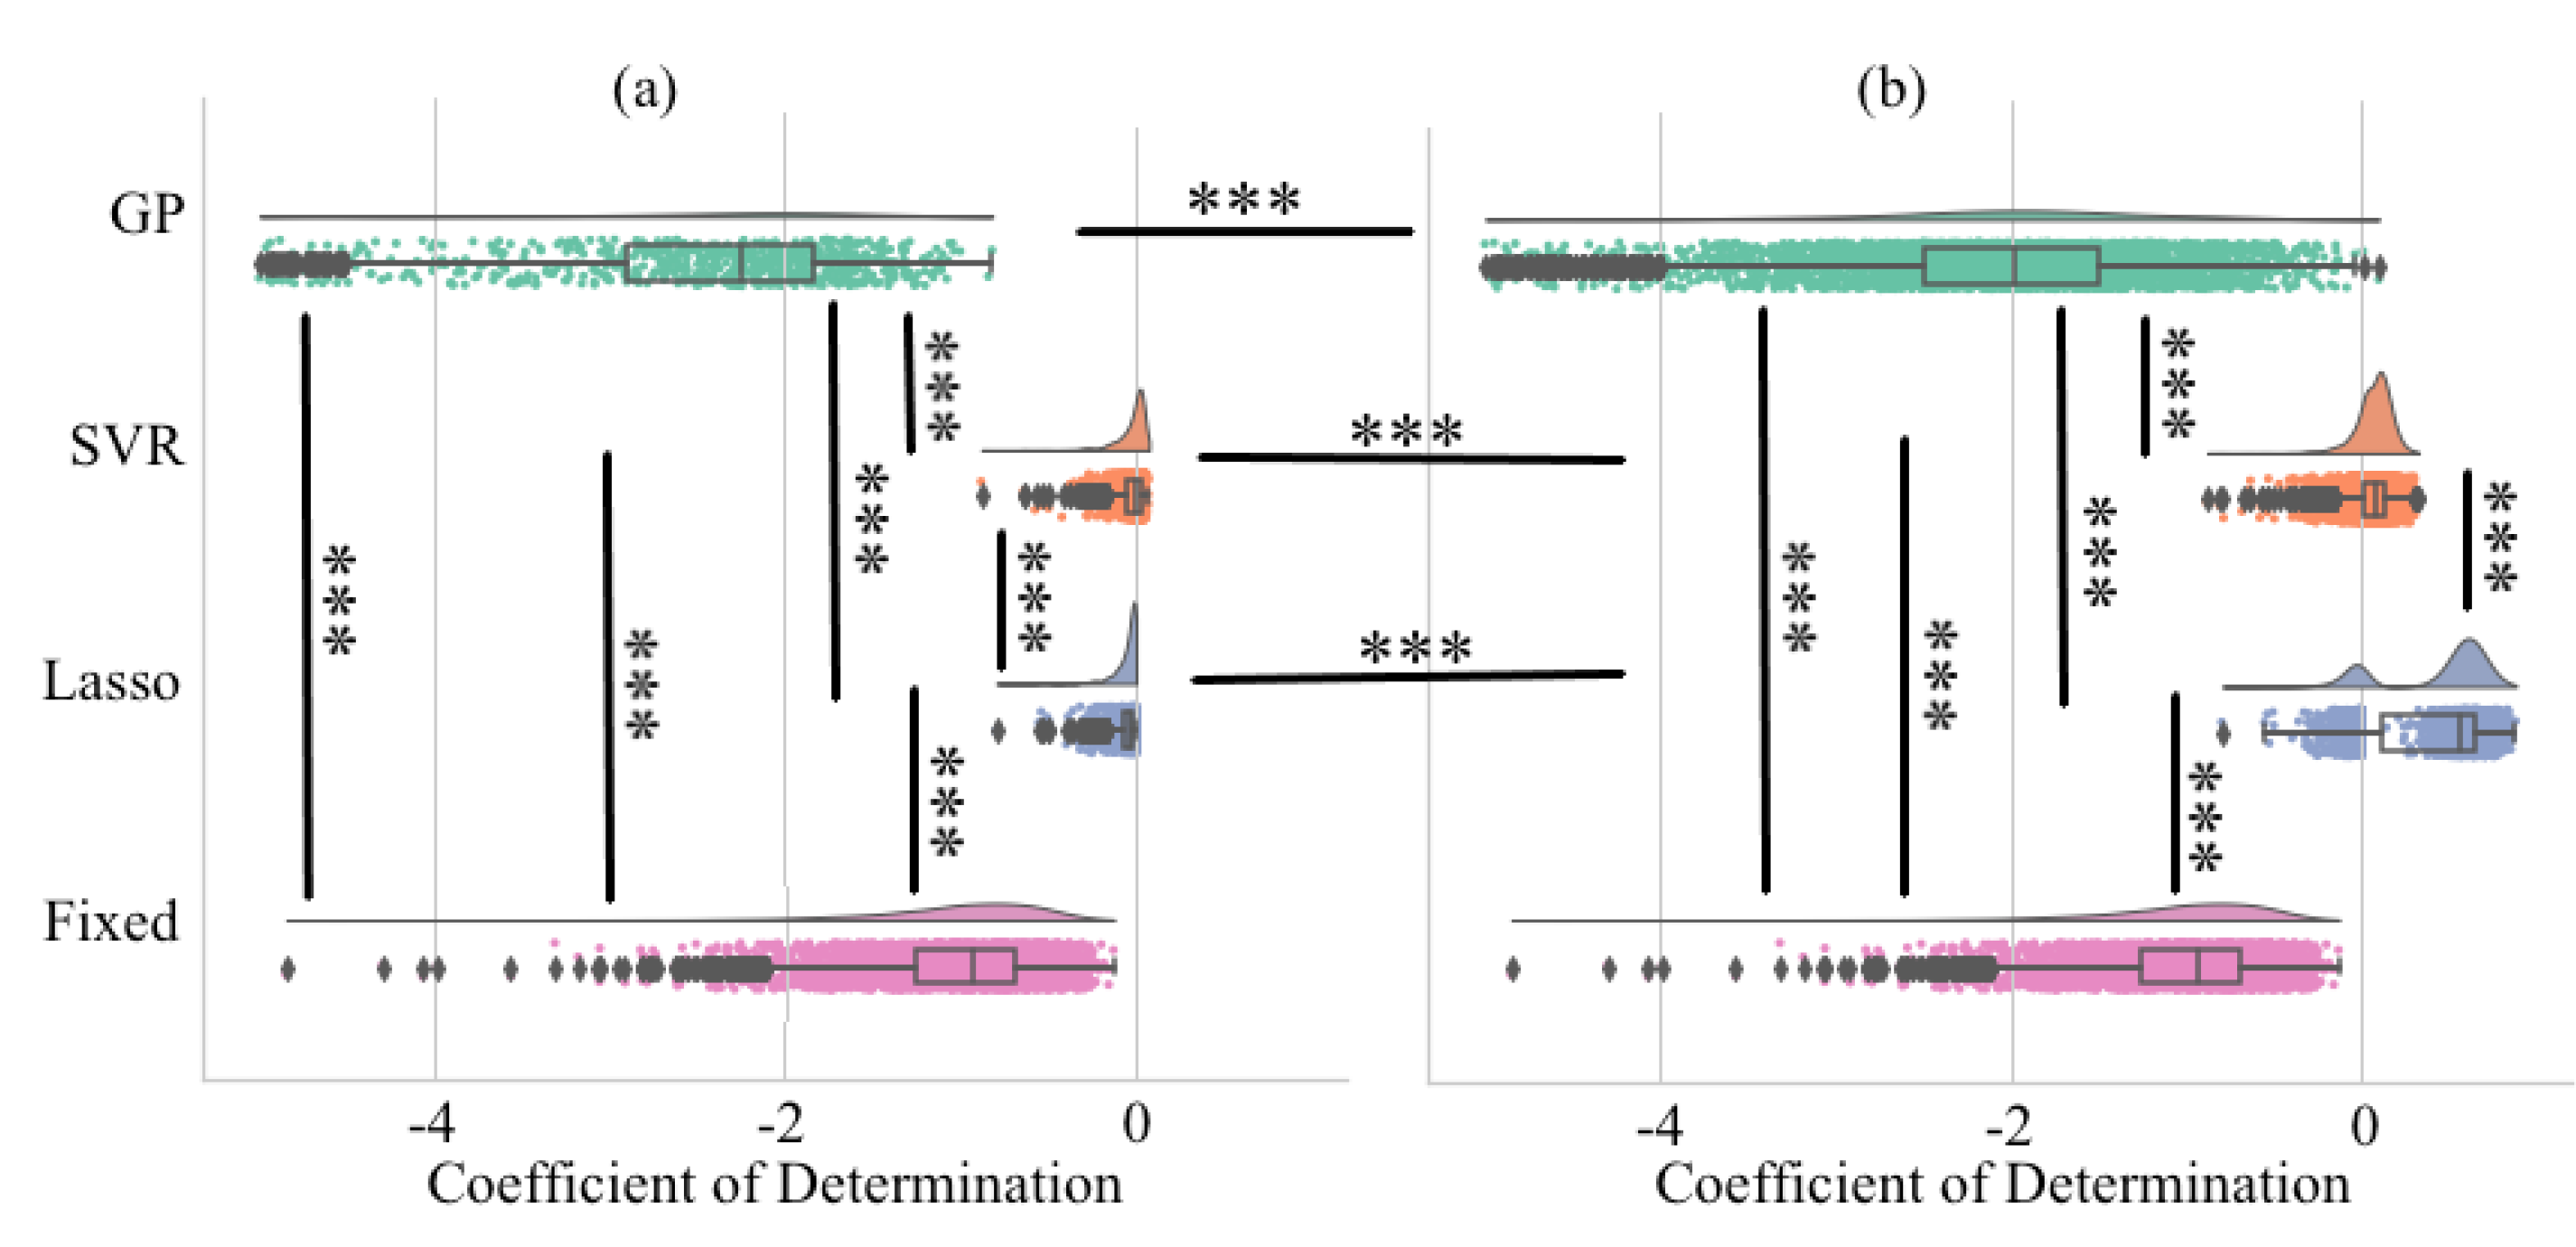
3.2. Coefficient of Determination
3.3. Investigation of the Training Process
4. Discussion
5. Limitations and Future Direction
Author Contributions
Funding
Conflicts of Interest
References
- Nummenmaa, L.; Glerean, E.; Hari, R.; Hietanen, J.L. Bodily maps of emotions. Proc. Natl. Acad. Sci. USA 2014, 111, 646–651. [Google Scholar] [CrossRef] [PubMed]
- Gerlach, M.; Farb, B.; Revelle, W.; Amaral, L.A.N. A robust data-driven approach identifies four personality types across four large data sets. Nat. Hum. Behav. 2018, 2, 735–742. [Google Scholar] [CrossRef] [PubMed]
- Goldberg, L.R. An Alternative “Description of Personality”: The Big-Five Factor Structure. J. Personal. Soc. Psychol. 1990, 59, 1216–1229. [Google Scholar] [CrossRef]
- Saarimäki, H.; Gotsopoulos, A.; Jääskeläinen, I.P.; Lampinen, J.; Vuilleumier, P.; Hari, R.; Sams, M.; Nummenmaa, L. Discrete neural signatures of basic emotions. Cereb. Cortex 2015, 26, 2563–2573. [Google Scholar] [CrossRef]
- Liu, W.; Kohn, N.; Fernández, G. Intersubject similarity of personality is associated with intersubject similarity of brain connectivity patterns. NeuroImage 2019, 186, 56–69. [Google Scholar] [CrossRef]
- Hu, Y.; Hu, Y.; Li, X.; Pan, Y.; Cheng, X. Brain-to-brain synchronization across two persons predicts mutual prosociality. Soc. Cogn. Affect. Neurosci. 2017, 12, 1835–1844. [Google Scholar] [CrossRef]
- Xin, Y.; Wu, J.; Yao, Z.; Guan, Q.; Aleman, A.; Luo, Y. The relationship between personality and the response to acute psychological stress. Sci. Rep. 2017, 7, 16906. [Google Scholar] [CrossRef]
- Ickinger, W.J.; Morris, S. Psychological Characteristics and Interpersonal Distance; Tulane University: New Orleans, LA, USA, 2001. [Google Scholar]
- Sommer, R. Personal Space: The Behavioral Basis of Design; Prentice-Hall, Inc.: Englewood Cliffs, NJ, USA, 1969. [Google Scholar]
- Hall, E.T. The Silent Language; Anchor Books: New York, NY, USA, 1959. [Google Scholar]
- Hall, E.T. The Hidden Dimension; Anchor Books: New York, NY, USA, 1963. [Google Scholar]
- Gallace, A.; Spence, C. The science of interpersonal touch: An overview. Neurosci. Biobehav. Rev. 2010, 34, 246–259. [Google Scholar] [CrossRef]
- Field, T. Touch for socioemotional and physical well-being: A review. Dev. Rev. 2010, 30, 367–383. [Google Scholar] [CrossRef]
- Chatel-Goldman, J.; Congedo, M.; Jutten, C.; Schwartz, J.L. Touch increases autonomic coupling between romantic partners. Front. Behav. Neurosci. 2014, 8, 95. [Google Scholar] [CrossRef]
- Yun, K.; Watanabe, K.; Shimojo, S. Interpersonal body and neural synchronization as a marker of implicit social interaction. Sci. Rep. 2012, 2, 959. [Google Scholar] [CrossRef]
- Singh, H.; Bauer, M.; Chowanski, W.; Sui, Y.; Atkinson, D.; Baurley, S.; Fry, M.; Evans, J.; Bianchi-Berthouze, N. The brain’s response to pleasant touch: An EEG investigation of tactile caressing. Front. Hum. Neurosci. 2014, 8, 893. [Google Scholar] [CrossRef]
- Duffy, K.G.; DeJulio, S.S. The Relationship of Neuroticism to Proxemic Behavior; Education Resources Information Center, Sponsored by the Institute of Education Sciences (IES) of the U.S. Department of Education; 1974. Available online: https://files.eric.ed.gov/fulltext/ED136093.pdf (accessed on 30 May 2020).
- Galton, F. Measurement of character. Fortnightly 1884, 36, 179–185. [Google Scholar]
- Bono, R.; Blanca, M.J.; Arnau, J.; Gómez-Benito, J. Non-normal distributions commonly used in health, education, and social sciences: A systematic review. Front. Psychol. 2017, 8, 1602. [Google Scholar] [CrossRef]
- Taleb, N.N. The Black Swan: The Impact of the Highly Improbable, 1st ed.; Random House: New York, NY, USA, 2007. [Google Scholar]
- Boyle, E.O., Jr.; Aguinis, H. The best and the rest: Revisiting the norm of normality of individual performance. Pers. Psychol. 2012, 65, 79–119. [Google Scholar]
- Micceri, T. The unicorn, the normal curve, and other improbable creatures. Psychol. Bull. 1989, 105, 156–166. [Google Scholar] [CrossRef]
- Blanca, M.J.; Arnau, J.; López-Montiel, D.; Bono, R.; Bendayan, R. Skewness and kurtosis in real data samples. Methodology 2013, 9, 78–84. [Google Scholar] [CrossRef]
- Keshmiri, S.; Shiomi, M.; Shatani, K.; Minato, T.; Ishiguro, H. Facial Pre-Touch Space Differentiates the Level of Openness Among Individuals. Sci. Rep. 2019. [Google Scholar] [CrossRef]
- Makiko, K.; Mochimaru, M. Japanese Head Size Database; AIST: Tokyo, Japan, 2001. (In Japanese) [Google Scholar]
- Giancola, S.; Corti, A.; Molteni, F.; Sala, R. Motion Capture: An Evaluation of Kinect V2 Body Tracking for Upper Limb Motion Analysis. In Proceedings of the International Conference on Wireless Mobile Communication and Healthcare, Milan, Italy, 14–16 November 2016; pp. 302–309. [Google Scholar]
- Shiomi, M.; Shatani, K.; Minato, T.; Ishiguro, H. How Should a Robot React Before People’s Touch? Modeling a Pre-Touch Reaction Distance for a Robot’s Face. IEEE Robot. Autom. Lett. 2018, 3, 3773–3780. [Google Scholar] [CrossRef]
- Steel, R.G.; Torrie, J.H. Principles and Procedures of Statistcs with Special Reference to the Biological Sciences; McGraw-Hill Book Company, Inc.: New York, NY, USA, 1960. [Google Scholar]
- Glantz, S.A.; Slinker, B.K.; Neilands, T.B. Primer of Applied Regression and Analysis of Variance; McGraw-Hill Book Company, Inc.: New York, NY, USA, 1990. [Google Scholar]
- Tomczak, M.; Tomczak, E. The need to report effect size estimates revisited. An overview of some recommended measures of effect size. Trends Sport Sci. 2014, 1, 19–25. [Google Scholar]
- Rosenthal, R.; DiMatteo, M.R. Meta-analysis: Recent developments n quantitative methods for literature reviews. Annu. Rev. Psychol. 2001, 52, 59–82. [Google Scholar] [CrossRef] [PubMed]
- Allen, M.; Poggiali, D.; Whitaker, K.; Marshall, T.R.; Kievit, R. Raincloud plots: A multi-platform tool for robust data visualization. PeerJ Prepr. 2018, 6, e27137v1. [Google Scholar] [CrossRef]
- Oishi, H.; Takemura, H.; Aoki, S.C.; Fujita, I.; Amano, K. Microstructural properties of the vertical occipital fasciculus explain the variability in human stereoacuity. Proc. Natl. Acad. Sci. USA 2018, 115, 12289–12294. [Google Scholar] [CrossRef] [PubMed]
- Kriegeskorte, N.; Simmons, W.K.; Bellgowan, P.S.; Baker, C.I. Circular analysis in systems neuroscience: The dangers of double dipping. Nat. Neurosci. 2009, 12, 535–540. [Google Scholar] [CrossRef] [PubMed]
- Jung, M.; Hinds, P. Robots in the wild: A time for more robust theories of human-robot interaction. ACM Trans. Hum. Robot Interact. (THRI) 2018, 7, 2. [Google Scholar] [CrossRef]
- Yang, G.Z.; Bellingham, J.; Dupont, P.E.; Fischer, P.; Floridi, L.; Full, R.; Jacobstein, N.; Kumar, V.; McNutt, M.; Merrifield, R.; et al. The grand challenges of Science Robotics. Sci. Robot. 2018, 3, eaar7650. [Google Scholar] [CrossRef]
- Clabaugh, C.; Matarić, M. Robots for the people, by the people: Personalizing human-machine interaction. Sci. Robot. 2018, 3, eaat7451. [Google Scholar] [CrossRef]
- Hayduk, L.A. Personal space: Where we now stand. Psychol. Bull. 1983, 94, 293–335. [Google Scholar] [CrossRef]
- Bates, D.; Mächler, M.; Bolker, B.M.; Walker, S.C. Fitting Linear Mixed-Effects Models Using lme4. J. Stat. Softw. 2015, 67, 1. [Google Scholar] [CrossRef]
- Box, G.E.; Tiao, G.C. Bayesian Inference in Statistical Analysis; John Wiley & Sons: Hoboken, NJ, USA, 1973. [Google Scholar]


| Models | p < | W(26) | r | M0 | SD0 | M4 | SD4 |
|---|---|---|---|---|---|---|---|
| Lasso | 0.001 | 36.57 | 1.16 | 8.19 | 0.85 | 5.79 | 1.60 |
| SVR | 0.001 | 12.19 | 0.39 | 8.07 | 0.84 | 7.69 | 0.85 |
| GP | 0.001 | 19.64 | 0.62 | 16.79 | 3.64 | 14.27 | 2.70 |
| Models | p0< | W0(26) | r0 | p4< | W4(26) | r4 |
|---|---|---|---|---|---|---|
| Lasso vs. GP | 0.001 | 12.22 | 0.86 | 0.001 | 12.21 | 0.86 |
| Lasso vs. SVR | = 0.31 | 1.03 | 0.07 | 0.001 | 8.00 | 0.57 |
| Lasso vs. Fixed | 0.001 | 14.11 | 1.00 | 0.001 | 14.11 | 0.86 |
| SVR vs. GP | 0.001 | 12.22 | 0.86 | 0.001 | 12.20 | 0.86 |
| SVR vs. Fixed | 0.001 | 14.11 | 1.00 | 0.001 | 14.11 | 1.00 |
| GP vs. Fixed | 0.001 | 14.11 | 1.00 | 0.001 | 14.11 | 1.00 |
| Models | p < | W(26) | r | M | SD | M | SD |
|---|---|---|---|---|---|---|---|
| Lasso | 0.001 | 36.74 | 1.16 | −0.06 | 0.08 | 0.44 | 0.30 |
| SVR | 0.001 | 29.08 | 0.92 | −0.03 | 0.09 | 0.06 | 0.11 |
| GP | 0.001 | 10.29 | 0.33 | −2.47 | 0.93 | −2.05 | 0.84 |
| Models | p < | W(26) | r | p < | W(26) | r |
|---|---|---|---|---|---|---|
| Lasso | 0.001 | 27.39 | 0.87 | 0.001 | 47.84 | 1.51 |
| SVR | 0.001 | 4.51 | 0.14 | 0.001 | 37.27 | 1.18 |
| GP | 0.001 | 22.90 | 0.72 | 0.001 | 52.62 | 1.66 |
| Models | p< | W(26) | r | p< | W(26) | r |
|---|---|---|---|---|---|---|
| Lasso vs. GP | 0.001 | 12.22 | 0.86 | 0.001 | 12.21 | 0.86 |
| Lasso vs. SVR | 0.001 | 4.95 | 0.35 | 0.001 | 6.84 | 0.48 |
| Lasso vs. Fixed | 0.001 | 14.11 | 1.00 | 0.001 | 14.11 | 1.00 |
| SVR vs. GP | 0.001 | 12.22 | 0.86 | 0.001 | 12.20 | 0.86 |
| SVR vs. Fixed | 0.001 | 14.11 | 1.00 | 0.001 | 14.11 | 1.00 |
| GP vs. Fixed | 0.001 | 14.11 | 1.00 | 0.001 | 14.11 | 1.00 |
© 2020 by the authors. Licensee MDPI, Basel, Switzerland. This article is an open access article distributed under the terms and conditions of the Creative Commons Attribution (CC BY) license (http://creativecommons.org/licenses/by/4.0/).
Share and Cite
Keshmiri, S.; Shiomi, M.; Shatani, K.; Minato, T.; Ishiguro, H. Critical Examination of the Parametric Approaches to Analysis of the Non-Verbal Human Behavior: A Case Study in Facial Pre-Touch Interaction. Appl. Sci. 2020, 10, 3817. https://doi.org/10.3390/app10113817
Keshmiri S, Shiomi M, Shatani K, Minato T, Ishiguro H. Critical Examination of the Parametric Approaches to Analysis of the Non-Verbal Human Behavior: A Case Study in Facial Pre-Touch Interaction. Applied Sciences. 2020; 10(11):3817. https://doi.org/10.3390/app10113817
Chicago/Turabian StyleKeshmiri, Soheil, Masahiro Shiomi, Kodai Shatani, Takashi Minato, and Hiroshi Ishiguro. 2020. "Critical Examination of the Parametric Approaches to Analysis of the Non-Verbal Human Behavior: A Case Study in Facial Pre-Touch Interaction" Applied Sciences 10, no. 11: 3817. https://doi.org/10.3390/app10113817
APA StyleKeshmiri, S., Shiomi, M., Shatani, K., Minato, T., & Ishiguro, H. (2020). Critical Examination of the Parametric Approaches to Analysis of the Non-Verbal Human Behavior: A Case Study in Facial Pre-Touch Interaction. Applied Sciences, 10(11), 3817. https://doi.org/10.3390/app10113817