Abstract
Driving maneuvers try to objectify user needs regarding the driving dynamics for a vehicle concept. As autonomous vehicles will not be driven by people, the driving style that merges the individual aspects of driving dynamics, like user comfort, will be part of the vehicle concept itself. New driving maneuvers are, therefore, necessary to objectify the driving style of autonomous vehicle concepts with all its interdependencies relating to the individual aspects. This paper presents a methodology to design such driving maneuvers and includes a pilot study and a user study. As an example, the methodology was applied to the parameters of user comfort and travel time. The driven maneuvers resulted in statistical equations to objectify the interdependencies of these two aspects. Finally, this paper provides an outlook for needed maneuvers in order to tackle the entire driving style with its multidimensional facets.
1. Introduction
Vehicle mobility and, thus, the vehicle concepts that provide the mobility will change with highly automated or autonomous vehicles (AVs). In addition to technical changes to the vehicle, the user’s view of the vehicle and its needs will change [1]. The technical changes include automation and the conversion to an electric drive train, which the authors see as the only sensible drive train for highly automated vehicle concepts [2]. User needs will evolve, among other things, from driving experience to driving comfort when the vehicle is no longer driven by a driver.
Currently, there are many driving maneuvers for objectifying the driving dynamics related to user needs, especially the driving experience. Due to the change in focus from driving experience to driving-style-related aspects, this paper shows the necessity for new driving maneuvers to objectify the multidimensional driving style of autonomous vehicle concepts. In the paper, a methodology for developing these maneuvers is designed, and results of a driving maneuverer that combine the aspects of user comfort and travel time are presented.
2. State of the Art
There are various publications available that discuss conventional vehicle concepts and their driving dynamics. Thus, an overview of the state-of-the-art should point out the necessity and the novelty of this paper.
2.1. Vehicle Concept Development
To design new or improved vehicle concepts, automotive manufacturers have created a product development process, which is similar among the various manufacturers (see [3], p. 5). At the beginning of this process, it is necessary to define the vehicle concept that will be designed and produced in later steps. On an abstract level, this vehicle concept development consists of four steps: customer-relevant properties, technical characteristics, vehicle concept, and target/actual comparison. During the last step, the desired vehicle concept results or an iteration loop is initiated due to the tolerated nominal/actual deviation [4,5]. Figure 1 illustrates this vehicle concept development process:
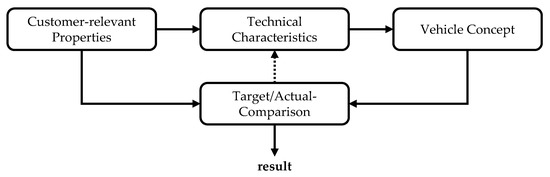
Figure 1.
Vehicle concept development process, adapted from [4,5].
In the first step, the vehicle concept development engineer defines the customer-relevant properties. C. Weber [6] describes them as the “product’s behavior” from the customer’s point of view. They summarize the value of the vehicle concept for the customer, which ultimately leads to his purchase decision [7]. As they reflect the customer’s point of view of the vehicle concept, the engineer is not able to manipulate customer-relevant properties [6].
As the mentioned process represents the current situation in the automotive industry, there are customer-relevant properties for conventional vehicle concepts. In a previous publication [8], Schockenhoff defined three levels, “whole vehicle level”, “specification level”, and “objectification level”, for structuring customer-relevant properties. On the whole-vehicle level, all of these are merged into the customer’s overall experience. The specification level particularizes the unspecific whole-vehicle properties and quantitative attributes make them measurable on an objectification level. For example, the specification “agility longitudinal dynamic” is one aspect of the whole-vehicle property “driving experience”, and one of the quantitative attributes is the “maximum velocity” [9]. For a complete enumeration of the conventional customer-relevant properties, the authors refer to Ziemann [10], Meuerle [9], and J. Weber [11].
The technical characteristics are the second step. The vehicle concept development engineer uses them to try to reach the desired customer-relevant properties, as they are adjustable [6]. In the given example, the maximum power of the engine would be a technical characteristic, which influences the maximum velocity. Hence, the technical characteristics are the engineer’s view of the vehicle’s components, which can be designed or selected.
The result of the third step is the vehicle concept. Packaging thus determines the positioning of components. The vehicle concept is a design of the product idea based on compiling the essential parameters influencing the future vehicle.
Finally, the values of the customer-relevant properties that are selected in the first step are compared with their current value in the vehicle concept as part of a target/actual comparison. If the deviation exceeds the tolerance, the technical characteristics should be adjusted.
This paper deals with the customer-relevant properties of driving dynamics. It focuses, in particular, on the user as part of the customer. Therefore, the user’s view of the vehicle and its dynamics is essential, while the technical implementation is neglected.
2.2. Current Influence of Vehicle Dynamics on Vehicle Concept Properties
Driving dynamics are a cross-sectional topic in conventional customer-relevant properties. Intersections with driving dynamics can be found in 7 of the 17 whole-vehicle-level customer-relevant properties given by Ziemann [10]: maximal vehicle performance, driving properties, suspension and vibration comfort, driver information and assistance, transport properties, economic efficiency, and special vehicle requirements.
The whole-vehicle-level customer-relevant properties given by Meuerle [9] confirm the multidisciplinary function of the driving dynamics. Six of his 10 properties interact with it: driver experience, off-road capability, comfort, everyday suitability, safety, and environmental compatibility.
To compare these properties, there are many measurable quantities on the objectification level. Therefore, there are defined driving maneuvers for almost all driving dynamic properties in order to be able to measure their degree of fulfillment. Exemplary maneuvers include acceleration tests, such as the time needed to go from 0 to 100 km/h, circular tests [12], or the ISO lane change [13].
All of those one-dimensional maneuvers are intended to test the performance of the vehicle in relation to one measured variable. The vehicle concept should provide the driver with the best possible fulfillment of the individual properties so that the driver can vary the driving style within these possibilities as the driver controls the conventional control loop of the driving guidance. Figure 2 illustrates this conventional control loop of the driving guidance and points out this impact of the driver:
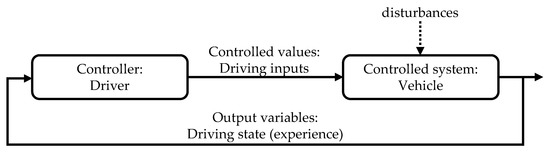
Figure 2.
Conventional control loop of the driving guidance, adapted from [14].
As the controller, the driver defines the driving inputs like the target lateral acceleration or steering angle. The vehicle’s reaction depends on the impact of external disturbances like wind or bad road conditions. The driver may regard the current driving state as the output of the controlled system vehicle to change the given driving input [14]. As the driving state is interpreted as the driver’s experience, the driver can directly influence his experience in this conventional driving guidance system.
2.3. Autonomous Driving and Influence on Vehicle Concepts
The SAE Standard J3016 [15] differentiates between six levels of automated vehicles, ranging from Level 0 vehicles that are driven by the driver without any support of a driving assistant to Level 5 vehicles that handle the driving task without any support from vehicle occupants. In other words, AVs (Levels 4 and 5) are designed such that they do not need any input from the driver. The driver is no longer needed, and the driver’s place does not have to be provided in the vehicle concept. This results in a change in the role of the occupants from driver to passenger. The passenger is an occupant who can carry out secondary activities during the ride, e.g., reading, working, and sleeping [16].
This changes the control loop of AVs (Figure 3):
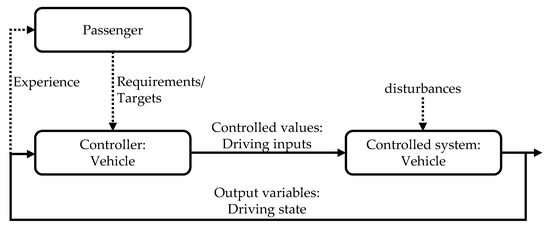
Figure 3.
Control loop of highly automated and autonomous vehicles.
Compared to the conventional control loop of driving guidance, the vehicle replaces the driver. The vehicle has to handle the driving task by itself. The passenger can only influence the driving experience by providing requirements or targets to the vehicle.
2.4. Driving Dynamics in Properties of Autonomous Vehicles
Eliminating the driving task in AVs has a significant influence on the customers’ demands in terms of driving dynamics. The desire for more comfortable driving conditions is gaining importance ([17], p. 10), while previous requirements, such as good feedback relating to the vehicle’s driving dynamics status, are fading into the background [18,19]. By reducing jerks and acceleration that occur, for example, through an optimized driving style or decoupling of the passenger compartment ([18], pp. 86–110); ([20], p. 5), the aim is to provide customers with a sedan-chair-like feeling ([21], p. 271). In this context, motion sickness is an important aspect to be considered. Fast accelerations and jerks not only have a negative effect on the subjectively perceived comfort but may also cause nausea [22,23,24].
In addition, the elimination of the driving task affords passengers an opportunity to engage in nondriving activities. These can increase the motion sickness rate by a factor of two [25]. In addition to reducing jerks and acceleration, the task of driving dynamics in an AV is to avoid significant deviations between the occupants’ visual perception and the vestibular detection of acceleration and rotational movements (rolling, pitching, yawing) [23,25,26,27].
The physical aspect alone is not sufficient to achieve a high level of comfort. Mental aspects, such as the trust that the occupants have in automation, play an essential role. According to Ellinghaus and Schlag [28], co-drivers of a manual vehicle evaluate the driving comfort mainly by the driving style of the driver. It is assumed that this effect can be transferred to AVs [29,30].
For example, the sole use of a safe driving style is not sufficient to gain occupant confidence in automation. The driving style must show passengers a particularly safe driving behavior in order to be accepted by users [29]. This is achieved by maintaining large safety distances, avoiding driving maneuvers that are perceived as hectic, and driving with an emphasis on anticipation ([20], p. 15; [24,29,31]). The logic behind the decisions made by the driving style must be apparent so that the occupants can interpret the decisions [32].
Furthermore, the use of a driving style that imitates human driving behavior increases the acceptance of automation [29,33]. Human drivers are characterized by continuous steering input [34,35], which can be simulated by using clothoids or fifth-degree polynomials for trajectory planning, resulting in a curvature-continuous path [29,36].
However, the driving style of an AV is not characterized by comfort only. It is a multidimensional construct that combines requirements for comfort [28,29,30,37,38], safety [29,37,38,39], economic efficiency [37,38,40], and travel time ([20], p. 16; [39]). Measures to optimize one dimension can influence other dimensions positively or negatively or have no influence on them. Consideration of these cross-influences is essential for overall customer-oriented vehicle development. For example, when considering the dimensions of comfort and travel time, there is a conflict arising in the objectives in the first step. A faster, more dynamic driving style is perceived by occupants as less comfortable ([20], p. 5). Technical measures, such as active chassis control, allow for the Pareto front (which exists between the two dimensions) to be shifted so that shorter travel time can be achieved with greater ride comfort ([18], p. 16).
Taking this example into consideration, it can be deduced that the adaptability of driving style and chassis is indispensable for meeting differing requirements in all four dimensions at the same time. The degree of technical specification, as well as the selected application, result in a grading of customer value by which the manufacturers can differentiate themselves.
2.5. Previous Studies on Driving Style of Autonomous Vehicles
Bellem [24] determined objective variables for four characteristic driving maneuvers that were selected according to their frequency of occurrence in real traffic (Table 1).

Table 1.
Objective variables for the objectification of driving comfort, adapted from [24].
These objective variables allow the driving style to be classified on a scale from comfort-oriented to dynamic. Because the objective variables differ for different maneuvers, a maneuver-based approach is necessary to distinguish between driving styles [24].
In further investigation, driving styles with a higher comfort rating are generally described by test persons as consistent and predictable [41]. In a third study, Bellem [42] showed that, depending on the maneuver, different personal factors (risky driving style, high-velocity driving) have an influence on the dynamic perception of the driving style. Despite the variations, the driving styles generally perceived as pleasant remain the same. Furthermore, it can be observed that test persons prefer an early noticeable jerk during a lane change maneuver, even if this increases the maximum jerk. This is possibly due to the desire for perceived safety. For longitudinal dynamic maneuvers, test persons prefer a minimization of the jerk.
During the course of three studies [24,41,42], Radke [43] constructed a multiple linear regression model for the subjective perception of dynamics in automated longitudinal controlled passenger vehicles. The dynamic factor on which the regression model is based is composed of the engine speed, the longitudinal and lateral acceleration, and the vehicle speed. Weighting the factors results in a high weighting of the lateral acceleration and a low weighting of the remaining factors. However, this does not make the model much more accurate, and omitting the remaining three factors makes the model inaccurate.
Radke [43] showed that the perception of dynamics differs between a driver and a passenger. The passenger is more sensitive to the dynamics than the driver. In the study, the offset was measured at 20.4%. The studies also show that gender and existing visual range have an influence on the perception of driving-style dynamics. Furthermore, the human perception of dynamics is not reliable. A time-delayed study with the same test persons led to a different subjective evaluation for the same dynamics.
In a study, Kaethner [33] recorded the driving style of test persons as drivers. Subsequently, the test persons evaluated several driving styles, including their own driving style, as a passenger in an autonomous scenario. The study showed that the majority of the test persons prefer their own driving style, while only a few test persons prefer a driving style different than their own. Test persons with high lateral acceleration and small safety distance in manual driving preferred an automation design with lower lateral acceleration and larger safety distances.
Festner [44] classified test persons into three groups with regard to their expectations of the dynamic characteristics of a highly automated lane change, while engaged in a nondriving-related activity. Group 1 wanted to perceive the lane change as little as possible in order to achieve comfort and better concentration. A small second group wanted to notice the lane change as a control modality in order to better understand the current movement of the vehicle. The driving dynamics feedback increased the feeling of safety for this group. The third group wanted to perceive the lane change only subconsciously, without being distracted by the activity currently being carried out. This group wanted to feel the sensation of being driven in an automated vehicle, but rated comfort and uninterrupted pursuit of nondriving-related activities higher.
Overall, it can be noted that, as the degree of distraction from nondriving-related activities increases, dynamic vehicle guidance is uniformly regarded as negative.
2.6. Research Gap
All conventional driving maneuvers (Section 2.1 and Section 2.2) and the described maneuvers for investigations of the driving style of AVs (Section 2.4 and Section 2.5) are designed for one-dimensional problems of individual vehicle dynamics variables. As mentioned, this is a feasible methodology for improving driving-style aspects in the driving control loop of a conventional vehicle (Figure 2) that is driven by a driver.
In the control loop of AVs (Figure 3), the vehicle itself is responsible for the driving style. Therefore, the different aspects of the driving have to be merged into a trajectory that leads to a multidimensional problem. The driving style, as it is defined in this paper, consists of the aspects of comfort, safety, economic efficiency, and travel time. The vehicle has to find the optimal values of these different dependent aspects according to the desired driving style.
Thus, one-dimensional maneuvers for testing the maximum performance of one aspect will be obsolete for the customer-relevant properties of AVs. For safety aspects, the maximum fulfillment of specific properties like acceleration will still be important. To include interdependencies between user comfort, travel time, economic efficiency, and safety, it is necessary to define new maneuvers and evaluation methods. Only maneuvers that combine more than one aspect can test the quality of a driving style.
Thus, this paper introduces a methodology to research multidimensional driving maneuvers for testing the quality of driving styles and provides an example with two aspects of driving comfort and travel time.
3. Methodology
The selection of a driving maneuver and its validation with regard to the suitability of the evaluation of the aspects “comfort” and “travel time” of the driving style’s multidimensionality consists of a newly developed three-stage process (Figure 4). In the first step, various driving maneuvers are defined that show potential suitability for objectifying the comfort and travel time evaluation of driving styles. Suitable maneuvers provide reference points for acquiring all variables to objectify the driving comfort (Table 1) and, if possible, depict driving in real traffic. In addition, they must allow enough space for different driving styles and still set meaningful boundary conditions to avoid good results with unrealistic driving conditions. Based on these maneuvers, a pilot study determines which driving maneuvers are best suited and validates the ability to objectify travel time. A user study then validates the functionality of the maneuvers selected in the pilot study based on a group of test subjects.
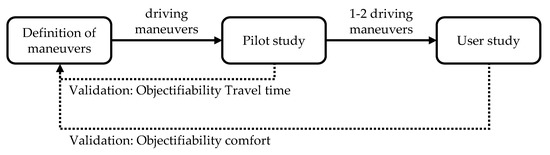
Figure 4.
Methodology for the two-dimensional objectification of driving comfort and travel time.
The objectification performed in Steps 2 and 3 is based, if applicable to the maneuver, on the measurement of the objectification variables for comfort according to Bellem [24] (Table 1) as well as the additional variables of maximum total acceleration, maximum total jerk, and the time to complete the maneuver.
The evaluation of maximum values of acceleration and jerk requires the definition of a time interval within which the maximum is calculated. ISO15622 [45] (10f) defines permissible longitudinal accelerations and jerks for adaptive cruise control systems. It sets the interval for the averaging of longitudinal accelerations at 2 s, and for longitudinal jerks, at 1 s. UNECE R79 ([46], p. 15) sets the averaging interval for a lateral jerk in the design of a steering system to 0.5 s. The regulation does not specify an interval for averaging the lateral acceleration. The authors recommend setting the interval to 2 s in line with the interval for longitudinal ([45], pp. 10–11).
3.1. Pilot Study
The design of the pilot study must allow for a sequential, identical test execution for the driving maneuvers, which are defined with the mentioned requirements.
For practical purposes, the test driver, therefore, performs the driving maneuver specified by the test supervisor at different levels of comfort without carrying out a driving dynamics measurement. The test driver repeats the process until he can approach defined comfort levels reliably.
The following test drives, with a recording of measurement data, include a breakdown of driving styles into the measurement groups “maximum comfort”, “minimum comfort”, and “minimum travel time”. A comparison of the measurement groups “maximum comfort” and “minimum comfort” allows us to determine, by means of extremes, the precision with which the maneuver maps different comfortable driving styles under the given boundary conditions. The “minimum travel time” measurement group, in comparison with the “maximum comfort” measurement group, allows for the differentiability of the second dimension (travel time) to be additionally examined.
The maximum comfort and minimum comfort measurement groups each comprise five measurement drives with a driving style that simulates high or low comfort. The comfort is assessed by the test driver and the test supervisor. The minimum travel time measurement group comprises one test drive. The test driver performs the maneuver with minimum travel time under the given boundary conditions of the maneuver. Measurement drives that are not representative of a measurement group due to driving errors are not taken into account. The test driver is not limited by the number of tests.
Based on the measurement drives, the basis for selecting suitable driving maneuvers is a two-sample t-test applied to all objective variables of the measurement groups’ maximum comfort and minimum comfort of each maneuver. The null hypothesis for an objectification variable of a maneuver is
- H0: The measured values of the maximum comfort measurement group originate from the same normal distribution as the measured values of the minimum comfort measurement group.
In addition, the maneuvers must have a factor of >1 between the passage of time of the maneuver within the maximum comfort measurement group and the passage of time of the maneuver within the minimum travel time measurement group. This passage time is the needed time in seconds from the maneuver start to the maneuver end of each measurement drive. A factor as large as possible but at least >1 validates the ability of the maneuver to distinguish between a comfort-oriented and a travel-time-oriented driving style.
3.2. User Study
The aim of the user study is to determine the relationship between the objective variables in the maneuver and the subjective perception of the test persons. A clear correlation between subjective perception and objective variables validates the functionality of the maneuver.
In the first step, a valid database must be generated to achieve this goal. In order to achieve the same meaningful boundary conditions for all test persons, they are instructed by the test supervisor. Each maneuver is completed six times, according to the following procedure. Test Drive 1 is used to instruct the test persons. Test Drives 2 to 6 take place with the recording of measurement data and they serve to generate a database. For each test drive, the test driver simulates a driving style (Table 2) in randomized order, whereby the “maximum comfort” driving style is the only one that is driven two times. The reason for this is that the “maximum comfort” driving style is the most difficult to approach for a human test driver since small driving errors can affect the comfort rating of the entire test drive. Performing this driving style twice increases the probability of an error-free test drive, and thus, the number of usable results.
Table 2.
Driving styles used for the user study.
After each test drive, there is a break of about two minutes during which the test persons evaluate the driving style used in the maneuver on the basis of the questionnaire. A rating of the driving comfort must be given. Selecting a word from the semantic differential and filling in the comments field are optional. The test vehicle is at a standstill during the evaluation phase. After completion of the measurement drives of each driving maneuver, the test persons have the opportunity to give general feedback regarding the test execution and the different driving styles.
The acquisition of acceleration data using the inertial platform mounted in the trunk requires postprocessing of the measured data. The different positions of the platform and the test person give rise to a measurement error resulting from the angular acceleration of the vehicle. A correction for the yaw acceleration is calculated using a single-track model. Corrections for roll and pitch acceleration are neglected due to the unpredictable head movement of the test persons.
Furthermore, all recorded subjective data from the questionnaire are corrected with the average of the respective test person. The reasoning behind this is that predetermined evaluation references were deliberately avoided when carrying out the experiment. Therefore, each respondent uses the evaluation scale differently. An average correction increases the comparability of the subjective evaluations. The later application of a modified version of Stevens’ power law as a regression model further requires the use of a continuous scale [47]. The application of a mean-value correction converts the stepped absolute evaluation scale to a relatively continuous scale.
A connection between the objectively measured values and the subjective perception of the test persons is achieved by nonlinear regression analysis. The regression model is a modified version of Stevens’ power law of the formula:
Y = 1 + k (|X − X0|)n
Y is the subjective grade of the test drive by the test person on a six-level Likert scale for driving comfort and X, the maximum of the measured variable. In the analysis of the data, values for X0, k, and n are derived. X0 defines the boundary of the measured variable to achieve the best rate, 1. k and n are mathematical coefficients to obtain an exponential function regarding Stevens’ power law. They are also defined during the analysis of the data. Finally, the formula is modified by a +1 to adapt it to the rating scale.
The evaluation of the global goodness-of-fit of the regression is performed and consists of a combination of the R2 coefficient of determination and a visual inspection [48], ([49], p. 40). The evaluation of the subjective data serves to verify the influence of a low jerk, low acceleration, predictable and confidence-inspiring driving style on a positive evaluation of driving comfort. The analysis is done by means of an X2-test for independence, to check the dependency of all four semantic differentials on the comfort rating.
3.3. Experimental Setup
Both the pilot study and the user study took place at the Schleißheim Airfield. The area was closed to the public for the tests. The road surface is an even tarmac and the road boundaries were artificially represented using pylon lanes.
As the first step of the methodology is to define driving maneuvers, the maneuvers “Double 90°—turn with different radii”, “Double 90°—turn with different radii from a standstill”, “Turn from a standstill”, “Single lane change”, “Slalom with rising pylon distances”, “Slalom with rising and falling pylon distances”, as well as “Decelerate to a slower vehicle and change the lane”, were chosen.
For one test drive in the pilot study, there were two occupants in each vehicle (test driver, test supervisor), and for the user study, four occupants (test driver, test supervisor, two test persons). The use of a human test driver results in increased demands on driving skills. The driver must be able to reliably simulate different driving styles. An employee of the Institute of Automotive Technology with a high level of driving experience and driving training was selected as the test driver. The test supervisor was seated in the passenger seat. He instructed the test persons and operated the measuring electronics. The test subjects were located on the rear seats of the vehicle and were assigned to one side of the vehicle based on their test subject number.
3.4. Measuring Equipment
The test vehicle was a BMW 650i Gran Coupé. The vehicle, therefore, was not an autonomous electric vehicle (EV), which was taken into account in the test design. The vehicle came with integrated sensors for recording speeds, accelerations, body movements, and steering angles. The vehicle’s CAN bus also provided access to calculated driving dynamics variables. This allowed the use of a float angle estimation with the aid of a Kalman filter. In addition to the integrated sensors, the vehicle was equipped with an inertial platform for driving dynamics measurements of type RT2500. The platform was secured by a frame in the trunk. The inertial platform was operated in combination with a GPS antenna mounted on the vehicle roof. This enabled the high-precision measurement of acceleration and body movements with the known positioning of the sensors. The measurement data were captured by both vehicle CAN buses and the CAN bus of the inertial platform.
The subjective data were collected from the questionnaire. The questionnaire consisted of two blocks. Block 1 asked for personal details relating to the test subjects, which can have a potential impact on subjective perception (age, gender, attitude towards autonomous driving, annual mileage, evaluation of own driving style). Block 2 of the questionnaire was used to evaluate driving comfort within a test drive. It consists of a six-level Likert scale for grading driving comfort, four semantic differentials for detailing subjective perception, and a field for additional comments.
3.5. Test Subjects
A total of eleven subjects (seven male, four female) took part in the study. The age of the test subjects ranged from 21 to 64 years (M = 31.18 years; SD = 14.41 years). The average annual mileage as a driver was 10,718 km based on all test persons (SD = 11,578 km; min = 0 km; max = 30,000 km), which is about 5000 km per year below the German average (([50], p. 6); [51]). Two test subjects rated their own driving style as “very dynamic”, three as “more dynamic”, two as “more comfortable”, and four as “very comfortable”. Three test subjects rated their attitude towards autonomous driving as “very positive”, four as “rather positive”, three as “neutral”, and one as “rather negative”.
4. Results
The results were prepared in accordance with the methodology in order to make the procedure comprehensible. The results of the pilot study explain the selection of maneuvers for the user study. The results of the user study can be further broken down into two areas (Section 4.2).
4.1. Pilot Study
The evaluation of the t-test shows that of the seven maneuvers examined, the maneuver “Double 90°—turn with different radii from a standstill” (Figure 5; hereinafter referred to as “Maneuver A”) and “Slalom with rising and falling pylon distances” (Figure 6; hereinafter referred to as “Maneuver B”) are best suited to objectify the comfort in the following user study. For both maneuvers, the null hypothesis can be rejected for all objectification variables with an error probability of less than one percent. This means that for both maneuvers, all objective variables can differentiate between a comfortable and an uncomfortable driving style and can be used for further investigation in the user study.
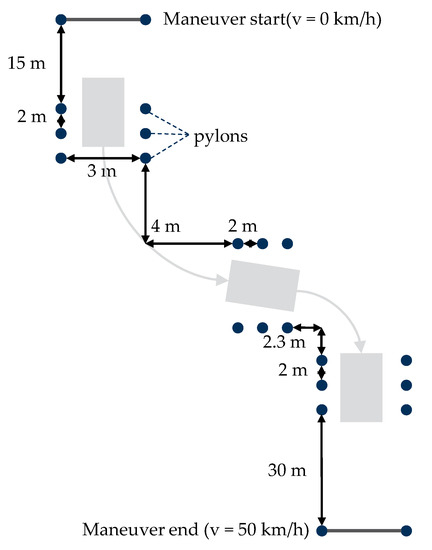
Figure 5.
Schematic representation of Maneuver A (not to scale).
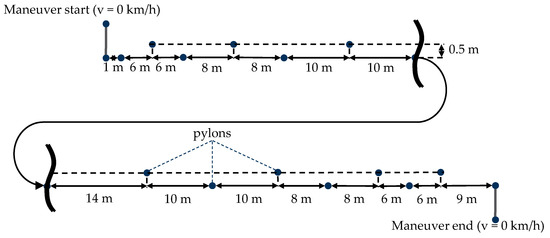
Figure 6.
Schematic representation of Maneuver B (not to scale).
Regarding the aspect of travel time, Maneuver A has a factor of the passage of time with high comfort to the passage of time with a low travel time of 1.40, and Maneuver B has a factor of 1.91, which is the highest of all maneuvers. Both maneuvers can thus distinguish between a comfort-oriented and a travel-time-oriented driving style.
4.2. User Study
The results of the user study can be divided into two parts. A regression analysis first investigates the relationship between the subjective comfort score and the different objective variables. An evaluation of the subjective data from the semantic differentials confirms the influence of comfort-influencing parameters from the literature on the subjectively perceived driving comfort.
4.2.1. Regression Analysis
A regression analysis using the modified Stevens’s power law returns the following results for the investigated maneuvers. For Maneuver A, the objective value jerk onset with R2 = 0.7073 shows the highest goodness-of-fit (Table 3). The second highest goodness-of-fit is achieved by the objective value longitudinal jerk on the throttle, with R2 = 0.6786 (Figure 7). This confirms that in addition to transverse jerks, occupants also react sensitively to longitudinal jerks.
Table 3.
Results from the regression analysis for all objective values in Maneuver A.
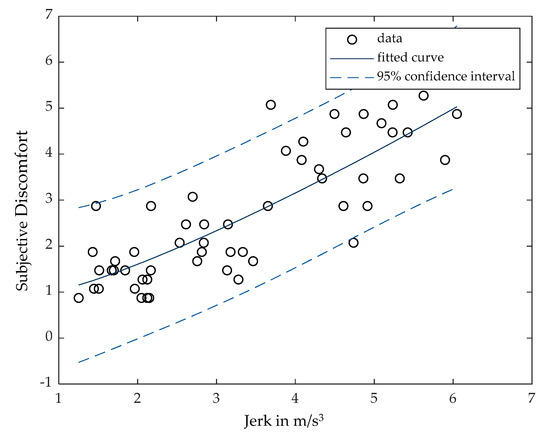
Figure 7.
Regression analysis for the objective value longitudinal jerk on gas in Maneuver A.
The objective variables total acceleration and total jerk, intended for simplified evaluation, have an R2-value of 0.5996 and 0.6156, respectively. The lowest goodness-of-fit, with R2 = 0.4701, is with the objective variable jerk in the curve change. One possible reason for this is the distance between the two corners. The distance of 4 m is rather generous so that a clear change of direction may be difficult to identify for the test person. A reduction in the distance can fix this issue.
It is noticeable that within the maneuver, the coefficients determined from the regression for similar objectification variables have similar magnitudes. This is an indication that the model used for the regression analysis is correct. The objective variables, lateral acceleration, acceleration jerk, and total acceleration, have a progressive relationship between subjective judgment and the magnitude of the measured value. For all other objective quantities, there is a degressive relationship. The evaluation thresholds (X0) are lower for longitudinal-dynamic objective quantities than for their transverse-dynamic counterparts. This finding is consistent with the comments by Test Persons 2 and 3, who stated that they feel their comfort perception is reduced more by lateral dynamic effects than by longitudinal ones.
For Maneuver B, the regression analysis leads to R2 values of 0.4654 to 0.7557 (Table 4). As with Maneuver A, the objective value jerk onset (Figure 8) achieves the highest goodness-of-fit, with R2 = 0.7557.
Table 4.
Results from the regression analysis for all objective values in Maneuver B.
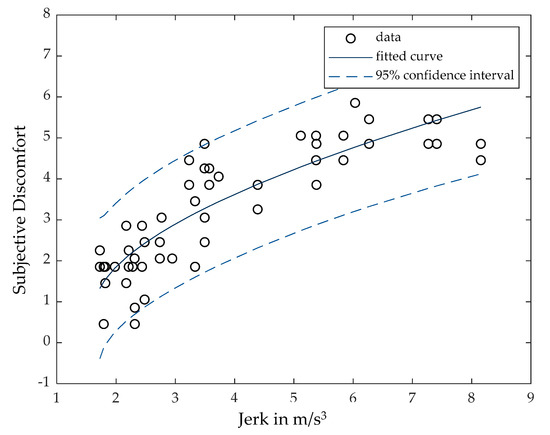
Figure 8.
Regression analysis for the objective value jerk onset in Maneuver B.
This indicates a special significance of the characteristic value for evaluating the comfort of a driving style. One explanation for this is that the jerk onset is less predictable for the occupants due to the partial obstruction of vision and the abruptness of its occurrence. This means that the occupants are not able to foresee the steering operation based on visual perception of the corner, and, in contrast to the maximum longitudinal and lateral accelerations, which are indicated by a rather slow increase in acceleration, are not able to feel it build up. The steering change jerk and jerk end follow a steering onset and are therefore more predictable for the occupant. The lack of body tension resulting from the poor predictability of the jerk onset leads to significant body movements, which the subject finds unpleasant. Subject 6 described this phenomenon with a tipping of the body under the influence of lateral dynamics.
Low R2 values were found in the two longitudinally dynamic characteristic values of starting jerk (R2 = 0.4834) and stopping jerk (R2 = 0.4654). This indicates a poor longitudinal dynamic differentiability within the maneuver. One possible explanation for this was that both the starting and stopping processes took place shortly before or after a curve. As a result, the starting and stopping process overlapped with the steering process. This made it difficult for the test persons to differentiate the longitudinal dynamics. Adapting the maneuver to this circumstance would solve the problem.
In contrast to Maneuver A, the coefficients determined from the regression analysis do not show a clear pattern (Table 4). The coefficient n used in the regression model depends on the stimulus conditions and varies widely between different test persons [48]. Combined with the small number of test persons, a scattering is therefore legitimate. It is also noticeable that in contrast to Maneuver A, all relationships between subjective judgment and the magnitude of the measured value show a degressive growth, which can be explained by the different stimulus conditions within the two maneuvers [47]. The function of the relationship between objective size and subjective judgment is thus maneuver-specific.
Analyzing the dependence between the subjective user comfort and the needed travel time in Maneuver B in Figure 9 allows for interpreting a Pareto front. Regarding this Pareto front, the driving style could be chosen as a more comfortable or faster drive. It is not possible to cross the Pareto front to drive a short travel time without any discomfort, which is illustrated by the blank lower-left corner.
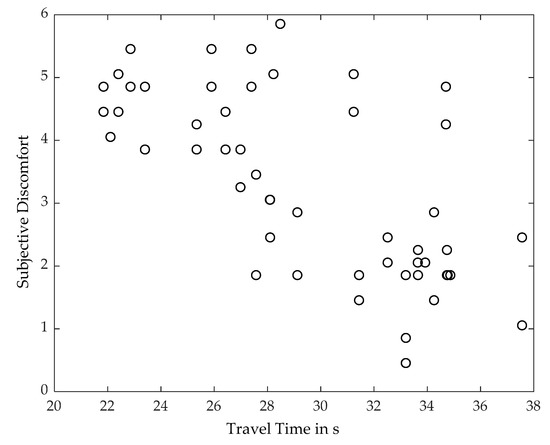
Figure 9.
Dependence between user discomfort and travel time in Maneuver B.
4.2.2. Subjective Data
For both driving maneuvers examined, the following four hypotheses were tested:
- H0.1: The selection of the semantic differential between “smooth” and “jerky” of a test person is independent of whether the corresponding grading of the test drive is better/equal or worse than the average of the grades of the respective test person.
- H0.2: The selection of the semantic differential between “physically comfortable” and “physically exhausting” of a test person is independent of whether the corresponding grading of the test drive is better/equal or worse than the average of the grades of the respective test person.
- H0.3: The selection of the semantic difference between “predictable” and “unpredictable” of a test person is independent of whether the corresponding grading of the test drive is better/equal or worse than the average of the grades of the respective test person.
- H0.4: The selection of the semantic difference between “confidence-inspiring” and “frightening” of a test person is independent of whether the corresponding grading of the test drive is better/equal or worse than the average of the grades of the respective test person.
The X2-values for all null hypotheses are greater than the threshold of X21.95% = 3.84 ([52], pp. 1014–1015) (Table 5). The null hypotheses are therefore rejected. The result is significant. It verifies the influence of a low jerk, low acceleration, predictable and confidence-inspiring driving style on a positive evaluation of driving comfort.
Table 5.
Results from the X2-test for both maneuvers.
An evaluation of the 2 × 2 contingency tables used for the calculation shows that the determined dependency has the correct directional correlation. The positive expression of the word pair occurs mainly in connection with a grade better than or equal to the average grade of the respective respondent, and the negative expression with a grade worse than the average grade.
5. Discussion
The developed methodology is able to close the presented research gap. It gives the basis for performing driving maneuvers to objectify the multidimensional aspects of the driving style of AVs. Since user comfort is an essential part of the driving style of an AV, the methodology also works for user-comfort-related objectification studies.
Nevertheless, it is indispensable to run through the methodology for every possible interdependence of the driving style’s aspects. As a result, a large number of studies are required to define objectification parameters for every possible 2-, 3-, and 4-dimensional interdependence.
The founded results are one example of the 2-dimensional interdependence between travel time and user comfort. The results show the functionality of the developed methodology for these kinds of problems. Furthermore, the user comfort, which is a subjective perception of every human being, can be correlated to technical parameters.
The statistical values of the results are in a good range and show their signification. Thus, the presented correlation functions work for the objectification of the interdependence between user comfort and travel time. Statistically, the number of subjects has to be discussed. To reach the final results, it is necessary to conduct a study with subjects of every possible user group to obtain a representative quantity. This was not possible in the present study.
Furthermore, in literature [53], it is known that the evaluation of the global goodness-of-fit of a nonlinear regression with the R2 coefficient of determination is statistically problematic. Nevertheless, as no appropriate method exists for a global goodness-of-fit of a nonlinear regression, R2 is proposed with an additional plausibility check in the literature ([49], p. 40). In the method presented in this paper, the plausibility check is pursued by a visual inspection. In order to be as transparent as possible in the evaluation, all driving data are provided in the Supplementary Materials.
With the presented methodology, it is only possible to find a suitable maneuver and not the best maneuver. The early selection of a few maneuvers in the pilot study, with only the subjective data of two experts, reduces the effort in the user study but could exclude better maneuvers. Since it is not important to have the best, most detailed test in vehicle concept development, the results could help to develop driving styles of AVs and prove the feasibility of multidimensional driving maneuvers.
Another point that has to be discussed is the human driver in the study. The subjects may have a different level of trust in a human driver than in the automation. The average correction of the data addresses this. The overall trust in the system does not have any impact. Only the differences between the individual test drives are the input for the correlations.
The studies were not conducted using an EV. Therefore, the technical setup does not reflect future autonomous EVs. This technical deviation should not falsify the results due to the research focus on correlations between measurable parameters and user comfort. EVs do not have specific user-comfort-affecting characteristics like shift jerking, but the presented correlations are the same for EVs. These results provide a basis for further research on the same or similar problems.
6. Summary and Outlook
The authors present the need to change the current view on driving maneuvers to objectify customer-relevant properties. The current one-dimensional approach does not suit AVs, in order to describe their driving style. Thus, a methodology was developed to create new driving maneuvers. A pilot study with all conceivable maneuvers for 2-, 3-, and 4-dimensional interdependence of driving styles showed the feasibility of the maneuver for the current interdependence. A user study with the selected maneuvers provided the opportunity to establish relevant correlations between subjective user information and technical vehicle parameters.
This paper includes the results of an exemplary study. The 2-dimensional interdependence of user comfort and travel time and their objective technical parameters are shown. The correlation equations with their good statistical values make it possible to objectify the interdependence of these two parameters for the driving style of AVs.
Further research should focus on more results. The methodology should be used to conduct studies of every 2-, 3-, and 4-dimensional interdependence of the driving styles. Furthermore, the present study can be repeated with a larger number of subjects in order to obtain a representative quantity.
Supplementary Materials
The following are available online at https://www.mdpi.com/2076-3417/10/11/3946/s1: questionnaire, driving data, and schematic representation of all maneuvers.
Author Contributions
Conceptualization: F.S. and H.N., methodology: F.S. and H.N., formal analysis: H.N., validation: F.S. and H.N., writing: F.S. and H.N., project administration: F.S. Ferdinand Schockenhoff’s contribution was approximately 60%. H.N.’s contribution was approximately 35%. M.L.’s contribution was approximately 5%. M.L. made an essential contribution to the conception of the research project. He revised the paper critically for important intellectual content. M.L. gave the final approval of the version to be published and agrees to all aspects of the work. As a guarantor, he accepts responsibility for the overall integrity of the paper. Many thanks to Georg Burkhard and Konstantin Riedl for their input and to Sebastian Wolff and Adrian König for reviewing the draft of the paper. All authors have read and agreed to the published version of the manuscript.
Funding
This research is accomplished within the project “UNICARagil” (FKZ 16EMO0288). We acknowledge the financial support for the project by the Federal Ministry of Education and Research of Germany (BMBF).
Acknowledgments
The equipment used in the studies were provided by the Institute of Automotive Technology of the Technical University of Munich.
Conflicts of Interest
The authors declare no conflict of interest.
References
- Wolff, S.; Auernhammer, J.; Schockenhoff, F.; Angerer, C.; Wittmann, M. Mobility box: A design research methodology to examine people’s needs in relation to autonomous vehicle designs and mobility business model. In Proceedings of the 16th International Design Conference, Dubrovnik, Croatia, October 2020. accepted. [Google Scholar]
- Gawron, J.H.; Keoleian, G.A.; de Kleine, R.D.; Wallington, T.J.; Kim, H.C. Life cycle assessment of connected and automated vehicles: Sensing and computing subsystem and vehicle level effects. Environ. Sci. Technol. 2018, 52, 3249–3256. [Google Scholar] [CrossRef] [PubMed]
- Hahn, J. Eigenschaftsbasierte Fahrzeugkonzeption; Springer Fachmedien: Wiesbaden, Germany, 2017; ISBN 978-3-658-20101-2. [Google Scholar]
- Wiedemann, E.; Meurle, J.; Lienkamp, M. Optimization of electric vehicle concepts based on customer-relevant characteristics. In Proceedings of the SAE 2012 World Congress and Exhibition, Detroit, MI, USA, 16 April 2012. [Google Scholar] [CrossRef]
- Fuchs, J.; Lienkamp, M. Technologies, architectures for electrified vehicles. Auto Tech. Rev. 2013, 2, 24–30. [Google Scholar] [CrossRef]
- Weber, C. Looking at “DFX” and “Product Maturity” from the perspective of a new approach of modelling product and product development processes. In The Future of Product Development; Krause, F.-L., Ed.; Springer: Berlin, Germany; New York, NY, USA, 2007; pp. 85–104. [Google Scholar]
- Lai, A.W. Consumer values, product benefits and customer value: A consumption behavior approach. NA-Adv. Consum. Res. 1995, 22, 381–388. [Google Scholar]
- Schockenhoff, F.; König, A.; Koch, A.; Lienkamp, M. Customer-relevant properties of autonomous vehicle concepts. In Proceedings of the 30th CIRP Design 2020, Skukuza, South Africa, 5–8 May 2020. [Google Scholar]
- Meurle, J.; Rigel, S.; Muigg, A. Fahrzeugeigenschaften- Erwartungshaltung Des Kunden Und Technische Umsetzbarkeit; Vortragsreihe Fahrzeugtechnik; Institut für Fahrzeugtechnik, FH JOANNEUM: Graz, Austria, 2009. [Google Scholar]
- Ziemann, A. Zielsystemmanagement Für Die Produktentstehung Von PKW; Books on Demand: Norderstedt, Germany, 2007. [Google Scholar]
- Weber, J. Automotive Development Processes: Processes for Successful Customer Oriented Vehicle Development; Springer: Berlin, Germany, 2009. [Google Scholar]
- ISO 3888. Passenger Cars—Test Track for a Severe Lane-Change Manoeuvre. 2018. Available online: https://www.iso.org/standard/67973.html (accessed on 10 March 2020).
- ISO 4138. Passenger Cars—Steady-State Circular Driving Behaviour—Open-Loop Test Methods. 2012. Available online: https://www.iso.org/standard/54143.html (accessed on 10 March 2020).
- McRuer, D.T.; Allen, R.W.; Weir, D.H.; Klein, R.H. New results in driver steering control models. Hum. Factors 1977, 19, 381–397. [Google Scholar] [CrossRef]
- SAE J3016. Taxonomy and Definitions for Terms Related to Driving Automation Systems for On-Road Motor Vehicles. 2018. Available online: https://www.sae.org/standards/content/j3016_201806/ (accessed on 10 March 2020).
- Becker, T.; Herrmann, F.; Duwe, D.; Stegmüller, S.; Röckle, F.; Unger, N. Enabling the Value of Time: Implikationen für Die Innenraumgestaltung Autonomer Fahrzeuge. 2018. Available online: http://www.muse.iao.fraunhofer.de/download-evot (accessed on 16 May 2018).
- Herrmann, F. First Insights: Akzeptanzstudie Robocab; Fraunhofer IAO: Stuttgart, Germany, 2017. [Google Scholar]
- Bär, M. Vorausschauende Fahrwerkregelung Zur Reduktion Der Auf Die Insassen Wirkenden Querbeschleunigung; Institut für Kraftfahrzeuge: Aachen, Germany, 2014. [Google Scholar]
- Reichenbach, M. Münchner Fahrwerk-Symposium: Chassis.tech plus 2017. ATZ 2017, 119, 116–117. [Google Scholar] [CrossRef]
- Bellem, H. Comfort in Automated Driving: Analysis of Driving Style Preference in Automated Driving. Ph.D. Thesis, Fakultät für Human- und Sozialwissenschaften, Technische Universität Chemnitz, Chemnitz, Germany, 2018. [Google Scholar]
- Maurer, M.; Gerdes, J.C.; Lenz, B.; Winner, H. (Eds.) Autonomes Fahren; Springer: Berlin/Heidelberg, Germany, 2015. [Google Scholar]
- Gianna, C.; Heimbrand, S.; Gresty, M. Thresholds for detection of motion direction during passive lateral whole-body acceleration in normal subjects and patients with bilateral loss of labyrinthine function. Brain Res. Bull. 1996, 40, 443–447. [Google Scholar] [CrossRef]
- Probst, T.; Krafczyk, S.; Büchele, W.; Brandt, T. Visual prevention from motion sickness in cars. Arch. Psychiatr. Nervenkr. 1982, 231, 409–421. [Google Scholar] [CrossRef]
- Bellem, H.; Schönenberg, T.; Krems, J.F.; Schrauf, M. Objective metrics of comfort: Developing a driving style for highly automated vehicles. Transp. Res. Part F Traffic Psychol. Behav. 2016, 41, 45–54. [Google Scholar] [CrossRef]
- Morimoto, A.; Isu, N.; Ioku, D.; Asano, H.; Kawai, A.; Masui, F. Effects of reading books and watching movies on inducement of car sickness. In Proceedings of the FISITA 2008 World Automotive Congress, Munich, Germany, 14–19 September 2008. [Google Scholar]
- Diels, C.; Bos, J.E. Self-driving carsickness. Appl. Ergon. 2016, 53, 374–382. [Google Scholar] [CrossRef]
- Benson, A.J. Motion sickness. In Textbook of Military Medicine, Medical Aspects of Harsh Environments; Pandolf, K.B., Burr, R.E., Eds.; Falls Church: Virginia, VA, USA; Fort Sam Houston: San Antonio, TX, USA; Bethesda: Rockville, MD, USA; Office of the Surgeon General, United States Army: Washington, DC, USA; Borden Institute: Washington, DC, USA; Walter Reed Army Medical Center: Bethesda, MD, USA; United States Army Medical Dept. Center and School: Fort Sam Houston: San Antonio, TX, USA; Uniformed Services University of the Health Sciences: Bethesda, MD, USA, 2002; pp. 1048–1083. [Google Scholar]
- Ellinghaus, D.; Schlag, B. Beifahrer: Eine untersuchung über die psychologischen und soziologischen aspekte des zusammenspiels von fahrer und beifahrer. Uniroyal Verk. 2001, 26, 2001. [Google Scholar]
- Elbanhawi, M.; Simic, M.; Jazar, R. In the passenger seat: Investigating ride comfort measures in autonomous cars. IEEE Intell. Transport. Syst. Mag. 2015, 7, 4–17. [Google Scholar] [CrossRef]
- Verberne, F.M.F.; Ham, J.; Midden, C.J.H. Trusting a virtual driver that looks, acts, and thinks like you. Hum. Factors 2015, 57, 895–909. [Google Scholar] [CrossRef] [PubMed]
- Lee, D.N. A theory of visual control of braking based on information about time-to-collision. Perception 1976, 5, 437–459. [Google Scholar] [CrossRef] [PubMed]
- Lee, J.; Moray, N. Trust, control strategies and allocation of function in human-machine systems. Ergonomics 1992, 35, 1243–1270. [Google Scholar] [CrossRef] [PubMed]
- Kä, D.; Griesche, S. Should My Vehicle Drive as I Do. Braunschweig. 2017. Available online: https://www.researchgate.net/publication/294087379_Soll_mein_Auto_so_fahren_wie_ich_-_Welchen_Fahrstil_praferieren_Fahrer_fur_die_Auslegung_automatisierter_Fahrzeugfunktionen (accessed on 12 March 2020).
- Elbanhawi, M.; Simic, M.; Jazar, R.N. Continuous path smoothing for car-like robots using b-spline curves. J. Intell. Robot Syst. 2015, 80, 23–56. [Google Scholar] [CrossRef]
- Salvucci, D.D.; Liu, A. The time course of a lane change: Driver control and eye-movement behavior. Transp. Res. Part F Traffic Psychol. Behav. 2002, 5, 123–132. [Google Scholar] [CrossRef]
- Heil, T.; Lange, A.; Cramer, S. Adaptive and efficient lane change path planning for automated vehicles. In Proceedings of the 2016 IEEE 19th International Conference on Intelligent Transportation Systems (ITSC), Rio de Janeiro, Brazil, 1–4 November 2016; pp. 479–484. [Google Scholar]
- Jachimczyk, B.; Dziak, D.; Czapla, J.; Damps, P.; Kulesza, W.J. IoT on-board system for driving style assessment. Sensors 2018, 18, 1233. [Google Scholar] [CrossRef]
- Kottenhoff, K. Driving Styles and the Effect on Passengers: Developing Ride Comfort Indicators. Stockholm. 2015. Available online: http://www.diva-portal.org/smash/get/diva2:898005/FULLTEXT01.pdf (accessed on 7 June 2019).
- Sagberg, F.; Selpi, Bianchi Piccinini, G.F.; Engström, J. A review of research on driving styles and road safety. Hum. Factors 2015, 57, 1248–1275. [Google Scholar] [CrossRef]
- Ericsson, E. Variability in urban driving patterns. Transp. Res. Part D Transp. Environ. 2000, 5, 337–354. [Google Scholar] [CrossRef]
- Bellem, H.; Klüver, M.; Schrauf, M.; Schöner, H.-P.; Hecht, H.; Krems, J.F. Can we study autonomous driving comfort in moving-base driving simulators? A validation study. Hum. Factors 2017, 59, 442–456. [Google Scholar] [CrossRef] [PubMed]
- Bellem, H.; Thiel, B.; Schrauf, M.; Krems, J.F. Comfort in automated driving: An analysis of preferences for different automated driving styles and their dependence on personality traits. Transp. Res. Part F Traffic Psychol. Behav. 2018, 55, 90–100. [Google Scholar] [CrossRef]
- Radke, T.; Lewandowitz, L.; Gauterin, F.; Kaczmarek, T. Operationalisation of human drivers’ subjective dynamics perception in automated longitudinally controlled passenger vehicles. IJVAS 2013, 11, 86. [Google Scholar] [CrossRef]
- Festner, M.; Eicher, A.; Schramm, D.H. Beeinflussung der Komfort- und Sicherheitswahrnehmung beim hochautomatisierten Fahren durch fahrfremde Tätigkeiten und Spurwechseldynamik. In Proceedings of the 11. Workshop Fahrerassistenz und Automatisiertes Fahren, Walting im Altmühltal, Germany, 29–31 March 2017. [Google Scholar]
- ISO 15622. Intelligent Transport Systems—Adaptive Cruise Control Systems—Performance Requirements and Test Procedures. 2018. Available online: https://www.iso.org/standard/71515.html (accessed on 12 March 2020).
- Regulation No 79 of the Economic Commission for Europe of the United Nations (UN/ECE)—Uniform Provisions Concerning the Approval of Vehicles with Regard to Steering Equipment, UNECE R79. 2008. Available online: https://eur-lex.europa.eu/legal-content/EN/TXT/?uri=CELEX%3A42008X0527%2801%29 (accessed on 12 March 2020).
- STEVENS, S.S. On the psychophysical law. Psychol. Rev. 1957, 64, 153–181. [Google Scholar] [CrossRef] [PubMed]
- Twomey, P.J.; Kroll, M.H. How to use linear regression and correlation in quantitative method comparison studies. Int. J. Clin. Pract. 2008, 62, 529–538. [Google Scholar] [CrossRef]
- Backhaus, K.; Erichson, B.; Weiber, R. Fortgeschrittene Multivariate Analysemethoden; Springer: Berlin/Heidelberg, Germany, 2015. [Google Scholar]
- Kraftfahr-Bundesamt. Statistik Verkehr in Kilometern (VK) Revisionsbericht. Flensburg. August 2019. Available online: https://www.kba.de/DE/Statistik/Kraftverkehr/VerkehrKilometer/vk_revisionsbericht_2019_pdf.pdf?__blob=publicationFile&v=6 (accessed on 19 September 2019).
- Kraftfahr-Bundesamt, Fahrerlaubnisbestand Im Zentralen Fahrerlaubnisregister (ZFER) Am 1 January 2019. Available online: https://www.kba.de/DE/Statistik/Kraftfahrer/Fahrerlaubnisse/Fahrerlaubnisbestand/fahrerlaubnisbestand_node.html (accessed on 19 September 2019).
- Hays, W.L. Statistics, 5th ed.; Wadsworth Thomson Learning: Belmont, CA, USA, 1994. [Google Scholar]
- Spiess, A.-N.; Neumeyer, N. An evaluation of R2 as an inadequate measure for nonlinear models in pharmacological and biochemical research: A Monte Carlo approach. BMC Pharmacol. 2010, 10, 6. [Google Scholar] [CrossRef]


© 2020 by the authors. Licensee MDPI, Basel, Switzerland. This article is an open access article distributed under the terms and conditions of the Creative Commons Attribution (CC BY) license (http://creativecommons.org/licenses/by/4.0/).