Article

Carbonation Process of Reinforced Concrete Beams under the Combined Effects of Fatigue Damage and Environmental Factors

1
School of Civil Engineering, Central South University, 68 Shaoshan South Road, Changsha 410082, China
2
National Engineering Laboratory for High Speed Railway Construction, Changsha 410082, China
3
Department of Civil Engineering, Xi’an Jiaotong University, Xi’an 710049, China
*
Authors to whom correspondence should be addressed.
Appl. Sci. 2020, 10(11), 3981; https://doi.org/10.3390/app10113981
Submission received: 8 May 2020 / Revised: 3 June 2020 / Accepted: 4 June 2020 / Published: 8 June 2020

Abstract

:
The carbonation process of reinforced concrete (RC) beams considering the combined effect of fatigue load and environmental factors was investigated experimentally in an environmental simulation chamber based on meteorological environmental data. Fourteen beams were constructed and tested, and a carbonation numerical model (CNM) considering medium transport and fatigue damage characteristics was proposed to simulate the carbonation process of RC beams. Based on the experimental results, CNM is extended to reveal the effects of ambient temperature, relative humidity, carbon dioxide concentration, and fatigue damage on the carbonation process of RC beams. The results showed that the change in the pore structure of concrete can directly and accurately characterize the effect of fatigue damage on the transport characteristics of concrete. The porosity of concrete substantially increased with increasing levels of fatigue damage. Although fatigue damage did not have a significant effect on the most probable pore radius of the concrete, the total pore volume of the most probable pore notably increased. The results showed that both the carbonation depth and fatigue damage exhibit a three-stage development law. The depth and rate of carbonation are related to concrete pores and macroscopic cracks. In the carbonation analysis of fatigue-damaged RC beams, the changes in both the pore structure and fatigue cracks caused by repeated fatigue loading on carbonation should be considered.

1. Introduction

The corrosion of steel bars is an important factor affecting the deterioration of reinforced concrete structures; this kind of corrosion is usually related to carbonation and chloride ingress [1,2]. In general, the deterioration process of concrete structures due to steel corrosion can be subdivided into two stages: the initiation stage and the propagation stage [3,4]. The propagation period is substantially shorter than the initiation period; hence, the initiation period is generally selected to estimate the durability and service life of concrete structures. Civil infrastructures, including railway bridges and highway bridges, are subjected to a large number of traffic loading cycles every day during their service life. It is generally believed that the damage accumulation of concrete caused by fatigue load is caused by the degradation of pore structure and the propagation of microcracks in concrete [5]. Moreover, the corrosion process initiates much earlier in damaged and cracked concrete than in uncracked concrete [6,7,8]. To predict the durability of a reinforced concrete (RC) structure, it is important to carry out necessary experiments and propose reasonable models that can be used to reveal the carbonation process in fatigue-damaged concrete and the subsequent consequences with regard to structural safety.
Carbonation is a complex physical and chemical process, in which carbon dioxide diffuses into concrete through complex pore structure and reacts with various active components at the same time [9,10]. A large amount of experimental and theoretical research has been performed to study the effects of material properties, pore size distribution, visible cracks, temperature, moisture content, and static loads on concrete carbonation [11,12,13,14,15,16]. In many civil infrastructures, including railway bridges and highway bridges, concrete is constantly subjected to both carbon dioxide penetration and repeated vehicle loads. However, few researchers have attempted to characterize the combined effects of carbon dioxide concentration and fatigue damage on concrete carbonation. Jiang et al. chose the residual strain of concrete as a fatigue damage index and proposed a fictitious distributed crack mode of fatigue-damaged concrete beams [17]. In another study, fast carbonation experiments were carried out to investigate the effects of uniaxial and eccentric fatigue loads, temperature, relative humidity, and carbon dioxide concentration on carbonation in fatigue-damaged concrete [18]. In this study, the residual strain of concrete was selected as an index to evaluate the fatigue damage state and characterize the effect of fatigue damage on concrete carbonation. However, in practice, residual strain is a macroscopic property of concrete that cannot accurately characterize the deterioration of the pore structure and the growth of microcracks in concrete. Furthermore, only a simplified fast carbonation test of fatigue-damaged prism specimens was carried out in this study, and an environmental simulation chamber based on meteorological environmental data was not available.
This paper aims to bridge the gap found in the studies referenced above with respect to the following issues:
  • Analyzing RC beams subjected to low fatigue damage, medium fatigue damage, and high fatigue damage;
  • Determining the deterioration in the pore structure from the accumulation of fatigue damage;
  • Experimentally investigating the carbonation process of RC beams under the combined effects of carbonation and fatigue damage in an environmental simulation chamber.
  • Creating a numerical model to simulate the carbonation process in RC beams considering the combined effects of carbonation and cyclic loading.
In this paper, the carbonation process of RC beams considering the combined effects of fatigue load and environmental factors was investigated experimentally in an environmental simulation chamber based on meteorological environmental data. Then, a carbonation numerical model (CNM) was developed to simulate the carbonation process of RC beams with microscale fatigue damage and macroscale cracks. After validating the CNM with experimental results, the CNM was extended to analyze the effects of temperature, relative humidity, carbon dioxide concentration, and fatigue damage on the carbonation process of RC beams.

2. Experimental Procedure

A concrete railway bridge will be affected by the combined effects of train loads and carbonation environment during its service period. Figure 1 shows that the bridge is subjected to the combined effects of dead load and carbonation environment when no trains are passing (time ti); then, when a train passes (time Ti), the bridge is subjected to the combined effects of the train load and carbonation environment. The fatigue damage of the structure corresponding to time Ti is Di, and the structural fatigue damage and the carbonation rate corresponding to time ti are Di−1 and Ri−1, respectively. Based on the service life characteristics of the abovementioned concrete railway bridge structure, the continuous performance evolution process was discretized according to the time history. In this paper, a test was designed to provide constant load and environment conditions in an environment chamber to simulate the combined dead load-environment effect. The fatigue load test was designed to simulate the combined train load-environment effect. The time Ti is much shorter than time ti; hence, the environmental effect can be neglected in the fatigue load test. Therefore, an optimized test procedure was proposed to study the carbonation process of concrete structures under the combined effects of train loads and environmental factors. First, the RC beams were subjected to different damage Di via the fatigue loading tests, and then the damaged RC beams were loaded with reinforced screws. Finally, the combined load-environment test was carried out in the artificial environment simulation chamber. By studying the carbonation mechanism and carbonation rate of RC beams under different levels of fatigue damage, the carbonation law and service life of concrete structures can be revealed considering the combined effects of the load and environmental factors.

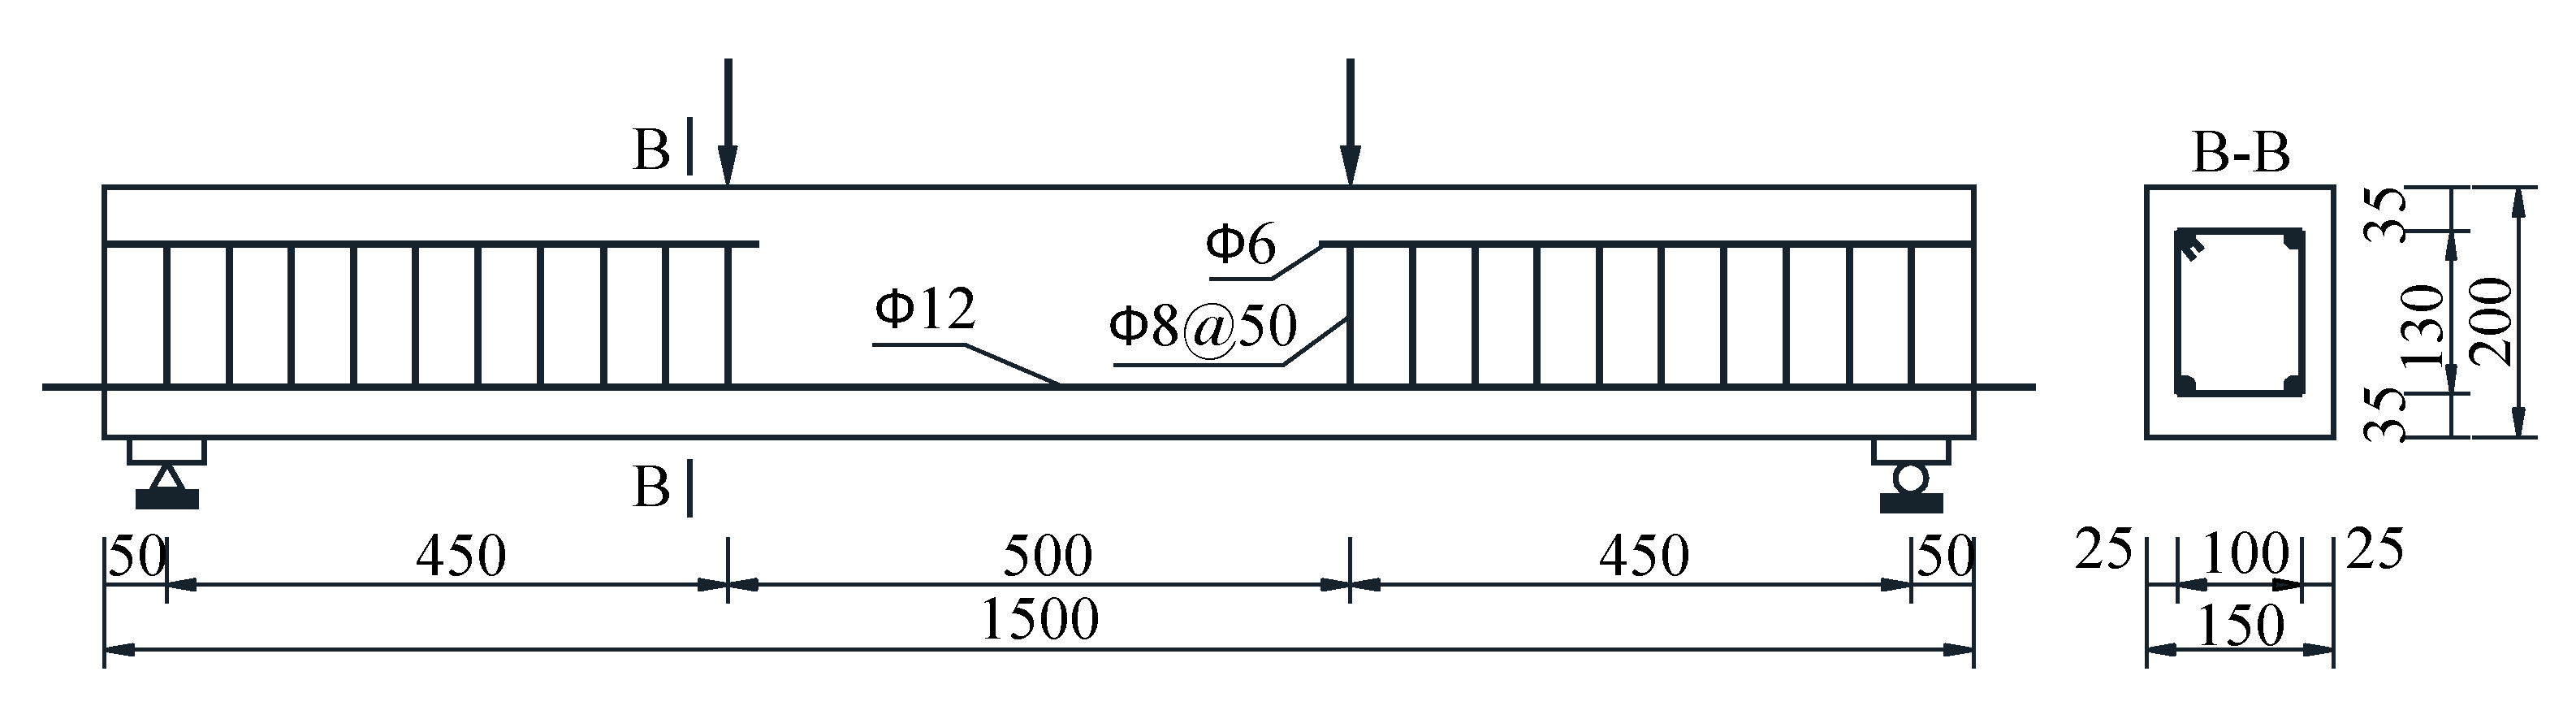
2.1. Materials and Specimens

Fourteen RC beams with dimensions of 150 × 200 × 1500 mm were designed and cast, including one static loading specimen and 13 fatigue loading specimens. Thirteen specimens were subjected to low fatigue damage, medium fatigue damage, and high fatigue damage, including five carbonation tests and five corrosion tests of steel bars. The details of the groups and loads are given in Table 1. The details of the corrosion test of the steel bars in the RC beams will be described in another paper. Ordinary Portland Cement (OPC) was used, natural river sand was used as the fine aggregate, and limestone gravel was used as the coarse aggregate, of which the maximum particle size was less than or equal to 20 mm. The mix proportion of concrete is shown in Table 2, and the location of the steel reinforcement in the RC beams is given in Figure 2. The reinforcing bars were extended an additional 50 mm past both sides of the beams to facilitate the measurement of steel corrosion in the RC beams. Two wires were welded along the bottom of the reinforcing steel bars and were drawn out from one side. All specimens were cured in a curing room for 28 day at 23 ± 2 °C with a relative humidity of 95%.

2.2. Fatigue Damage Test

Prior to casting the beams, strain gauges were attached to the tensile reinforcing steel bar at the midspan of the beam and at 200 mm on either side of the midspan. Before the test, five concrete strain gauges were placed on the mid span concrete surface across the beam height. Five linear variable displacement sensors (LVDTs) were used to record the deflection of the beam. Three LVDTs were installed in the middle of the span and 200 mm on either side of the span to record the vertical displacement. The remaining two LVDTs were installed on the top surface of the beam above the supports at both ends of the beam to record the vertical displacement and calculate the support settlement of the beam.
One beam was loaded monotonically to failure to determine the static capacity of the beam. Three beams were loaded cyclically to failure. The remaining five beams were loaded to various numbers of cycles to simulate damage caused by fatigue loading. Table 1 provides a summary of the specimens and different loading; the maximum load Pmax and minimum load Pmin applied to the specimens in the fatigue tests are presented in this table. The maximum loads were determined based on a percentage of the yield strength of the reference beam, which was determined from the static tests. At the beginning of the fatigue test, the specimen was first subjected to the mean load, and then, the load was varied sinusoidally with a constant amplitude at a frequency of 4 Hz. The cyclic test was interrupted periodically at a selected number of cycles, and a stationary cycle was applied between P max and zero.

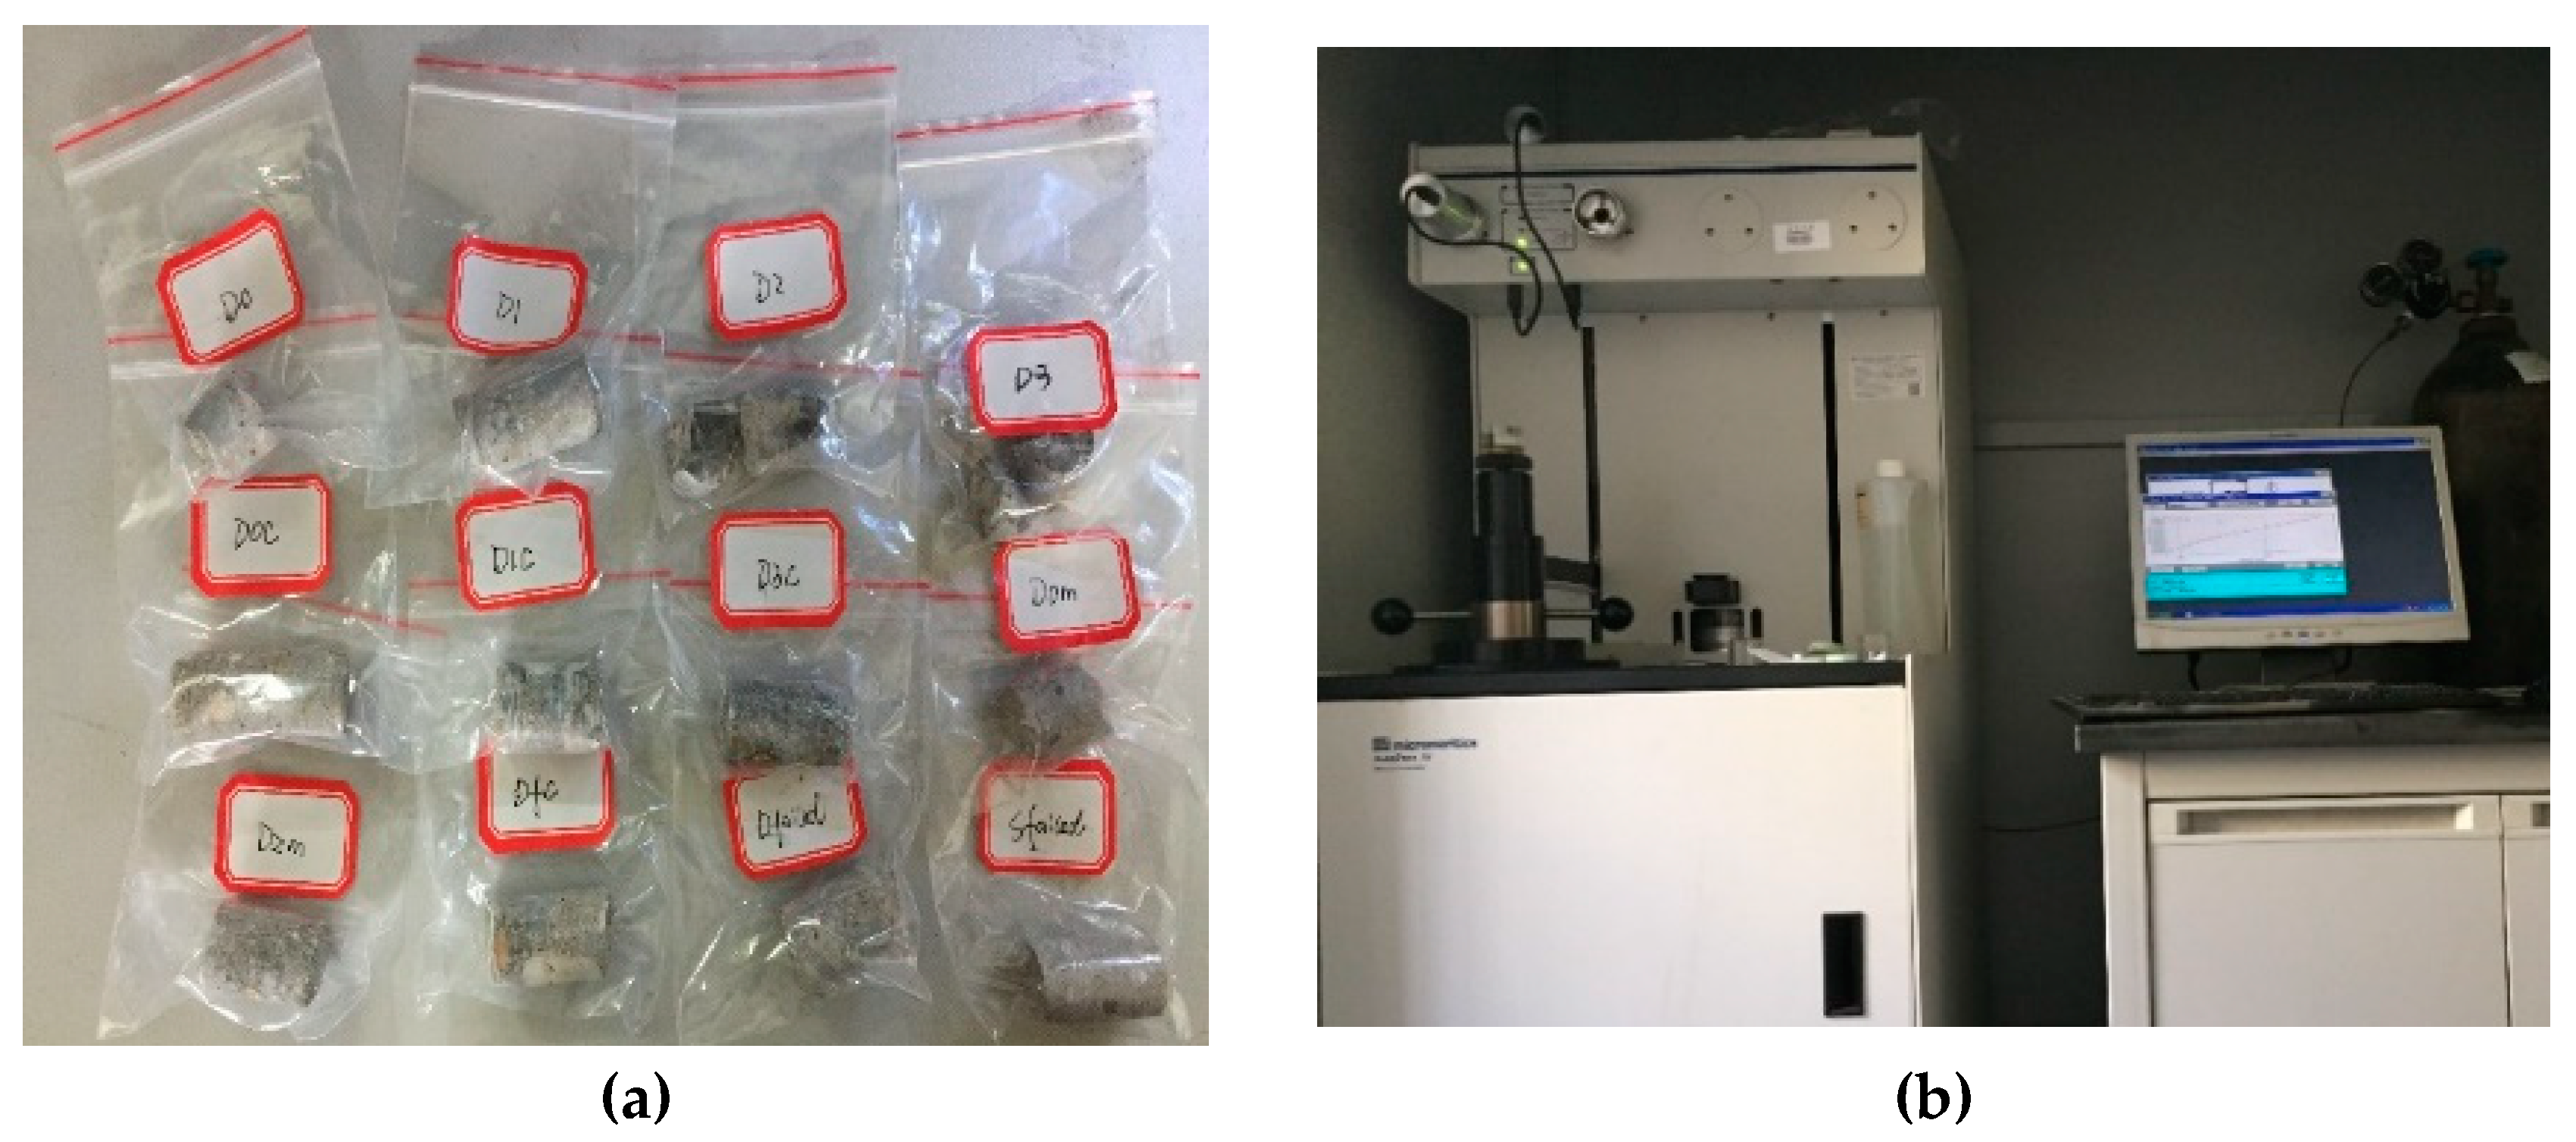
2.3. Mercury Intrusion Test

Specimens for microscale and mesoscale tests were cored from the maximum tensile zone of RC beams B2, B3, B4, and A2 after certain loading cycles, and then a diamond saw was used to cut out test samples with heights of 10–20 mm, as shown in Figure 3. Due to the sample size limitation of mercury intrusion meters, ordinary concrete cannot be directly used for testing. Therefore, the mortar without coarse aggregate was selected to test the pore volume. The selected samples were prepared and cleaned. Then, the samples were dried in a low-temperature oven at a temperature of 50 ± 1 °C to avoid the influence of the drying process on the pore structure. The selected samples were prepared, cleaned, and dried. The porosity and pore size distribution of damaged and undamaged concrete were measured with an AutoPore IV 9500 mercury intrusion meter, as shown in Figure 3b. The maximum pressure was 250 MPa, and the pore size that can be measured ranged from 5 nm to 103 µm. The applied surface tension of mercury was 0.480 N/m, and the wetting angle was 140°.

2.4. Carbonation Test

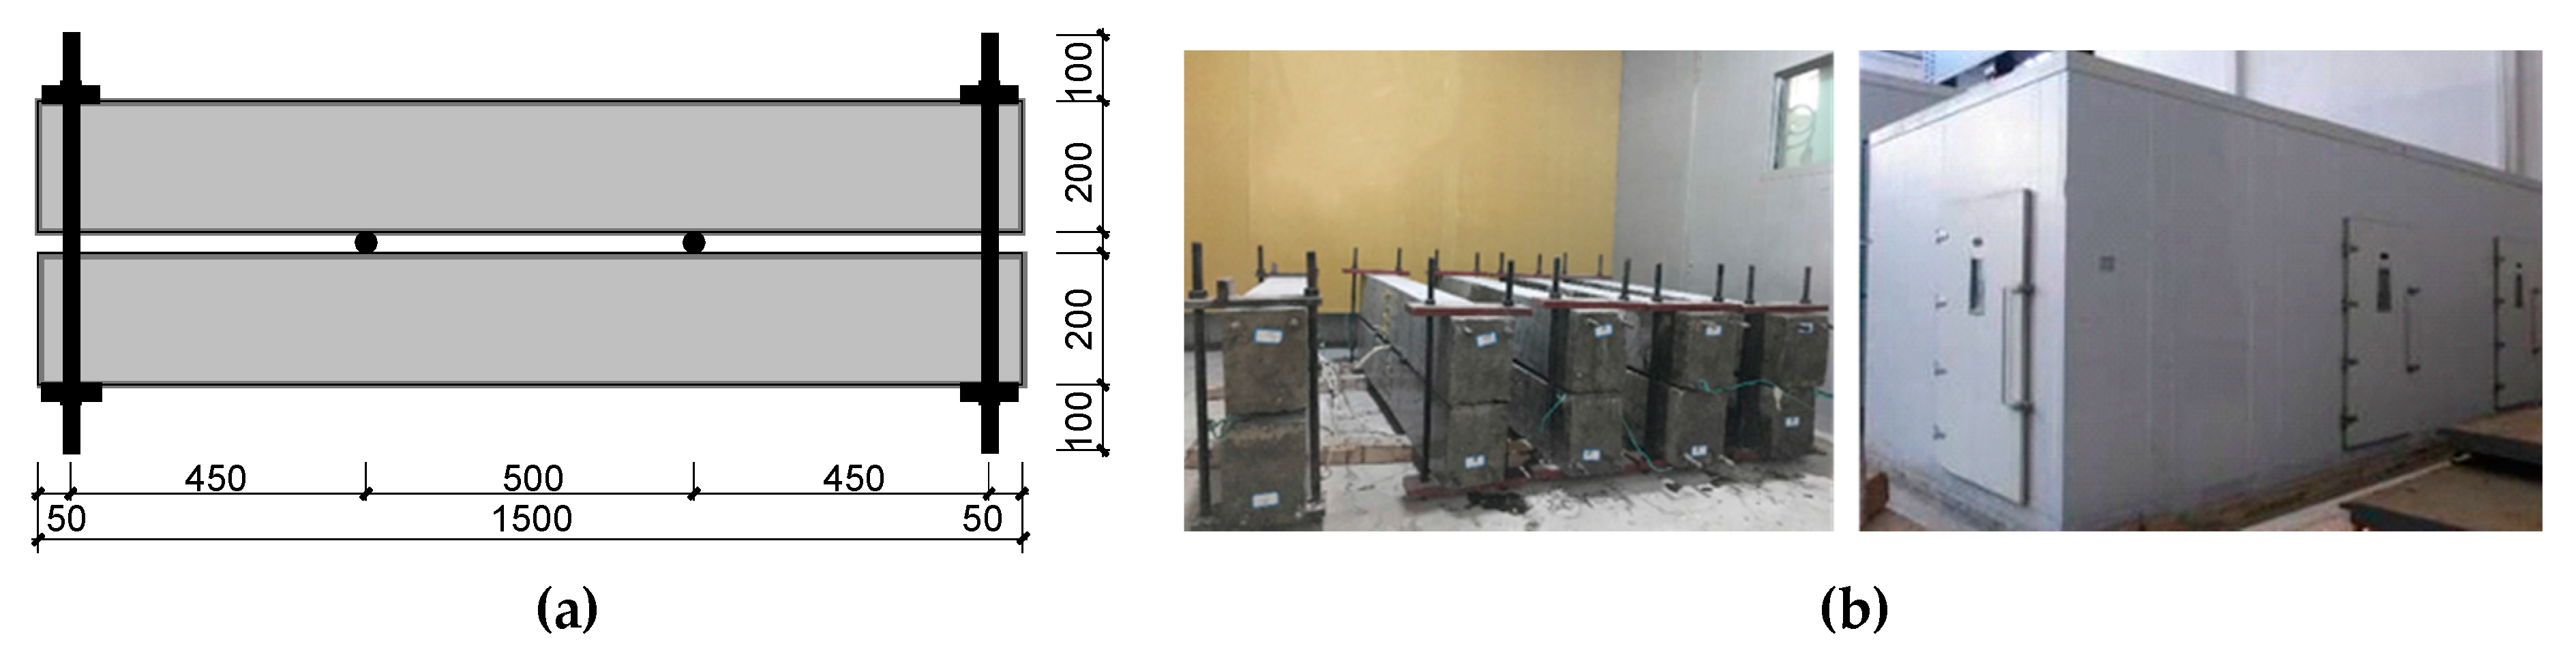
2.4.1. Artificial Accelerated Simulation Environment Test

After curing for 60 day, RC beams were predamaged at the midspan using a fatigue loading test. Two specimens were then loaded back-to-back, and the load was sustained up to the upper limit of the fatigue load by tightening the four bolts at both ends of the paired specimens. The loading device diagram is shown in Figure 4. Before the carbonation test, the samples were dried in the environmental chamber at a temperature of 50 ± 1 °C for 60 h. Then, five surfaces of each RC beam were sealed, leaving one tension damage surface exposed to the environment.
RC beams were predamaged at the midspan using a fatigue loading test. Two specimens were then loaded back-to-back, and the load was sustained up to the upper limit of the fatigue load by tightening the four bolts at both ends of the paired specimens. The loading device diagram is shown in Figure 4a. In the carbonation test, five surfaces of each RC beam were sealed, leaving one tension damage surface exposed to the environment.
To simulate the carbonation conditions of girders, a large-scale environmental chamber was constructed to contain the specimens, as shown in Figure 4b. A typical cycle of test environmental conditions was designed based on climatological data from a city in China. Statistical environmental information based on the meteorological data of this city during a calendar year is shown in Table 3. The monthly mean temperature and relative humidity are in the range of 5.2–29.8 °C and 72.1–75.7%, respectively. The atmospheric carbon dioxide concentration stays at approximately 350–440 ppm. The 12 months of the year are divided into low-temperature, medium-temperature, and high-temperature seasons; the corresponding average temperature and humidity conditions are given in Table 3.
In the existing carbonization test standards, the values of carbon dioxide concentration are not identical; for example, the carbon dioxide concentration is 20% ± 3%, 50% ± 5%, and 2% in the China National Standard (GB/T 50082-2009), French Standard (XP P18-458-2008), and Compliance Testing for Probabilistic Design Purposes (BE95-1347/R8 (1999-03)), respectively. Considering the similarity of the microenvironment inside the concrete structure between the realistic environment and the test environment and the acceleration and repeatability of the carbonation test, a test system of an artificial accelerated simulation environment was designed based on the meteorological data of the selected city, as shown in Table 4.

2.4.2. Concrete Carbonation Depth Test

The specimens were placed in the environmental chamber for 24, 48, 72, 96, and 120 days, and then the carbonation depth of the concrete was measured by the pH value and the phenolphthalein reagent method. The sampling locations on the specimens used to determine the carbonation depth are shown in Figure 5. At each location, two sample holes were dry drilled using a 20 mm diameter rotary impact drill. The powders were taken by continuous drilling from 0–5, 5–10, 10–15, 15–20, 20–25, 25–30, and 30–35 mm. Finally, the average pH value of the pore solution was measured in accordance with standard test methods [19]. Phenolphthalein was designed to measure the average carbonation depth of concrete.

3. Test Results and Analysis

3.1. Fatigue Behavior and Index of RC Beams

The fatigue behavior of RC beams with different loading cycles is illustrated in Figure 6. Figure 6a shows the relationship between the maximum crack width and the number of loading cycles. The results show that the maximum crack width initially exhibited a rapid increase, then remained relatively constant through a stable region, and finally increased suddenly just before specimen failure. The crack width in the first phase was approximately 0–0.15 mm, and the crack width in the second stage was approximately 0.15–0.25 mm. Further increases in the number of loading cycles led to a sharp increase in the crack width, which in turn led to fracturing of the steel bars. The bending crack starts from the bottom of the beam after thousands of cycles, and then propagates to the center of the beam with the increase of cycles. The average distance of the main cracks was approximately 80–120 mm in the second and third stages.
Figure 6b presents the bending stiffness of the beams with respect to the number of cycles. The degradation in stiffness associated with increasing the number of cycles also exhibits an apparent three-stage rule, similar to the trend observed in the crack development. In the first stage, the degradation in stiffness was notable; the bending stiffness of the beams was reduced by 20–30% in 10–15% of the fatigue life. During the second period, the stiffness degradation was relatively slow; the bending stiffness of the beams was reduced by 30–40% in 80% of the fatigue life. Additional loading cycles led to fracturing of the steel bars, which in turn led to a sharp increase in crack development and rapid degradation in stiffness.
Figure 6c,d presents the residual strains of the compressive concrete and tensile reinforcement bars with respect to the number of cycles, respectively. The residual strains of the concrete and reinforcing bars from the loading cycles accumulated in the first stage were approximately 100 × 10 6 150 × 10 6 and 200 × 10 6 600 × 10 6 , respectively. Following the second stage, the residual strain of the concrete increased approximately linearly as the number of cycles increased; then, the slope decreased rapidly, and the residual strains of the concrete and reinforcing bars increased to 550 × 10 6 600 × 10 6 and 600 × 10 6 1100 × 10 6 , respectively. The third rapid changing phase of residual strain normally occurred while the sample was approaching fatigue failure.

3.2. Pore Structure and Damage Index of Concrete

The pore distributions of concrete with different levels of fatigue damage are shown in Figure 7. The most probable pore diameter of the fatigue-damaged concrete specimens B2, B3, B4, and A2 was approximately 53 nm. The peak intensities were 0.138 mL/g (low damage n / N = 0.125 ), 0.171 mL/g (medium damage n / N = 0.25 ), 0.274 mL/g (high damage n / N = 0.75 ), and 0.329 mL/g (fatigue failed n / N = 1.0 ). n is the number of fatigue loading, N is the fatigue life of the beam. The peak strength of specimens B3, B4, and A2 was 23.91%, 98.55%, and 138.41% greater than that of the low fatigue-damaged specimen B2 ( n / N = 0.125 ), respectively, indicating that fatigue loading will increase the quantity and size of the pores.
According to the pore distribution of the concrete, the pore diameter of the concrete specimen can be divided into six regions: R1 region (5.5–10 nm), R2 region (10–50 nm), R3 region (50–100 nm), R4 region (100–1000 nm), R5 region (1000–10,000 nm), and R6 region (≥10,000 nm). Then, the RL region (5.5–10 nm) is defined as a small-porosity region, the RM region (10–50 nm) is a medium-porosity region, and the RB region (≥ 50 nm) is a large-porosity region. The cumulative porosity distribution of the fatigue-damaged concrete specimens (B2, B3, B4, and A2) is shown in Figure 8. Figure 8a shows that as the number of fatigue load cycles increases, the pore structures of different regions exhibit different changes. The ratios of regional porosity to total porosity in the R1, R2, R3, R4, R5, and R6 regions are 5.5–6.4%, 25.4–30.5%, 23.6–35.1%, 17.5–19.3%, 5.9–8.3%, and 8.8–11%, respectively; the fluctuation in these values are 0.9%, 5.1%, 11.5%, 1.8%, 2.4%, and 2.2%, respectively. The variation in the porosity of the R3 region is the most substantial. Figure 8b shows that the proportions of small, medium, and large pores to total pores are 5.5–6.4%, 25.4–30.5%, and 63.1–69.1%, respectively. As the number of fatigue loading cycles increases, the proportion of small and medium pores decreases by 3.1% and 16.7%, respectively, and that of large pores increases by 8.4%. The experimental results show that the proportion of large pores in concrete is greater than that of the small and medium pores. Furthermore, as the number of fatigue loading cycles increases, the quantity and size of the pores will increase, and the change in porosity in the first two stages of fatigue damage is more notable than that in the third stage.
Figure 9 shows that the porosity of the fatigue-damaged concrete specimens B2, B3, B4, and A2 is 8.76%, 8.84%, 10.20%, and 10.97%, respectively. x is the fatigue damage ratio, y is the concrete porosity, R is the correlation coefficients of the best fit. The porosity of the B2, B3, and B4 specimens is 0.91%, 16.44%, and 25.23% greater than that of the slightly damaged specimen B2 ( n / N = 0.125 ), respectively, which indicates that fatigue loading can significantly increase the porosity of concrete.
The experimental results show that the macroscopic indexes, such as maximum crack width, beam stiffness, concrete residual strain, steel bar residual strain, and pore structure, exhibit a certain evolutionary law with the development of fatigue damage. Although macroscopic indexes can also reflect the change in the microstructure of concrete materials to a certain extent, these indexes are not the only influencing factors, and there is no direct relationship between the different indexes. The pore structure of concrete can directly reflect the material transport characteristics. Previous studies have shown that the transport properties of concrete are related to porosity, pore size distribution, pore connectivity, and pore tortuosity. The test results show that the porosity and pore size distribution of concrete increases with increasing fatigue damage. Fatigue loading will increase the quantity and size of the pores, thereby increasing the total porosity. The effect of fatigue damage on the peak pore size (the most probable pore size) of concrete is unknown. However, it is clear that the fatigue damage will notably increase the peak strength. Therefore, it is more direct, scientific, and reasonable to select porosity changes and harmful cracks to represent the fatigue damage of concrete.

3.3. Carbonation Test of RC Beams

The carbonation depths of concrete beams B0–B4 determined by phenolphthalein reagent titration and a pH meter are shown in Figure 10. The phenolphthalein reagent titration method roughly estimates the depth of complete carbonation, while the pH meter method may determine the complete carbonation area, partial carbonation area, and non-carbonation area in the concrete, revealing the carbonation process of concrete. When the pH is less than 9.0, the corresponding concrete thickness is the complete carbonation depth in Figure 10b. Figure 10 shows that the carbonation depth measured by the pH meter and phenolphthalein reagent titration is not exactly the same, but the overall development trend is similar. Like the existing literature, the carbonation depth of fatigue-damaged concrete still follows square root of time law by the phenolphthalein reagent titration method. The carbonation depth measured by phenolphthalein reagent titration is larger than that measured by the pH meter, and the ratio of the two methods is approximately 0.8–1.0. The graphs show that the carbonation process exhibits a two-stage trend. The carbonation depths of specimens B0, B1, B2, B3, and B4 at 48 day are 9.89, 11.72, 13.25, 15.58, and 18.52 mm, respectively. The carbonation depths of the fatigue-damaged specimens B1, B2, B3, and B4 are 18.50%, 33.97%, 57.53%, and 87.26% greater than the carbonation depth of the undamaged specimen B0, respectively. During the carbonation time of 48–96 d, the carbonation depths of specimens B0, B1, B2, B3, and B4 are 7.09, 7.13, 10.53, 11.28, and 13.54 mm, respectively. The carbonation depths and carbonation rates of the fatigue-damaged specimens B1, B2, B3, and B4 are 1.14%, 48.527%, 59.10%, and 90.97% greater than those of the undamaged specimen B0, respectively. Moreover, the results show that the carbonation rates of specimens B0, B1, B2, B3, and B4 are 40.91%, 39.46%, 20.48%, 27.69%, and 27.16% less in the second stage than in the first stage, respectively.
The carbonation depths and rates of concrete at pH < 11.5 in specimens B0–B4 are shown in Figure 11. Except for 120 days (the carbonation depth of specimens B2–B4 exceeded the thickness of the concrete protective layer by 35 mm), the carbonation rate at other times exhibits three stages with the development of fatigue damage. In the first stage (0–0.2 n/N), the concrete carbonation rate increased rapidly, corresponding to increases of 51.53%, 41.89%, 39.87%, and 32.39% in 24, 48, 72, and 96 day, respectively. In the second stage (0.2–0.8 n/N), the change in the concrete carbonation rate was relatively gentle and increased by 9.43%, 8.08%, 5.43%, and 10.6% at 24, 48, 72, and 96 days, respectively. In the third stage (0.8–1.0 n/N), the carbonation rate of concrete increased sharply and increased 61.20%, 21.00%, 19.70%, and 14.98% at 24, 48, 72, and 96 days, respectively. The results showed that fatigue damage not only increased the depth of complete carbonation but also increased the partial depth and rate of carbonation. The rate of carbonation decreased with increasing carbonation time.
A comparison of Figure 9 and Figure 11 shows that the relationship between carbonation depth and fatigue damage exhibits a three-stage development rule, while the relationship between porosity and fatigue damage exhibits a linear increasing relationship, resulting in different development trends. Fatigue loading causes an increase in concrete porosity and the formation of macro- and microcracks in the concrete structure. The depth and rate of concrete carbonation are related to both the porosity and macro and microcracks of concrete, so the carbonation depth exhibits a development rule that is not exactly the same as that of the porosity. Therefore, in the carbonation analysis of fatigue-damaged concrete beams, the effects of the pore structure and cracks on carbonation should be taken into account.

4. Numerical Modeling of the Carbonation Process in Fatigue-Damaged RC Beams

4.1. Modeling of Carbonation in Fatigue-Damaged RC Beams

The transport process of carbon dioxide medium in concrete is essentially the process of gas transfer in the pores, aggregate edges, and cracks of porous media. The main factors driving the medium transport in porous media include the nonuniform distribution of the chemical field in the pores, the attraction of the electric field, and the seepage and migration movement of the pore fluid. Under these factors, a series of basic physical and chemical processes will occur during medium transport (e.g., diffusion, convection, reaction, and electromigration). The one-dimensional medium transport system is shown in Figure 12. The mass transfer process of the system can be expressed by the transport flux, i.e., the mass of material flowing per unit area per unit time.
One-dimensional steady-state transport in the system can be defined by the Nernst–Plank equation [20], as shown hereafter:
J = D C x + C v z F D C R T φ x
The parameters J 1 , J 2 , and J 3 in Equation (2) are defined as follows:
J 1 = D C x J 2 = C v J 3 = z F D C R T φ x
where J 1 is the diffusion flux ( mol / ( m 2 · s ) ), J 2 is the convection flux ( mol / ( m 2 · s ) ), J 3 is the electromigration flux ( mol / ( m 2 · s ) ), D is the diffusion coefficient ( m 2 / s ), C is the molar concentration ( mol / m 3 ), v is the convection velocity ( m / s ), z is the ion charge, F is the Faraday constant (96,500 C/mol), R is the gas constant (8.314 J / ( mol · K ) ), T is the absolute temperature (K), and φ is the electric field potential (V).
For the nonsteady state process in Figure 12, the flux into and out of the microbody are J x and J x + d x , respectively. Hence, the following expression exists for the microelement:
Δ m = ( J x J x + d x ) d A Δ t
For concrete materials, the porous medium solid phase does not transport substances, so the medium transport in the microelement is mainly carried out in pores and cracks, and the inner surface of the pores also adsorbs or reacts to consume some substances, and the total amount of substances accumulated in time phase Δ t is as follows:
Δ m = C · ( ϕ s d A d x ) + C b · ( d A d x ρ d )
where C is the molar concentration of the material (mol/m3), C b is the mass concentration of reaction consumption or adsorption binding in the pores (mol/kg), ρ d is the dry density of concrete (kg/m3), ϕ is the porosity of concrete, and s is the pore saturation of concrete.
By combining Equations (3) and (4), the law of conservation of matter can be expressed as follows:
C · ( ϕ sd A d x ) + C b · ( dAd x ρ d ) = ( J x J x + d x ) d A Δ t
When Δ t 0 , d x 0 . Therefore, Equation (5) can be simplified as follows:
t ( ϕ s C ) + t ( C b ρ d ) = J x
By introducing Equation (1) into Equation (6), a general mass transfer equation considering the combination of multiple driving mechanisms, such as diffusion, convection, binding, and electromigration, can be obtained:
t ( ϕ s C ) = x ( D C x ) x ( C v ) t ( C b ρ d ) + x ( z F D C R T φ x )
By ignoring the effects of convection and electric field, the following expression can be obtained:
t ( ϕ s C ) = x ( D C x ) t ( C b ρ d )
Considering the adsorption/reaction rate, the equation of carbon dioxide transport in concrete can also be rewritten as follows:
( ϕ ( 1 s ) [ CO 2 ] ) t = x ( D d [ CO 2 ] x ) Q
where [ CO 2 ] is the molar concentration of carbon dioxide (mol/m3), Q is the total consumption rate of carbonation reaction of concrete, D d is the effective diffusion coefficient of carbon dioxide of damaged concrete (m2/s), ϕ is the porosity of concrete, and s is the pore saturation of concrete.

4.1.1. Effective Diffusion Coefficient of Carbon Dioxide in Fatigue-Damaged Concrete

The carbonation tests of fatigue-damaged RC beams in Section 3 show that as the number of fatigue loading cycles increases, the fatigue damage of RC beams generally exhibits a three-stage rule. Fatigue loading will cause an increase in concrete porosity and cracking in the pure bending zone of RC beams. The maximum crack width in the first two stages of fatigue damage is between 0 and 0.25 mm, and the spacing of the main cracks is relatively stable. The carbonation process of RC beams is related to the pore structure and cracks in concrete. Based on the model of crack distribution in an RC beam and the theory of a two-hole medium, a new model is proposed to describe the carbon dioxide transport process in damaged, cracked RC beams, as shown in Figure 13. The length of the pure bending section of an RC beam is L before fatigue loading and L + w i after fatigue damage cracking, where the crack spacing and width are l m and w m , respectively. It is assumed that the total amount of carbon dioxide transport in fatigue-damaged RC beams is composed of the amount of carbon dioxide transport in damaged, uncracked concrete and that in the distributed cracks.
The total diffusion flux of carbon dioxide in the cracked RC beam can be expressed as follows:
{ J = J p A p + J c A c A c + A p J p = D p [ CO 2 ] x J c = D c [ CO 2 ] x
where J , J c , and J p are the total diffusion flux of carbon dioxide in damaged RC beams, the diffusion flux of carbon dioxide in cracks, and the diffusion flux in the uncracked concrete pore ( mol / ( m 2 · s ) ), respectively, and Ac and AP are the area of vertical cracks and the area of uncracked concrete, respectively.
The effective diffusion coefficient is derived from Equations (2) and (10):
D d = D p L ( L + Δ L ) + D c w i ( l i + w i )
where D d is the effective diffusion coefficient of carbon dioxide in fatigue-damaged concrete, Dc is the diffusion coefficient of carbon dioxide gas in concrete cracks, and D p is the diffusion coefficient of carbon dioxide gas in damaged, uncracked concrete.
Since the total width of the crack Δ L is much smaller than the length L of the pure bending section of the beam, Equation (11) can be simplified as follows:
D d = D p + w m l m D c
where w m and l m are the average crack width and spacing of RC beams under fatigue loading, respectively.
The experimental results show that the diffusion of carbon dioxide in concrete is closely related to the temperature, humidity, and pore structure. The effective diffusion coefficient of carbon dioxide in fatigue-damaged concrete can be expressed as follows:
D p = f ( R H ) f ( T ) f ( p ) D 0
where f ( R H ) , f ( T ) , and f ( p ) represent the factors influencing the relative humidity, temperature, and fatigue damage, respectively.
Papadakis [21] proposed a classical calculation model of the carbon dioxide diffusion coefficient considering the influence of concrete porosity and relative humidity (Papadakis et al., 1992). The expression of the carbon dioxide diffusion coefficient D 0 for undamaged concrete was given as follows:
D 0 = 1.64 × 10 6 · ϕ 1.8 · ( 1 R H ) 2.2
where ϕ is the porosity of undamaged concrete and RH is the relative humidity of the environment.
Song [22] presented the effect of temperature on the carbonation rate using the Arrhenius equation:
f ( T ) = exp [ U R gas · ( 1 T 0 1 T ) ]
where T 0 is the standard temperature of the natural environment (298.15 K); T is the actual absolute temperature (K); U is the activation energy of carbon dioxide gas, which can be regarded as a constant at 20–0 °C (8500 Cal / ( mol · K ) ); R gas is the ideal gas constant.
According to the experimental data in this paper, the regression results are as follows:
f ( p ) = 1 + 0.311 d
where d is the damage degree of damaged concrete beams ( 0 d 1 ).
From Equations (13)–(16), the effective diffusion coefficient of carbon dioxide in fatigue-damaged, uncracked concrete is obtained as follows:
D p = 1.64 × 10 6 · ( ϕ f ( p ) ) 1.8 · ( 1 R H ) 2.2 exp [ U R gas · ( 1 T 0 1 T ) ]
Jiang et al. [17] expressed the diffusion coefficient of carbon dioxide in cracks as follows:
D c = ( 1 δ ) D air + δ D agg
where D air is the diffusion coefficient of carbon dioxide in air, D agg is the diffusion coefficient of carbon dioxide in aggregate, and δ is the proportion of aggregate in the crack width space (0.15), which is related to the aggregate distribution of concrete.
The test results show that the fatigue loading has little effect on the main crack spacing. It is assumed that the average crack spacing of the beam remains unchanged in the fatigue loading process. The average crack spacing is calculated as follows [23]:
l m = λ ( 1.9 h c + 0.08 d eq / ρ te )
where h c is the thickness of the protective layer (mm), d eq is the equivalent diameter of the reinforcement in the tension zone (mm), ρ te is the reinforcement ratio of the tensile reinforcement, and λ is the influence coefficient of the average crack spacing considering the effects of fatigue loading.
Based on the fatigue test results of RC beams, the average crack width of the beam under fatigue loading is obtained as follows:
w m = ( 0.891 + 0.1123 ln N ) w m 0
where w m 0 is the initial average crack width of the RC beams.

4.1.2. Carbonation Reaction Rate of Fatigue-Damaged Concrete

The total carbonation reaction rate of concrete is expressed as follows [24,25]:
Q = 3 r C , C 3 S + 2 r C , C 2 S + r C , CH + 3 r C , CSH
where r C , i ( i = C 3 S , C 2 S , CH , CSH ) is the rate of carbonation of alkaline active substances.
The carbonation reaction rate of each component can be calculated as follows [26,27]:
r C , i = k C , i · [ i ] · [ CO 2 ]
where [ CO 2 ] is the molar concentration of carbon dioxide gas in the concrete pore, [ i ] is the molar concentration of the substances involved in the reaction, and k C , i ( i = C 3 S , C 2 S , CH , CSH ) is the rate constant of the carbonation reaction. Fatigue damage can cause changes in the volume and pore structure of concrete, but the change in the volume of concrete caused by fatigue damage is very small, and the carbonation reaction rate is mainly determined by the nature of the reaction itself and is less affected by changes in pore size. Therefore, the influence of fatigue damage on the carbonation reaction rate is neglected.

4.1.3. Saturation of Concrete

The pore saturation S of concrete is the percentage of water in the pore volume of concrete, which is closely related to the pore structure of the material and the relative humidity in the external environment. The unsaturated part of the pore determines the diffusion rate of carbon dioxide to the interior. Moreover, the existing pore water part in the pore is used as the place where various chemical reactions take place. Based on the experimental results reported in the literature [28], the relationship between relative humidity and pore water saturation can be obtained by regression:
s = { R H 0.25 0.5 R H 0.9 0.9 0.9 R H 0.95

4.2. Carbonation Simulation of Fatigue-Damaged RC Beams

4.2.1. Initial and Boundary Conditions

Equation (9) shows that the carbonation equation of fatigue-damaged, cracked RC beams is as follows:
{ f ( P ) ϕ ( 1 s ) [ CO 2 ] } t = x ( D d [ CO 2 ] x ) Q
Carbon dioxide transport in the cross section of RC beams is shown in Figure 14.
The boundary conditions of the carbonation model are as follows. First, x = 0 from the exposed surface of the bottom of the beam (h direction):
[ C O 2 ] = [ C O 2 ] 0
The other boundary conditions involve insulated surfaces (except bottom of beam):
[ CO 2 ] x = 0
where [ C O 2 ] 0 is the molar concentration of carbon dioxide in the environment.
The initial conditions are as follows:
{ [ CO 2 ] = 0 [ CH ] = [ CH ] 0 [ CSH ] = [ CSH ] 0 [ C 2 S ] = [ C 2 S ] 0 [ C 3 S ] = [ C 3 S ] 0
where [ i ] 0 (i = C 3 S , C 2 S , CH, and SH) is the initial carbide concentration, which can be calculated by the chemical composition of cement paste, the mixing ratio of concrete, and the hydration time according to the hydration reaction theory.

4.2.2. Determination of the Carbonation Depth

By solving the carbonation equation (Equation (24)), the spatial and temporal distribution of CO2 concentration inside the concrete can be obtained, through which the pH value of the pore solution can be determined, and finally, the carbonation depth of the concrete is determined according to the pH value. According to the results of the carbonation tests in Section 3, pH = 9.0 is selected as the critical value for the determination of carbonation depth. Han [27] proposed the following relationship between the CO2 gas concentration and the pH value of the pore solution:
[ CO 2 ] = 10 pH + 2 [ CH ] aq K water 10 pH K 0 H · K a 10 pH + 2 K a K b 10 2 pH + K a 10 pH + K a K b
where [ CH ] aq is the concentration of calcium hydroxide in the pore solution, K 0 is the ratio of carbon dioxide to carbonic acid in solution (1.7 × 10⁻³), K a is the first ionization constant of carbon dioxide (4.6 × 10⁻⁷), K b is the second ionization constant of carbon dioxide (4.69 × 10⁻¹¹), K water is the ionization constant of water (10−14), and H is the Henry constant (0.8317 at 298.15 K). For instance, at 298.15 K and pH = 9, the concentration of carbon dioxide is 6.7835 × 10⁻⁴ mol/m3.

4.2.3. Numerical Simulation of the Carbonation Process in Fatigue-Damaged RC Beams

The carbonation process of fatigue-damaged RC beams is simulated numerically with MATLAB based on the carbonation model of fatigue-damaged RC beams proposed in this paper. The numerical simulation flowchart for the carbonation process of fatigue-damaged RC beams is shown in Figure 15.
The specific steps are as follows:
Step 1: Input the geometric parameters of the RC beams, the parameters of the concrete material, the damage and cracking state of the beams, the parameters of the external environment, etc.;
Step 2: Calculate the parameters, such as the effective diffusion coefficient of carbon dioxide of damaged concrete D d , the pore saturation of concrete s , the porosity of concrete ϕ , and the total consumption rate of carbonation reaction of concrete Q;
Step 3: Set and define the initial conditions (Equation (27)) and boundary conditions (Equations (25) and (26)) for calculating the carbonation equation (Equation (24));
Step 4: Solve the carbonation equation (Equation (24)) of fatigue-damaged RC beams and determine whether the solution converges;
Step 5: End the program and output the information such as the carbon dioxide distribution, the carbonation depth, and the corresponding parameters.

4.3. Experimental Verification

The numerical simulation results of the carbonation depth of RC beams are compared with the experimental results, as shown in Figure 16. The comparison shows that the carbonation model proposed in this paper can accurately reflect the carbonation process of fatigue-damaged RC beams.

5. Model Application

5.1. Effect of Environmental Temperature on the Carbonation of Fatigue-Damaged RC Beams

Figure 17 shows the effect of environmental temperature on the carbonation of fatigue-damaged RC beams. The relative humidity of the environment is 70%, and the concentration of carbon dioxide is 15%. The range of the simulation temperature is from 5 to 55 °C, and the fatigue damage degrees of beams AF0, AF1, AF2, AF3, and AF4 are 0, 0.2, 0.4, 0.6, and 0.8, respectively. When the environmental temperature rises from 5 to 15, 25, and 35 °C and the specimens are carbonized for 120 day, the carbonation depth and rate increase by 37.62%, 75.03%, and 119.76% for undamaged specimen AF0, by 30.40%, 69.82%, and 109.62% for low fatigue-damaged specimen AF1, by 30.36%, 66.27%, and 109.91% for medium fatigue-damaged specimen AF2, and by 30.41%, 66.98%, and 109.42% for severe fatigue-damaged specimen AF4, respectively. When the environmental temperature rises from 5 to 15 °C and the fatigue damage degree develops from 0 to 0.2, 0.4, and 0.8, the carbonation depth and rate increase by 62.25%, 85.93%, and 133.29%, respectively. When the environmental temperature rises from 5 to 25 °C and the fatigue damage degree develops from 0 to 0.2, 0.4, and 0.8, the carbonation depth and rate increase by 111.30%, 137.14%, and 198.71%, respectively. When the temperature rises from 15 to 35 °C and the fatigue damage degree develops from 0 to 0.2, 0.4, and 0.8, the carbonation depth and rate increase by 89.53%, 117.55%, and 172.22%, respectively.
The results show that the carbonation depth and rate of undamaged and damaged beams increase nonlinearly with increasing environmental temperature. The higher the temperature is, the faster the carbonation depth and rate increase, and the fatigue damage will notably increase the carbonation depth and rate of RC beams. The increase in temperature accelerates the diffusion and reaction of CO2 in concrete. The increase in porosity and cracks caused by fatigue loading increases the permeability of RC beams and increases the transport rate of CO2 in concrete. However, note that the carbonation reaction is an exothermic process, and excessive temperature will delay the carbonation reaction.

5.2. Effect of Relative Humidity on the Carbonation of Fatigue-Damaged RC Beams

Figure 18 shows the effect of relative humidity on the carbonation of fatigue-damaged RC beams. The environmental temperature is 15 °C and the carbon dioxide concentration is 15%. The range of relative humidity is from 55.0% to 95.0%, and the fatigue damage degrees of beams BF0, BF1, BF2, BF3, and BF4 are 0, 0.2, 0.4, 0.6, and 0.8, respectively. When the environmental relative humidity increased from 55.0% to 65.0%, 75.0%, and 95.0% and the specimens were carbonized for 120 day, the carbonation depth and rate increased by 24.62%, 46.76%, and 79.99% for undamaged specimen BF0, by 30.40%, 69.82%, and 109.62% for low fatigue-damaged specimen BF1, by 24.26%, 48.46%, and 80.9% for medium fatigue-damaged specimen BF2, and by 24.18%, 47.66%, and 80.62% for severe fatigue-damaged specimen BF4, respectively. When the environmental relative humidity increased from 55.0% to 65.0% and the fatigue damage degree developed from 0 to 0.2, 0.4, and 0.8, the carbonation depth and rate decreased by 9.97%, 2.44%, and 28.67%, respectively. When the environmental relative humidity increased from 55.0% to 75.0% and the fatigue damage degree developed from 0 to 0.2, 0.4, and 0.8, the carbonation depth and rate decreased by 38.74%, 29.58%, and 11.18%, respectively. When the environmental relative humidity increased from 65.0% to 95.0% and the fatigue damage degree developed from 0 to 0.2, 0.4, and 0.8, the carbonation depth and rate decreased by 70.01%, 65.37%, and 56.37%, respectively.
The results show that the carbonation depth and rate of undamaged and damaged beams exhibit a nonlinear decreasing trend with increasing relative humidity. The higher the relative humidity is, the slower the increase in carbonation depth and rate, and the fatigue damage will significantly increase the carbonation depth and rate of RC beams. The environmental relative humidity affects CO2 diffusion in concrete. The lower the relative humidity of the environment is, the lower the saturation of pore water in concrete. Most of the micropores in concrete are filled with gas, which increases the diffusion rate of CO2 in concrete. The increase in porosity and cracks caused by fatigue loading increases the permeability of RC beams and increases the transport rate of CO2 in concrete. Furthermore, relative humidity also affects the chemical reaction rate of concrete carbonation. When concrete is very dry, the carbonation reaction cannot be carried out. If the environmental relative humidity is excessively high, because concrete carbonation itself is a process of releasing water, the water generated cannot be released and will inhibit further carbonation.

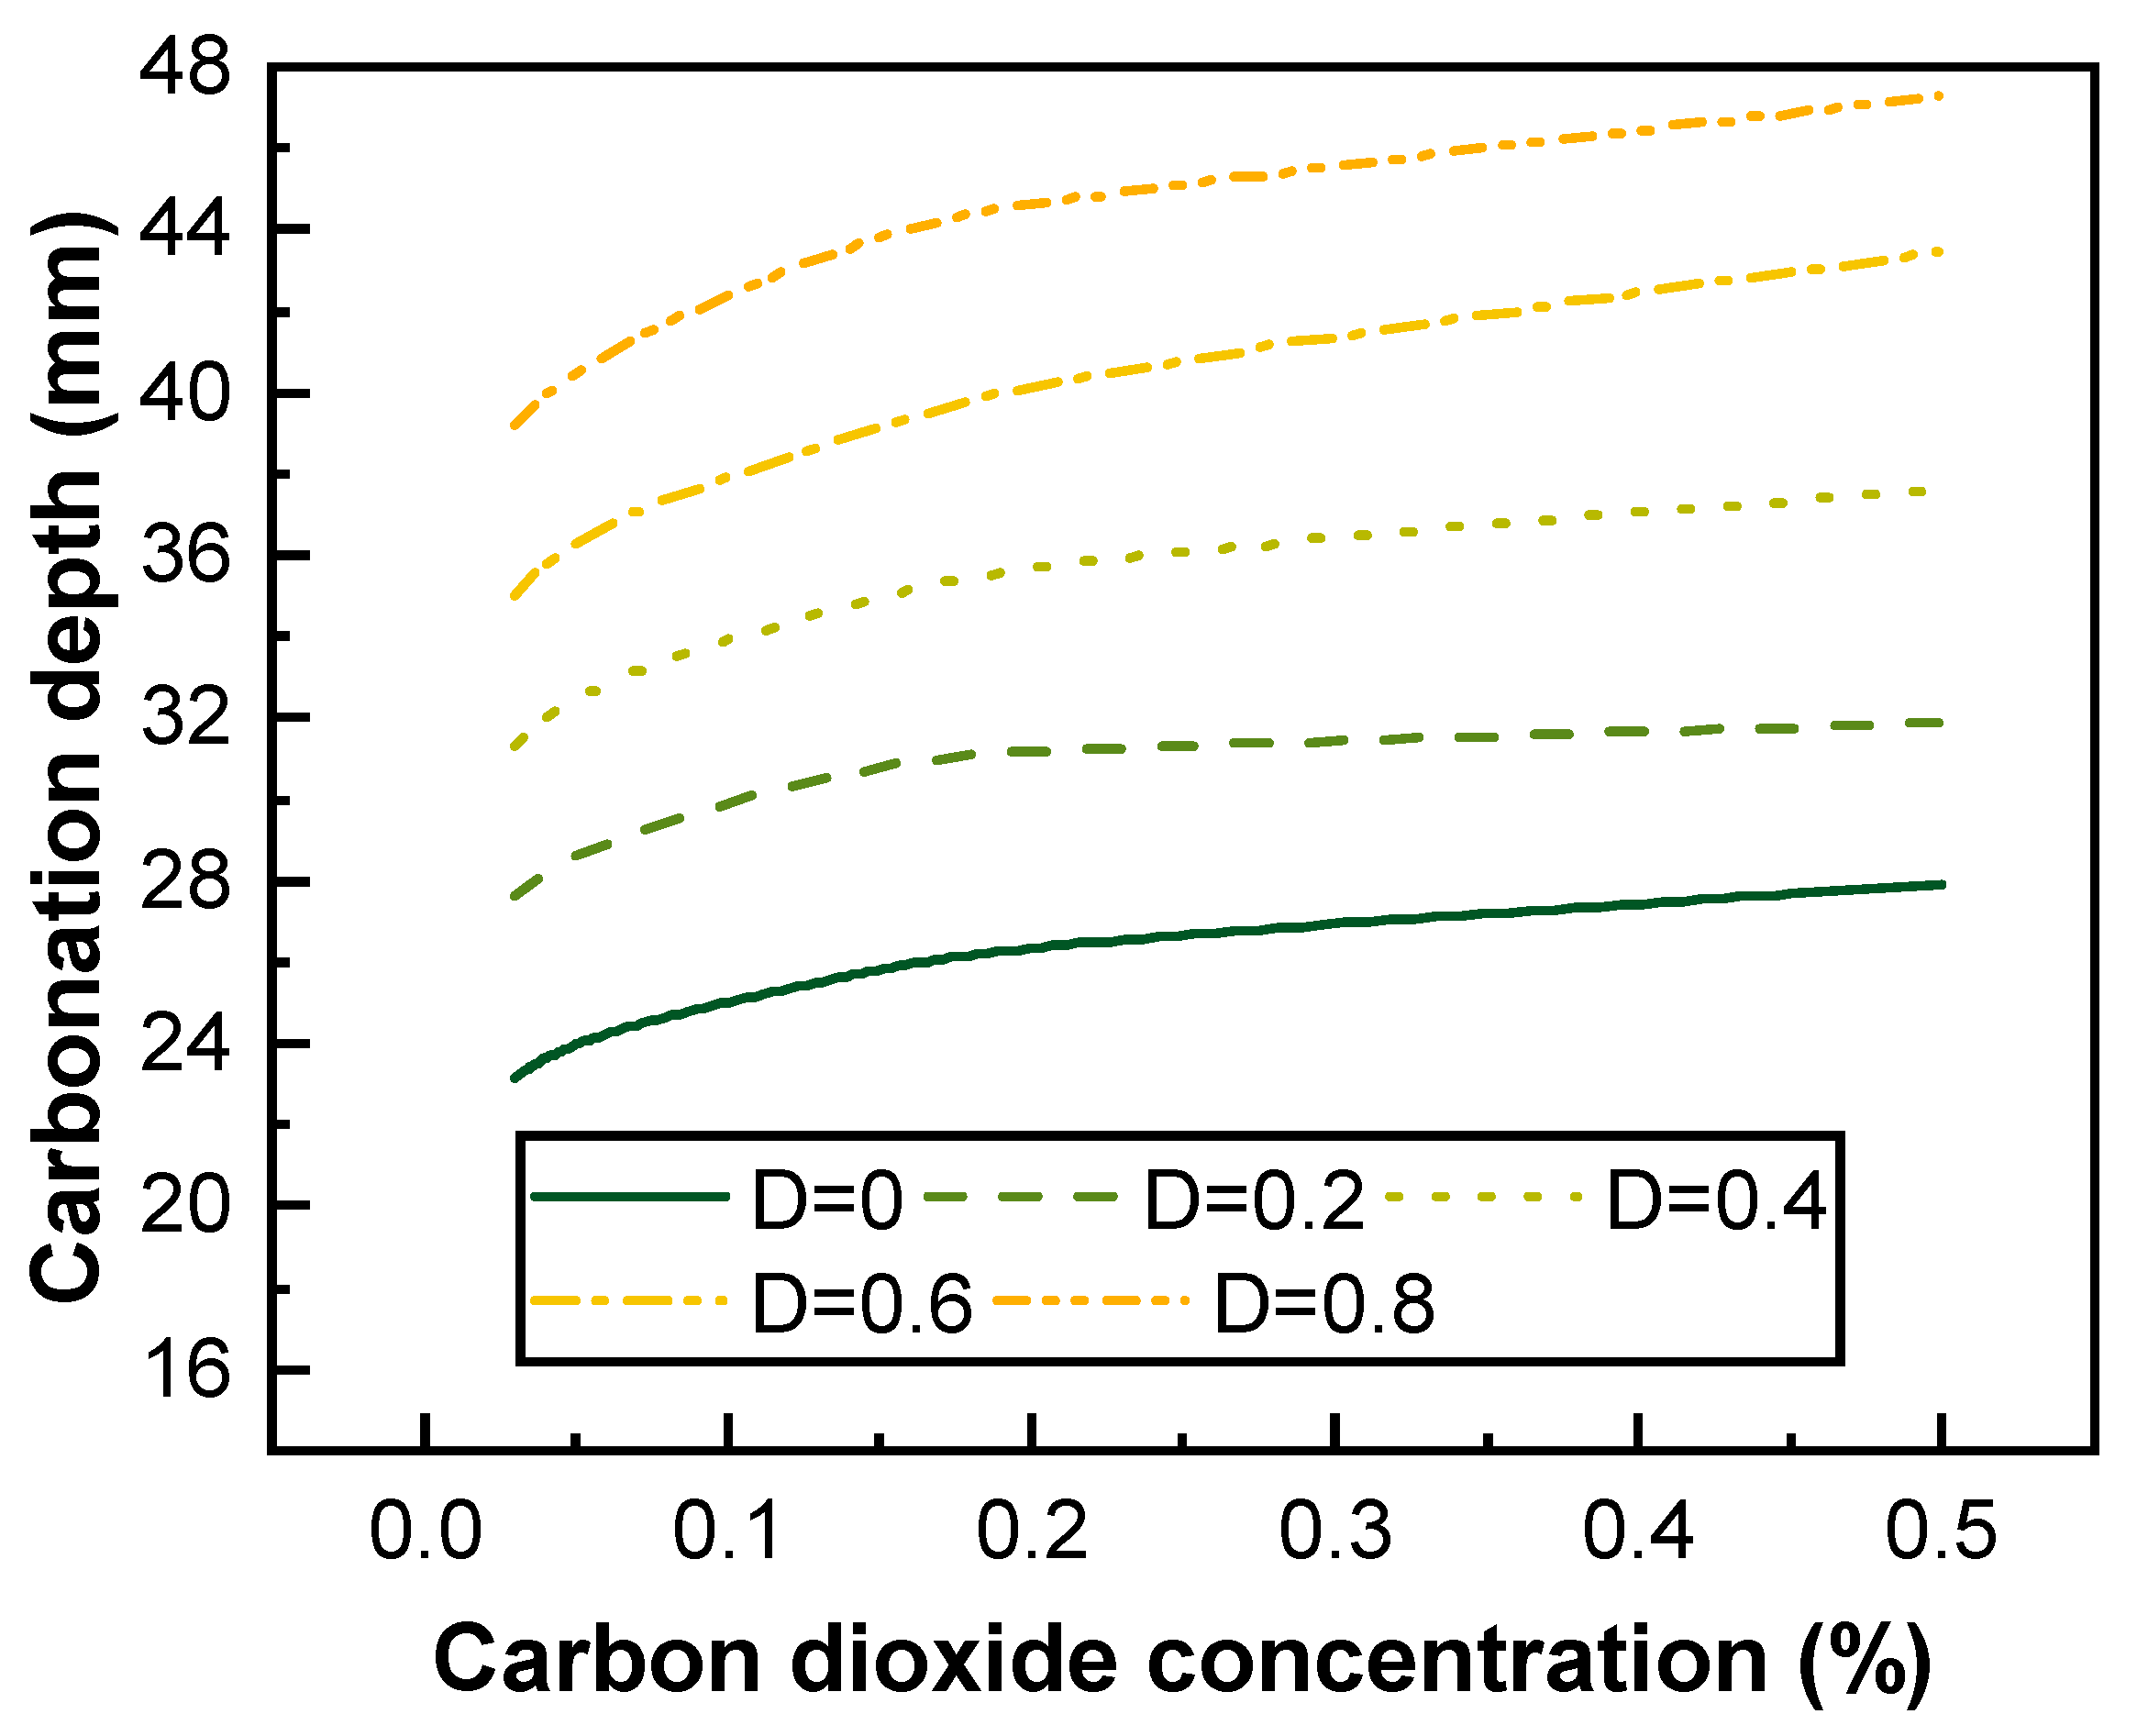
5.3. Effect of Carbon Dioxide Concentration on the Carbonation of Fatigue-Damaged RC Beams

Figure 19 shows the effect of carbon dioxide concentration on the carbonation of fatigue-damaged RC beams. The environmental temperature is 25 °C and the relative humidity is 70%. The range of carbon dioxide concentration is from 3% to 20%, and the fatigue damage degrees of beams CF0, CF1, CF2, CF3, and CF4 are 0, 0.2, 0.4, 0.6, and 0.8, respectively. When the carbon dioxide concentration increased from 3% to 5%, 15%, and 20%, and the specimens were carbonized for 120 day, the carbonation depth and rate increased by 4.49%, 11.60%, and 14.41% for undamaged specimen CF0, by 4.67%, 12.12%, and 13.07% for low fatigue-damaged specimen CF1, by 4.79%, 11.91%, and 11.43% for medium fatigue-damaged specimen CF2, and by 4.08%, 12.24%, and 14.03% for severe fatigue-damaged specimen CF4, respectively. When the carbon dioxide concentration increased from 3% to 5% and fatigue damage developed from 0 to 0.2, 0.4, and 0.8, the carbonation depth and rate increased by 24.76%, 41.59%, and 76.01%, respectively. When the carbon dioxide concentration increased from 3% to 15% and fatigue damage developed from 0 to 0.2, 0.4, and 0.8, the carbonation depth and rate increased by 33.65%, 51.21%, and 89.82%, respectively. When the carbon dioxide concentration increased from 5% to 20% and fatigue damage developed from 0 to 0.2, 0.4, and 0.8, the carbonation depth and rate increased by 28.98%, 47.98%, and 84.56%, respectively.
The results show that concrete carbonation is a carbonation reaction process accompanied by the diffusion of CO2 gas in concrete pores. Although the increase in CO2 concentration can greatly accelerate the diffusion rate of CO2 gas in concrete pores, concrete carbonation also needs to form HCO3- with the water in the pores and react with Ca(OH)2 in concrete. The diffusion rate of CO2 in concrete is not exactly the same as the carbonation rate of concrete, so the depth and rate of carbonation of undamaged and damaged beams exhibit a nonlinear increasing trend with the increase in carbon dioxide concentration. The increase in the initial concentration has a significant effect on the depth and rate of carbonation. With further increases in the carbon dioxide concentration, the influence on the depth and rate of carbonation gradually decreases and gradually tends to stabilize. The increase in porosity and cracks caused by fatigue loading increases the permeability of RC beams and increases the transport rate of CO2 in concrete.

6. Conclusions

An environmental chamber experimental study was performed to investigate the carbonation process of RC beams under the combined effects of fatigue loading and environmental factors. A carbonation numerical model considering medium transfer and fatigue damage characteristics was proposed to simulate the carbonation process of RC beams. Based on the experimental and numerical analysis, the research concluded:
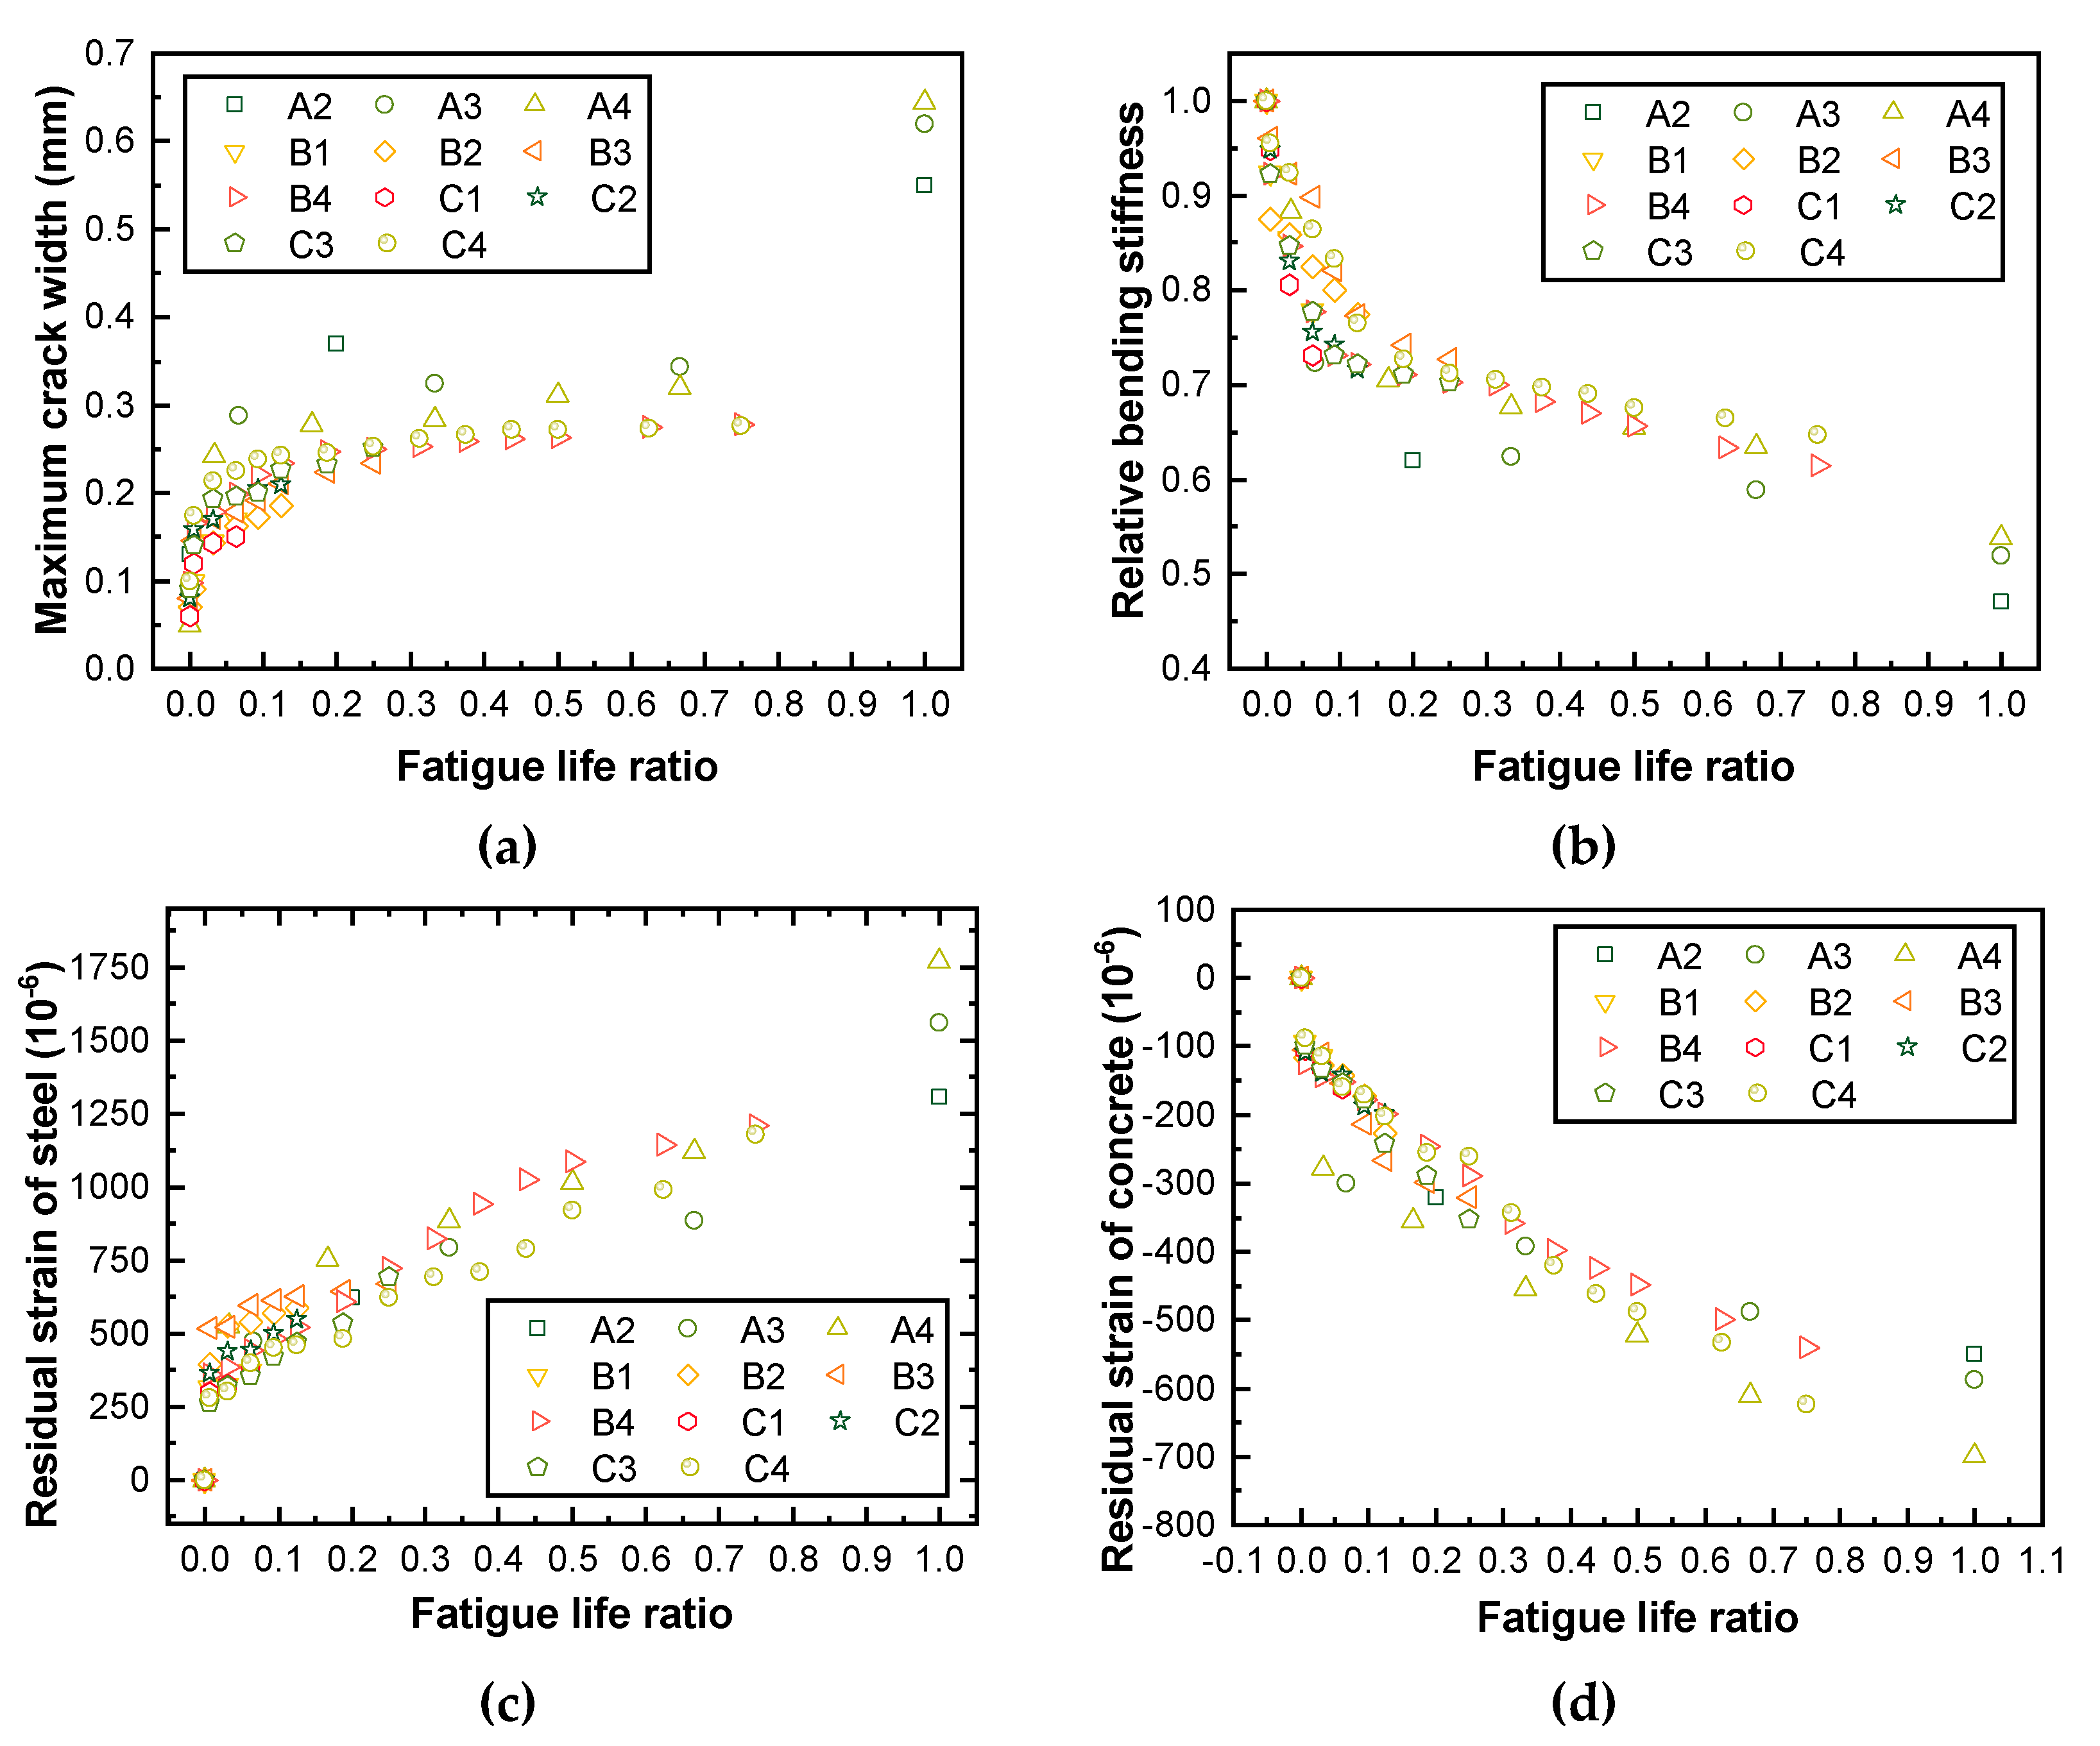
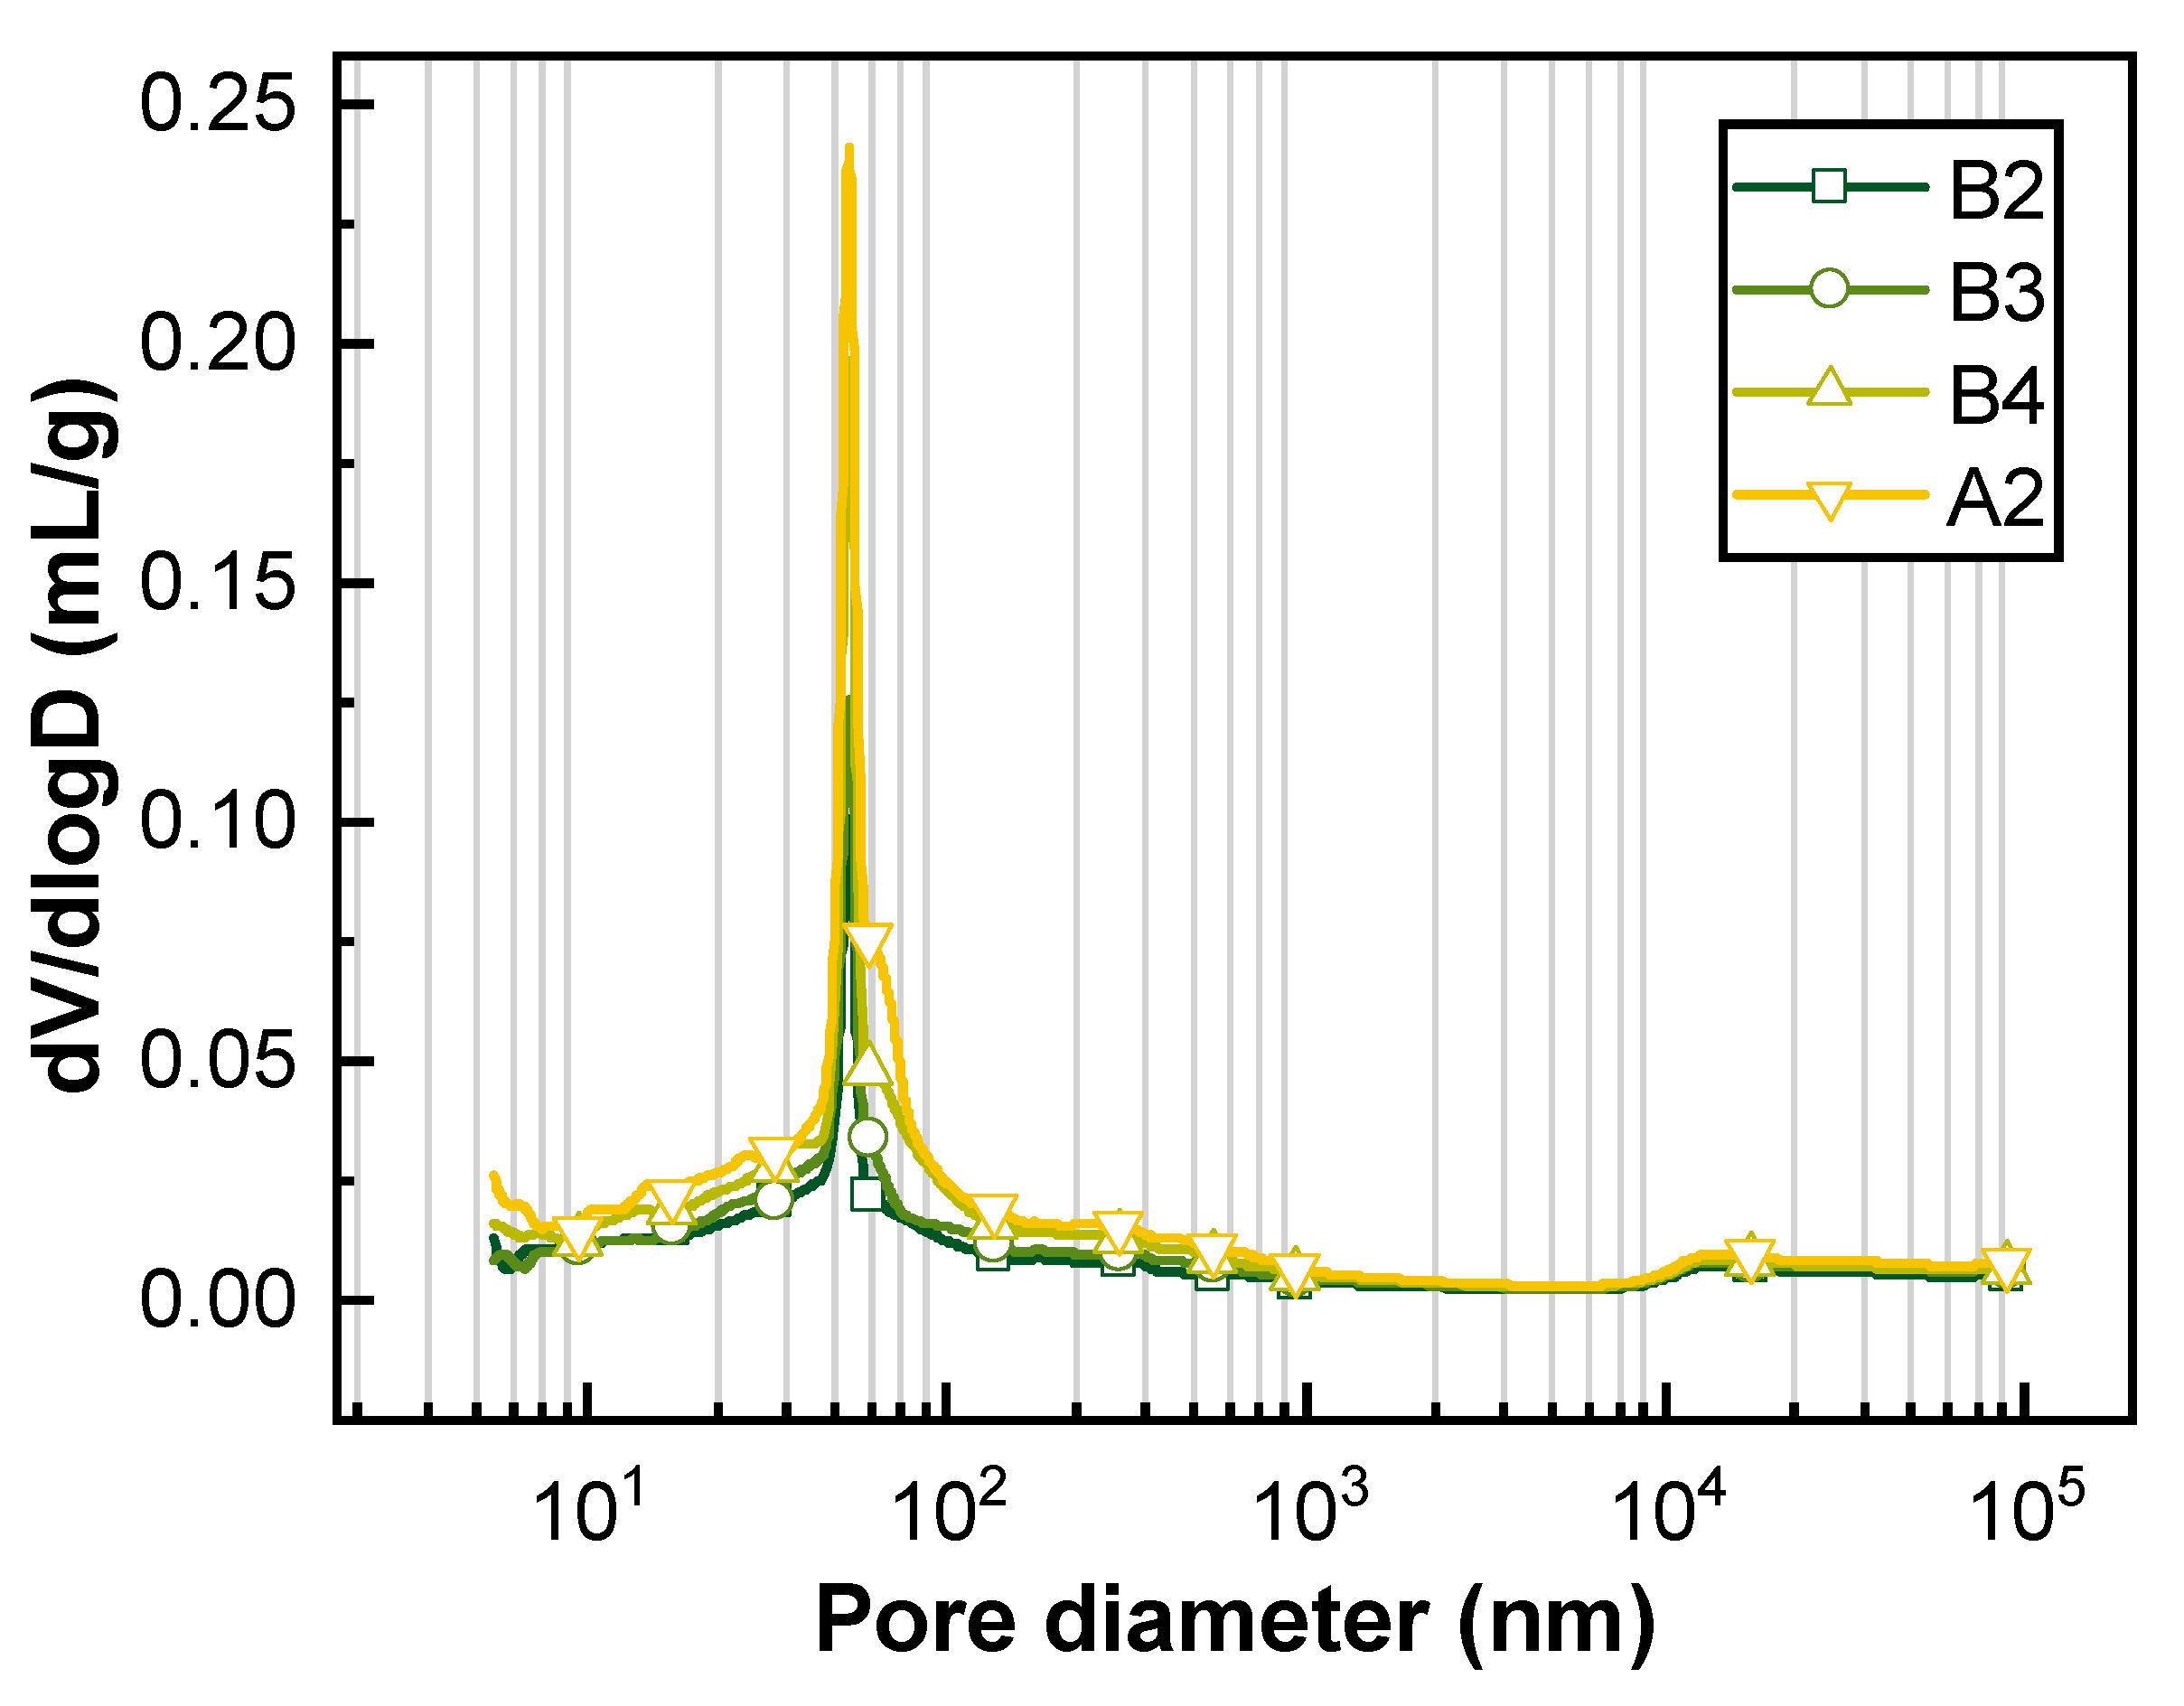
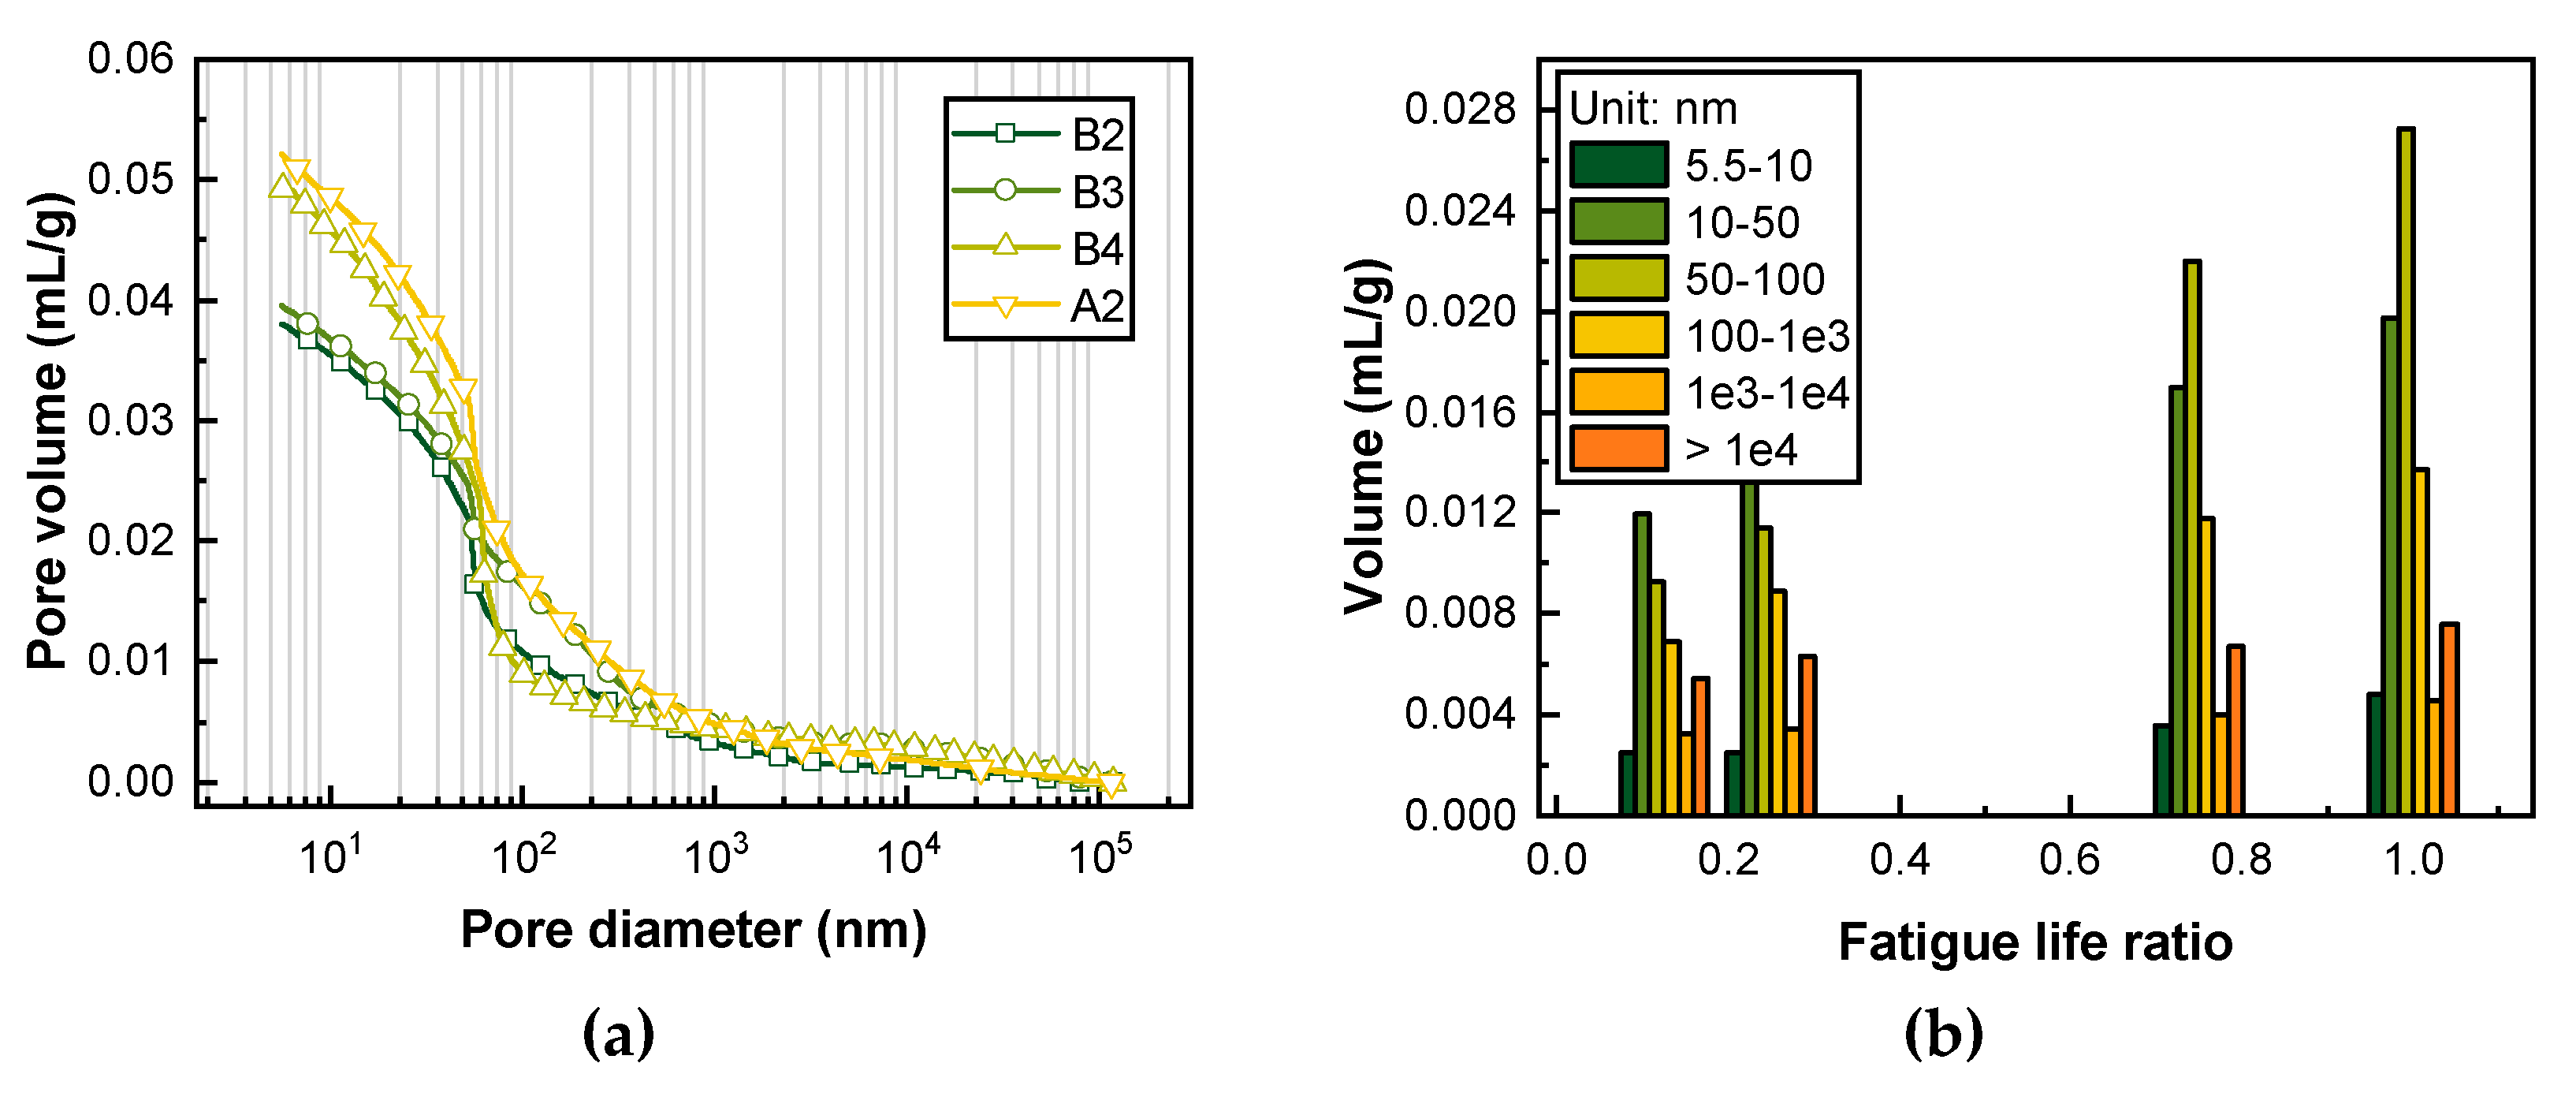
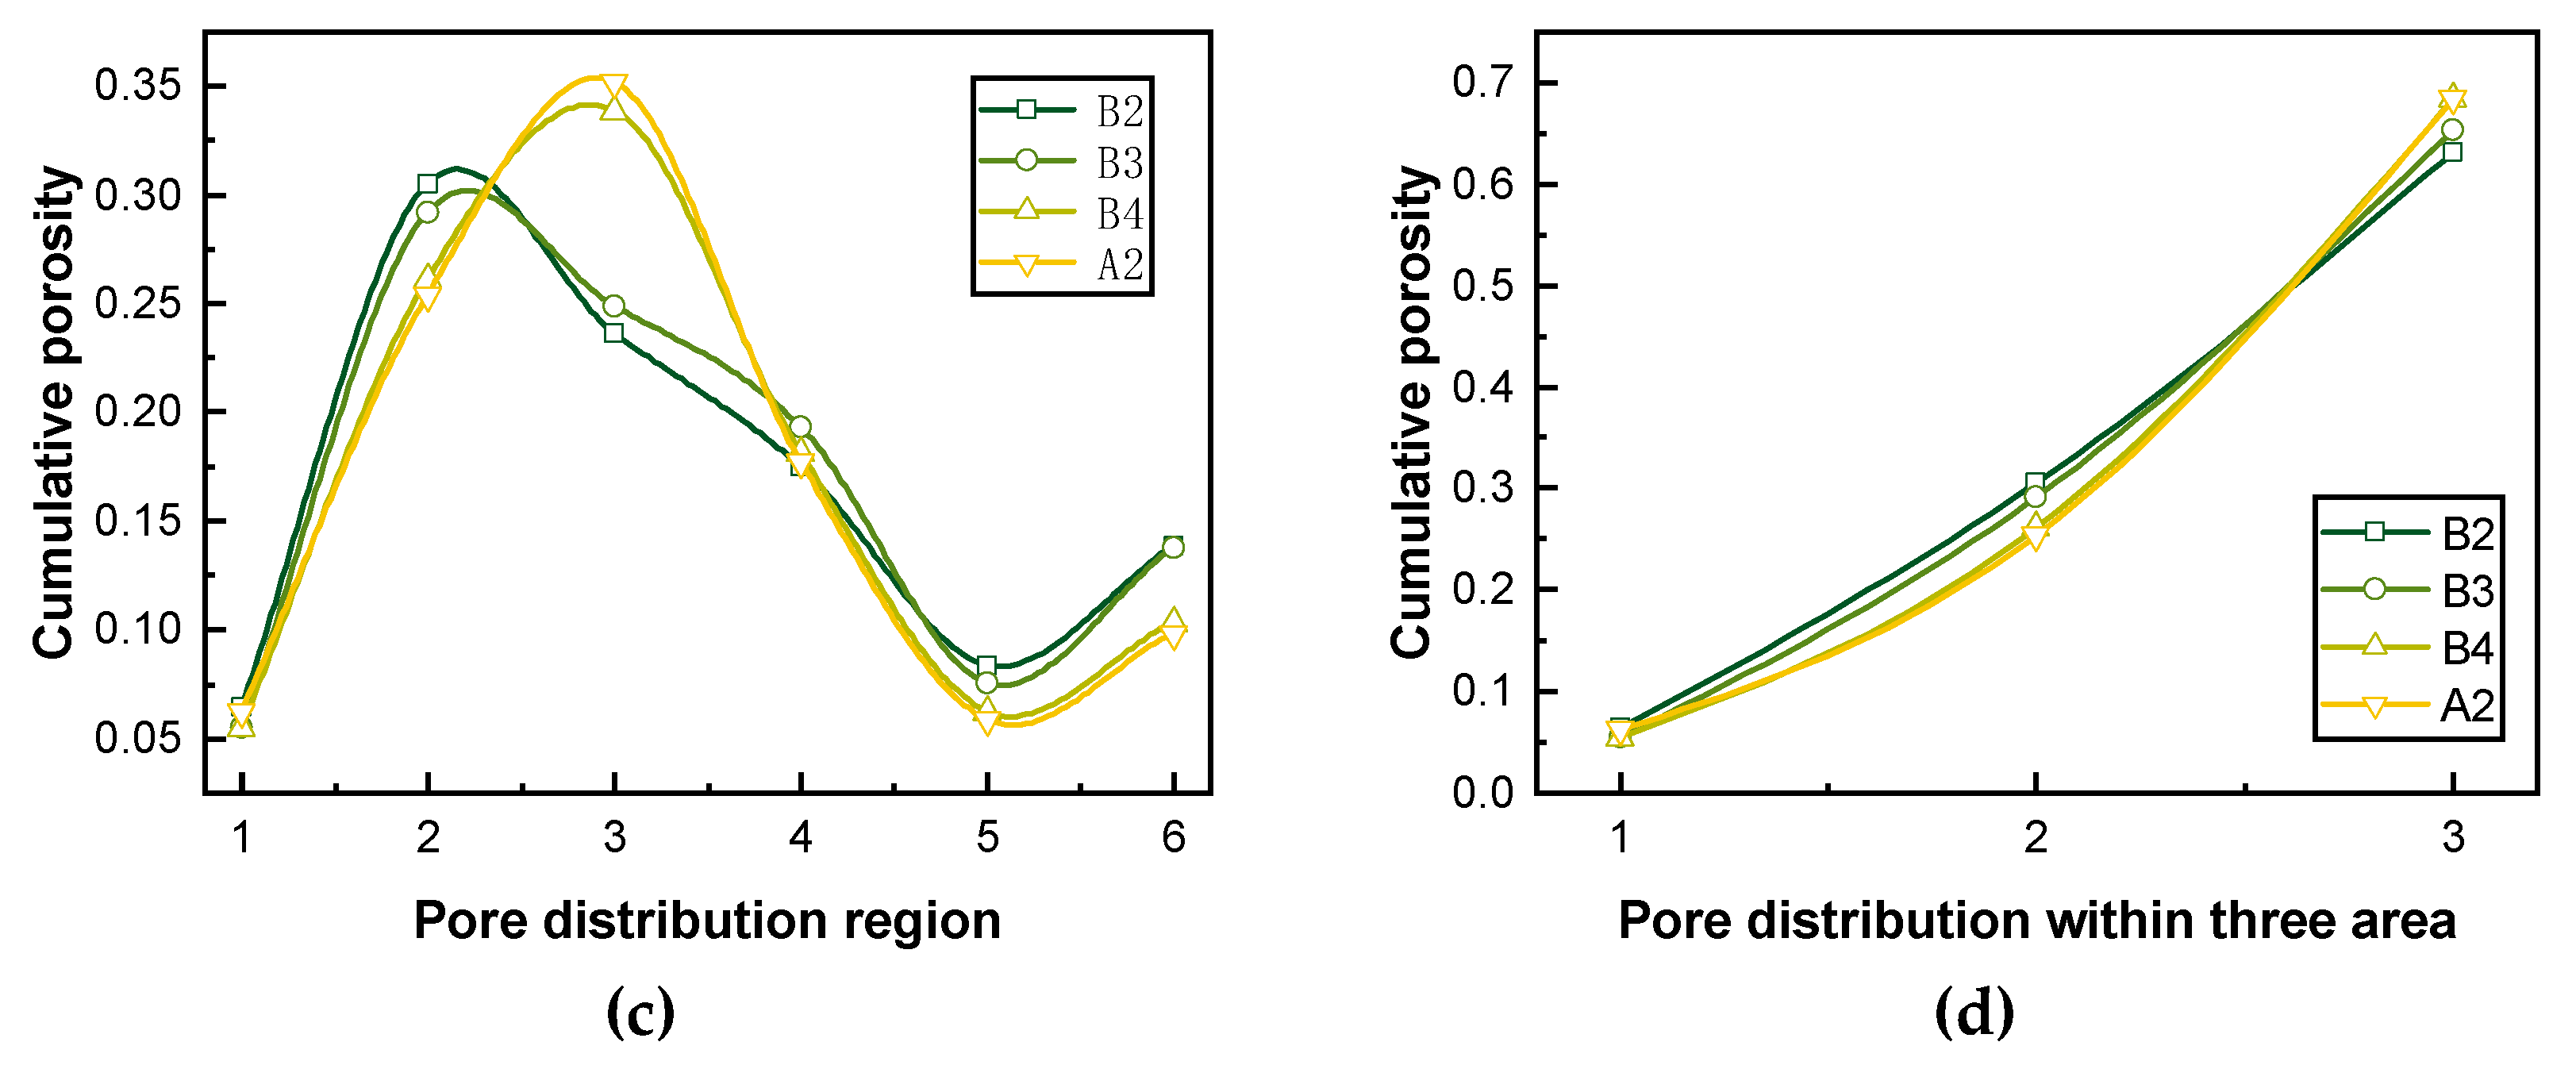
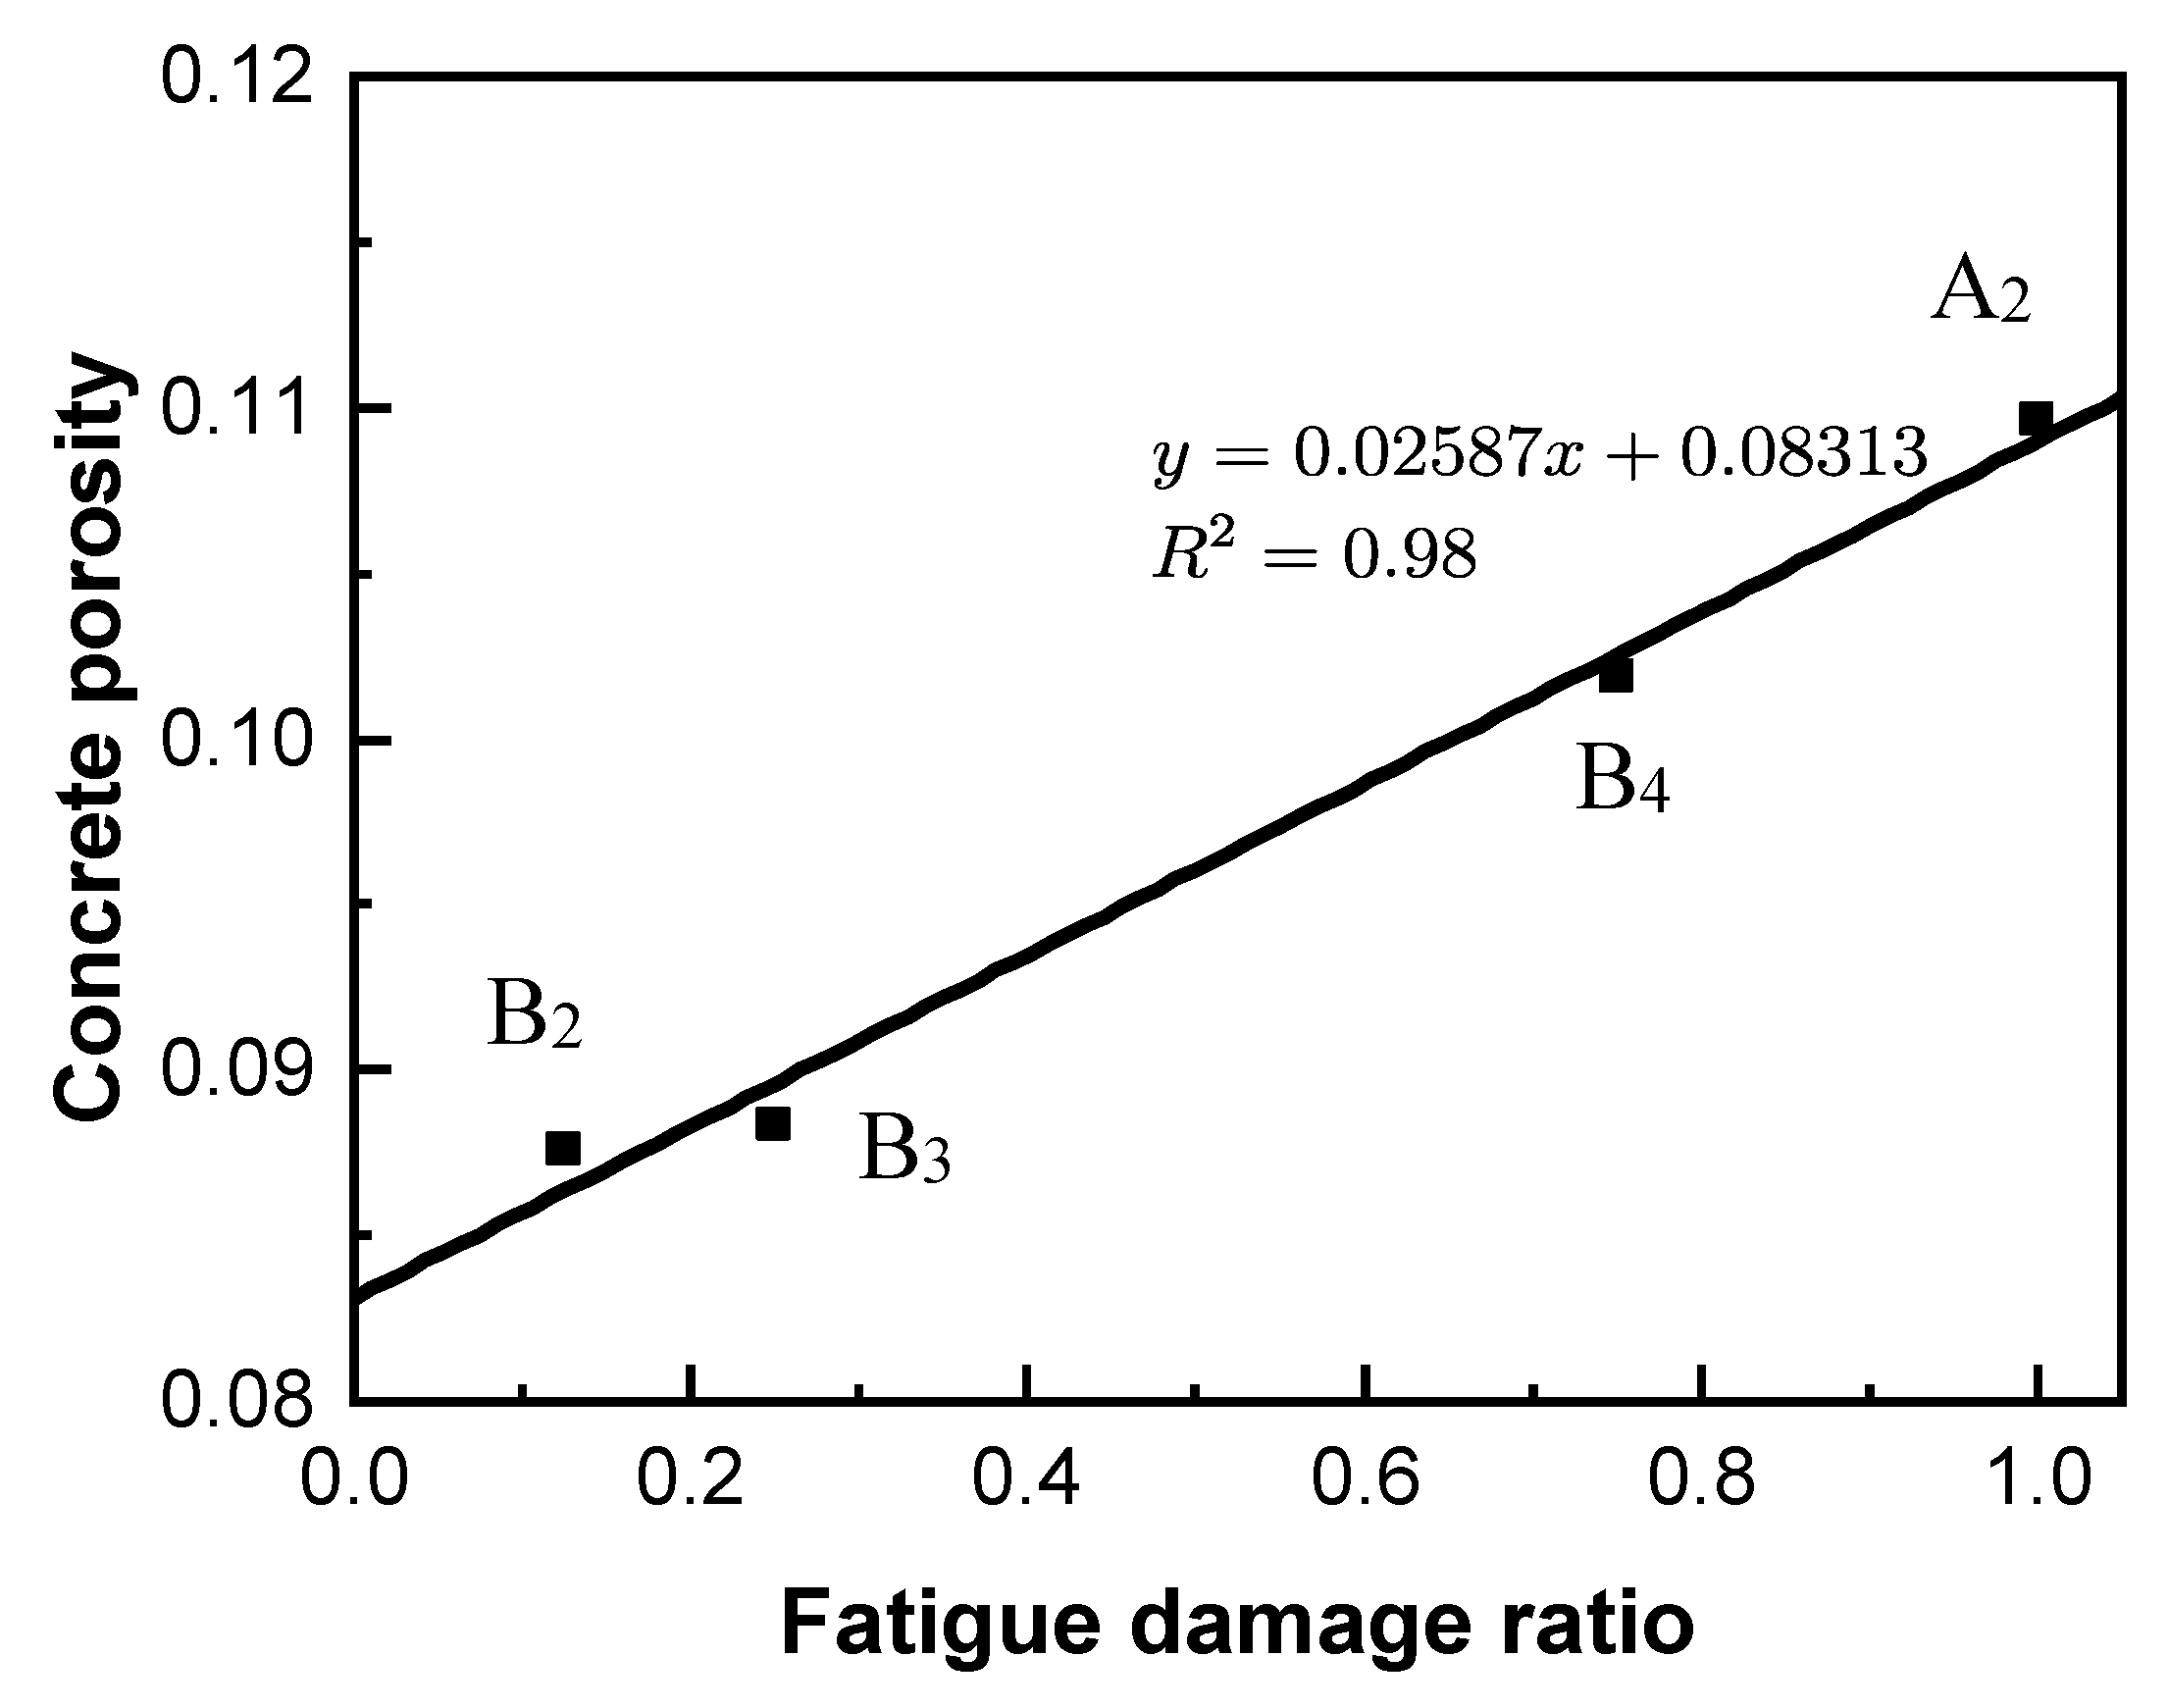
  • Compared with the macroscopic index, such as beam stiffness and material residual strain, the change in concrete pore structure can more directly and accurately characterize the effect of fatigue damage on the transport characteristics of concrete materials. The porosity of concrete notably increases with increasing fatigue damage. The distribution of pore size will change with the development of fatigue damage, among which the harmful mesopores and macropores exhibit the most notable changes. The fatigue damage has no obvious effect on the peak pore diameter of concrete; however, the fatigue damage will substantially increase the peak strength.
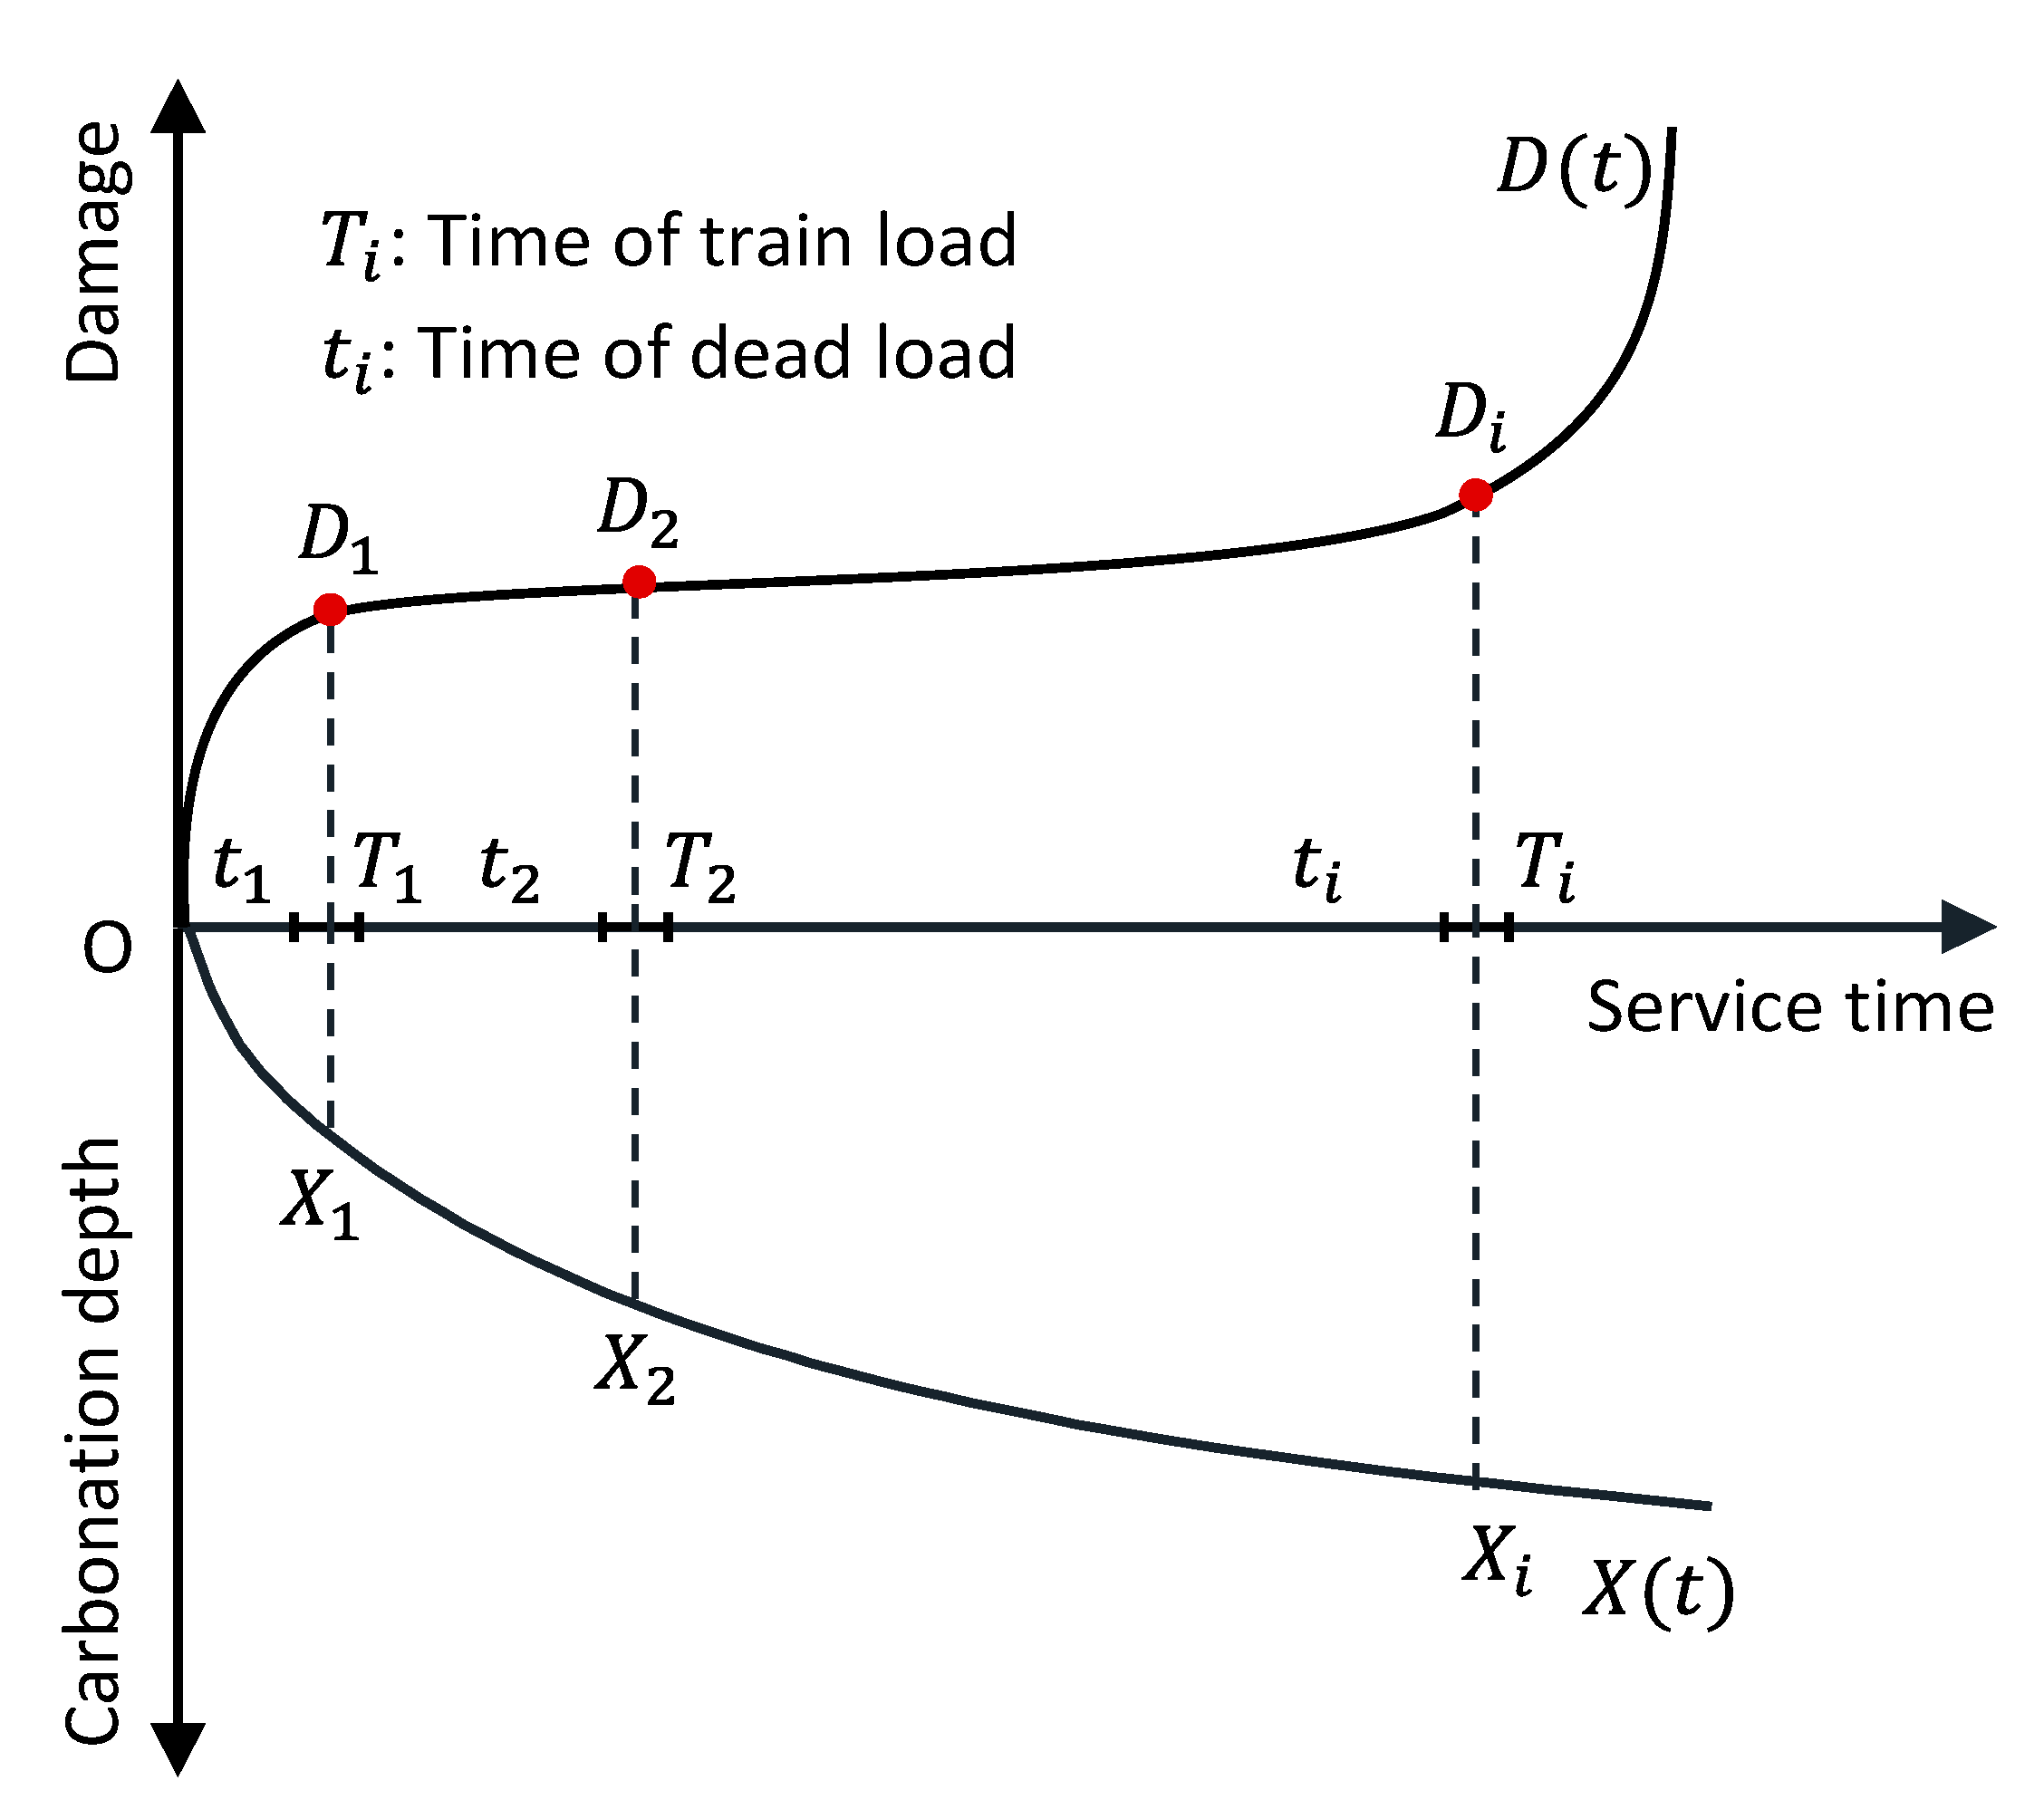
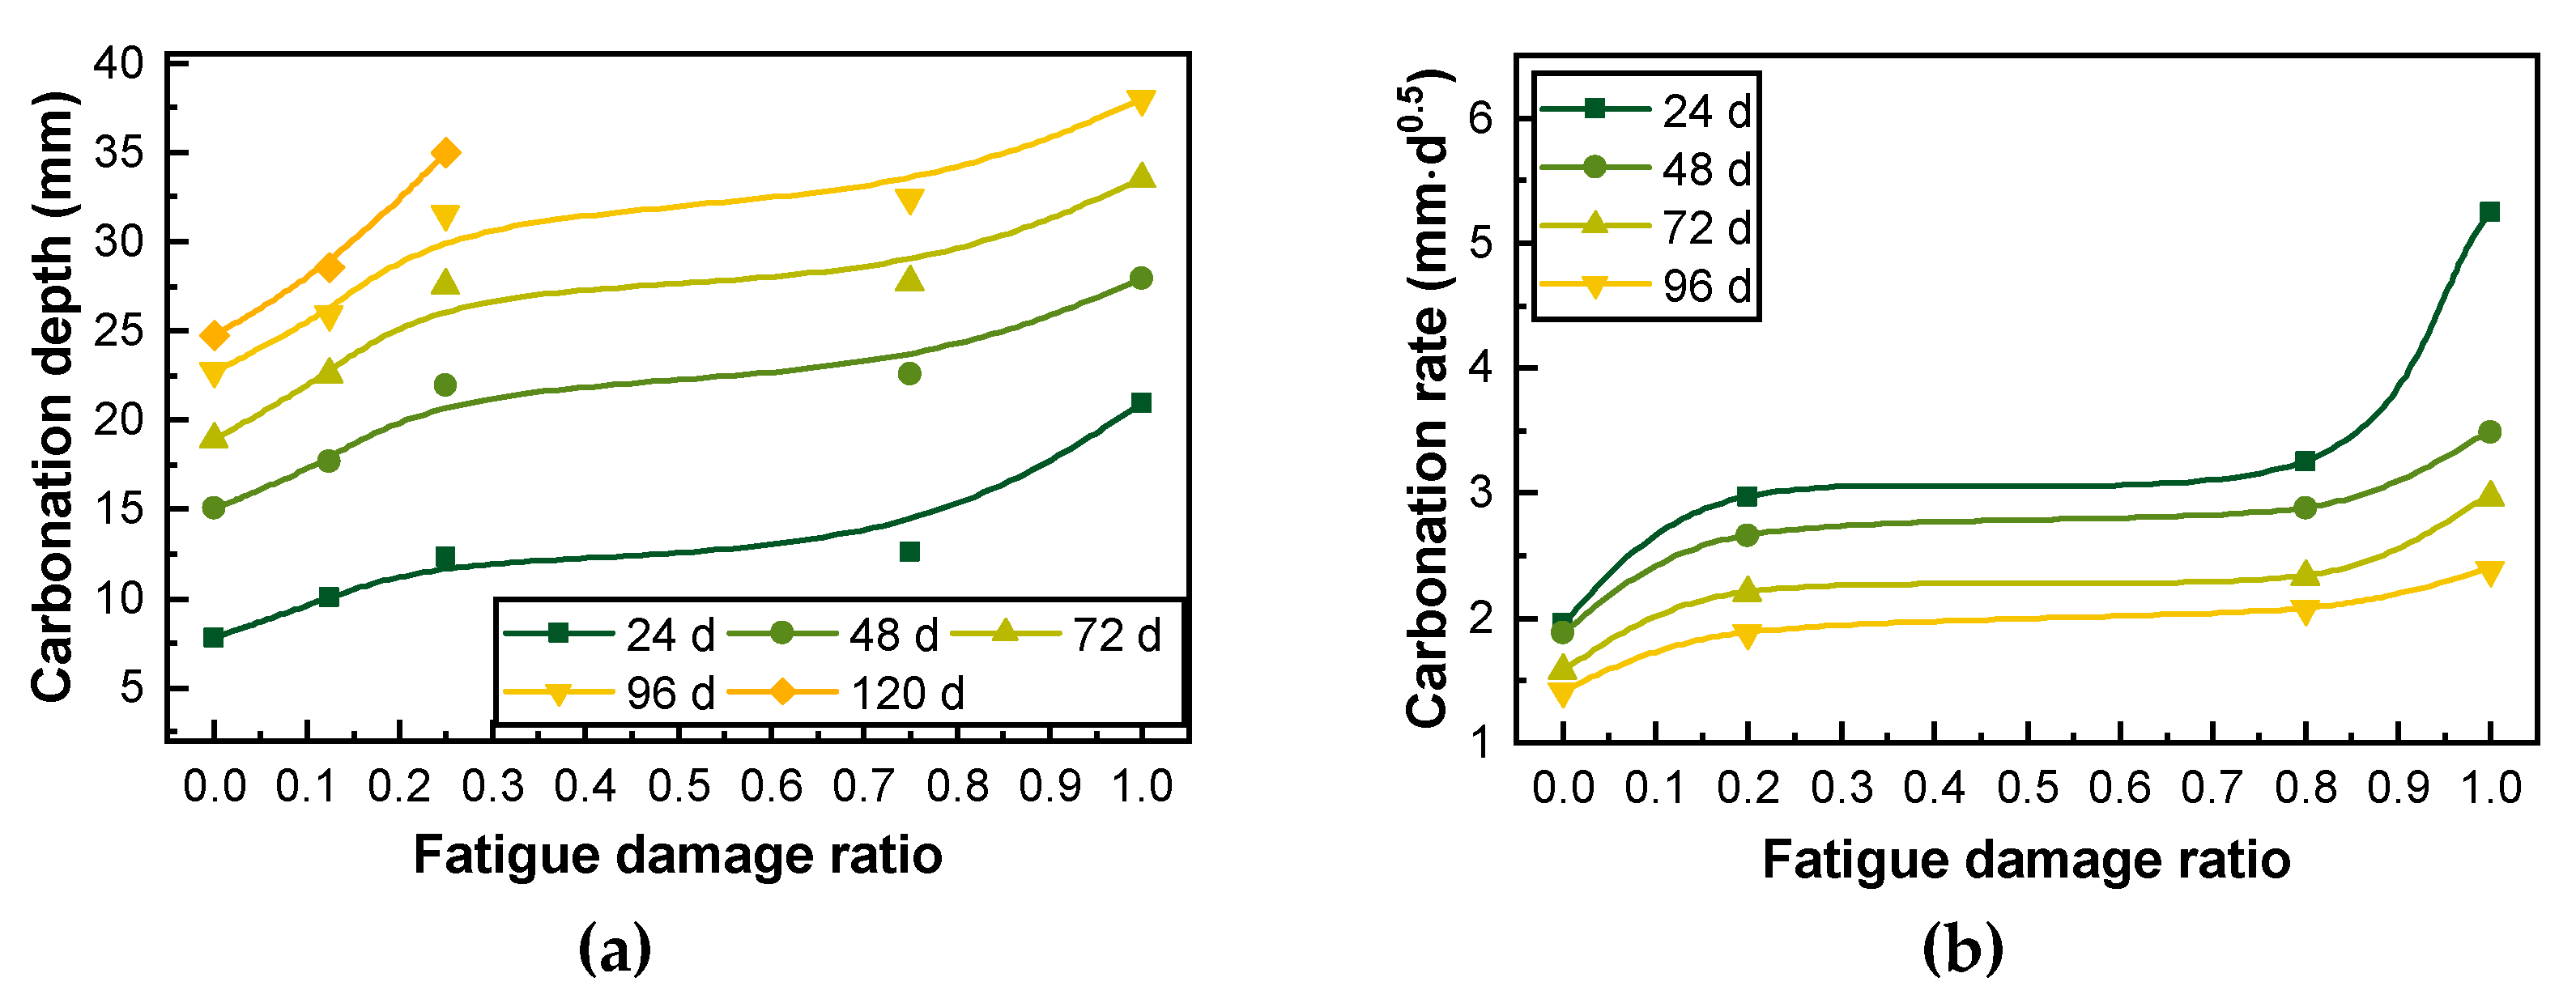
  • Fatigue damage not only significantly increases the depth of complete carbonation but also significantly increases the depth and rate of carbonation. Both the carbonation depth and fatigue damage exhibit a three-stage development law. The depth and rate of carbonation are related to concrete pores and macroscopic cracks. In the carbonation analysis of fatigue-damaged RC beams, the changes in both the pore structure and fatigue cracks caused by repeated fatigue loading on carbonation should be considered.
  • The increase in environmental temperature notably increases the carbonation depth and rate of RC beams. When the environmental relative humidity is 70%, the carbon dioxide concentration is 15%, the environmental temperature increases from 5 to 15 °C, and the samples are carbonized for 120 days, as the fatigue damage develops from 0 to 0.2, 0.4, and 0.8, the carbonation depth and rate increase by 62.25%, 85.93%, and 133.29%, respectively. When the environmental relative humidity is 70%, the carbon dioxide concentration is 15%, the environmental temperature increases from 15 to 35 °C, and the samples are carbonized for 120 days, as the fatigue damage develops from 0 to 0.2, 0.4, and 0.8, the carbonation depth and rate increase by 89.53%, 117.55%, and 172.22%, respectively.
  • The increase in the environmental relative humidity significantly decreases the carbonation depth and rate of RC beams. When the environmental temperature is 25 °C, the carbon dioxide concentration is 15%, the environmental relative humidity increases from 55.0% to 65.0%, and the samples are carbonized for 120 days, as the fatigue damage develops from 0 to 0.2, 0.4, and 0.8, the carbonation depth and carbonation rate decrease by 9.97%, 2.44%, and 28.67%, respectively. When the environmental temperature is 25 °C, the carbon dioxide concentration is 15%, the environmental relative humidity increases from 65.0% to 95.0%, and the samples are carbonized for 120 days, as the fatigue damage develops from 0 to 0.2, 0.4, and 0.8, the carbonation depth and carbonation rate decrease by 70.01%, 65.37%, and 56.37%, respectively.
  • The increase in carbon dioxide concentration substantially increases the carbonation depth and rate of RC beams. When the environmental temperature is 25 °C, the environmental relative humidity is 70%, the carbon dioxide concentration increases from 3% to 5%, and the samples are carbonized for 120 days, as the fatigue damage develops from 0 to 0.2, 0.4, and 0.8, the carbonation depth and rate increase by 24.76%, 41.59%, and 76.01%, respectively. When the environmental temperature is 25 °C, the environmental relative humidity is 70%, the carbon dioxide concentration increases from 5% to 20%, and the samples are carbonized for 120 days, as the fatigue damage develops from 0 to 0.2, 0.4, and 0.8, the carbonation depth and rate increase by 28.89%, 47.98%, and 84.56%, respectively.

Author Contributions

Conceptualization, L.S. and Z.-w.Y.; methodology, L.S. and J.H.; software, L.S., J.-l.L., and Z.-w.F.; validation, L.S., J.-l.L. and C.-x.C.; formal analysis, L.S.; investigation, L.S.; resources, L.S.; data curation, L.S., and J.-l.L.; writing—original draft preparation, L.S., and J.-l.L.; writing—review and editing, L.S.; visualization, L.S., and J.-l.L.; supervision, L.S.; project administration, L.S.; funding acquisition, L.S. All authors have read and agreed to the published version of the manuscript.

Funding

Financial support provided by the National Natural Science Foundation of China (Grant No. 51778631, 51378506, and U1934217) and China Railway Science and technology research and development plan project are greatly appreciated.

Conflicts of Interest

The authors declare no conflict of interest.

References

  1. Shamsad, A. Reinforcement corrosion in concrete structures, its monitoring and service life prediction—A review. Cem. Concr. Compos. 2003, 25, 459–471. [Google Scholar]
  2. Saetta, A.; Vitaliani, R.V. Experimental investigation and numerical modeling of carbonation process in reinforced concrete structures. Cem. Concr. Res. 2004, 34, 571–579. [Google Scholar] [CrossRef]
  3. Raupach, M. Models for the propagation phase of reinforcement corrosion—An overview. Mater. Corros. 2006, 57, 605–613. [Google Scholar] [CrossRef]
  4. Vu, K.A.T.; Stewart, M.G. Structural reliability of concrete bridges including improved chloride-induced corrosion models. Struct. Saf. 2000, 22, 313–333. [Google Scholar] [CrossRef]
  5. Bažant, Z.P.; Hubler, M.H. Theory of cyclic creep of concrete based on Paris law for fatigue growth of subcritical microcracks. J. Mech. Phys. Solids 2014, 63, 187–200. [Google Scholar] [CrossRef]
  6. Chen, N.; Mahadevan, S. Chloride-induced reinforcement corrosion and concrete cracking simulation. Cem. Concr. Compos. 2008, 30, 227–238. [Google Scholar] [CrossRef]
  7. Vidal, T.; Castel, A.; François, R. Analyzing crack width to predict corrosion in reinforced concrete. Cem. Concr. Res. 2004, 34, 165–174. [Google Scholar] [CrossRef]
  8. Alonso, C.; Andrade, C.; Rodriguez, J.; Diez, J.M. Factors controlling cracking of concrete affected by reinforcement corrosion. Mater. Struct. 1998, 31, 435–441. [Google Scholar] [CrossRef]
  9. Ngala, V.; Page, C. Effects of carbonation on pore structure and diffusional properties of hydrated cement pastes. Cem. Concr. Res. 1997, 27, 995–1007. [Google Scholar] [CrossRef]
  10. Johannesson, B.; Utgenannt, P. Microstructural changes caused by carbonation of cement mortar. Cem. Concr. Res. 2001, 31, 925–931. [Google Scholar] [CrossRef]
  11. Younsi, A.; Turcry, P.; Aït-Mokhtar, A.; Staquet, S.; Turcry, P. Accelerated carbonation of concrete with high content of mineral additions: Effect of interactions between hydration and drying. Cem. Concr. Res. 2013, 43, 25–33. [Google Scholar] [CrossRef]
  12. Wang, X.-Y.; Park, K.-B. Analysis of Compressive Strength Development and Carbonation Depth of High-Volume Fly Ash Cement Pastes. ACI Mater. J. 2016, 113. [Google Scholar] [CrossRef]
  13. Lye, C.-Q.; Dhir, R.K.; Ghataora, G.S. Carbonation resistance of fly ash concrete. Mag. Concr. Res. 2015, 67, 1150–1178. [Google Scholar] [CrossRef]
  14. Isgor, O.B.; Razaqpur, A.G. Finite element modeling of coupled heat transfer, moisture transport and carbonation processes in concrete structures. Cem. Concr. Compos. 2004, 26, 57–73. [Google Scholar] [CrossRef]
  15. Cui, H.; Tang, W.; Liu, W.; Dong, Z.; Xing, F. Experimental study on effects of CO2 concentrations on concrete carbonation and diffusion mechanisms. Constr. Build. Mater. 2015, 93, 522–527. [Google Scholar] [CrossRef]
  16. Visser, J. Influence of the carbon dioxide concentration on the resistance to carbonation of concrete. Constr. Build. Mater. 2014, 67, 8–13. [Google Scholar] [CrossRef]
  17. Jiang, C.; Gu, X.; Zhang, W.; Zou, W. Modeling of carbonation in tensile zone of plain concrete beams damaged by cyclic loading. Constr. Build. Mater. 2015, 77, 479–488. [Google Scholar] [CrossRef]
  18. Jiang, C.; Huang, Q.; Gu, X.; Zhang, W. Experimental investigation on carbonation in fatigue-damaged concrete. Cem. Concr. Res. 2017, 99, 38–52. [Google Scholar] [CrossRef]
  19. JCI Committee 984. Long-Term Durability of Concrete; Japan Concrete Institute: Tokyo, Japan, 2000. [Google Scholar]
  20. Perez, N. Electrochemistry and Corrosion Science; Kluwer Academic Publishers: Boston, MA, USA, 2004. [Google Scholar]
  21. Papadakis, V.G.; Fardis, M.N.; Vayenas, C.G. Effect of composition, environmental factors and cement-lime mortar coating on concrete carbonation. Mater. Struct. 1992, 25, 293–304. [Google Scholar] [CrossRef]
  22. Song, H.-W.; Kwon, S.-J.; Byun, K.-J.; Park, C.-K. Predicting carbonation in early-aged cracked concrete. Cem. Concr. Res. 2006, 36, 979–989. [Google Scholar] [CrossRef]
  23. China National Standard. Code for Design of Concrete Structures (GB50010-2010); China Architecture & Building Press: Beijing, China, 2009. [Google Scholar]
  24. Papadakis, V.G.; Vayenas, C.G.; Fardis, M.N. A reaction engineering approach to the problem of concrete carbonation. AIChE J. 1989, 35, 1639–1650. [Google Scholar] [CrossRef]
  25. Papadakis, V.G.; Vayenas, C.G.; Fardis, M.N. Experimental investigation and mathematical modeling of the concrete carbonation problem. Chem. Eng. Sci. 1991, 46, 1333–1338. [Google Scholar] [CrossRef]
  26. Khunthongkeaw, J.; Tangtermsirikul, S. Model for Simulating Carbonation of Fly Ash Concrete. J. Mater. Civ. Eng. 2005, 17, 570–578. [Google Scholar] [CrossRef]
  27. Han, D.J. Damage Mechanism and Service Life Prediction of Cementitious Materials under Loading and Carbonation Coupling Effects. Ph.D. Thesis, University of Dongnan, Shanghai, China, 2008. [Google Scholar]
  28. Song, X.B. Corrosion of Reinforcement Bars in Reinforced Concrete Structures. Ph.D. Thesis, Tsinghua University, Beijing, China, 1999. [Google Scholar]
Figure 1. The coupled effects of train loads and carbonation environment during its service period.
Applsci 10 03981 g001
Figure 2. Typical dimensions and reinforcement details of the test specimens (mm).
Applsci 10 03981 g002
Figure 3. Mercury intrusion test of fatigue-damaged concrete: (a) cylindrical sample and (b) mercury intrusion meter.
Applsci 10 03981 g003
Figure 4. Artificial acceleration simulation carbonation environmental test: (a) specimen preparation (mm) and (b) carbonation test in the environmental chamber.
Applsci 10 03981 g004
Figure 5. The sampling locations on the specimens used to determine the carbonation depth (mm).
Applsci 10 03981 g005
Figure 6. The fatigue behavior of reinforced concrete (RC) beams with different loading cycles: (a) maximum crack width; (b) bending stiffness; (c) residual strain of concrete in compressed zone; (d) residual strain of tensile reinforced bars.
Applsci 10 03981 g006
Figure 7. The pore distributions of concrete with different levels of fatigue damage.
Applsci 10 03981 g007
Figure 8. The cumulative porosity distribution of the fatigue-damaged concrete specimens: (a) cumulative pore volume; (b) cumulative pore volume of different regions; (c) regional cumulative porosity ratio distribution; (d) cumulative porosity ratio distribution.
Applsci 10 03981 g008aApplsci 10 03981 g008b
Figure 9. The porosity of the fatigue-damaged concrete specimens.
Applsci 10 03981 g009
Figure 10. The complete carbonation depths of concrete beams B0–B4: (a) phenolphthalein titration; (b) pH meter method.
Applsci 10 03981 g010
Figure 11. The carbonation depths and rates of concrete at pH ≤ 11.5 in specimens B0–B4: (a) carbonation depth and (b) carbonation rate.
Applsci 10 03981 g011
Figure 12. The one-dimensional medium transport system.
Applsci 10 03981 g012
Figure 13. The model on the carbon dioxide transport process in damaged, cracked RC beams.
Applsci 10 03981 g013
Figure 14. Carbon dioxide transport in the cross section of RC beam.
Applsci 10 03981 g014
Figure 15. The numerical simulation flowchart on carbonation process of fatigue-damaged RC beams.
Applsci 10 03981 g015
Figure 16. Comparison between numerical simulation and experimental results of carbonation depth of RC beams.
Applsci 10 03981 g016
Figure 17. Effect of environmental temperature on the carbonation of fatigue-damaged RC beams.
Applsci 10 03981 g017
Figure 18. Effect of relative humidity on the carbonation of fatigue-damaged RC beams.
Applsci 10 03981 g018
Figure 19. Effect of carbon dioxide concentration on the carbonation of fatigue-damaged RC beams.
Applsci 10 03981 g019
Table 1. Summary of the specimens and loading conditions.
Spec.ProcedureFatigue LoadLoad aCycles (104)Damage
Pmin/Pmax (kN)
A1Static failure----
A2Fatigue failure10/4045%150.6-
A3Fatigue failure10/5055%75.2-
A4Fatigue failure10/7075%25.3-
B0Carbonation10/3540%0Undamaged
C0Corrosion
B1Carbonation10/3540%50Low
C1Corrosion
B2Carbonation10/3540%100Medium
C2Corrosion
B3Carbonation10/3540%200Medium
C3Corrosion
B4Carbonation10/3540%600High
C4Corrosion
a The upper limit of the fatigue load was based on the static yield strength determined by the static failure test.
Table 2. Mix proportion, mineral composition, and chemical composition.
Mix Proportion of Concrete (kg)
WaterCementFine AggregateCoarse Aggregatew/c--
17649564811520.36--
Mineral composition of cement (wt%)
C 3 S C 2 S C 3 A C 4 AF CSH 2 Others-
55.519.16.510.15.03.8-
Chemical composition of cement (wt %)
CaO SiO 2 Al 2 O 3 Fe 2 O 3 MgO SO 3 Others
62.6021.354.673.313.082.252.84
Table 3. Statistical environmental information based on the city meteorological data during a calendar year.
Temperature PhaseLowMiddleHigh
Month111212341056789
Temperature (°C)13.27.45.27.912.918.219.12326.729.828.324.6
Relative humidity (%)72.372.574.975.572.673.173.473.175.772.174.572.8
CO2 concentration (ppm)430440419420425428424405398350370373
Average temperature (°C)9.318.726.5
Average RH (%)73.673.373.6
Table 4. The test system of artificial accelerated simulation environment.
Cycle (Day)Temperature (°C)Relative Humidity (%)CO2 Concentration (%)Corresponding Month
2.51473.6 ± 115 ± 211–3 (low)
1.02873.3 ± 115 ± 24, 10 (medium)
2.54073.6 ± 115 ± 25–9 (high)

