3. Results and Discussion
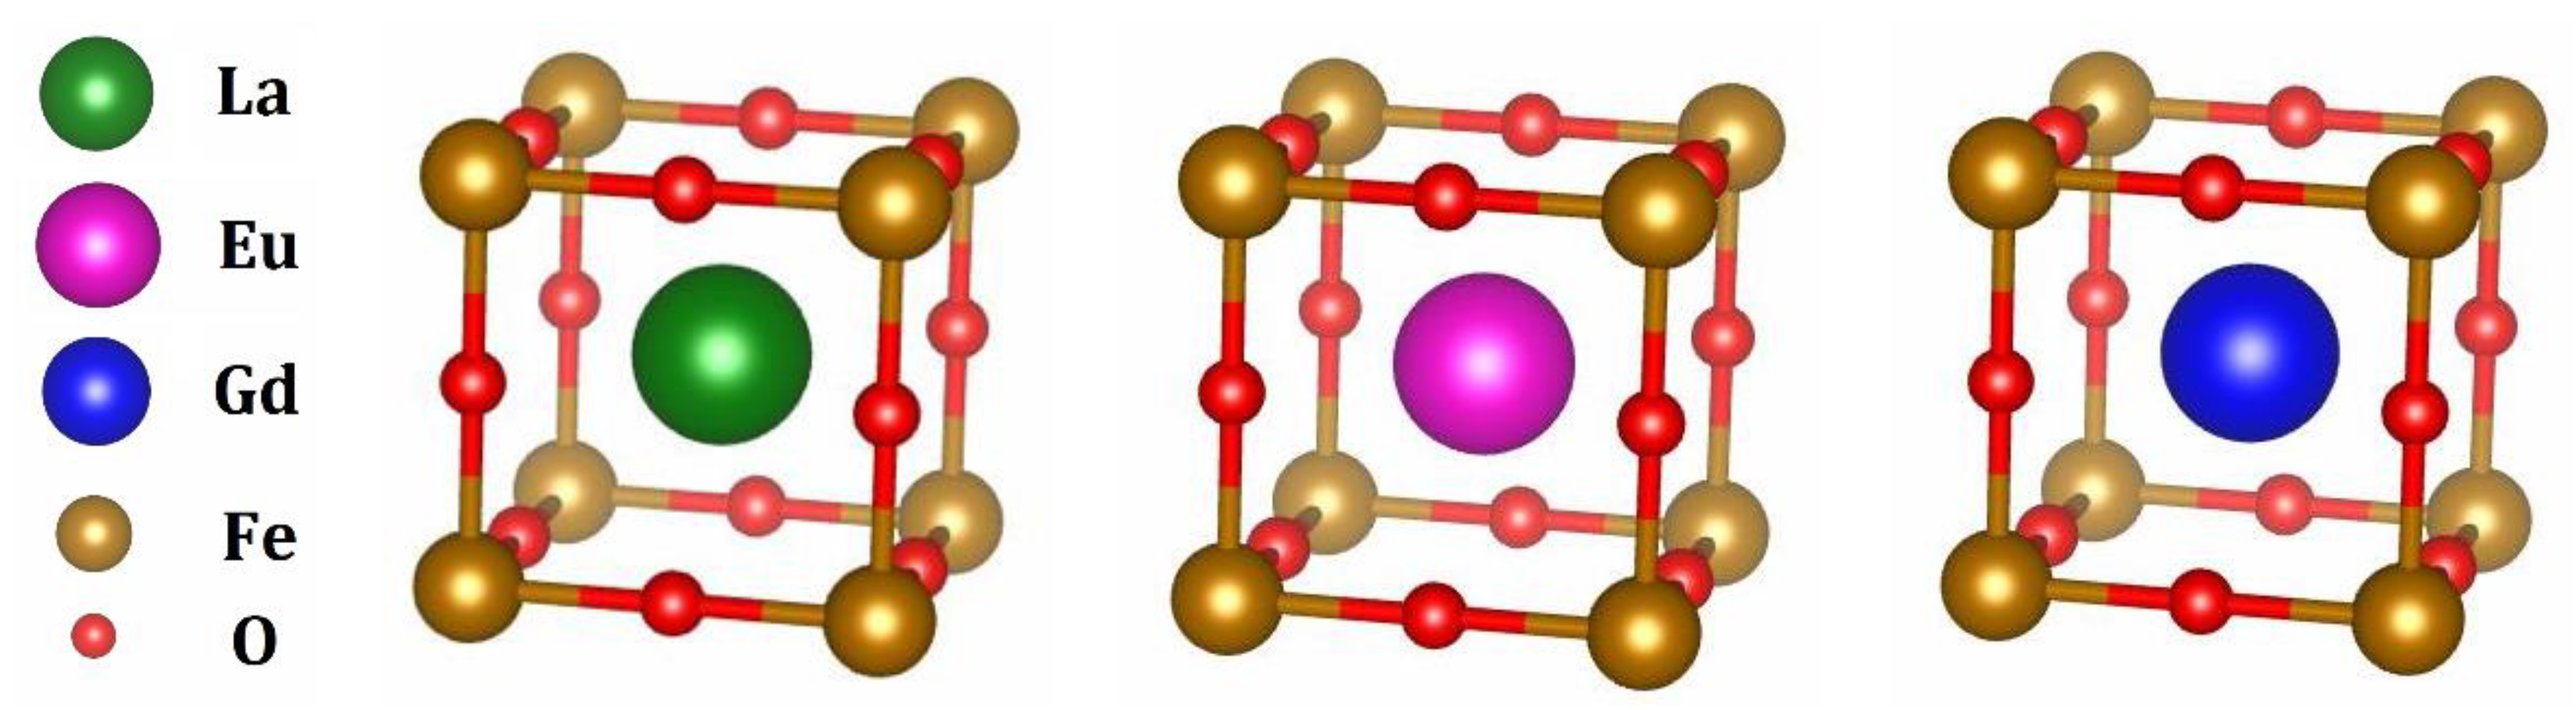
The calculated optimum values for the lattice parameters of the cubic RFeO
3 (R = La, Eu, Gd) structures as well as the previous experimental and theoretical values are given in
Table 1. There is befitting compliance between our calculated results with the reported experimental data the literature with a nearly 0.5% underestimation. The weakness of DFT in describing the dispersion forces causes an underestimation in the prediction of the electronic, structural, and physical properties of materials.
It can be seen in
Table 1, the cell parameter of the unit cells for all three structures decreases by reducing the atomic radius of the central cation. This is in agreement with the other computational studies [
5,
6,
7,
12,
13], as listed in
Table 1.
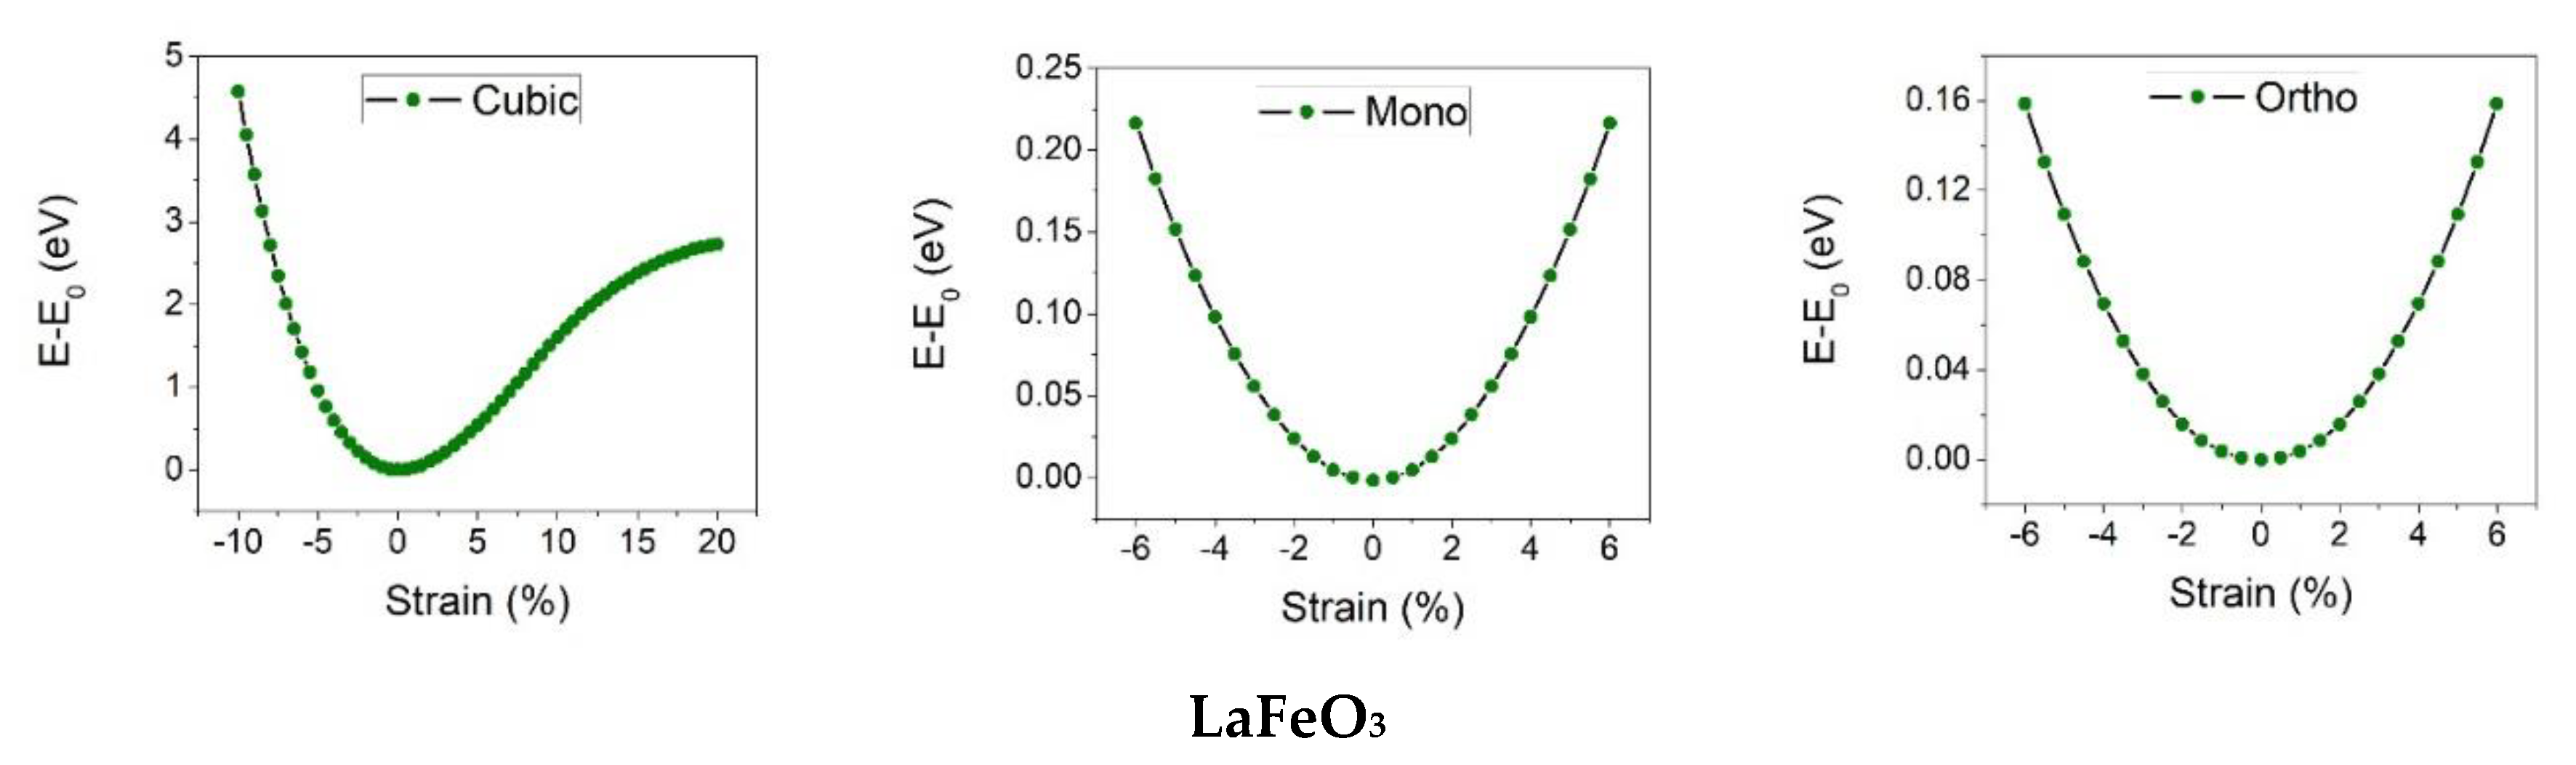
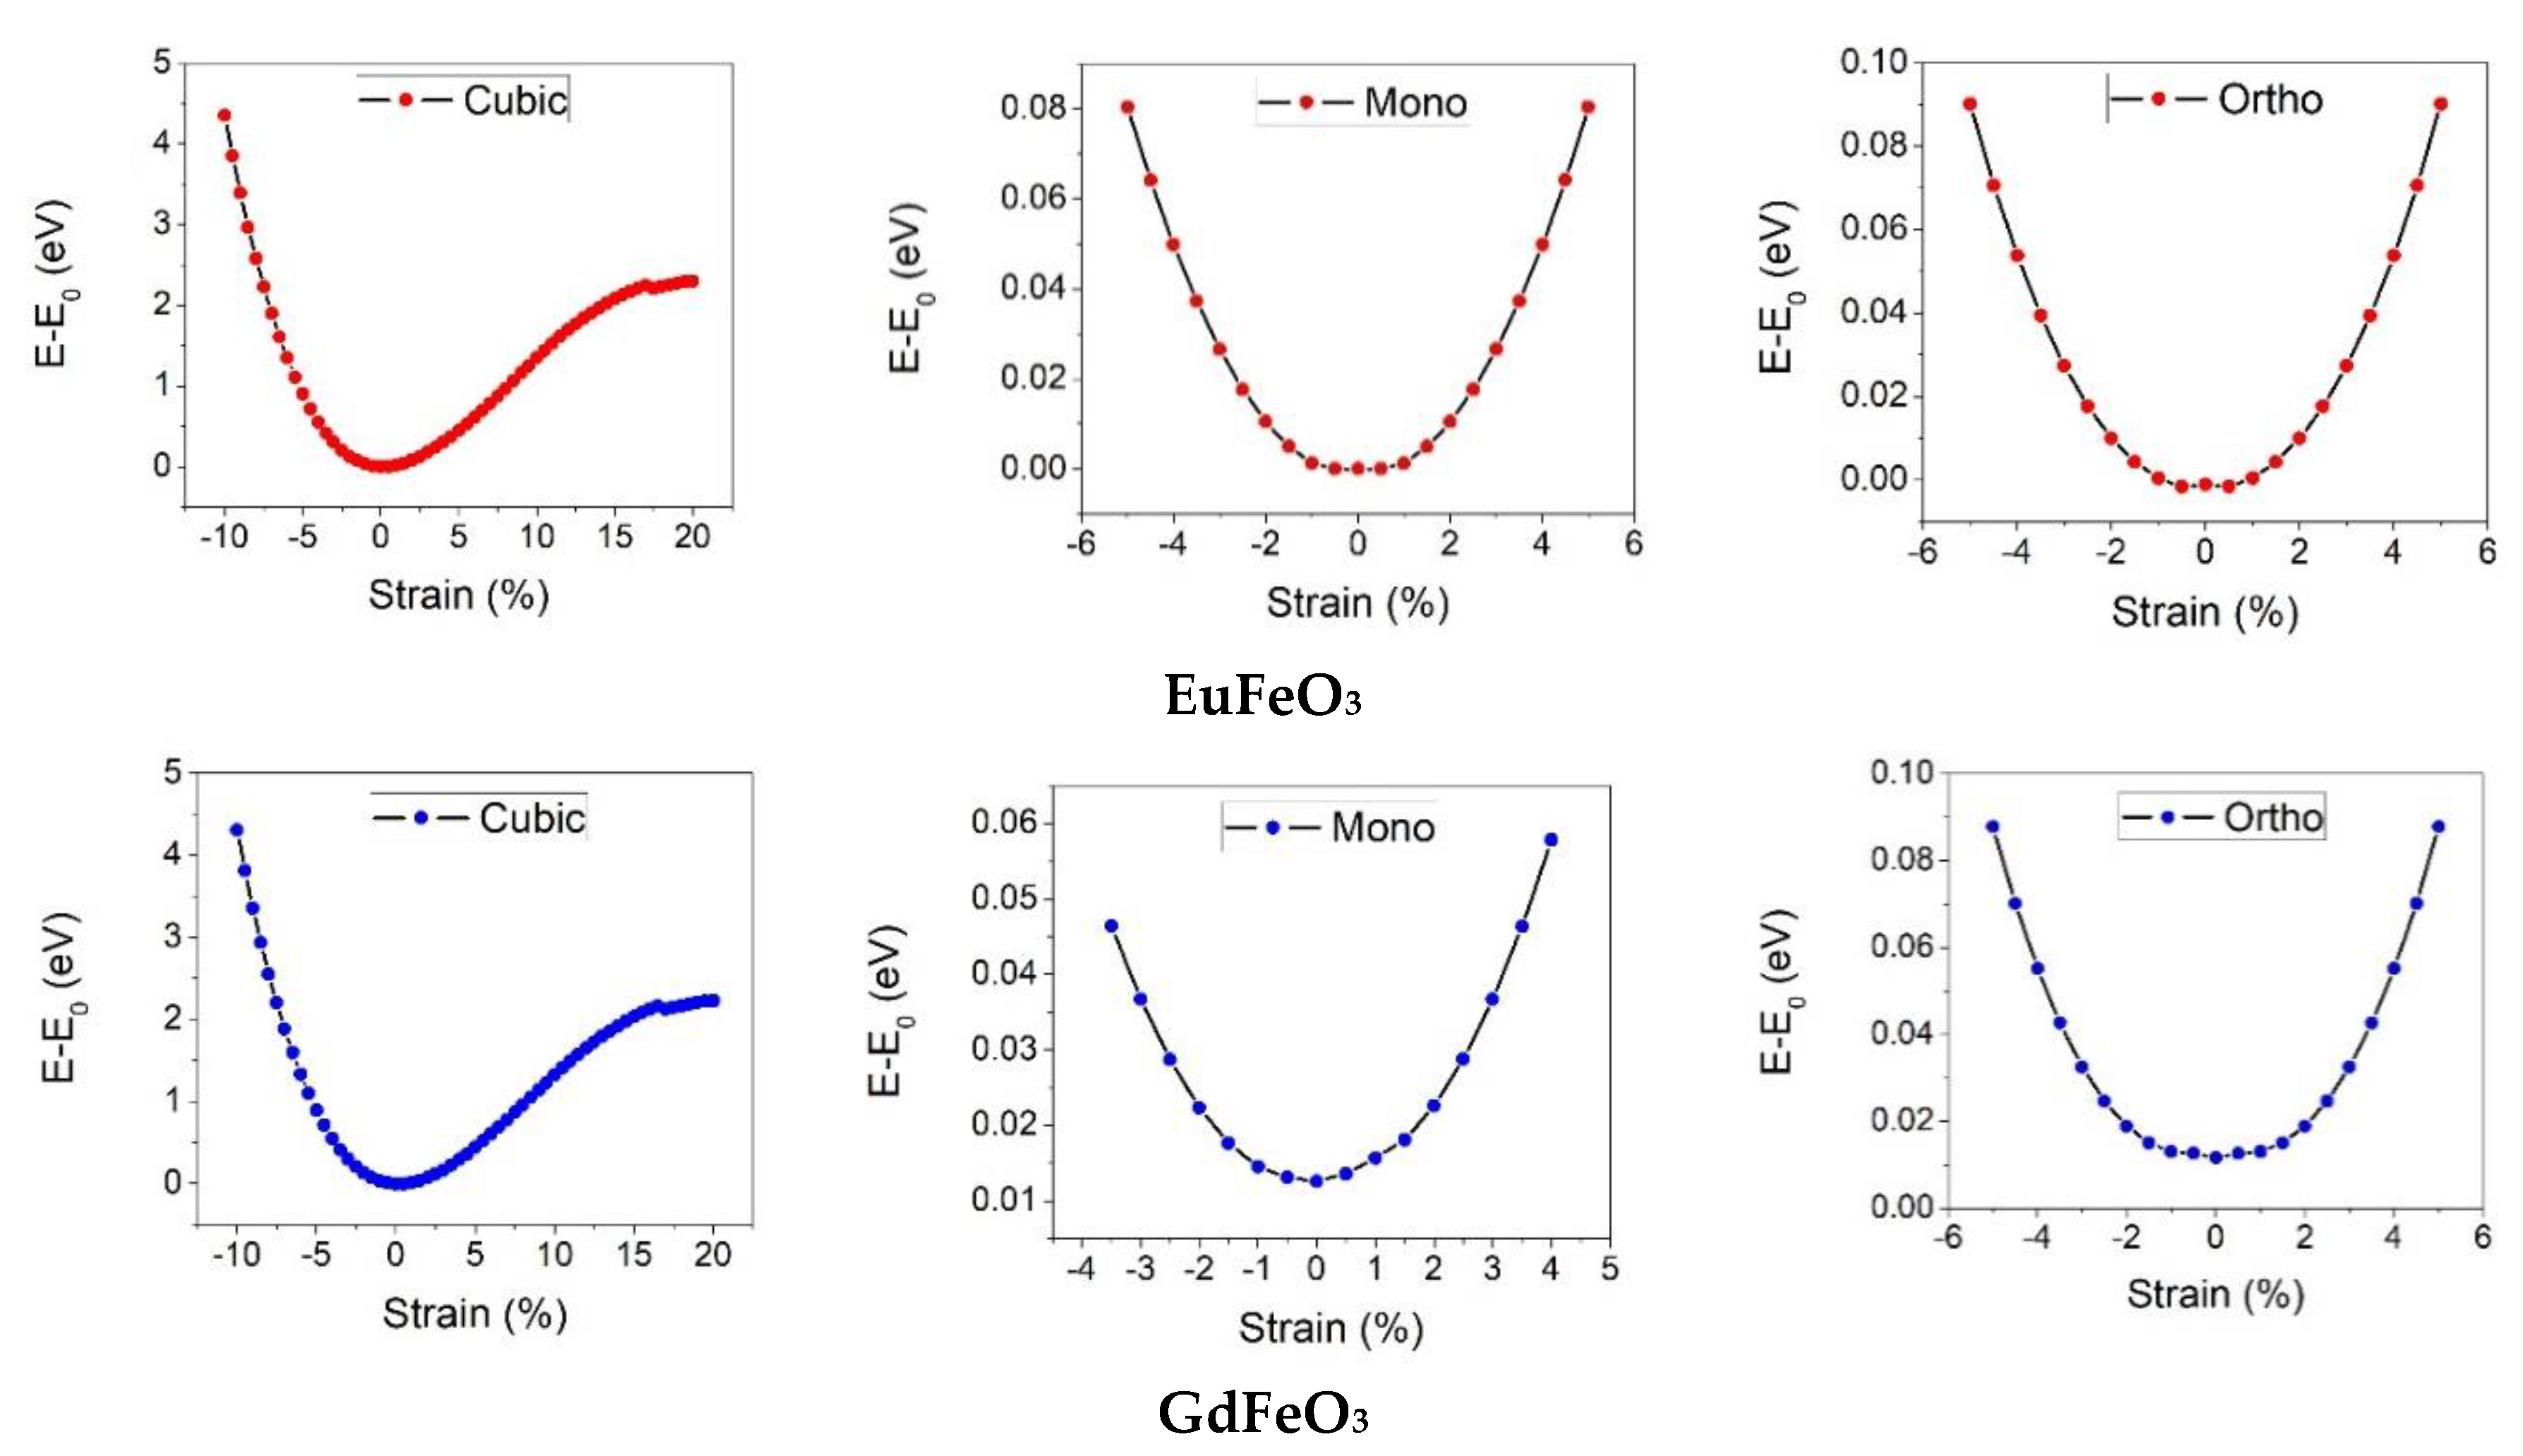
In the first step of obtaining the mechanical properties, the elastic constants of RFeO
3 are calculated. These constants are calculated by applying strain in the harmonic region. The relation between the applied strain under three different deformation moods and the total energy changes is presented in
Figure 2. The other elastic properties such as bulk modulus, Young’s modulus, shear modulus, and Poisson’s ratio are then identified from the elastic constants [
13]. In the Voigt theory, the bulk modulus (
and shear modulus
can be written as [
14]:
While, in Reuss theory, the bulk modulus (
and shear modulus
are written as [
15]:
where S
ij, which is entitled the elastic compliance coefficient, is the inverse of C
ij. Furthermore, in Hill theory, bulk modulus (
and shear modulus
are described as follows [
16]:
Finally, the Young’s modulus (E), and Poisson’s ratio (
) are calculated using Equations (9) and (10), respectively:
The calculated elastic constants of LaFeO
3, EuFeO
3, and GdFeO
3 are reported in
Table 2. To the best of our knowledge, there are limited theoretical and experimental efforts on the prediction of the elastic constants of LaFeO
3, EuFeO
3, and GdFeO
3 with the cubic structure. Therefore, to validate our obtained results, we compare the mechanical properties of rare earth Ferritic perovskites with other oxide perovskites. This helps to achieve a better understanding of the mechanical properties of rare earth Ferritic perovskites. Bannikov [
17] calculated the elastic constants of
as 286.71, 116.46, and 125.61 for BaVO
3, respectively; all of which are at the same order of the elastic constants of RFeO
3 (R = La, Eu, Gd). In addition, the mechanical properties of SrTiO
3 and SrZrO
3 have been investigated by Shein et al. [
18]. They reported the elastic constants
,
, and
and
,
, and
for SrTiO
3 and SrZrO
3, respectively [
18]. The difference in the results (the values of the elastic constants) can be caused due to the influence of some structural factors in these materials such as structural and relative density, metal-oxygen bond strength and interactions between central cation with the scaffold.
Born stability criteria [
19] is a valid criterion to investigate mechanical stability of elastic stiffness constants. For cubic structures these criteria are written as:
According to the Equation (11), all our obtained elastic constants of RFeO
3, as reported in
Table 2, are satisfied by Born stability criterion.
Furthermore, the calculated bulk, Young’s, and shear modulus and Poisson’s ratio for all structures using Equations (3)–(10) are listed in
Table 3. As can be seen in
Table 3, it is clear that with changing the central cation from the left to the right in the periodic table, the bulk modulus decreases. In each period of the periodic table from left to right, the effective nuclear charge on the outer electrons, and accordingly, the nuclear attraction on the valence band electrons increase. Reducing the atomic radius of the central cation increases the compressibility, which has an inverse relation with the bulk modulus. In
Table 4, shear velocity (V
t), compressional velocity (V
l), sound velocity (V
m), and the Debye Temperature (θ
D). The average sound velocity (
) is calculated using Equation (12):
where
and
are the shear velocity, and compressional velocity, respectively, and are dependent on bulk (B) and shear (G) modulus as follows:
The Debye temperature is another physical quantity, which is related to elastic constants, specific heat, and melting point. The relation between Debye temperature and the average sound velocity (
) is described in Equation (15):
where h, k, NA, n, M, and
represent the Planck’s constant, Boltzmann’s constant, Avogadro’s number, atoms in the cation, molecular mass, and density, respectively. The Debye temperature of RFeO
3 (R = La, Eu, Gd) ranged from 503.1 K for GdFeO
3 to 792 K for LaFeO
3, as can be seen in
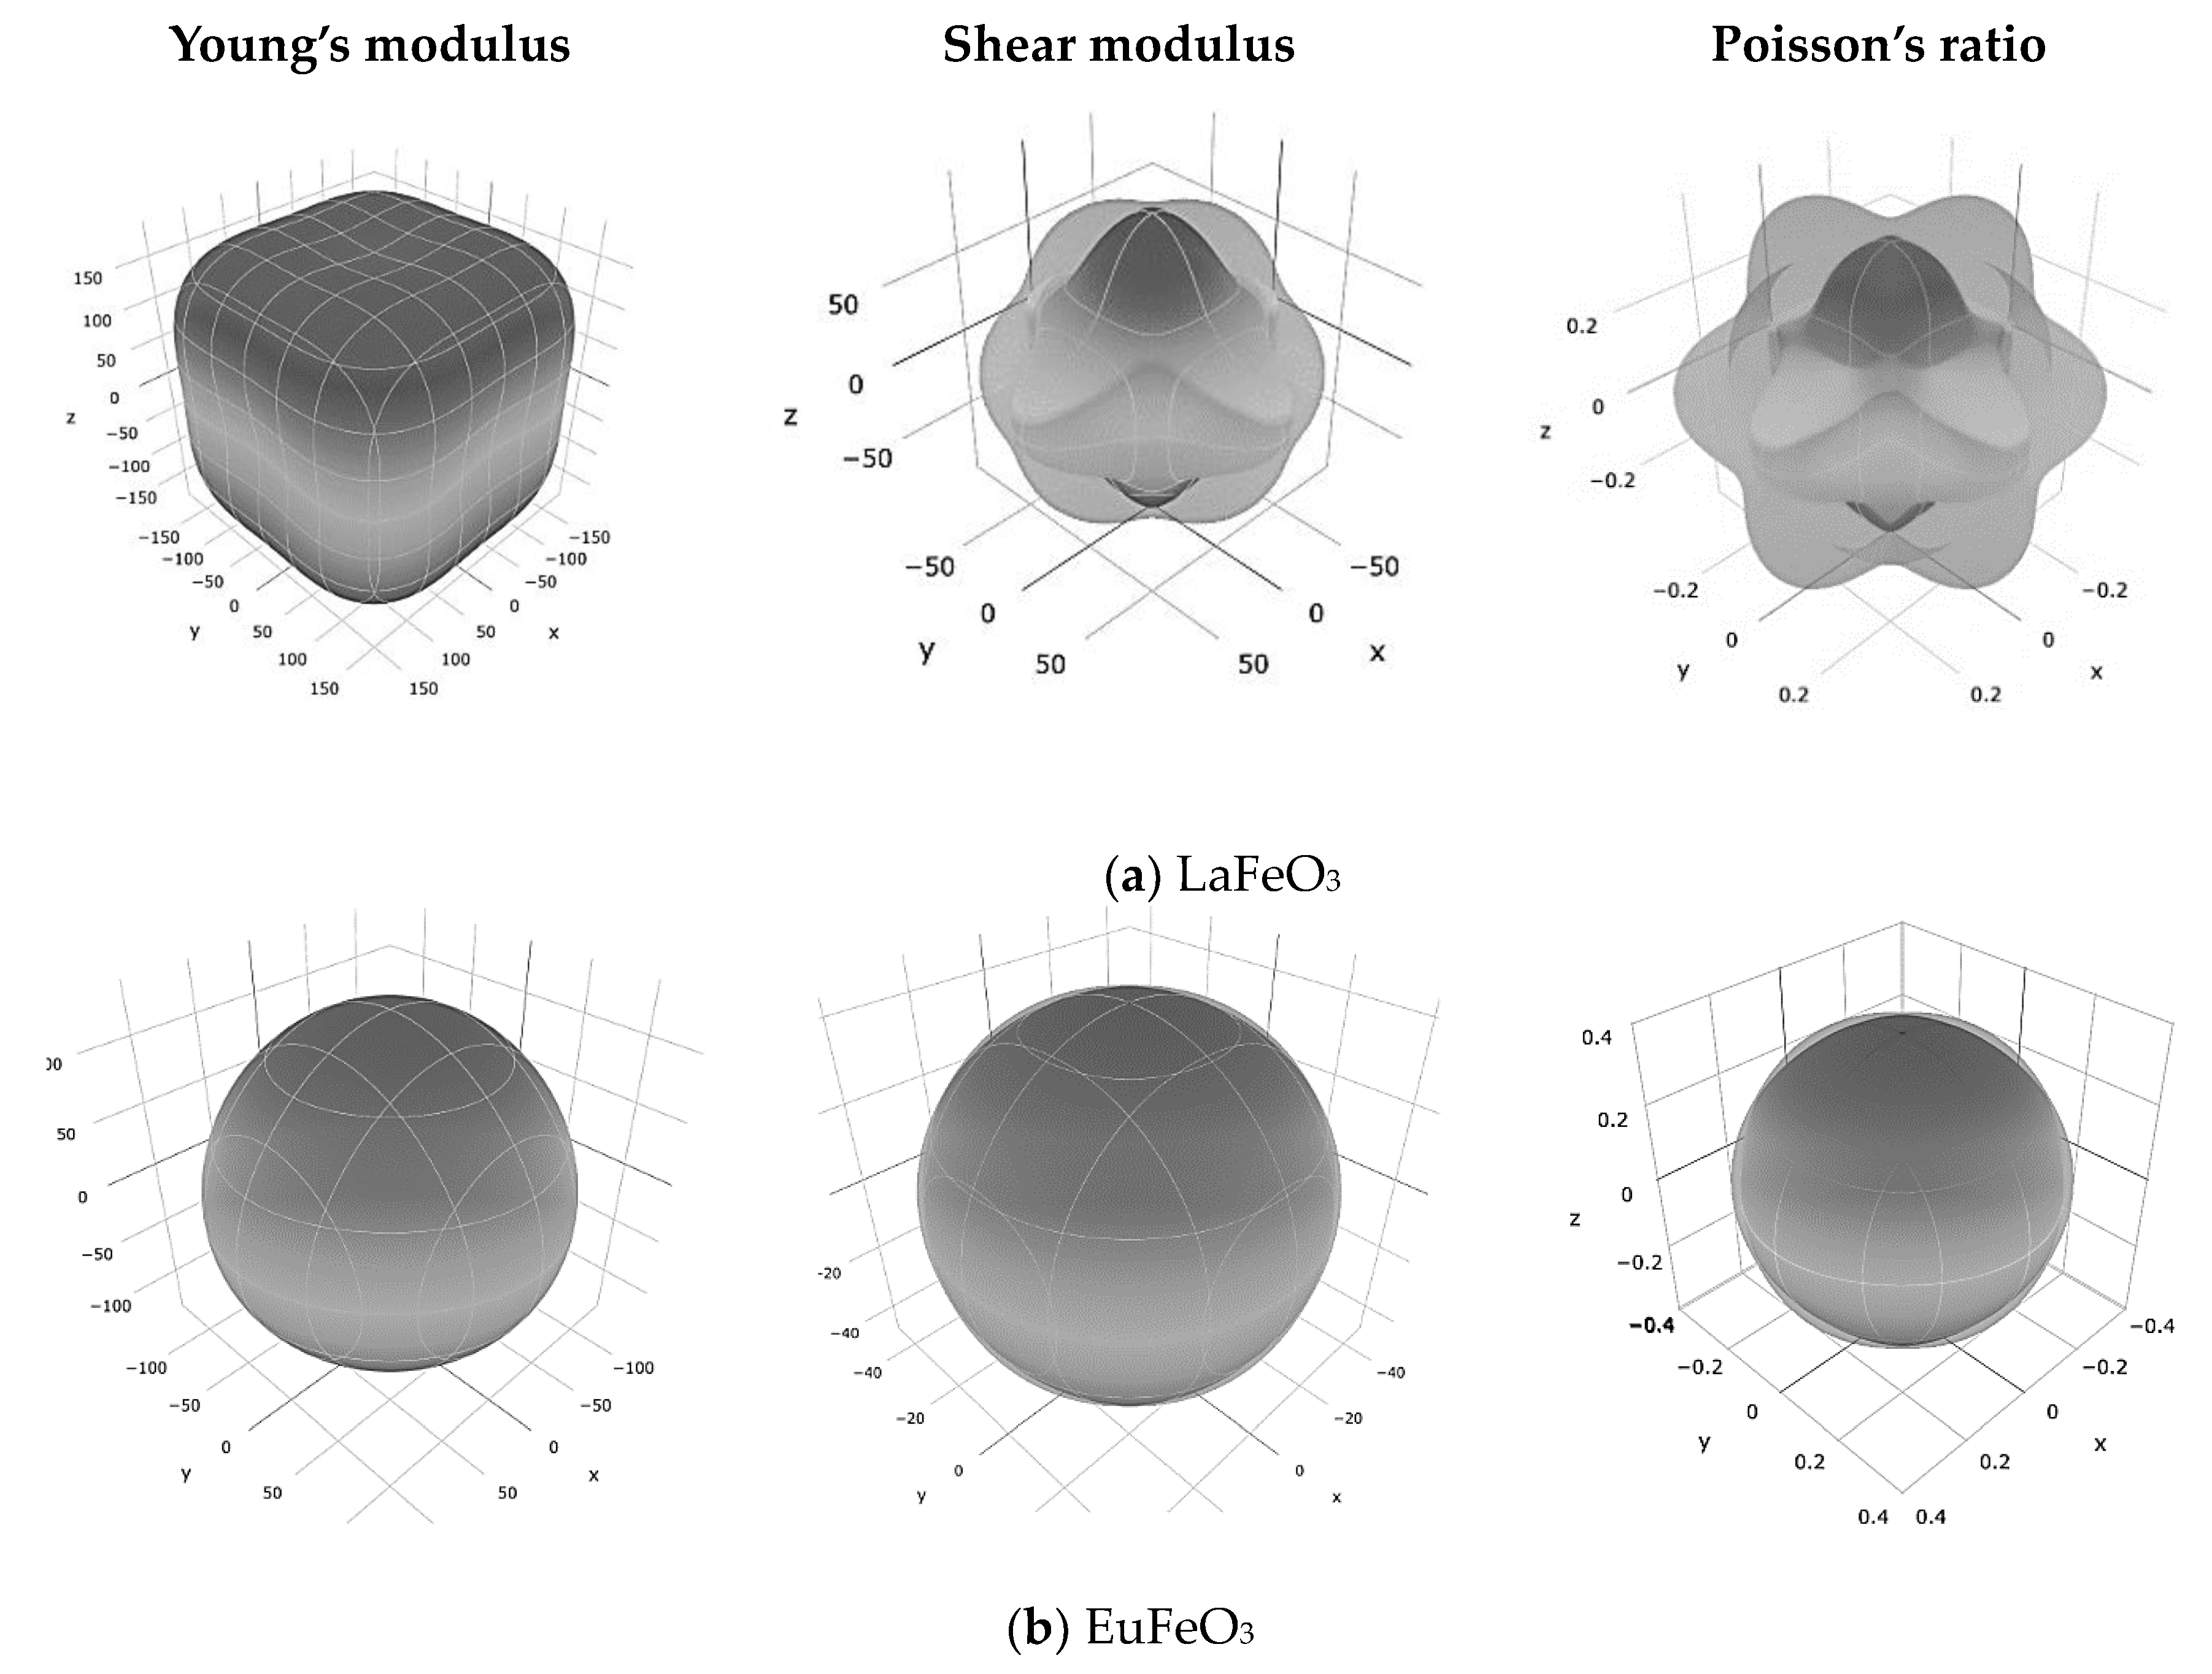
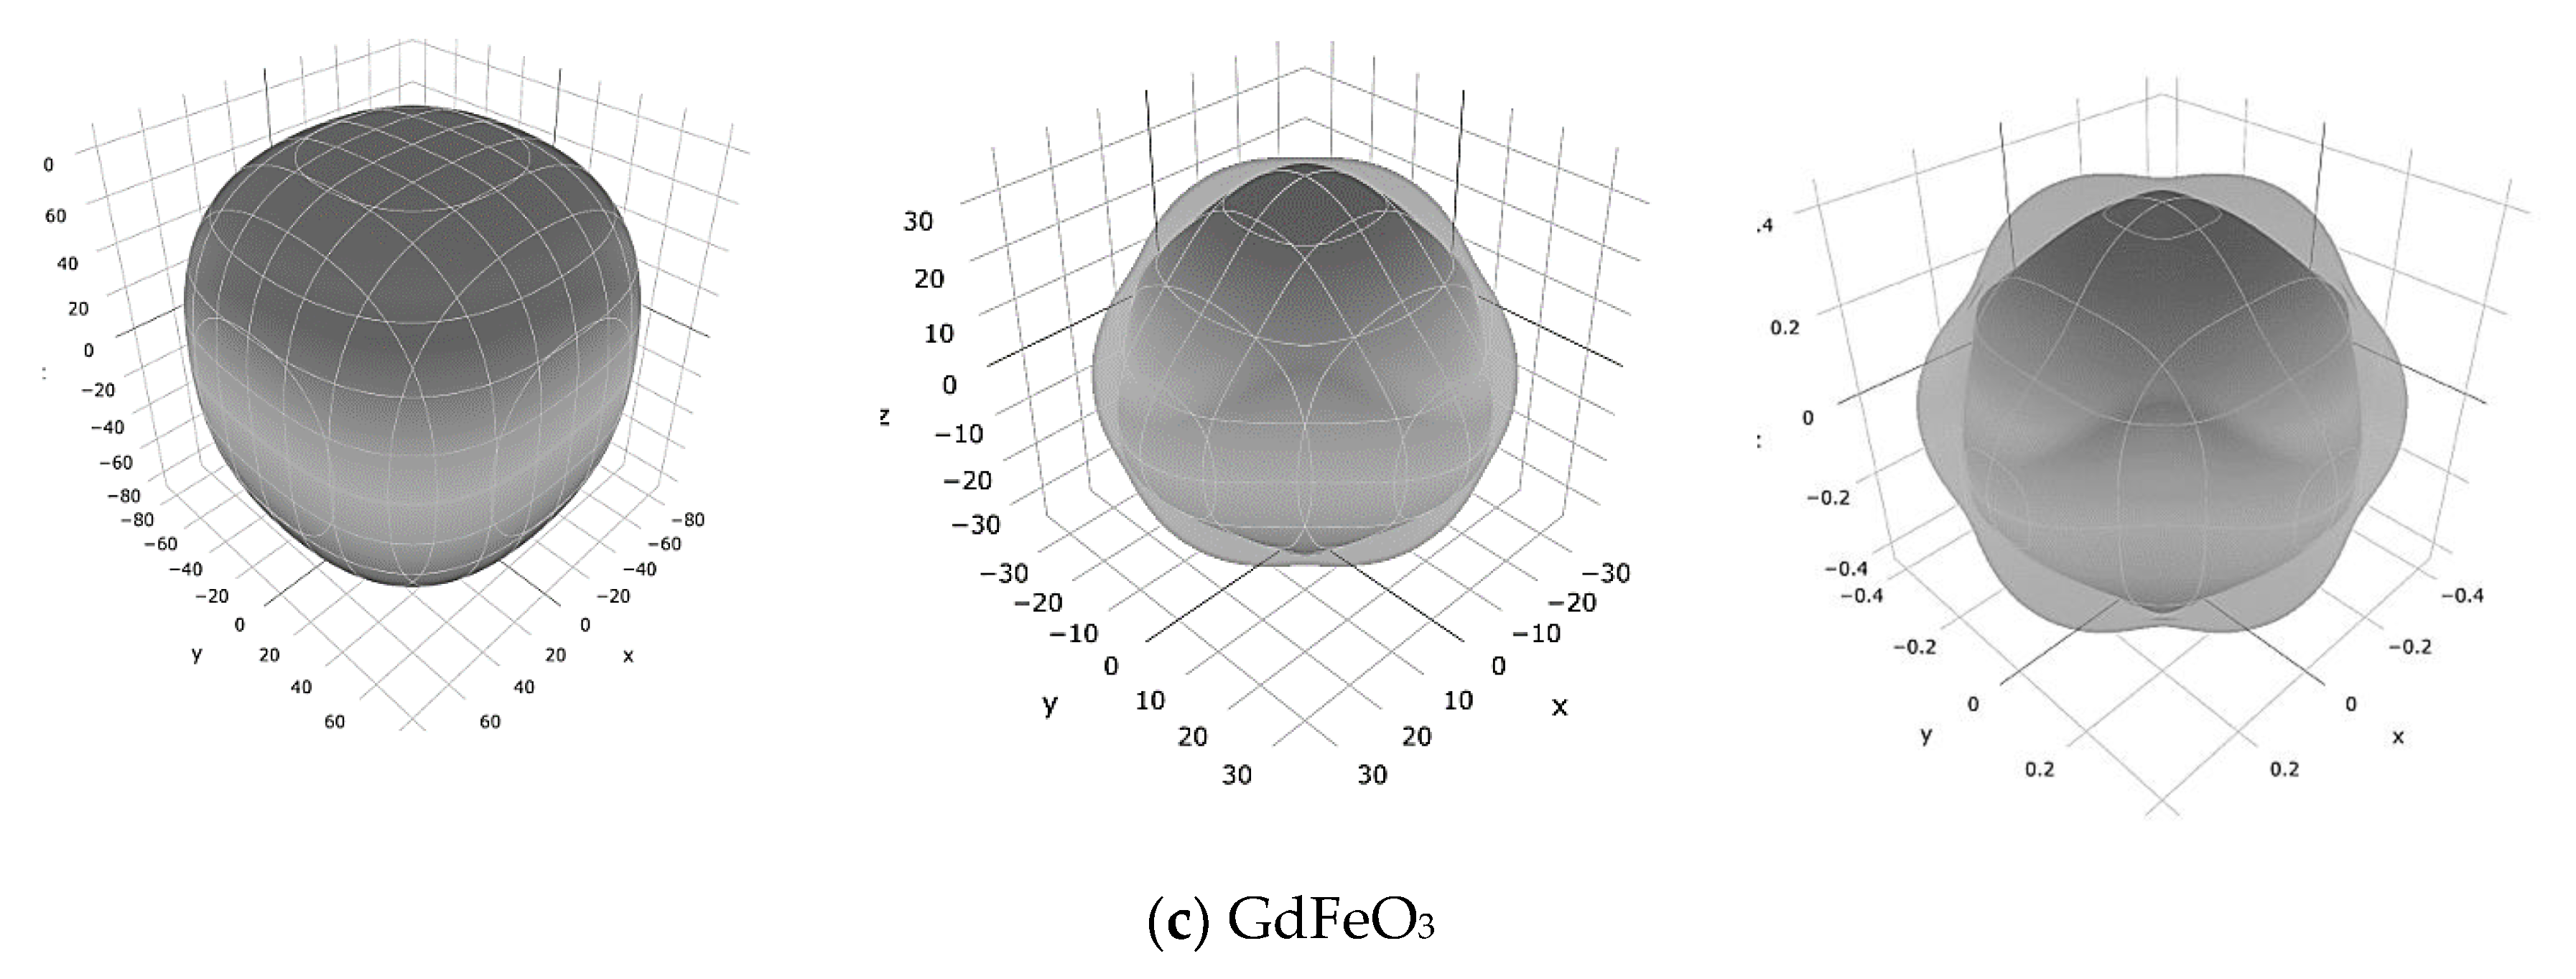
Table 4. The anisotropy of the Young’s and shear modulus of LaFeO
3, EuFeO
3, and GdFeO
3 is illustrated in the form of 3D surface contours in
Figure 3 using ELATE code [
20]. For an isotropic crystal, one sees a spherical shape, while a deviation from a spherical shape can directly reflect the degree of the elastic anisotropy in the crystal. It can be seen that the Young’s modulus of the LaFeO
3 is strongly anisotropic compared to that of two other structures.
In this section, the topological analysis of electron density is performed by employing quantum theory of atoms in molecules (QTAIM) to investigate the role of chemical bonds on the mechanical properties of the studied materials [
21,
22,
23]. A deep understanding between structure (chemical bonds) and mechanical and electronic properties can help to design of low-cost, and scalable materials with enhanced properties. To carry out QTAIM (Bader’s analysis), a single-point calculation of the optimized RFeO
3 structure is done to generate the full electron density (
Table 5). The simulations are conducted by CRITIC2 code which used the core and valence electron densities as input parameters [
24,
25]. Firstly, the critical points (CPs) of the electron density are determined by QTAIM analysis. A critical point together with all downward-gradient lines, all of which have their origins in the critical points, constitute an atomic basin, and are the most important of the regions fulfilling the zero-flux condition [
26].
There are four types of non-degenerate critical points, which are defined by the number of non-zero eigenvalues of the curvature (Hessian) matrix (λ
i) and the sum of the algebraic signs of λ
i. These four critical points of electron density are: maxima (3, −3), minima (3, +3), and two types of saddle points (3, +1) and (3, −1), which are corresponding to the nuclear positions, cages, rings, and bonds, respectively [
26,
27]. In solids, atomic basins are equivalent to polyhedral with curved edges and faces. The crystal partitioning can lead to predict the mechanical properties of RFeO
3 on a local scale interdependent with the atoms in the crystal. The analysis is based on variation of hydrostatic pressure (P) compared to the changes in partition of basin volumes (VΩ). To calculate the bulk modulus B and its derivative with respect to pressure
, the third-order Birch–Murnaphan (BM) equations of state as [
28,
29]:
here
η = V/V
0 is the ratio of volume V at pressure P to equilibrium V
0 at zero pressure, and B
0 is bulk modulus and
. The analysis is based on the partition of the cell volume (V) into basin volumes (V
Ω), which compress differently upon the application of hydrostatic pressure (P). The local bulk modulus
and the bulk modulus (B) of the bulk crystal are defined as:
where f(Ω) is the ratio of total volume (V) to basin volume (
).
As shown in
Table 6, the local bulk modulus is specified for each basin, which is calculated using Equation (17). The incremental amount of the local bulk modulus is maintained by reducing the atomic radius, which is in agreement with our previous results presented in
Table 3. The local bulk modulus of Fe and O in changes from one structure to the other one due to the fact that the atomic environment is not the same in the LaFeO
3, EuFeO
3, and GdFeO
3 structures. Using Equation (18), the bulk modulus of RFeO
3 (R = La, Eu, Gd) structures are obtained by averaging the local bulk modulus (see Total row of B column), which confirms our previous results in
Table 3.
In addition, as can be seen in
Table 6, Q is topological charges of atoms in the crystal, which are calculated using from the integration of each basin corresponding to each atom using Yu and Trinkle method [
30]. Obtained charges for each basin help to specify an important parameter that characterizing the whole charge transfer by averaging the ratios between topological charges Q (Ω) and nominal oxidation states OS (Ω):
where Ω denotes each basin and N is the total number of basins. In this equation C = 1 means the total iconicity, while C = 0 shows total covalency.
Table 6 shows the topological volumes, topological charges, and the C indexes are calculated for LaFeO
3, EuFeO
3, and GdFeO
3. The C index is an important indicator for measure the degree of ionicity of the crystal, where 1−C shows the degree of covalency. The ratio between Q (Ω) and OS (Ω) provides a measurement of the deviation from the ideal ionic model for a given basin Ω. The topological charges (Q) are not close to nominal charges (
) due to the existence of different topological charges for the same atoms in different atomic environments. The calculated C index is 0.59, 0.55, and 0.57 for LaFeO
3, EuFeO
3, and GdFeO
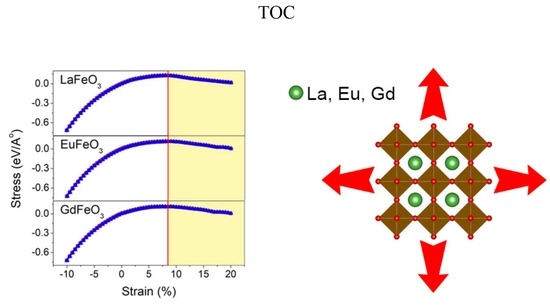
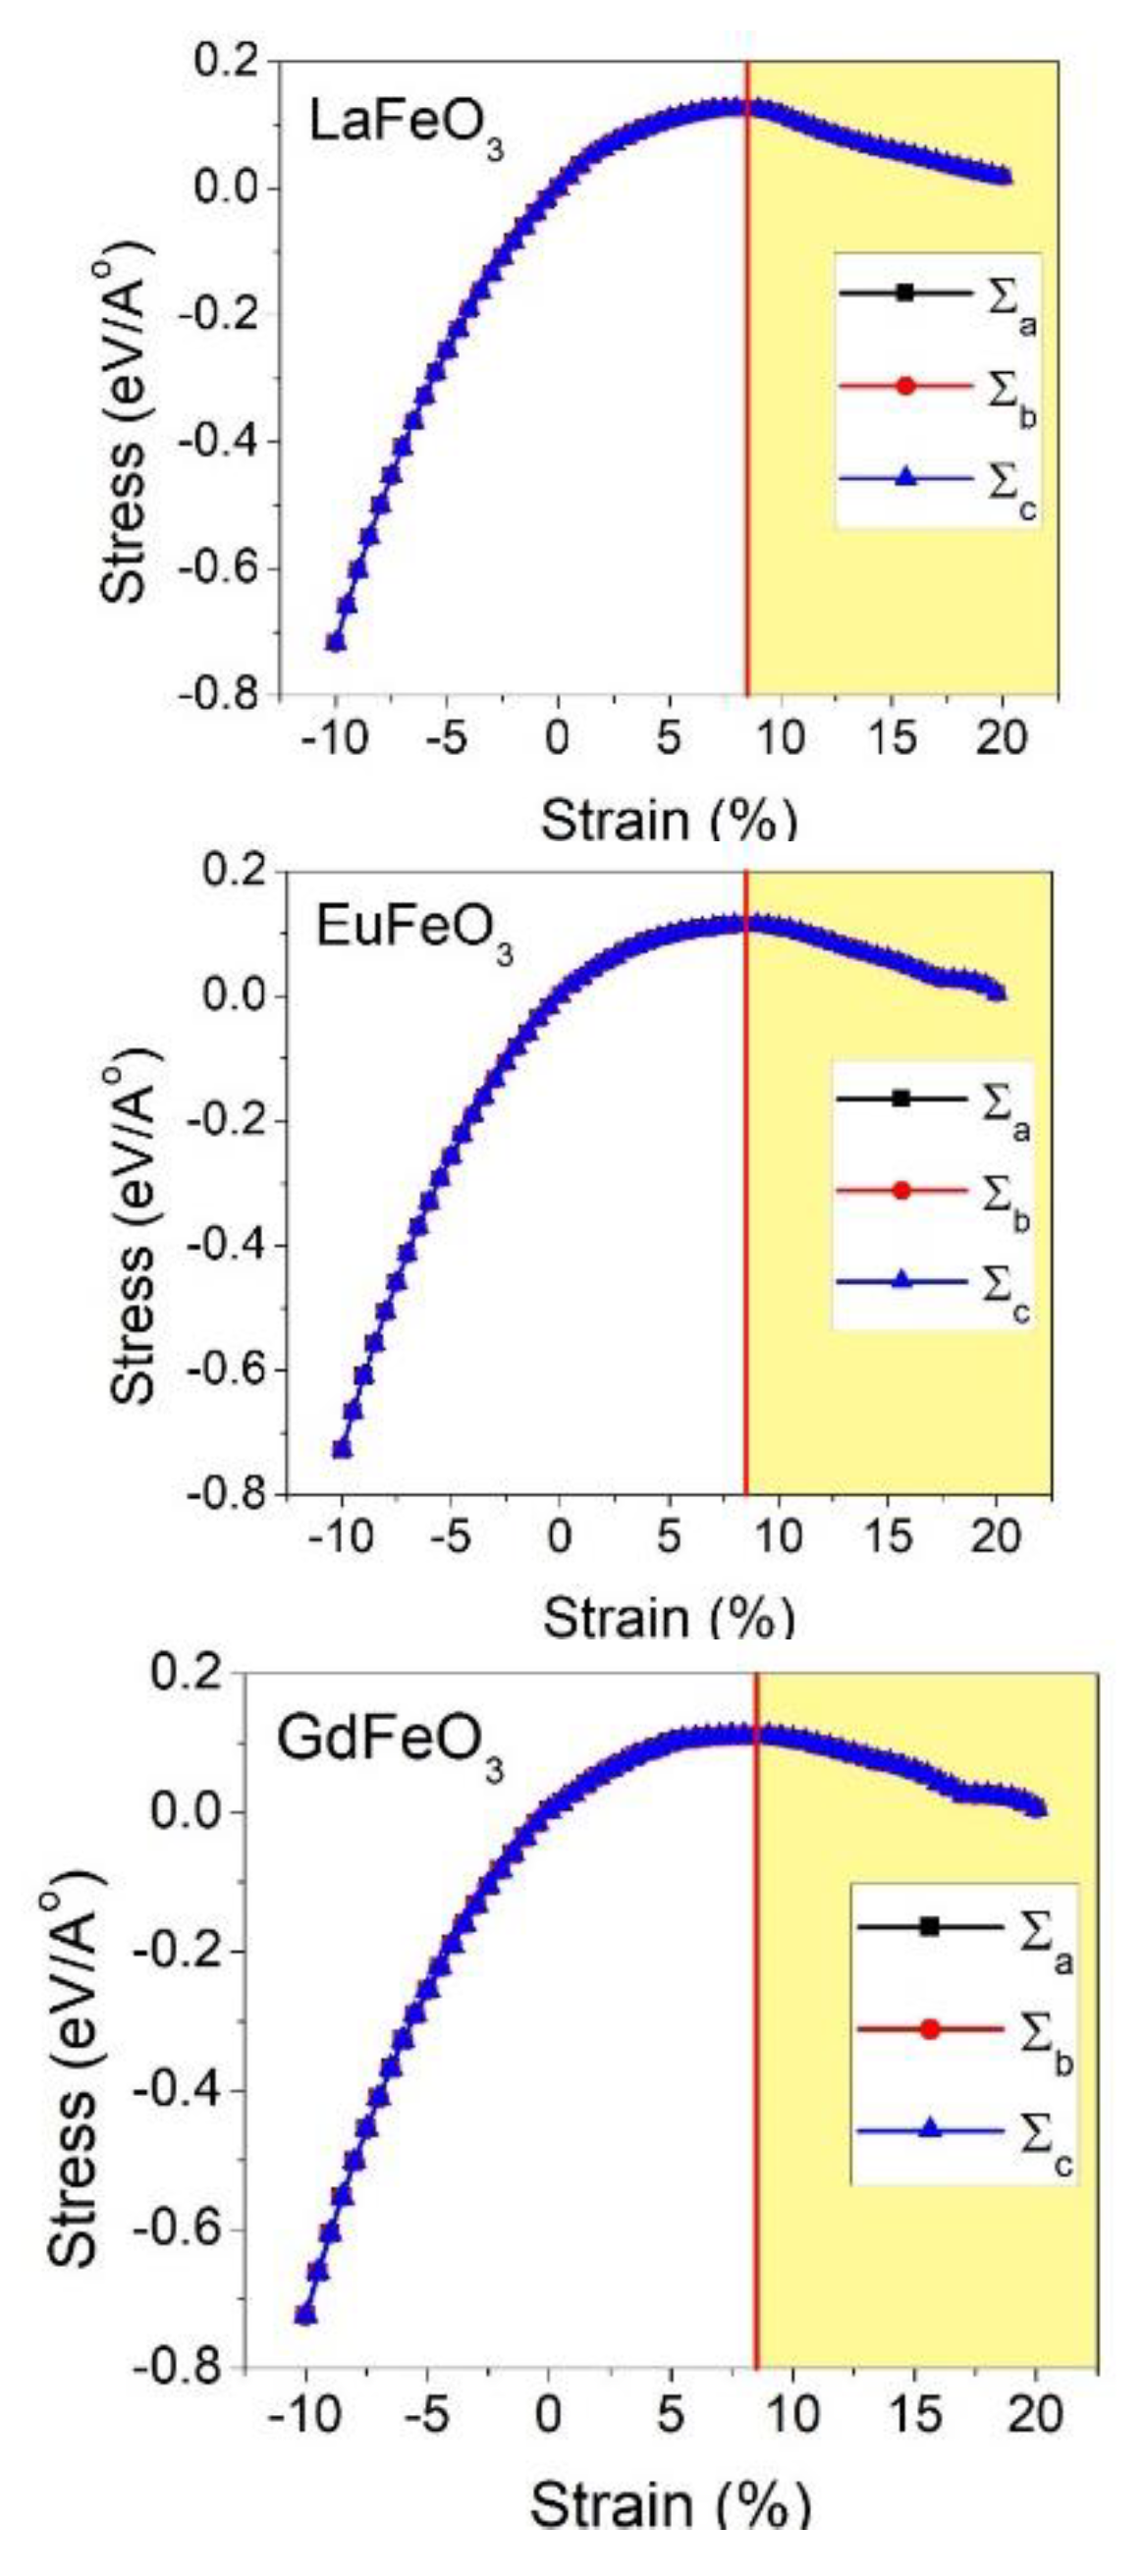
3 compounds, respectively. Another important mechanical property, which is of great importance in the materials design category, is the elastic limit. The elastic limit is the maximum stress that can be applied on the solid material before the permanent or plastic deformation starts. Prior to the elastic limit, by unloading, the material returns to its original undeformed shape. Passing this limit reduces the material’s stiffness and leads to deflections and buckling. This is very important, particularly in thin film applications, where there is a substrate, which strains the film due to the lattice mismatch between the substrate and the thin film. The change of the second Piola–Kirchhoff (PK2) stress with Lagrangian strain is represented in
Figure 4 for all LaFeO
3, EuFeO
3, and GdFeO
3 structures. To obtain the Piola–Kirchhoff (PK2) stress, we applied the cubic deformation tensor on the structures. The PK2 is related to the Cauchy (true) stress (σ), and can be obtained from Equation (20) [
31]:
where J is the determinant of the deformation gradient tensor F. The Cauchy stresses are identified based on DFT calculations in the framework of the PBEsol approximation. The maximum stress in this curve is called the ultimate stress and the corresponding strain at this point is called the ultimate strain. The strain range prior to this ultimate strain point is the uniform elastic region of the material. It should be emphasized that the ultimate stress and strain obtained by this method is under the ideal condition, where there is no crystal defect or thermal effects, which are usually present in the real conditions and lower the strength of the material. The ultimate stress and strain values obtained from the PK2 stress curve are given in
Table 7. From the PK2 stress, it can be seen that both materials behave in a symmetric manner, which is due to the cubic crystal lattice. In addition, from the steep slope in the compression region, it can be concluded that the structures possess higher resistance in compression compared to tension.


