Abstract
In this paper, broadband Spectral Domain Interferometry provides single-shot optical characterization of dispersive thermotropic nematic liquid crystals. The proposed experimental setup enables measuring the chromatic dispersion, the extended Cauchy equation parameters knowing the optical index for one wavelength, and the thermo-optical coefficients to ascribe the dependence of the optical index with the inner temperature. The analysis is applied to the commonly known mixture and to , whose chromatic properties are not referenced although the mixture is commercial, demonstrating the latter’s interest for electro-optical or thermo-optical applications of thick nematic liquid crystal cells.
1. Introduction
The remarkable optical properties of nematic liquid crystals (LC), e.g., tunable birefringence and transparency, induce a growing development of novel photonic applications based on light phase modulation. The mechanism relies on a tunable change of the LC optical index, either due to electrically-induced molecular orientation, or thermal-control of the nematic order [1,2]. Increasing the mixture birefringence together with the liquid crystal layer thickness (e.g., above 50 m) enables enhancing the induced phase-shift and thus develop innovative applications [3,4]. Recently, electrically-addressed large cell gap nematics have attracted interests for terahertz phase shifters [5,6], high-resolution hyperspectral imaging [7,8,9,10], phase and group delay control of ultrashort pulses trains [11], tunable angular shearing in wedge-shaped cells [12] and terahertz vortex beam generators [13], just to cite a few. In such progress, chiral nematics are not in rest with the recent demonstration of sub-picosecond pulse compression [14] and femtosecond pulses dispersion management [15]. Furthermore, self-induced thermo-optical change of the LC birefringence can be exploited to shape infrared femtosecond pulses, through spatial self-phase modulation [16]. Here again, the combination of the LC layer thickness (180 m) and its high birefringence enables achieving large phase-shift of several tens of radians. Very recently, this thermo-optical mechanism resulted in an innovative phase shaper for multi-octave light sources [17].
The continuous quest for more performing mixtures is still very active and new ones are regularly coming out on the market. Among these, (Merck) present some interesting features: a large birefringence (, with , resp. , the refractive index for extraordinary, resp. ordinary, axis) and a high nematic-to-isotropic phase transition temperature ( K). However, although the mixture is referenced in some publications, little information is available and it originates from the manufacturer [18,19]. To determine the advantage of for the above-mentioned applications, an in-depth characterization of its anisotropic optical properties is needed.
The measurement of the optical indices of LC mixtures is usually adapted from methods commonly employed for bulk medium characterization. Therefore, a widespread method to characterize a LC mixture relies on an Abbe Refractometer: precise measurements can be performed in a short time and for both polarization states [20,21], but the monochromatic measurements and the narrow working temperature range still limits the system. A wedged-cell refractometer [22] has been recently reported for precise mid-IR and far-IR measurements (up to 10 m), but the method requires the fabrication of ’ad hoc’ LC wedges. Talbot-Rayleigh refractometer [23] is used for polychromatic refractive indices measurement in less than 1 second, but the resulting low precision and resolution still limit its efficiency. Eventually, some LC drops are also characterized through a Jelley-Leitz refractometer, that requires shear flow to orientate the molecules [24]. On the other side, the conventional birefringence measurements rely on a monochromatic illumination of a LC-cell placed between crossed-polarizers [25]. In that case, the transmitted intensity is written as with . The birefringence is written as: , with (resp. ) the refractive index for extraordinary (resp. ordinary) axis. L is the nematic layer thickness. This method suffers from two drawbacks: the cosine dependence of the retrieved phase decreases the overall sensitivity and the measurement is affected by potential fluctuations of the light intensity.
In this paper, we propose exploiting a simple setup with single-shot acquisition for optical characterization of and comparison with . The principle is based on Spectral Domain Interferometry (SDI). SDI combined with Fourier analysis is a powerful metrology tool, already developed for optical coherent tomography [26], bulk group index measurement [27], phase response of metasurfaces [28] or ultrashort pulse characterization [29,30]. In previous publications, we have shown that common-path SDI performed with femtosecond pulses is suitable to achieve real-time tracking of the electro-optical changes in birefringence of nematics [3,11]. Here, we demonstrate that such a method, combined with broad spectral bandwidth (above 200 nm) and a low-coherence Michelson interferometer, takes advantage of the high chromatic dispersion of thick nematics. It gives access to: (i) the chromatic dispersion parameters (group velocity dispersion and third-order dispersion) of the mixture, (ii) the extended Cauchy-model parameters knowing the optical index for one wavelength, and (iii) the thermo-optical coefficients of the 4 parameters parabolic equations to ascribe the dependence of the optical index with the inner temperature. The widely characterized mixture is first tested and the retrieved parameters are in good agreement with the data found in the literature, proving the relevance of the method [20,31,32]. Then, the preparation, about which little data is published to date, is characterized. For both nematics, the results are collected for the two polarization states. The results asset the interest of for applications for which a large dynamic range of phase change, either electro-optically or thermo-optically induced, is required.
2. Materials and Methods
2.1. Liquid-Crystal Cells
The transmissive LC cells employed in the experiment are home-made with the nematic LC mixture or , inserted in between two 0.7 mm thick BK7 substrates. Both of them support a conductive layer of ITO (Indium-Tin-Oxide) as a transparent electrode. A thin film of polyvinyl alcohol (PVA) is spin-coated on the ITO layer and then rubbed with subsequent strong anchoring to align the molecules in a plane parallel to the substrate. The anchoring conditions determine the average orientation of the director. Two different thicknesses are considered in the following experiments: 205 m to analyze the accumulated chromatic phase (Section 3) and 25 m to investigate the temperature influence (Section 4). The LC thicknesses are measured with an error of ±2 m.
2.2. Experimental Set-Up and Analysis
A versatile, novel instrument to measure the LC refractive indices dependencies is proposed. Our method relies on SDI with a broad spectrum with noticeable advantages compared to the common methods. Indeed, the analysis is resistant to energy fluctuations, provides a good resolution, and is particularly suited to the characterization of dispersive media, as detailed below.
The experimental setup is schematized in Figure 1a. The light source is a broadband fiber super-continuum from Leukos (Electro-Visir-250-VIS-IR, 650 mW, 450–2500 nm), with a selected spectral bandwidth extending between 450 nm and 950 nm. A polarizer defines the linear polarization state. The super-continuum seeds a Michelson interferometer, with a delay line to detune the respective optical path between the two arms. The spectrally resolved interferogram is finally acquired by two different spectrometers in order to catch the full spectral bandwidth (Ocean Optics 400–800 nm and Avantes for 550–880 nm). The Michelson interferometer is first balanced in dispersion. After that, the sample to characterize is inserted in one arm, while an empty LC cell (e.g., two BK7 plates with ITO) is inserted in the reference arm. The only phase difference then originates from the LC mixture. The sample can be rotated in order to scan both refractive indices. A typical fringed spectrum measured for a 200 m optical path detuning between the two arms, corresponding to a group delay difference of 600 fs in this spectral range, is shown in Figure 1b.
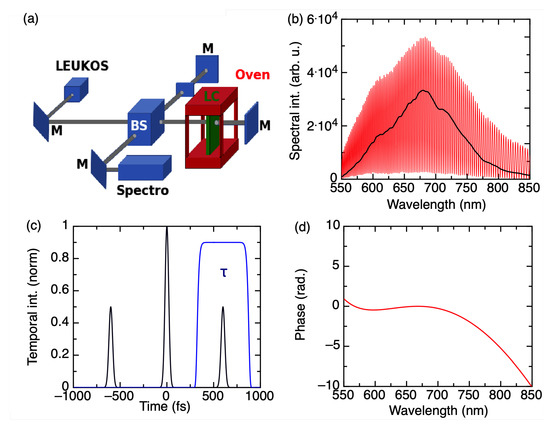
Figure 1.
(a) Experimental set-up: a super-continuum laser source (Leukos) seeds a Michelson interferometer for Spectral Domain Interferometry. A polarizer (P) sets the polarization direction. The LC cell is placed in one arm, and eventually inside an oven (HC photonics corp.) for thermotropy analysis. (F: long-pass filter with nm, D: short-pass dichroic mirror nm, M: mirror, BS: beam splitter, C: compensation plates). (b) Typical one-arm (black) and interference (red) spectra. (c) Fourier Transform of the acquired spectrum (black) and applied temporal filter (blue). (d) Measured spectral phase from FTSI analysis (see text).
The principle of the analysis is then based on Fourier-Transform Spectral Interferometry (FTSI, [33,34]) to retrieve the spectral phase from the interferometer output, as briefly summarized in the following.
The measured interference spectrum can be written as:
where is the initial light intensity, (resp. ) is the spectral phase introduced by the sample (resp. the reference phase) and is the group delay difference between the two optical paths. For a proper FTSI analysis, is chosen so that the two components (t = 0 and t = ) do not overlap in the temporal domain, and is below the upper delay value set by the spectrometer resolution (), in our case nm and ps. A Fourier Transform is applied to and enables determining , as shown in Figure 1c. This is the first output of the calculation. Indeed, monitoring enables monitoring the changes of the optical path, relatively to the initial detuning. To go further, temporal filtering of the term centered in in the Fourier domain and reverse Fourier Transform are applied. The resulting argument is:
The term can be subtracted. Knowing then gives , the unknown sample spectral phase ( Figure 1d). This is the second output of the calculation.
Let’s now consider our sample, a LC layer with thickness L. The group delay introduced by the LC layer is expressed as a function of the group refractive index (e=extraordinary, o=ordinary axis):
The spectral phase introduced by the LC layer is expressed as function of the chromatic dependence of the refractive index (e=extraordinary, o=ordinary axis):
Group delay index variation, , and chromatic dependence of the refractive index of the sample, , can then be recovered with the two outputs of the FTSI technique.
3. Chromatic Index Variation of
3.1. Principle
A first experimental set of measurements is performed at a constant room temperature of 20 C. The thickest cells are employed. The two arms of the interferometer are balanced in dispersion so that the output spectral phase difference only originates from the LC layer, .
A convenient way to write consists of a polynomial development, with the central angular frequency:
where corresponds to a linear group delay term (GD), is the Group Delay Dispersion (GDD) and the third order dispersion (TOD).
We have seen that the output of the FTSI technique gives the sample phase with the first linear order subtracted Equation (2):
Thus, with an iterative method, and its first order derivative are the fitting parameters to retrieve the spectral phase. The latter is measured over two different wavelength ranges: from 450 nm to 700 nm and from 650 nm to 880 nm. However, this method is able to measure only relative dispersion relations, e.g., it is necessary to know the refractive index at one specific wavelength to completely get .
3.2. Experimental Results and Dispersion Coefficients
Experimental recorded spectral phases for and are shown in Figure 2. The results are displayed for both LC axis and both considered spectral bandwidths. A polynomial fit of the measured spectral phases immediately determines GVD (Group Velocity Dispersion) and TOD, calculated for a central wavelength of 750 nm, for both mixtures. They are reported in Table 1. The table also reports GVD and TOD calculated from the chromatic law found in the extensive study of Li and coauthors [31]. The GVD values are found in excellent agreement. The discrepancy for TOD values can originate from the conceptual differences in the performed experiments: a few monochromatic measurements are performed in [31], while we analyze a broad and continuous spectral bandwidth. is established as slightly more dispersive than E7, in a ratio of approximately 1.15, for a central wavelength of 750 nm.
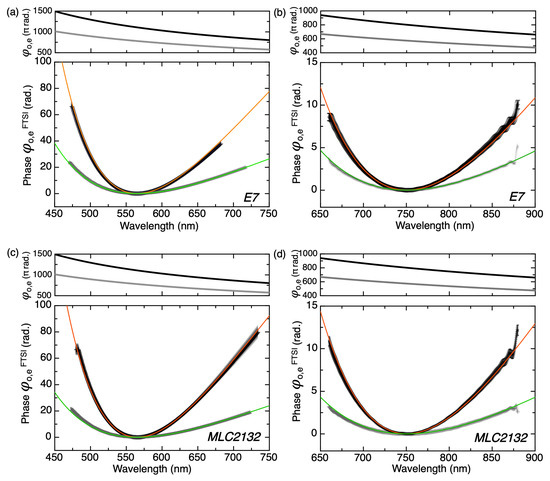
Figure 2.
(a,b) measured and fitted spectral phase (, with the linear group delay term subtracted) for two different wavelength ranges. On both sub-plots are displayed the measurement for the extraordinary (black) and ordinary (grey) axes and the fit (following Equations (7) and (8), see text) for the extraordinary (orange) and ordinary (green) axes. The top insets display the overall phase (extraordinary (black) and ordinary (grey)). (c,d) measured and fitted spectral phase (, with the linear group delay term subtracted) for two different wavelength ranges. On both sub-plots are displayed the measurement for the extraordinary (black) and ordinary (grey) axes and the fit (see text) for the extraordinary (orange) and ordinary (green) axes. The top insets display the overall phase (extraordinary (black) and ordinary (grey)).

Table 1.
GVD () and TOD () coefficients, for = 750 nm, for and on both axis. is the standard deviation of the fitted parameters. GVD () and TOD () values calculated from [31] are shown for comparison. GVD and TOD are respectively expressed in and .
3.3. Extended Cauchy Coefficients
According to [31,32], the off-resonance chromatic dispersion of a LC mixture can be fitted for both indices by the extended Cauchy equation, written as:
where are constants depending on the LC mixture and the polarization state. Fitting the measured spectral phase according to Equation (7) enables determining the coefficients and . is defined with a refractive index value for a given wavelength and lab temperature , known in another way.
From the extensive study of Li [31] are taken the values , for m and . The resulting fits are displayed in Figure 2 and the fitting coefficient are gathered in Table 2. The determined values are consistent with the characterizations reported previously.
Table 2.
and extended Cauchy coefficients, after fitting the experimental data, for both LC axes. is the standard deviation of the fitted parameters. The data are acquired at a lab temperature of 20 C. Parameters values from [31] are shown for comparison.
The mixture is characterized following the same procedure (Figure 2c,d), with the following refractive index values, provided by Merck: , measured for m and . Then, fitting the spectral phase determines the values for the extended Cauchy coefficients, summarized in Table 2.
According to our experimental results for the parameters of Equation (8), the chromatic dependence of indices and group indices for both LC mixtures are plotted in Figure 3.
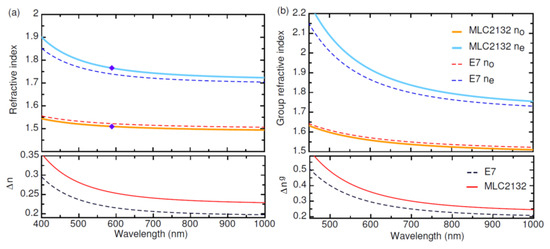
Figure 3.
Chromatic variation of the refractive index and in (a) and chromatic variation of the group refractive index and in (b). The legend stands for (a) and (b): (dotted lines) and (solid lines). Purple dots in (a) are the data provided by the furnisher (20 C).
To conclude this section, the proposed simple experimental method is found valid to characterize the spectral dependence of optical indices of an unknown LC mixture. The chromatic dependence of the two indices (Figure 3) is recovered with a good precision and over a wide spectral bandwidth with only a few data acquisitions. and can be compared. The birefringence of is confirmed to be larger than ( versus , for = 800 nm). Thus, is more suitable for applications that require large tunable phase shift. High-order terms of dispersion are larger as well, hence the introduced phase has to be taken into account when handling ultrashort pulses.
4. Thermotropic Characterization of
4.1. Principle
Liquid crystal molecules are sensitive to temperature and present a large thermal non-linearity of their different optical properties. Some analysis of the behavior of the molecules when changing the inner temperature have been published so far [21,31,32]. A higher temperature contributes to a lower order parameter, leading to a decrease of the overall birefringence up to the clearing point. The isotropic phase temperature, or clearing point, sets the critical temperature for the nematic-to-isotropic phase transition. A few physical models describe the temperature effect on LC refractive indices in the literature. Hallers equation and Vuks model [35,36] disclose the relationship between the birefringence and temperature, but not for the individual refractive indices. More recently, a 4 parameter parabolic model has been proposed [31]. According to this model, both refractive indices evolution with the inner temperature are written as:
where coefficients are constant parameters for a specific mixture. This model has been experimentally validated with several LC mixtures and coefficients are then reported: [31].
The described broadband SDI setup, capable of tracking large dynamic phase changes, is suitable to register the group index evolution with the temperature, for the two axes of the birefringent medium. For this purpose, the LC cell is placed in an oven, whose temperature is constantly monitored. The procedure is the following. First, the cell is heated up until the cell transmission and the fringe contrast are abruptly disrupted because of the contraction of the order parameter with the temperature. When the fringes almost disappear and the acquired signal starts to fluctuate the nematic-to-isotropic transition is reached [37]. From this condition, the cell is cooled down with a decreasing step and 20 min of rest time to reach the thermal equilibrium. Ten interference spectra are acquired for temperature. The group index variation Equation (3) between successive acquisition step is then measured:
where is group delay difference obtained by the FTSI technique and L is the LC thickness. The measurement precision comes from the spectrometer resolution and the LC thickness. Given the first one, an error of fs is assumed which gives an overall uncertainty of 0.005 on .
4.2. Results
For the experiments, we characterized two LC cells with 25 m thickness, respectively filled with and . E7 measurements are first performed: the transition temperature is found at 331 K in excellent agreement with the previous studies [31]. In Figure 4 are reported the experimental group index evolution and the theoretical predictions [31] for both axis. The acquired data agree very well with the theoretical thermotropic prediction, over the whole nematic order, demonstrating that and have the same evolution with the temperature, over the considered spectral range.
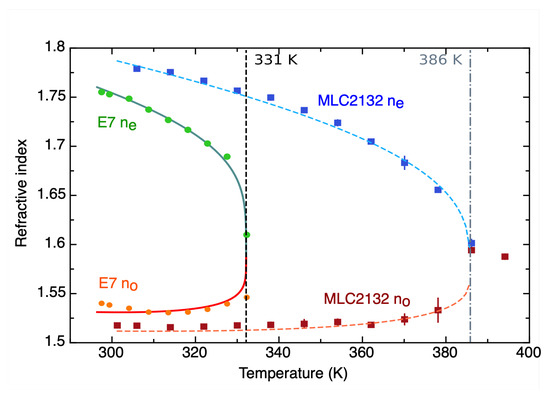
Figure 4.
and refractive indices dependence with the temperature. Dots features experimental data. theoretical curves from [32] are shown with solid lines. Dashed lines: data fit for . The nematic-to-isotropic phase transition temperatures for both mixtures are also indicated.
Therefore, the same experimental process is applied to . The clearing point is found higher, around 386 K, confirming the furnisher data. Experimental results for both axes appear in Figure 4. As explained in [32], these data can be fitted in a two-steps process: D and E are obtained by fitting the average refractive index, while and are obtained with the birefringence excursion as a function of the temperature. The coefficients of Equation (9) for the are then determined, as summarized in Table 3. The birefringence excursion on the extraordinary is also found larger by a factor ∼1.2 compared to .
Table 3.
coefficients for the 4-parameter parabolic model [32]. coefficients for the 4-parameter parabolic model after fitting of the experimental data. The last line indicates the standard deviation of the fitted parameters.
5. Conclusions
In this article, spectral domain interferometry is used for LC mixture optical characterization, relying on broad spectral bandwidth and a low-coherence Michelson interferometer. This method is innovative for optical characterization of thermotropic nematics and it provides single-shot acquisition of the chromatic dispersion of both indices. The relevance and accuracy of the measured chromatic dispersion are first validated for a well-known mixture (). Then, a nearly unknown mixture ( by Merck) is characterized for the first time and the coefficients for the Extended Cauchy equation are proposed. The thermotropicity of the LC mixtures is also studied increasing the inner temperature up to the isotropic phase transition. Once again, measurements are first validated for a well-known mixture () and subsequently, the fitting coefficients for the 4 parameter parabolic equations for are determined. To conclude, can be preferred to when a larger phase shift (or GVD shift) is required. can also be selected when the environment has some temperature fluctuations due to the higher nematic-to-isotropic phase transition temperature. Conversely, E7 can be preferred when less dispersive materials or high temperature sensitivity are necessary.
Author Contributions
Conceptualization, A.J.; Data curation, V.M.d.P. and A.J.; Formal analysis, V.M.d.P. and A.J.; Funding acquisition, A.J.; Investigation, V.M.d.P.; Methodology, V.M.d.P.; Project administration, A.J.; Resources, A.J.; Supervision, A.J.; Validation, V.M.d.P. and A.J.; Visualization, V.M.d.P. and A.J.; Writing—original draft, V.M.d.P. and A.J.; Writing—review & editing, V.M.d.P. and A.J. All authors have read and agreed to the published version of the manuscript.
Funding
This work is supported by the ANR (Agence Nationale de la Recherche) under the project Labcom SOFTLITE (ANR 15-LCV1-0002-01) and under the project Investissements d’Avenir UCA-JEDI with the reference number ANR-15-IDEX-0001 (THERMOPTIX). It has received funding from the European Union’s HORIZON 2020 research and innovation program under the Marie Sklodowska-Curie grant agreement No. 641272. The publication reflects only the author’s view. The Research agency of the European Union is not responsible for any use that may be made of the information it contains.
Conflicts of Interest
The authors have no competing interest to declare.
References
- De Gennes, P.G.; Prost, J. The Physics of Liquid Crystals; Oxford Science Publications: Oxford, UK, 1993. [Google Scholar]
- Khoo, I.-C. Liquid Crystals, Physical Properties and Nonlinear Optical Phenomena; Wiley: Hoboken, NJ, USA, 1995. [Google Scholar]
- DiPietro, V.M.; Jullien, A.; Bortolozzo, U.; Forget, N.; Residori, S. Dynamical optical response of nematic liquid crystal cells through electrically driven Freedericksz transition: Influence of the nematic layer thickness. Opt. Exp. 2018, 26, 10716. [Google Scholar] [CrossRef]
- Melnyk, O.; Garbovskiy, Y.; Bueno-Baques, D.; Glushchenko, A. Electro-Optical Switching of Dual-Frequency Nematic Liquid Crystals: Regimes of Thin and Thick Cells. Crystals 2019, 9, 314. [Google Scholar] [CrossRef]
- Chen, C.-Y.; Hsieh, C.-F.; Lin, Y.-F.; Pan, R.-P.; Pan, C.-L. Magnetically tunable room-temperature 2π liquid crystal terahertz phase shifter. Opt. Express 2004, 12, 2625–2630. [Google Scholar] [CrossRef] [PubMed]
- Yang, C.-S.; Tang, T.-T.; Chen, P.-H.; Pan, R.-P.; Yu, P.; Pan, C.-L. Voltage-controlled liquid-crystal terahertz phase shifter with indium-tin-oxide nanowhiskers as transparent electrodes. Opt. Lett. 2014, 39, 2511–2513. [Google Scholar] [CrossRef] [PubMed]
- Jullien, A.; Pascal, R.; Bortolozzo, U.; Forget, N.; Residori, S. High-resolution hyperspectral imaging with cascaded liquid crystal cells. Optica 2017, 4, 400. [Google Scholar] [CrossRef]
- Shmilovich, S.; Oiknine, Y.; AbuLeil, M.; Abdulhalim, I.; Blumberg, D.G.; Stern, A. Dual-camera design for hyperspectral and panchromatic imaging, using a wedge shaped liquid crystal as a spectral multiplexer. Sci. Rep. 2020, 10, 3455. [Google Scholar] [CrossRef]
- Hegyi, A.; Martini, J. Hyperspectral imaging with a liquid crystal polarization interferometer. Opt. Exp. 2015, 23, 28742. [Google Scholar] [CrossRef]
- August, I.; Oiknine, Y.; AbuLeil, M.; Stern, A. Miniature Compressive Ultra-spectral Imaging System Utilizing a Single Liquid Crystal Phase Retarder. Nat. Sci. Rep. 2016, 6, 23524. [Google Scholar] [CrossRef]
- Jullien, A.; Bortolozzo, U.; Grabielle, S.; Huignard, J.-P.; Forget, N.; Residori, S. Continuously tunable femtosecond delay-line based on liquid crystal cells. Opt. Exp. 2016, 24, 14483. [Google Scholar] [CrossRef]
- Laberdesque, R.; Jullien, A.; Bortolozzo, U.; Forget, N.; Residori, S. Tunable angular shearing interferometer based on wedged liquid crystal cells. Appl. Opt. 2017, 56, 8656–8662. [Google Scholar] [CrossRef] [PubMed]
- Ge, S.; Chen, P.; Shen, Z.; Sun, W.; Wang, X.; Hu, W.; Zhang, Y.; Lu, Y. Terahertz vortex beam generator based on a photopatterned large birefringence liquid crystal. Opt. Express 2017, 25, 12349–12356. [Google Scholar] [CrossRef] [PubMed]
- Chen, C.-W.; Guo, X.; Ni, X.; Lin, T.-H.; Khoo, I.C. Slowing sub-picosecond laser pulses with 0.55 mm-thick cholesteric liquid crystal. Opt. Mater. Exp. 2017, 7, 2005. [Google Scholar] [CrossRef]
- Neradovskiy, M.; Scarangella, A.; Jullien, A.; Mitov, M. Dispersion of 20 fs pulses through bandgap edges of cholesteric liquid crystals. Opt. Express 2019, 27, 21794. [Google Scholar] [CrossRef]
- Di Pietro, V.M.; Jullien, A.; Bortolozzo, U.; Forget, N.; Residori, S. Thermally-induced nonlinear spatial shaping of infrared femtosecond pulses in nematic liquid crystals. Laser Phys. Lett. 2019, 16, 015301. [Google Scholar] [CrossRef]
- Di Pietro, V.M.; Bux, S.; Forget, N.; Jullien, A. Phase-only pulse shaper for multi-octave light sources. Opt. Lett. 2020, 45, 543–546. [Google Scholar] [CrossRef]
- Humar, M.; Musevic, I. 3D microlasers from self-assembled cholesteric liquid-crystal microdroplet. Opt. Express 2010, 18, 26995–27003. [Google Scholar] [CrossRef]
- Mirri, G.; Skarabot, M.; Musevic, I. In situ laser-imprinted surface realignment of a nematic liquid crystal. Soft Matter 2015, 11, 3347. [Google Scholar] [CrossRef]
- Li, J.; Wu, S.-T. Extended Cauchy Equations for the Refractive Indices of Liquid Crystals. J. Appl. Phys. 2004, 95, 896–901. [Google Scholar] [CrossRef]
- Li, J.; Gauza, S.; Wu, S.-T. Temperature effect on liquid crystal refractive indices. J. Appl. Phys. 2004, 96, 19–24. [Google Scholar] [CrossRef]
- Brugioni, S.; Faetti, S.; Meucci, R. Mid-infrared refractive indices of the nematic mixture E7. Liq. Cryst. 2003, 30, 927–930. [Google Scholar] [CrossRef]
- Warenghem, M.; Joly, G. Liquid crystal refractive indices behavior versus wavelength and temperature. Mol. Cryst. Liq. Cryst. 1991, 207, 205–218. [Google Scholar] [CrossRef]
- Vaz, N.A.; Smith, G.W.; Montgomery, G.P.; Marion, W.D. Refractive indices of a Methylstilbene polymer liquid crystal. Mol. Cryst. Liq. Cryst. 2001, 198, 305–321. [Google Scholar] [CrossRef]
- Wu, S.-T.; Efron, U.; Hess, L.D. Birefringence measurements of liquid crystals. Appl. Opt. 1984, 23, 3911. [Google Scholar] [CrossRef] [PubMed]
- Rivet, S.; Bradu, A.; Bairstow, F.; Forrière, H.; Podoleanu, A. Group refractive index and group velocity dispersion measurement by complex master slave interferometry. Opt. Express 2018, 26, 21831. [Google Scholar] [CrossRef]
- Sorin, W.V.; Gray, D.F. Simultaneous Thickness and Group Index Measurement Using Optical Low- Coherence Reflectometry. IEEE Phot. Technol. Lett. 1992, 4, 105. [Google Scholar] [CrossRef]
- Michaeli, L.; Haim, D.B.; Sharma, M.; Sucowski, H.; Ellenbogen, T. Spectral interferometric microscopy for fast and broadband phase characterization. Adv. Opt. Mater. 2020, 2000326. [Google Scholar] [CrossRef]
- Moulet, A.; Grabielle, S.; Cornaggia, C.; Forget, N.; Oksenhendler, T. Single-shot, high-dynamic-range measurement of sub-15 fs pulses by self-referenced spectral interferometry. Opt. Lett. 2010, 35, 3856. [Google Scholar] [CrossRef]
- Shen, X.; Wang, P.; Liu, J.; Kobayashi, T.; Li, R. Self-Referenced Spectral Interferometry for Femtosecond Pulse Characterization. Appl. Sci. 2017, 7, 407. [Google Scholar] [CrossRef]
- Jun, L. Refractive Indices of Liquid Crystals and Their Applications in Display and Photonic Devices. Ph.D. Thesis, University of Central Florida, Orlando, FL, USA, 2005. [Google Scholar]
- Li, J.; Wen, C.H.; Gauza, S.; Lu, R.; Wu, S.T. Refractive Indices of Liquid Crystals for Display Applications. J. Display Technol. 2005, 1, 51. [Google Scholar] [CrossRef]
- Lepetit, L.; Cheriaux, G.; Joffre, M. Linear techniques of phase measurement by femtosecond spectral interferometry for applications in spectroscopy. J. Opt. Soc. Am. B 1995, 12, 2467–2474. [Google Scholar] [CrossRef]
- Borzsonyi, A.; Kovács, A.P.; Osvay, K. What We Can Learn about Ultrashort Pulses by Linear Optical Methods. Appl. Sci. 2013, 3, 515. [Google Scholar] [CrossRef]
- Vuks, M.F. Determination of Optical Anisotropy of Aromatic Molecules from Double Refraction in Crystals. Opt. Spectrosc. 1966, 20, 361. [Google Scholar]
- Haller, I. Thermotropic and static properties of liquid crystals. Prog. Solid State Chem. 1975, 10, 103–118. [Google Scholar] [CrossRef]
- Singh, S. Phase transitions in liquid crystals. Phys. Rep. 2000, 324, 24. [Google Scholar] [CrossRef]


© 2020 by the authors. Licensee MDPI, Basel, Switzerland. This article is an open access article distributed under the terms and conditions of the Creative Commons Attribution (CC BY) license (http://creativecommons.org/licenses/by/4.0/).