1. Introduction
The autonomous vehicle is one of the rapidly evolving technologies that offer enhancement in mobility and positive contributions in terms of environmental impact [
1,
2]. However, the transfer of control from the driver to an autonomous system can trigger motion sickness (MS), an uncomfortable sensation that will negatively affect the user acceptance [
3]. It has been reported that MS is one of the human factor issues that needs a finer understanding, so that vehicle automation can be successfully introduced [
4]. Thus, this study focuses on the MS issue in an autonomous vehicle.
It is well-known that drivers experience less MS than the passengers. In terms of the behavior of the occupants, the factors of MS include the sensory conflict theory and postural instability [
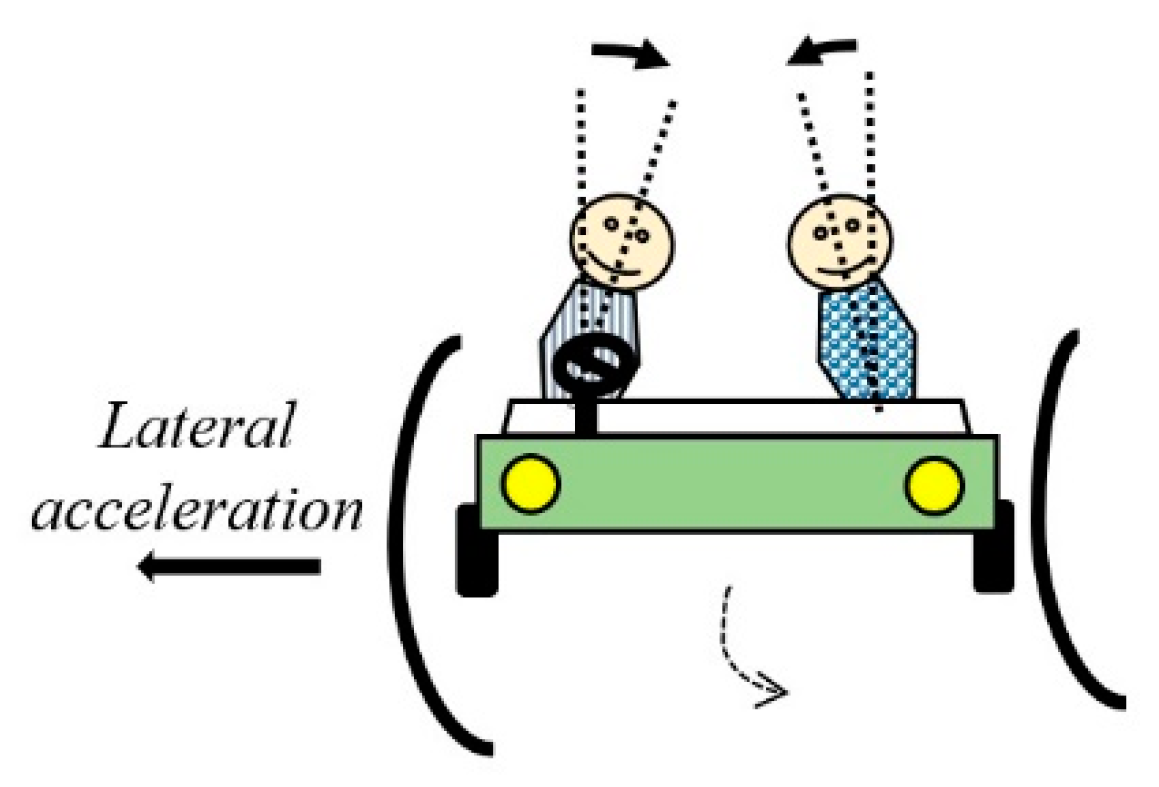
5]. However, this current study was inspired by the findings of Wada et al. whose method was straight forward and thus easy to understand. Those authors stated that the dissimilar head tilt movements by both driver and passenger towards the direction of the lateral acceleration influenced their MS susceptibility [
6,
7]. The same authors also proved that in slalom driving conditions, the head roll angle and lateral acceleration are correlated to each other. As depicted in
Figure 1, in cornering situations, the passengers are more likely to tilt their heads according to the direction of lateral acceleration while the drivers are more likely to tilt their heads against the direction. An understanding of the interaction of head tilt direction and lateral acceleration is important toward the study of MS minimization. The passengers can mitigate their MS level by imitating the driver’s head tilt direction or by reducing their head tilt or head roll angle towards the lateral acceleration direction. For example, a postural device has been successfully invented to reduce the passenger’s head roll angle during curve driving [
8,
9]. However, instead of using devices, implementing a vehicle control system appears to be more practical and less pricey.
In terms of vehicle dynamics, the primary factor of MS is the lateral acceleration generated by the driver’s turning skill. The greater the lateral acceleration produced by the driver, the greater the possibility that the passengers experience MS [
10]. Thus, Elbanhawi et al. proposed that a smooth vehicle lateral control system can solve the MS issue [
11]. Improvement in the lateral control system for an autonomous vehicle can be achieved by integrating a path tracking controller with a path planner [
12], dynamic speed adaptation (DSA) [
13] and torque vectoring control [
14]. Besides combining the path tracking controller with a high-computation control system, the lateral system can also be improved by simply adding a corrective wheel angle to the vehicle. The wheel corrector scheme is known as active steering system, where an additional angle is generated based on the controlled variables which are normally selected from the vehicle states like yaw rate and side slip [
15].
Saruchi et al. succeeded in proposing the development of a MS minimization control strategy, by introducing an estimated head roll angle to represent the controlled variable to produce a corrective wheel angle [
16]. The proposed control strategy is based on the MS occurrence factors from occupant behavior and vehicle dynamic perspectives. The goal of the control strategy is to diminish the lateral acceleration to minimize the passenger’s head roll angle, which will subsequently mitigate their level of MS. However, the study only applied a conventional fuzzy logic controller (FLC) as the corrective wheel angle generator. The other drawback of the study is that it only tested the MS mitigation control system in simulation. Therefore, to extend the previous study, the main contribution of this study is to propose the utilization of a fuzzy-proportional integral derivative (PID) controller to compute the corrective wheel angle and also to evaluate the proposed system in the hardware platform by using driving simulator.
PID is a well-known conventional controller that is simple and reliable [
17]. However, the shortcoming of the conventional PID is its difficulty in controlling nonlinear and higher-order plants [
18]. FLC mimics human perception in decision making, which turns it into an effective method to be applied in the nonlinear system [
19]. One of FLC advantages is that it does not require the mathematical definition of the control plant beforehand. It has been reported that the hybrid combination of a FLC and a PID, which known as fuzzy-PID has better control performance than the conventional controller alone [
20].
In the MS minimization control strategy, the estimated driver’s head roll angle is treated as the desired response while the estimated passenger’s head roll angle is used as the actual response. The reasons of using estimated responses are due to the absence of the driver in the autonomous vehicle and the impracticality of attaching motion sensors on the passengers during travel. The implementation of the estimated head roll to represent the controlled variable can be realized by developing a prediction model to produce the estimated head roll responses. As mentioned before, it is a fact that the occupant’s head roll angle has correlation with the lateral acceleration. Hence, head roll estimation can be carried out by establishing a model that represents the correlation. The correlation model will be used to predict the head roll responses based on the information of lateral acceleration. In previous research works, the correlation model had been established by system identification (SI) [
21,
22], artificial neural network (ANN) [
23], time delay neural network (TDNN) [
24] and radial basis function neural network (RBFNN) methods [
25]. The success of the application of the head roll prediction model developed by the RBFNN method in MS minimization control system is proven by Saruchi et al. [
16]. Thus, similarly, this study implemented the RBFNN method to produce the prediction model. The prediction model is taken from the previous work, with the details of the modeling process available in Reference [
25].
2. Methodology
2.1. Structure of the Proposed MS Minimisation Control Strategy
Figure 2 depicts the proposed MS minimization control structure. It consists of an outer and an inner loop system. The outer loop is a path tracking system, where the vehicle tracks the desired coordinates,
and heading,
. The system applies a Stanley controller to obtain the wheel angle,
from the information of lateral error,
and heading error,
.
is computed based on the desired coordinates,
and the current vehicle coordinates,
while
is calculated based on the desired heading,
and the current heading,
.
Based on
Figure 2, the focus of this study is the usage of fuzzy-PID controller in the inner loop with a dedicated purpose to compute an additional corrective wheel angle,
to diminish the lateral acceleration,
. The scaling factors,
,
,
,
of the Fuzzy-PID are optimized by using particle swarm optimization (PSO) to acquire the optimal values. The corrective wheel angle,
is computed by the fuzzy-PID controller. The inputs for the fuzzy-PID are head roll error,
and derivative head roll error,
. The responses of estimated driver’s and passenger’s head roll angles,
,
represent desired and actual responses. The difference between these responses is calculated to compute head roll error,
.
Both head roll responses are estimated by RBFNN modeling method. The input of the RBFNN prediction model is the lateral acceleration, . An experiment is carried out to provide data for the modeling process. Lastly, the wheel angle generated by the path tracking, and the corrective wheel angle produced by Fuzzy-PID controller, are totaled and become the final wheel angle input, .
2.2. Outer Loop: Nonlinear Vehicle Model
Figure 3 shows the illustration of the 7-degrees-of-freedom (DOF) nonlinear vehicle system model that is utilized in this study. The vehicle model consists of 3-DOF to represent the vehicle in the lateral, longitudinal and yaw motion with 1-DOF contributing to the rotational motion of each wheel.
Based on
Figure 3, the governing equations of the model are expressed as follows [
26]:
where
and
are the lateral and longitudinal velocities and
is the yaw rate.
and
(
are the wheel’s longitudinal and lateral forces.
The vehicle model consisted of quasi-static load transfer to generate normal force generations. The normal load equations are given by:
where
is the gravitational acceleration,
is the centre of gravity height,
is the longitudinal acceleration,
is the lateral acceleration and
T is the track width.
The vehicle system used nonlinear wheel model whereas the equations can be referred in [
27].
Table 1 tabulates the vehicle model parameters.
2.3. Outer Loop: Stanley Controller
Figure 4 shows the configuration of the Stanley controller which applied in the path tracking control system. The Stanley controller produces the wheel angle,
based on the desired trajectory.
Based on
Figure 4, the control law of the Stanley can be derived as follows [
28]:
where
is the gain parameter.
The control law in (6) is saturated by
as demonstrated in (7). Considering the limitation of the system in delivering fast response,
is set to be ±17° in both directions. This is the region in which the wheel is tested and managed to achieve satisfactory performance in the matter of accuracy and delay.
At this juncture, the value of
was determined by simulating the outer loop of the proposed control structure using the pre-defined path in
Figure 5. The slalom path is derived from the average driving pattern during the data collection experiment. The details of the experiment will be elaborated later in
Section 2.4. Based on the saturation limit in (7), the appropriate value of
chosen here is 4.3.
2.4. Radial Basis Function Neural Network (RBFNN) Modeling
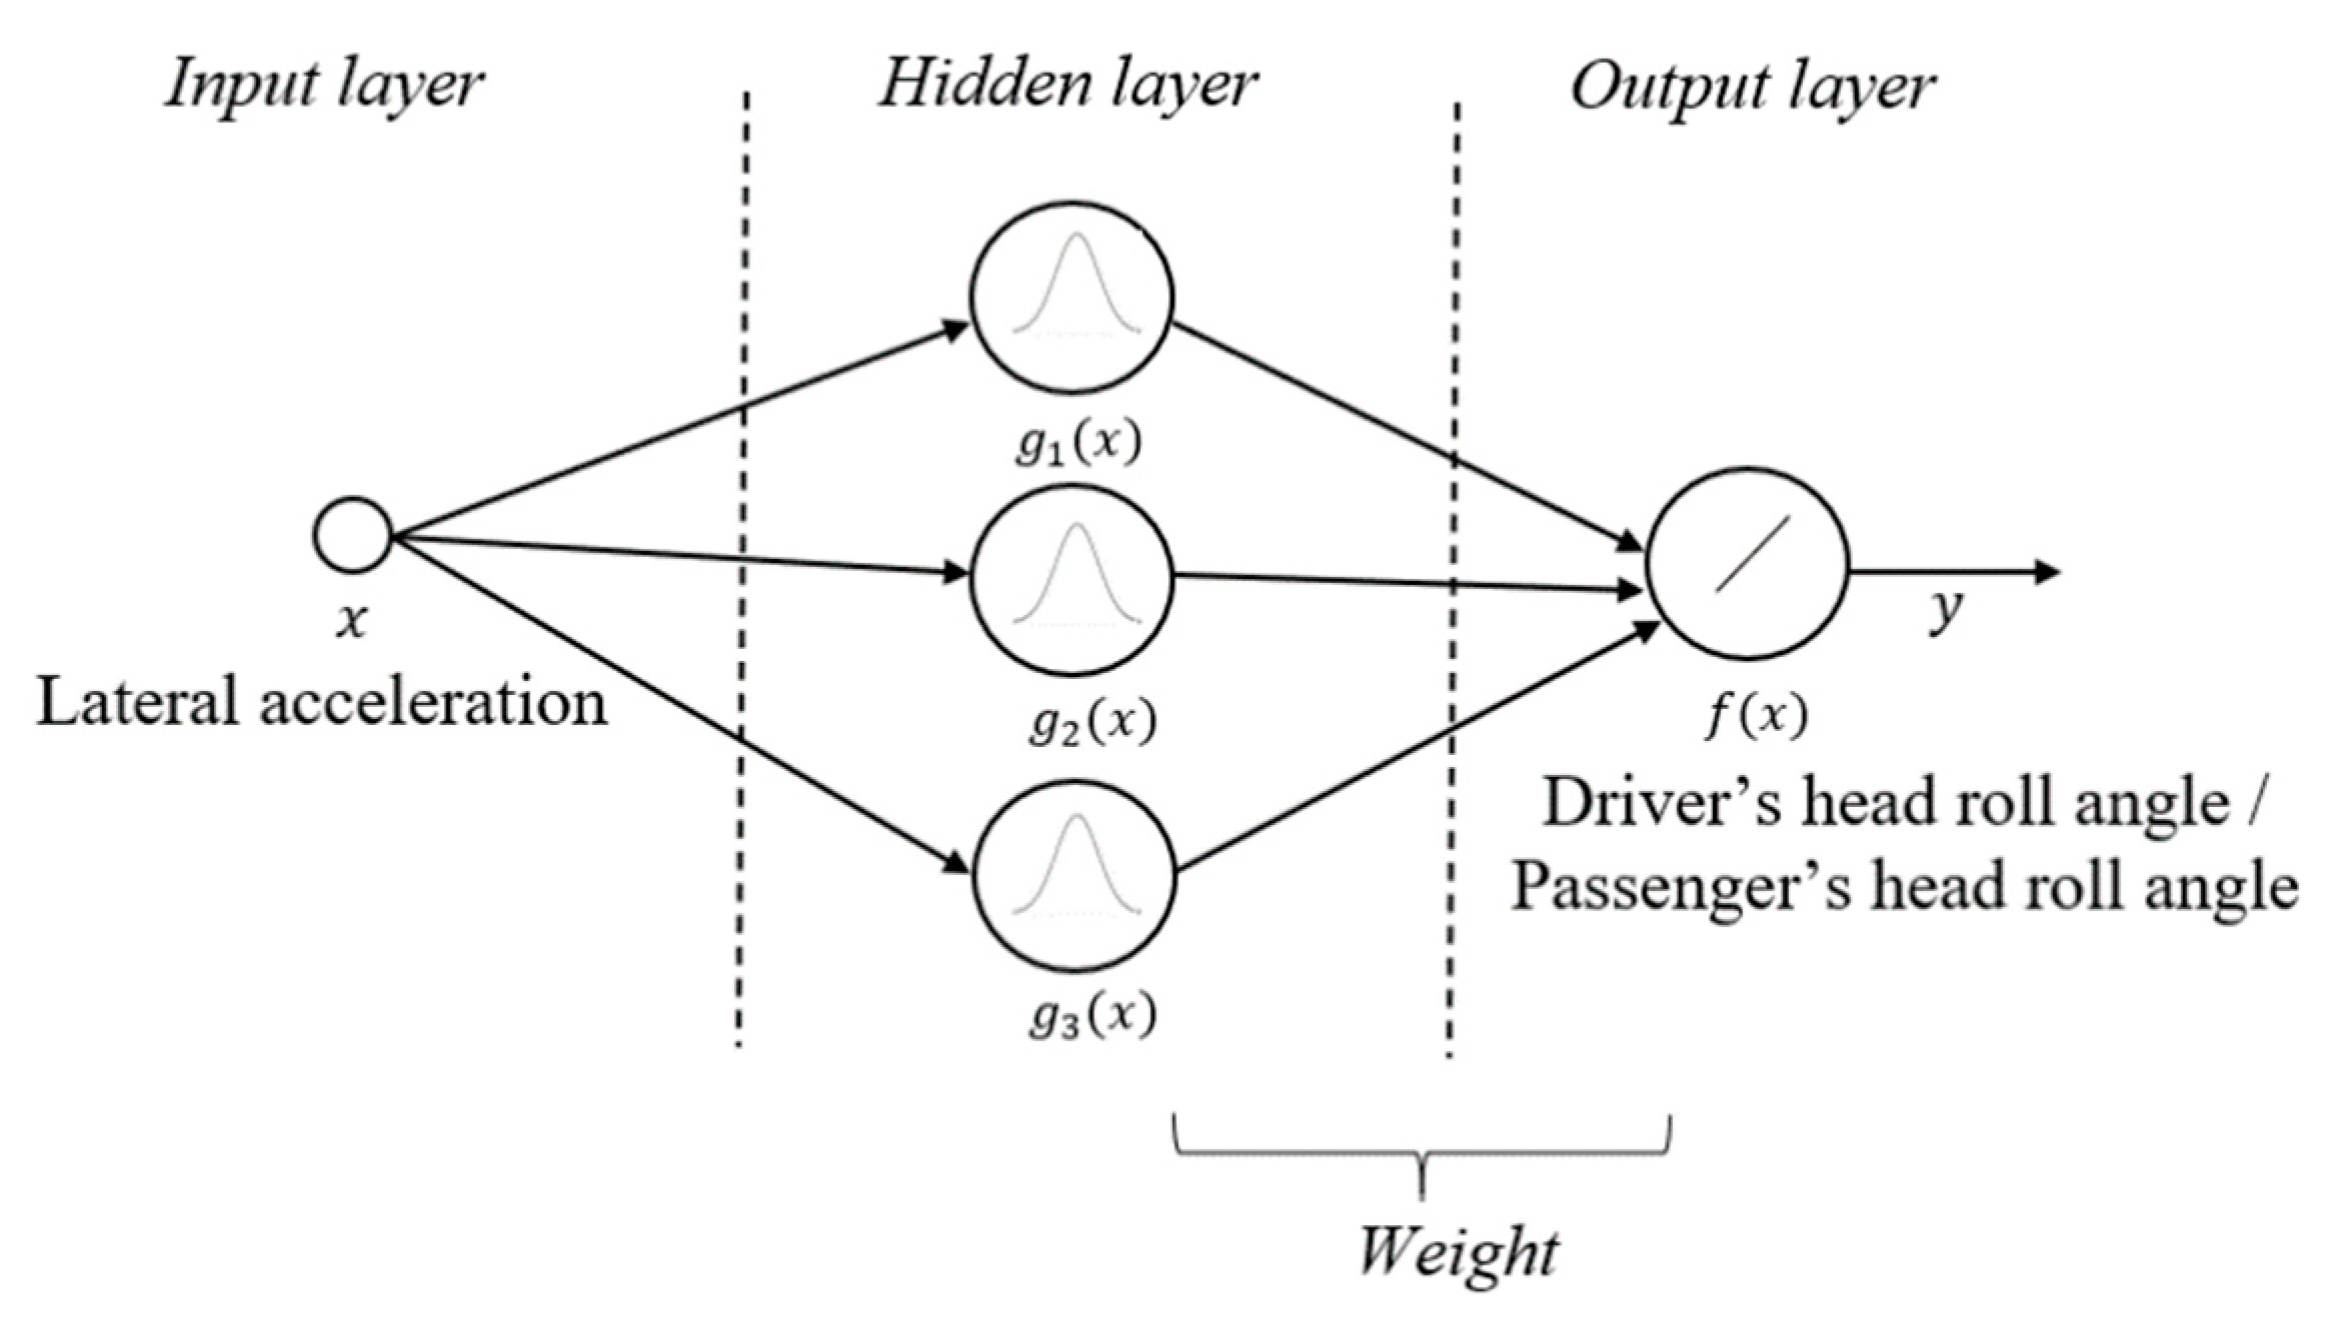
Figure 6 depicts the structure of the RBFNN. It has a single input layer, a single hidden layer consists of Gaussian radial basis function and a single output layer. The network input,
is used as the input for all functions in the hidden layer, each with different parameters. Meanwhile, the network output,
is a linear combination of the outputs of Gaussian functions. In this study, the driver’s and the passenger’s models are trained and modeled separately. Therefore,
is the lateral acceleration,
and
is either the response driver’s head roll,
or passenger’s head roll,
.
The fixation of the number of hidden neurons is determined by Kolmogorov theorem. According to the theorem, the calculation of the number is done based on 2 + 1 formula, where indicates the number of network input. Thus, based on that principle, the quantity of the hidden neurons used in this study is three for both driver’s and passenger’s model.
The data collection for the modeling purpose was realized by conducting an experiment that provokes MS. The prediction model developing process requires real time data of lateral acceleration and head roll responses. The experiment procedures are inspired by the previous works of Wada et al. [
29].
Figure 7 illustrates the designated course. It is a slalom course where six cones are placed on 150
road with 20
gaps between each other. The nominal frequency of lateral acceleration during the slalom test is around 0.2
; a frequency that can aggravates MS.
Ten participants who give informed consent participated as drivers and passengers. The drivers are instructed to drive in slalom at a continuous velocity of 30 . The driving behavior is categorized as normal driving irrespective of sex, skill and age. The data of lateral acceleration and head roll responses for both drivers and passengers are recorded by motion sensors, placed at the vehicle center of gravity (COG) and on the caps worn by the participants. The motion sensor used is an inertial measurement unit (IMU) device.
Details of the experiment and modeling process can be accessed in [
25]. The network output is expressed as:
where,
is the weight,
is the centre point and
is the RBFNN spread. The value of
,
and
for the driver’s and passenger’s models are given by [
25]:
| Driver’s model: | |
| Passenger’s model: | |
2.5. The Configuration of Fuzzy-PID Controller
The fuzzy-PID controller is formed by a FLC with four scaling factors,
,
,
,
connected in series.
and
normalize the inputs to the range in which the inputs membership function (MF) are defined. In addition,
and
normalize the output of the FLC to an applicable value [
30]. The first input of the controller is head roll error,
which is obtained from the difference of the desired/driver’s head roll response,
and actual/passenger’s head roll response,
. The other input of the controller is the derivative of head roll error,
. The output of the fuzzy-PID is as follow,
where
U is the FLC output. The relation between input and output variables can be given as:
where
and
. Therefore, from (9) and (10), the fuzzy-PID controller output is:
Here, the FLC is designed based on the heuristic approach. It has two inputs and an output MF. Each of the MFs has a triangular and trapezoidal membership as shown in
Figure 8. The input variables are decomposed into three varied fuzzy linguistic levels: Negative (N), Zero (Z) and Positive (P).
Table 2 describes the control rules which are designed in IF-THEN structure.
Particle swarm optimization (PSO) is utilized to select the scaling factors gain. The PSO fitness function is set to be the root-mean-square (RMS) value of lateral acceleration. The goal is to find a set of optimal values of the scaling factors by minimizing the fitness function. The fitness function can be formulated as:
Table 3 tabulates the parameter of PSO. The parameter selection is mainly based on previous study [
31]. After the optimization process, the gain value of the scaling factors is determined as,
and
.
2.6. Motion Sickness Incidence (MSI) Quantification
The efficiency of the suggested control structure is evaluated by calculating the passenger’s MS level, before and after the inner loop system was applied to the control structure. Here, the MS is calculated through a 6 degrees-of-freedom (DOF) subjective vertical conflict (SVC) [
32]. The model can quantify motion sickness incidence (MSI) which represents the severity level of MS. The mathematical 6-DOF-SVC model calculates the MSI based on the lateral acceleration and head roll responses. Therefore, this model is assumed to be a suitable method to quantify the MSI in this study.
2.7. Driving Simulator Setup
This study replaced the vehicle system model in the proposed control structure with a driving simulator to simulate the dynamics behavior of the autonomous vehicle in real time. The replacement of the autonomous vehicle by a driving simulator is due to the limited budget and safety reasons. The simulator is set to run at a speed of 30
constantly, according to the designated course in
Figure 7. It is the same course that was used during the data collection experiment discussed previously in
Section 2.4. The main PC and the simulator are connected by a crossover cable.
The objective of the experiment is to investigate the performance of the suggested MS minimization control system by evaluating the passenger’s MSI index. The evaluation is undertaken by recording the movement of the passenger’s head roll. At the same time, the data of the lateral acceleration is also collected. Then, the MSI of the participant is calculated based on the collected data of the lateral acceleration and head roll through the 6-DOF SVC model. The assessment is carried out by comparing the passenger’s MSI before and after the implementation of the proposed inner loop control system into the overall control structure.
Ten healthy adults of random gender and age participated in this experiment. All the participants were required to give written informed consent before the experiment began.
Figure 9 illustrates a participant who is sitting on the driving simulator while wearing a cap. The cap is attached with an IMU device as the motion sensor and worn to measure the participant’s head roll angle. The participants are instructed to sit comfortably and to tilt their heads naturally according to the driving simulator’s movement.
3. Results and Discussion
As mentioned earlier, the objective of the proposed control system is to minimize the passenger’s MS in an autonomous vehicle by diminishing the lateral acceleration. The lateral acceleration reduction would lead to the mitigation of the passenger’s head roll movement towards the lateral acceleration direction, hence minimizing MS. Therefore, in this section, the responses of lateral acceleration, passenger’s head roll and MSI are presented and discussed.
Figure 10 illustrates the lateral acceleration response before and after the inner loop system is applied. The result shows that the lateral acceleration slightly decreased in every peak of cornering. This finding indicates that the corrective wheel angle produced by the proposed fuzzy-PID controller managed to achieve the objective, which is to diminish the lateral acceleration.
Figure 11 shows the head roll responses of two participants before and after the implementation of the recommended inner loop control system. Due to the reduction of lateral acceleration, the head roll responses are decreasing as well.
Finally, the MSI index of every participant is calculated.
Table 4 tabulates the MSI percentage before and after the proposed inner loop system is included into the whole system. Even though the head roll angle responses among the participants are varied, overall, the MSI for every participant reduced by 3.95% in average. The results indicated that the proposed MS minimization control system consisting of the fuzzy-PID controller succeeded in achieving its objective.
According to
Table 4, the MSI has a small percentage value due to the short simulation time which was only 10 s. Based on the previous research work, the difference between the driver’s and passenger’s MSI level escalated as time elapsed [
32]. Thus, it is anticipated that the MSI decrement that can be achieved will be increase as the duration increases. To investigate the MSI value for a longer duration, the experiment is continued up to ten laps. Note that the pre-defined course shown in
Figure 7 is referred to as single lap.
Table 5 tabulates the MSI results in a ten laps trajectory. The MSI for every participant was minimized by 11.49% on average after the application of the proposed inner loop system. As hypothesized, the MSI reduction percentages for the ten laps trajectory are higher than for the single lap trajectory. Hence, this finding agrees with the previous study in [
32].
4. Conclusions and Future Work
In terms of MS occurrence factors, there is an existing correlation with the steering, lateral acceleration and head roll. This correlation makes it possible to implement the usage of head roll as the controlled variable to generate an additional corrective wheel angle in mitigating MS, by reducing the lateral acceleration. It is compulsory to utilize a controller to compute the corrective wheel angle. Therefore, this study proposed the utilization of a fuzzy-PID controller for a MS minimization control strategy for an autonomous vehicle. The aim of the control structure which is inspired by an active steering system is to diminish the vehicle lateral acceleration. The reduction of the lateral acceleration will then minimize the head roll angle with respect to the lateral acceleration direction, thus mitigating the MSI of the passenger. The gain parameters of the fuzzy-PID controller are tuned by heuristic and PSO methods.
It is necessary to use estimated head roll response instead of the real response as the controlled variable, because it is considered inappropriate to measure the occupant’s head tilt movement during travelling. Thus, the RBFNN modeling method is utilized to develop prediction models to estimate both driver’s and passenger’s head roll responses. An experiment that can provoke MS is set to acquire data for the RBFNN modeling process.
The efficiency of the proposed control system is evaluated by investigating the MSI index of ten participants using a driving simulator to represent the real autonomous vehicle. The experiment results indicated that the MSI for single and ten laps trajectories are lowered by 3.95% and 11.49% in average, respectively. Hence, it is proven that the recommended control strategy consisting of a fuzzy-PID controller managed to mitigate the passenger’s MS level by reducing the lateral acceleration, as compared to the system without the controller utilization.
In the future, the evaluation of the proposed control system performance can be improvised through a series of tests in different trajectories. The control system can also be improvised by redesigning the head roll prediction modeling process using various trajectories and speeds. The enhancement in the modeling process can also increase the generalization capability of the prediction models. Lastly, it is suggested that to validate the proposed control strategy, a real driving test should be performed in order to examine its effectiveness in a real driving environment.

 ,
, 


