Article

Influence of Three Dental Implant Surfaces on Cell Viability and Bone Behavior. An In Vitro and a Histometric Study in a Rabbit Model

by
María Rizo-Gorrita
,
Ignacio Fernandez-Asian
,
Andreina Garcia-de-Frenza
,
Celia Vazquez-Pachon
,
Maria-Angeles Serrera-Figallo
*,
Daniel Torres-Lagares
and
Jose-Luis Gutierrez-Perez
Department of Oral Surgery, College of Dentistry, Seville University, Calle de Avicena s/n 41009 Seville, Spain
*
Author to whom correspondence should be addressed.
Appl. Sci. 2020, 10(14), 4790; https://doi.org/10.3390/app10144790
Submission received: 3 June 2020 / Revised: 8 July 2020 / Accepted: 8 July 2020 / Published: 13 July 2020

Abstract

:
The chemical composition and the surface characteristics of dental implants are factors that have a decisive effect on the osseointegration process. The surface characterization at the compositional and topographic level of three dental implants available in the market was performed with different surface treatments: (1) sandblasted and acid etched surface (SLA), (2) hydroxyapatite (HA) and tricalcium phosphate (TCP) blasted surface (HA/TCP), and (3) HA-blasted and non-etching acid washed surface (HA + AW). In addition, an in vitro viability study of MG-63 osteoblast cells was performed with a JC-1 test. To complete the study, an in vivo study was conducted in New Zealand rabbits. The study analyzed the histometric characteristics of the bone formed around the implants at the level of area, volume, bone density, accumulated bone density, and bone–implant contact (BIC). The rabbits were sacrificed at 6 weeks after implants were placed in the tibial metaphysis. No statistically significant differences were observed at the level of cell viability or histometric parameters between the different study groups (p > 0.05). SLA and HA/TCP surfaces were the ones that obtained a higher BIC value. Taking into account the limitations of this study, it can be concluded that the different implant surfaces analyzed favor a good bone response.

1. Introduction

Since titanium (pure or in alloys) began to be used as a dental implant material in the 1960s, the goal has been to improve the design and surface of the different implants available on the market, as well as to develop new implants that improve osseointegration behavior, aimed at shortening healing times or, for example, improving primary stability in the face of low-density bone.
Grade IV (commercially pure) or alloy titanium implants are used currently, with the Ti6Al4V alloy being the most widely used one [1]. Pure titanium has high strength, while type V, thanks to the presence of elements such as vanadium or aluminum, has high resistance to corrosion, fracture, and fatigue [2,3,4]. On the other hand, titanium alloys have better mechanical properties than pure titanium [5].
When machined surfaces have been compared with implants with surface treatment, it has been observed that the latter improve osseointegration by increasing bone–implant contact and therefore long-term survival rate. This is partly due to the chemical composition of the implant and also to its topographical characteristics [6].
The main surface treatment methods are sandblasting, acid etching (there may be a combination of the latter two techniques, which is called SLA), or anodic oxidation. [7].
Sandblasting is based on the use of particles to modify the surface of the implant. These are generally medium grain particles (250–500 μm). The aim is to create surface macro-roughness [8]. Particles of alumina, titanium oxide, and corundum are usually used [9].
In recent years, the technique of sandblasting with resorbable bioceramic particles such as hydroxyapatite, calcium phosphate, or tricalcium phosphate has been developed. They all replace the use of alumina as a sanding material to prevent these particles from interfering with the subsequent osseointegration of the implant [10].
On the other hand, double acid etching is based on the immersion of the implant for several minutes in a mixture of acids, such as hydrofluoric acid with nitric acid or sulphuric acid with hydrochloric acid [11]. It intends to create micro-roughness with a topography based on craters and microwells on the surface of the implant [8,12]. This procedure allows not only to increase the roughness, but also to remove surface contaminating particles derived from sandblasting or its manufacture, as they may interfere (sometimes with a negative effect) with the osteoconductivity of titanium, regardless of its proven biocompatibility [9]. Furthermore, it is also possible to create homogeneous micro-roughness surfaces.
Other more recent techniques seek to unify several of these techniques, either through sandblasting by combination of different bioceramic particles or through a subsequent acid etching. Although there are approximately 1300 commercially available products with different surface treatments on the market, the literature has not yet described the ideal surface to achieve the objectives mentioned above [13].
This study aims to carry out two in vitro studies. The first one is a surface characterization and the second one is a cell viability assay. Both studies were followed by an in vivo study. The working hypothesis was the suitability of the different surfaces in terms of appropriate biocompatibility and osseointegration, as they represent the surfaces used usually.

2. Materials and Methods

2.1. Dental Implant Groups

This study evaluates the morphological, roughness, and compositional characteristics of the Osseonova® surface of the Zinic Ziacom® implant (Ziacom Medical S.L., Madrid, Spain), the surface of the Tapered Screw-Vent Zimmer® implant (Zimmer Biomet, Warsaw, IN, USA), and the surface of the Internal Implant RBT BioHorizons® implant (BioHorizons Implant Systems, Birmingham, AL, USA) (Table 1).
The Osseonova® surface is derived from a treatment based on white corundum sandblasting and double acid etching with hydrofluoric, sulphuric, and phosphoric acid. This technique allows to create a textured surface through subtraction [14]. The Osseonova® surface is of the S.L.A. type [15], and it is obtained from sandblasting with white aluminum oxide and acid etching with hydrofluoric, sulphuric, and phosphoric acid. The RBT surface is based on surface sandblasting with resorbable materials such as hydroxyapatite and tricalcium phosphate. The MTX surface is based on sandblasting with hydroxyapatite particles together with non-etching acid wash of the surface.
The cell viability on the surfaces of the study groups was then evaluated. Finally, the osseointegration of the implants after their placement in an animal model was also studied.
A total of 24 samples were evaluated and eight implants from each group were analyzed. The samples came in sealed containers and were opened with tweezers for analysis in our laboratory.

2.2. Surface Characterization

Surface characterization was based on the morphological, compositional, and roughness analysis of the different surfaces. Morphological and compositional data was taken at the coronal third of the implant, just below the microroughness of the collar implant. Roughness measurements were taken at the apical third (Figure 1).

2.2.1. Morphological Analysis of the Surface

A scanning electron microscope (FEI TENEO, Thermo Fisher Scientific Inc., Waltham, MA, USA) was used to evaluate the morphology of the coronal third of implant surfaces under the following conditions: 2 kV accelerating voltage, secondary electron (SE) detector and 200×, 12,000× magnifications.

2.2.2. Elemental Analysis of the Surface

Two cervical areas of the implant root surfaces were analyzed by an energy dispersive X-ray spectrometer (Octane Super, Edax-Ametek, Mahwah, NJ, USA) equipped with a silicon drift detector (SDD), attached to the scanning electron microscope. Two areas of 130 μm2 were analyzed per implant as follows: 20 kV accelerating voltage, 1.6 nA (check if it is correct) beam current, 200 s acquisition period, 3000× magnification. We made ZAF correction for quantification. Implants were analyzed as received without any treatment on their surfaces. The results of the analysis are expressed as means and standard deviation of percentage mass content (wt.%).

2.2.3. Analysis of Surface Roughness

The roughness study was performed using the Sensofar S NEOX confocal-interferometric microscope (Sensofar Medical, Terrasa, Spain). SensoMAP Premium 7.4 was the software used. Measurements were made in accordance with ISO 25178: Geometric Product Specifications (GPS)-Surface texture: areal. A 20× epi-illumination lens was used at a focal length of 4.50 mm and a green optical resolution of 0.32 μm. Five measurements were made at the apical third of the implant, with a pre-established area dimension of 0.87 × 0.66 mm2 and a cut-off correction of 250 μm (Figure 2). The quantitative roughness parameters used were profile mean arithmetic roughness (Ra), mean square deviation of the roughness profile (Rq), maximum peak height of the roughness profile (Rp), maximum valley depth of the roughness profile (Rv) and three-dimensional surface roughness (Sa), three-dimensional root mean square height (Sq), three-dimensional maximum peak height (Sp), three-dimensional maximum pit height (Sv). Mean and standard deviation were expressed in microns (µm).

2.3. Cell Viability Study

For the cell viability study on the implant surface, a study of the mitochondrial energy balance of a human MG-63 osteoblastic cell line (Sigma-Aldrich, St. Louis, MI, USA) was performed. This type of cell is a good in vitro model, since it maintains its differentiated phenotype throughout progressive subcultures. Cells were cultured in T75 vials until reaching 80% confluence. Implants were placed horizontally inside each T75 culture flask, and cells were cultured on its surface at a density of 6 × 10⁵ cells, submerging the implant in the culture medium. Likewise, a control culture was established in Petri dishes at the same cell density. Cell death control was also performed to establish the separation between viable and non-viable cells. Twenty-four hours after culture, each dental implant surface was washed profusely with phosphate-buffered saline (PBS) to recover all attached cells. Pellet was obtained by centrifugation and 500 µL of resuspended medium was analyzed.
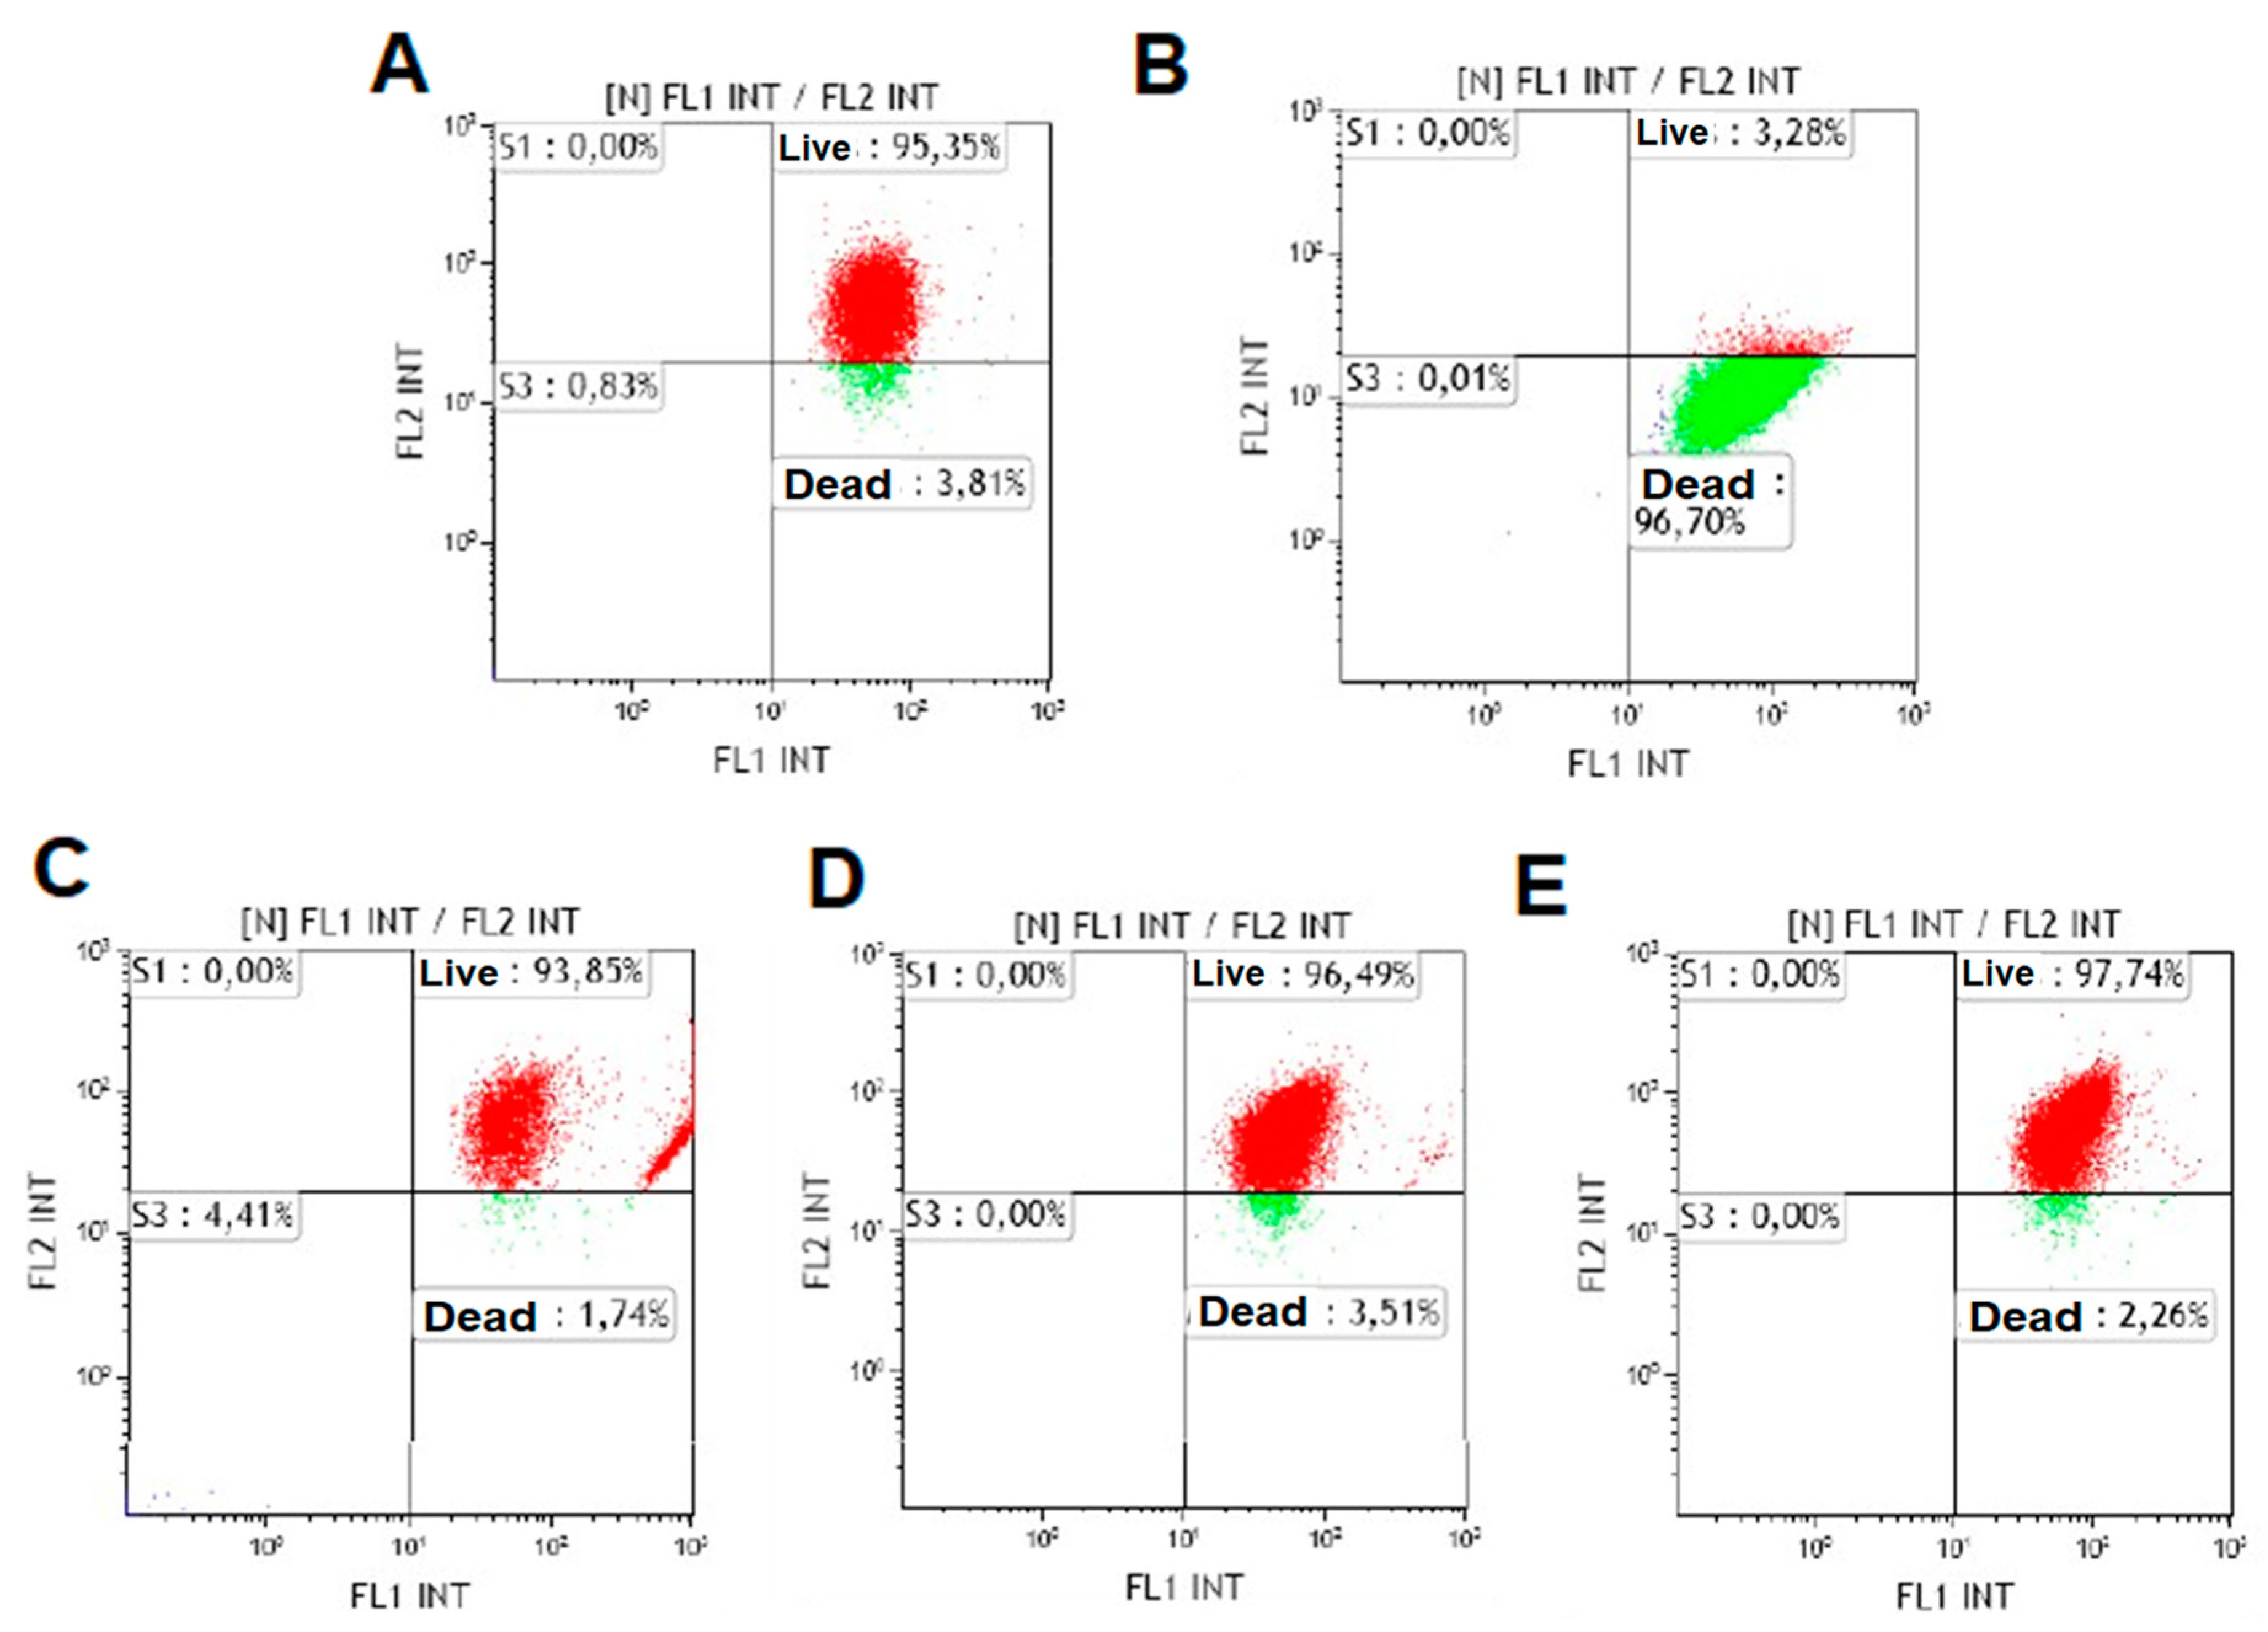
Flow cytometry was performed with the MitoProbeTM JC1 kit (Invitrogen, Carlsbad, CA, USA). The JC-1 reagent allowed to evaluate the red/green ratio of mitochondrial activity based on live cells/dead cells. The analysis was performed in the Gallios flow cytometer (Beckman Coulter, Carlsbad, CA, USA). Fluorescence measurements were made at 529 nm (green, diminished membrane potential due to cell damage) and 590 nm (red, intact membrane potential). This test was performed to determine changes in mitochondrial membrane potential during apoptosis processes as the membrane potential is a key indicator of cell health or injury. The results were expressed in mitochondrial activity ratio.

2.4. Experimental Animal Study

The experimental study was carried out on the tibia of four New Zealand experimental rabbits (age: 6 months; weight: 3.5–4 kg; sex: male). The rabbits were fed rabbit-maintenance Harlan-Teckland Lab Animal Diets (2030).
The animals underwent surgery under general anesthesia at the Jesús Usón Minimally Invasive Surgery Centre (Cáceres, Extremadura, Spain). The experimental study was carried out according to the guidelines of the US National Institute of Health (NIH) and to the European Directive 86/609/EEC, which provides for the care and use of experimental animals for scientific purposes and under all local rules and regulations. Researchers obtained the approval of the Ethics Committee of the Jesús Usón Minimally Invasive Surgery Centre (Cáceres, Extremadura, Spain). As required by the legal framework and due to ethical reasons, the minimum number of animals was used [16]. Comparable models on histological and animal experimental methods have been published [17].
The animals were immobilized, and their vital signs checked. The anesthesia used for initiation was intravenous midazolam (0.25 mg/kg) and propofol (5 mg/kg). By way of maintenance, the animals inhaled 2.8% inspired sevoflurane gas. Analgesia was provided with ketorolac (1.5 mg/kg) and tramadol (3 mg/kg).
After the rabbits were sedated and prepared, a 30 mm long incision was made on the inner side of the tibia with a No. 15 scalpel blade. Epithelial, connective and muscular tissue was displaced using a Prichard periosteal elevator. The surface of the tibia was washed with sterile saline solution while maintaining aspiration.
Three implants (one from each group) were placed in each tibia (six per animal), with 24 implants in total. Implants were selected to be similar, with a diameter of 4 mm and a length of 8–9 mm. Implants were placed 1.5 mm supracrestally, with 8 mm separation between them. The size of the implants was selected based on available implants, always ensuring that their diameter allowed placement within the tibia of the experimental animal (4 mm). The length (8 mm) was selected because it was 1 mm larger than the diameter of the experimental animal’s tibia, and this ensured good primary stability. The placement location of the implants in the different study groups in relation to the bone metaphysis was alternated (proximal, middle, or distal locations) so that variations in blood supply and other anatomical characteristics were distributed similarly in all the study groups (Figure 3).
After surgery, the rabbits were kept in stables for 6 weeks, after which they were slaughtered with an overdose of intravenous potassium chloride solution. Subsequently, the radiological and histomorphometric study of the samples was carried out.

2.5. Radiological Analysis

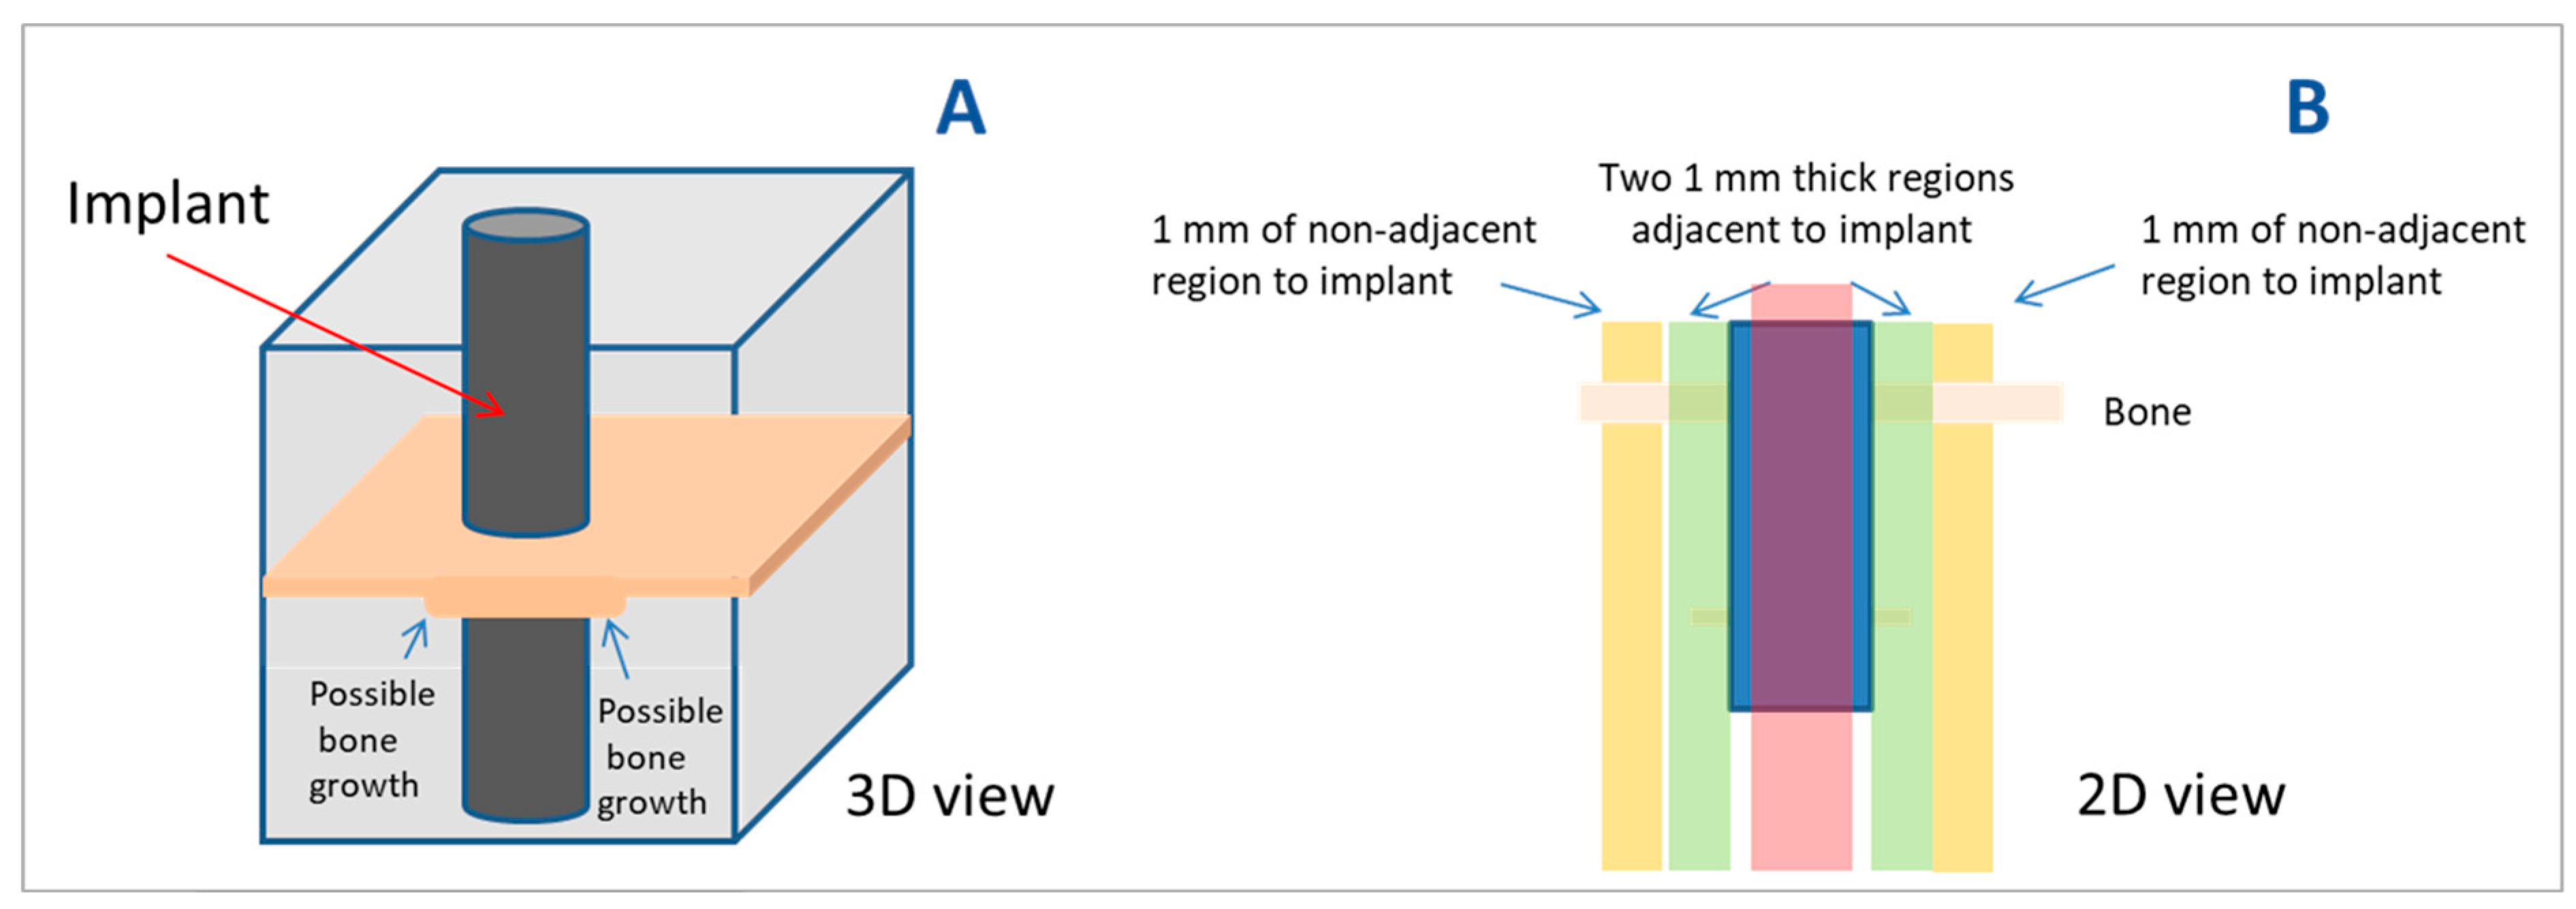
For the radiological study, a high-quality micro-CT machine was used (Bruker preclinical Albira CT, Billerica, MA, USA). Micro-computed tomography (µ-CT) is used to identify small objects with high-quality spatial resolution. This type of tomography is the gold standard for measuring bone microstructures and bone morphometry [18]. The 360° images were taken at maximum resolution with a 45 kV radiographic projection and an acquisition time of 30 min for each image. 2D and 3D images with 8.3 voxels/mm were generated with Imaris v.9.5 software (Bitplane, Belfast, UK). The variables analyzed were bone volume (mm3), mean density of bone volume (Hounsfield Units, HU), and accumulated density (Hounsfield Units, HU). The BoneJ software, which is an ImageJ plug-in (Wayne Rasband, National Institutes of Health, Bethesda, MD, USA), was used for image processing. A segmentation of the area of interest was made on every image, a threshold was applied to eliminate the “titanium” density and, later, the measurements of the three variables were made based on 1 mm of surrounding bone around a 2 mm thick space of the tibial cortical bone in transversal cuts (Figure 4).
For the radiological analysis, the scheme represented in Figure 4B was followed, in which four regions were defined, two adjacent to the implant (1 mm each) and two non-adjacent to the implant (also 1 mm). For each of the variables, the results were calculated as the difference between the values obtained in non-adjacent regions and the adjacent regions. Then, the mean and standard deviation of each of the variables were calculated. This was made to avoid biases and compensate the strong artifact in the implant area.

2.6. Histomorphometric Analysis

Samples were stored in a 5% (pH 7) formaldehyde solution and after a first dissection, they were kept immersed in 4% and 1% calcium formaldehyde solution. They were mounted on a plastic slide with cyanoacrylate, sectioned at 100 µm thickness and grinded during 5 min with sand papers of 500, 800, and 1200 grain size using a generous amount of water to cool the sections (Donath and Breuner method) [19]. After that, the samples were stained with 1% toluidine blue (TB) (Merck-Merck, Darmstadt, Germany) (histological staining as an exploratory/preliminary way) with a pH of 3.6 adjusted with HCl at 1 N. To visualize the mineralized bone, the Von Kossa (VK) technique was applied using silver nitrate (Sigma-Aldrich Chemical Co., Poole, UK). These stains were kept on the samples at room temperature for 10 min, and they were then washed with distilled water and air dried [20]. Four specimens were obtained of each type of implant. Two histological variables were measured in the Von Kossa images: bone area (mm2) (area of bone accounted for by a 1 mm crown around the implant) (Figure 5) and bone-implant contact, BIC (%) also measured in the region of interest described in Figure 5. BIC is a variable measured histomorphometrically and it helps to assess implant stability based on the percentage of the implant surface covered by bone [6,21]. The images were processed with ImageJ v1.50e (Wayne Rasband, National Institutes of Health, Bethesda, MD, USA). The mean and standard deviation of both variables were obtained.

2.7. Statistical Analysis

The comparison of the groups for each of the variables analyzed was performed using IBM SPSS Statistics 24.0 software (International Business Machines Corp; New York, NY, USA). To check the normality in the variables, the Shapiro–Wilk test was carried out. The homogeneity of variances was verified with Levene’s test. An analysis of variance (ANOVA) was used for those variables with normality, while a Kruskal–Wallis test was carried out for those variables that did not follow normal distribution. The Bonferroni correction was used for multiple comparisons. A statistical significance level of 5% (p < 0.05) was established.

3. Results

3.1. Surface Characterization

3.1.1. Morphological Analysis of the Surface

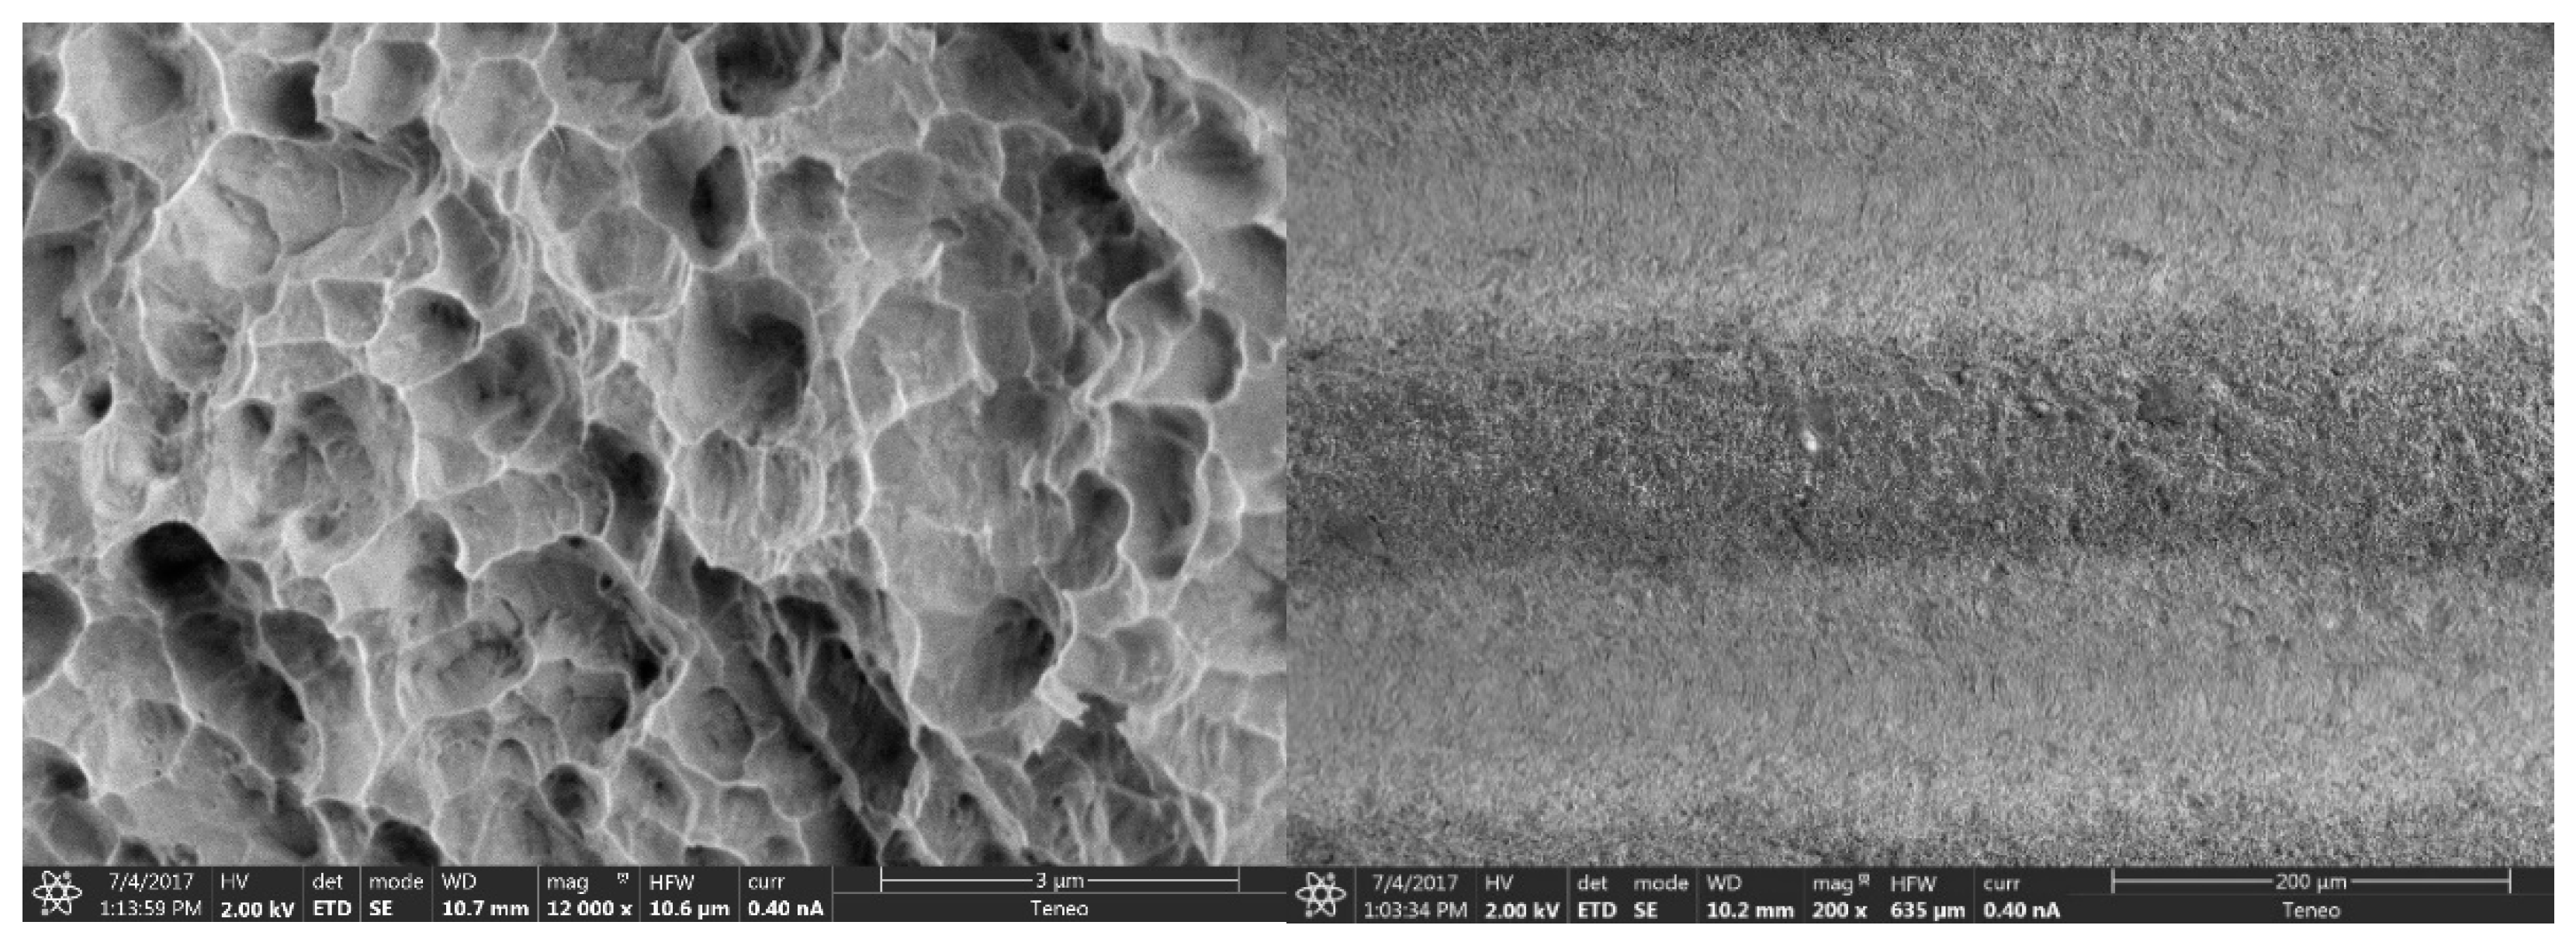
The Ziacom implant with the SLA surface had a rough, porous surface with numerous cavities caused by sandblasting and acid etching. Around the wells, edges were thin and sharp (Figure 6).
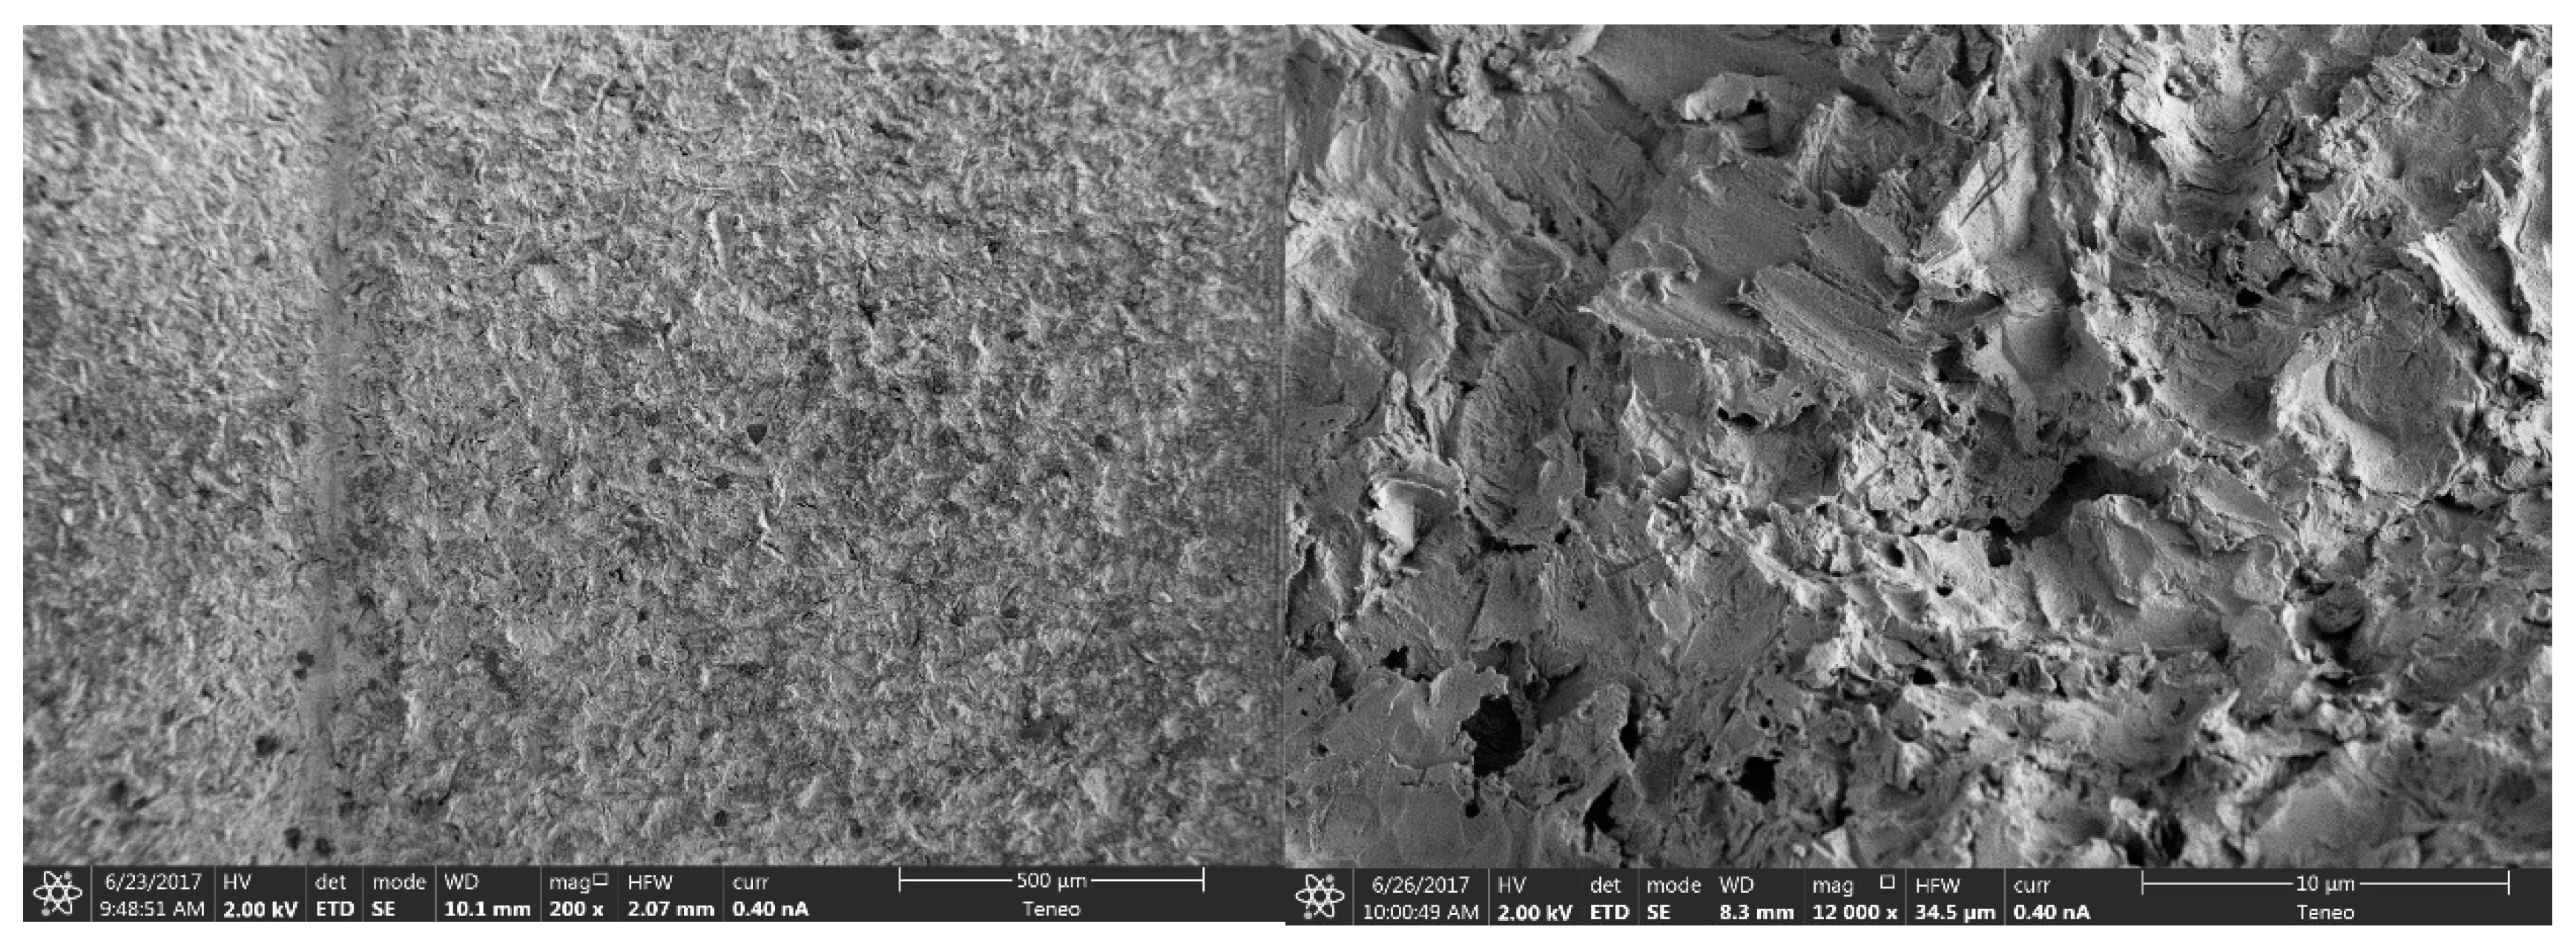
The BioHorizons implant with sandblasted surface with hydroxyapatite and tricalcium phosphate (HA/TCP) showed an irregular surface with some randomly distributed craters and more rounded edges (Figure 7).
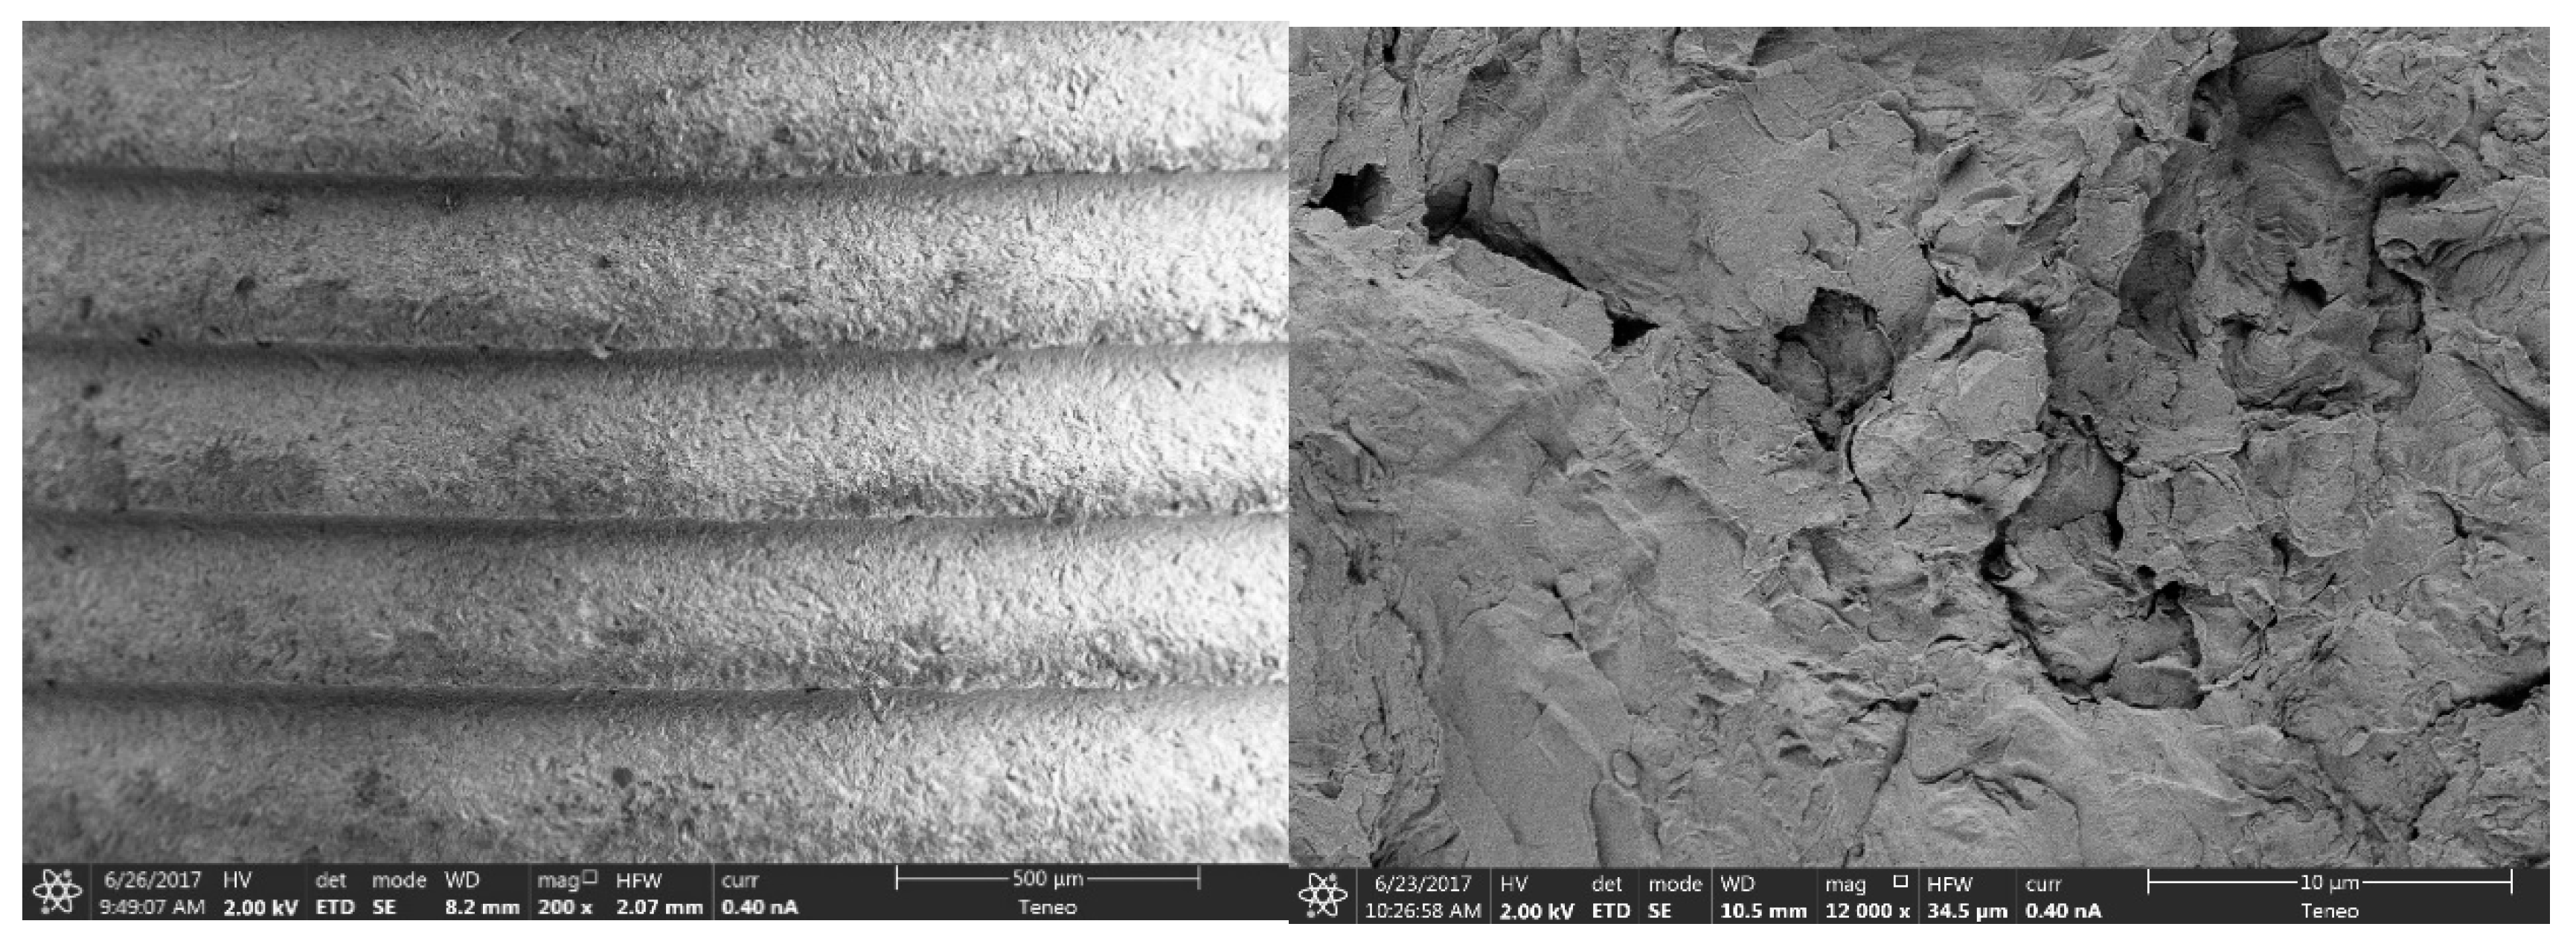
The Zimmer implant with sandblasted surface with hydroxyapatite and later washed with non-etching acid also revealed an irregular structure, with a greater number of craters, which were also randomly distributed, protuberances, and veins (Figure 8).

3.1.2. Elemental Analysis of the Surface

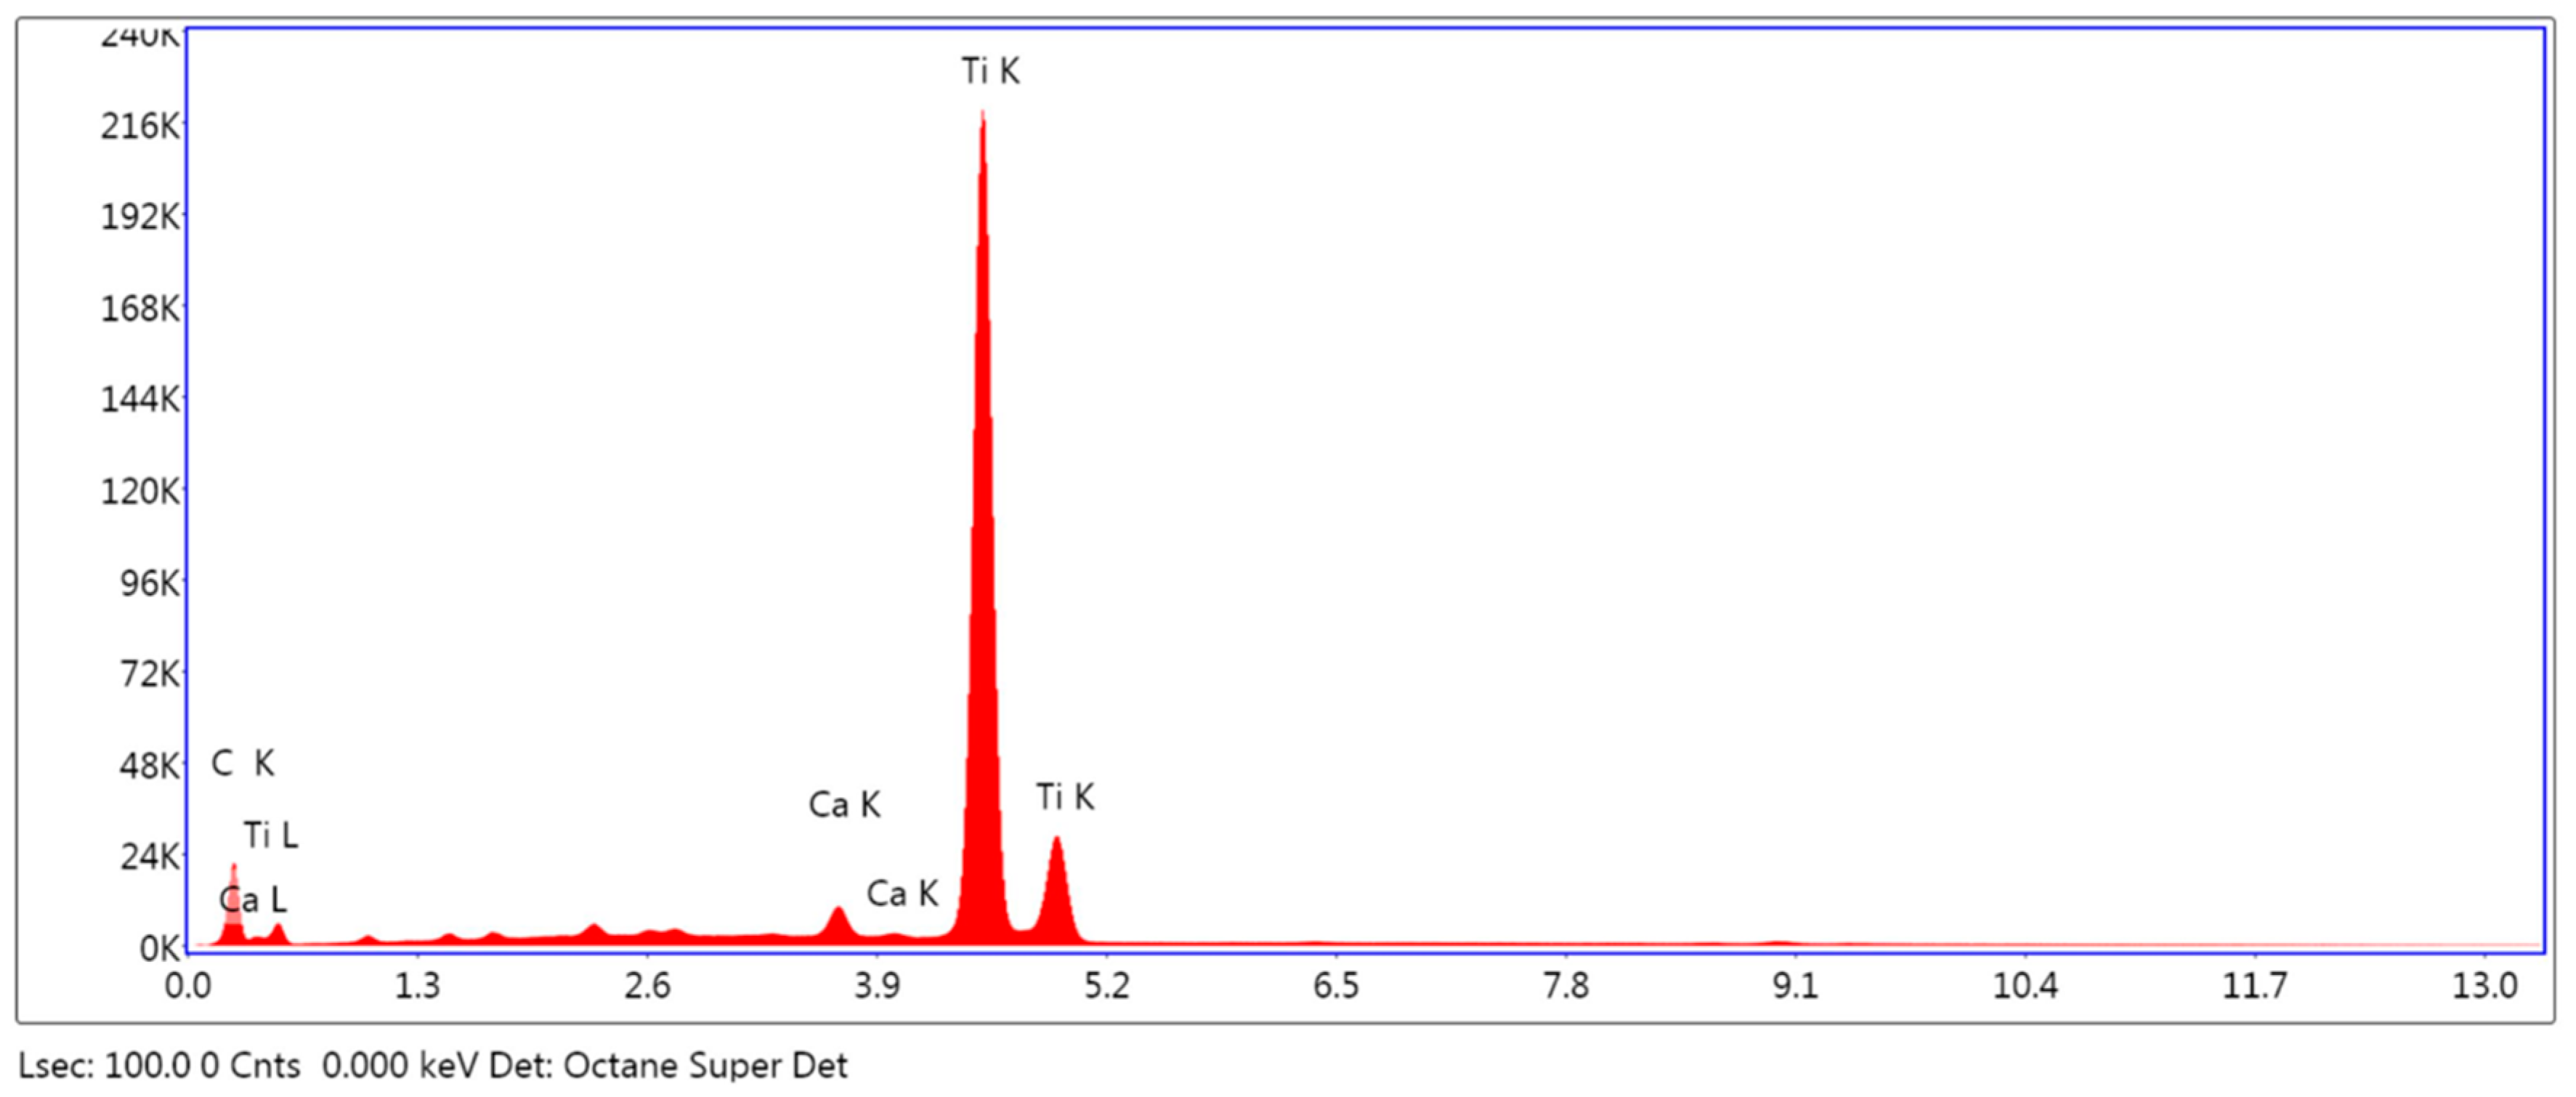
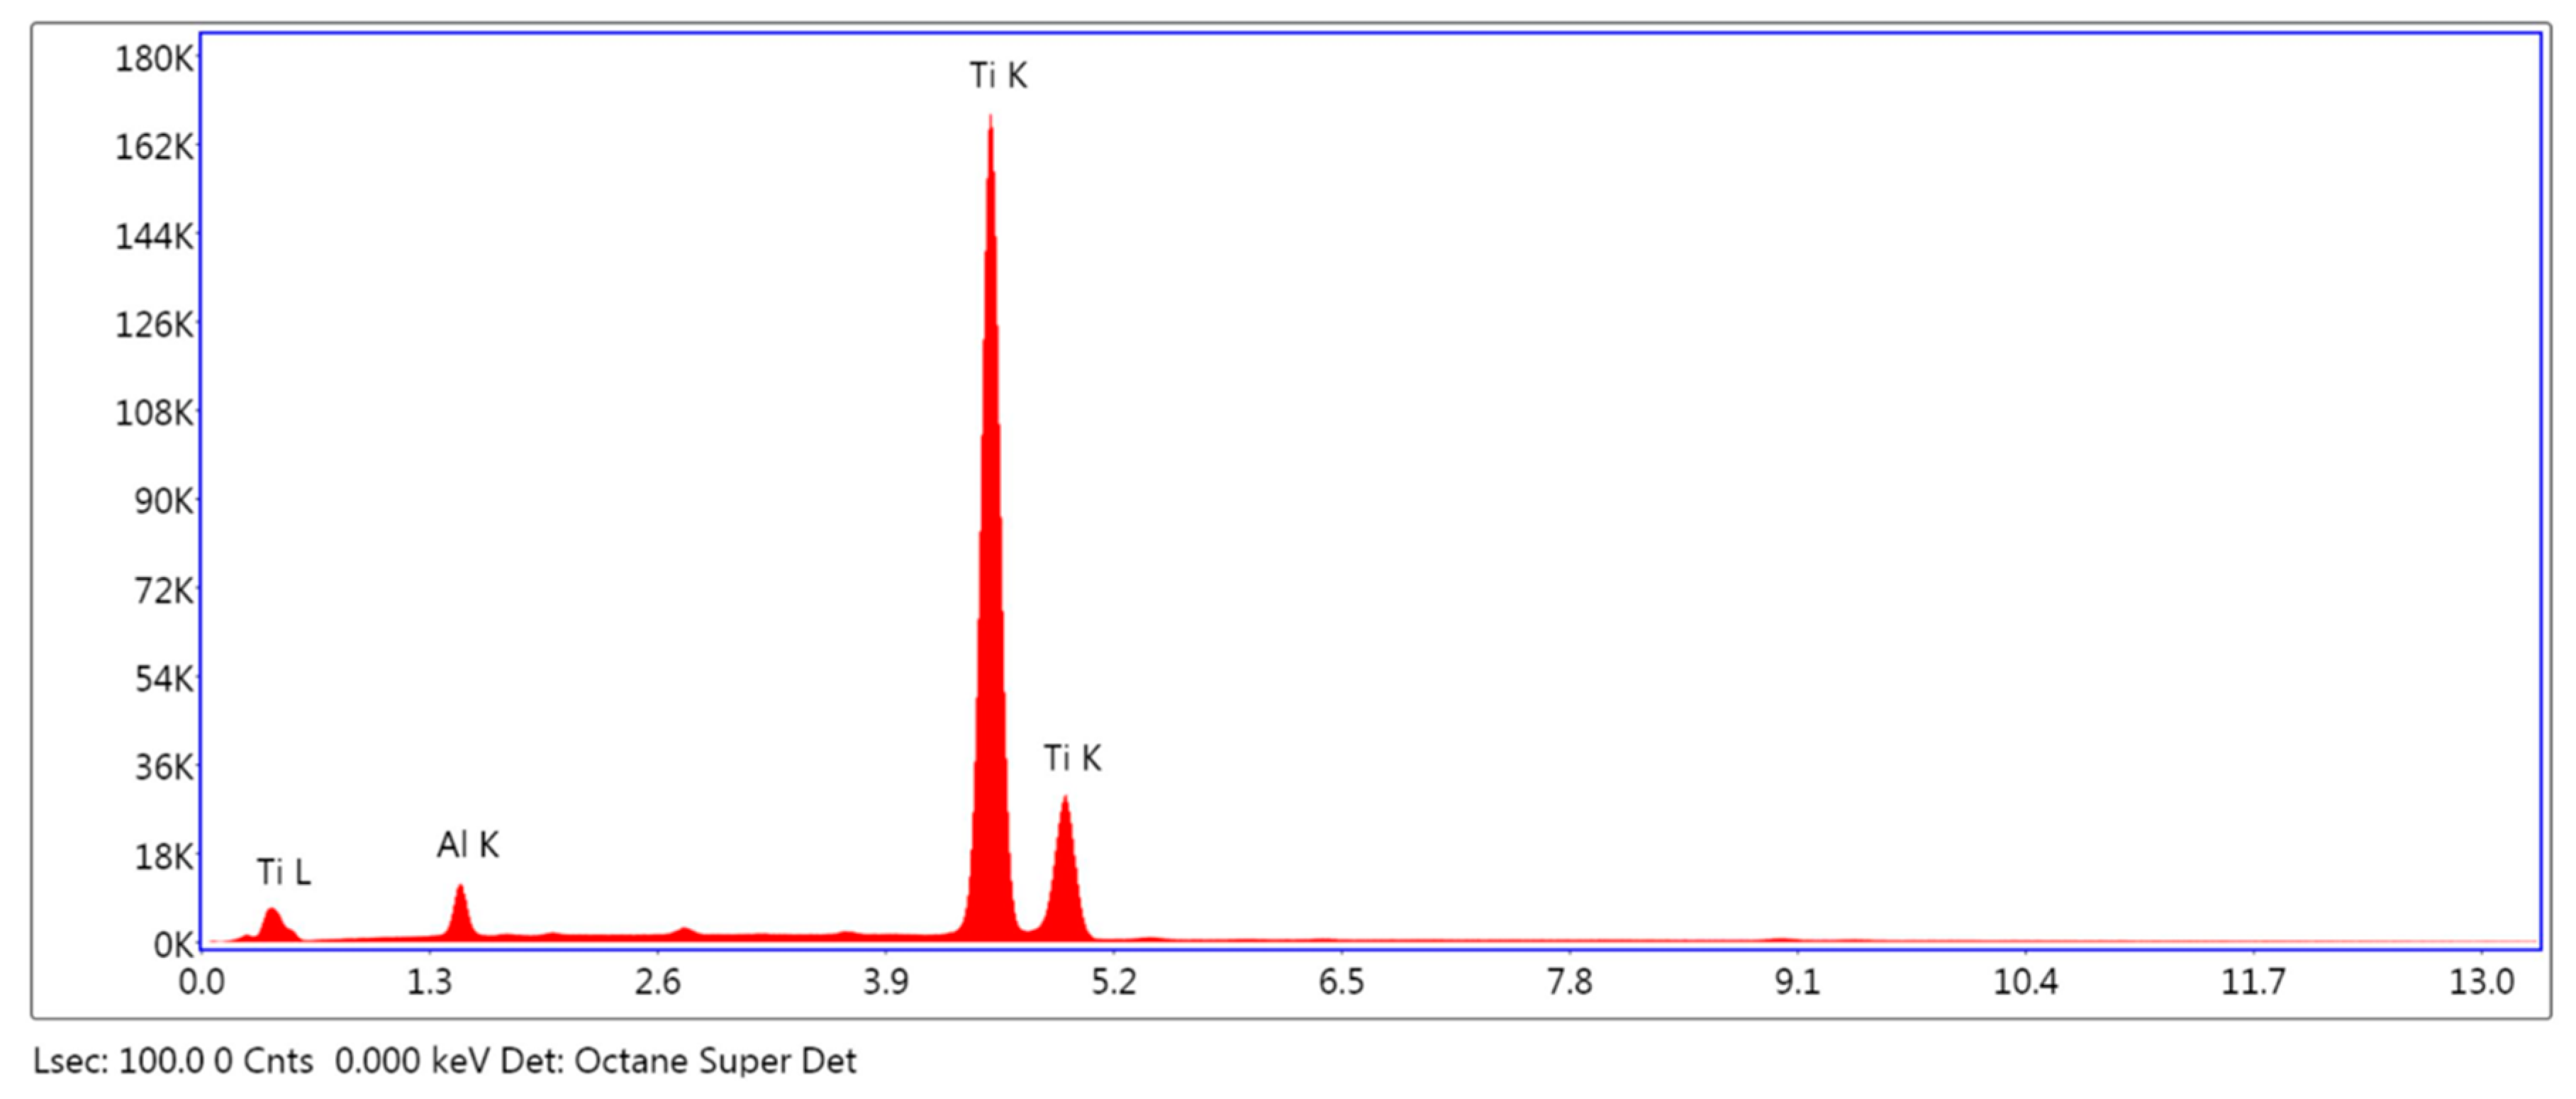
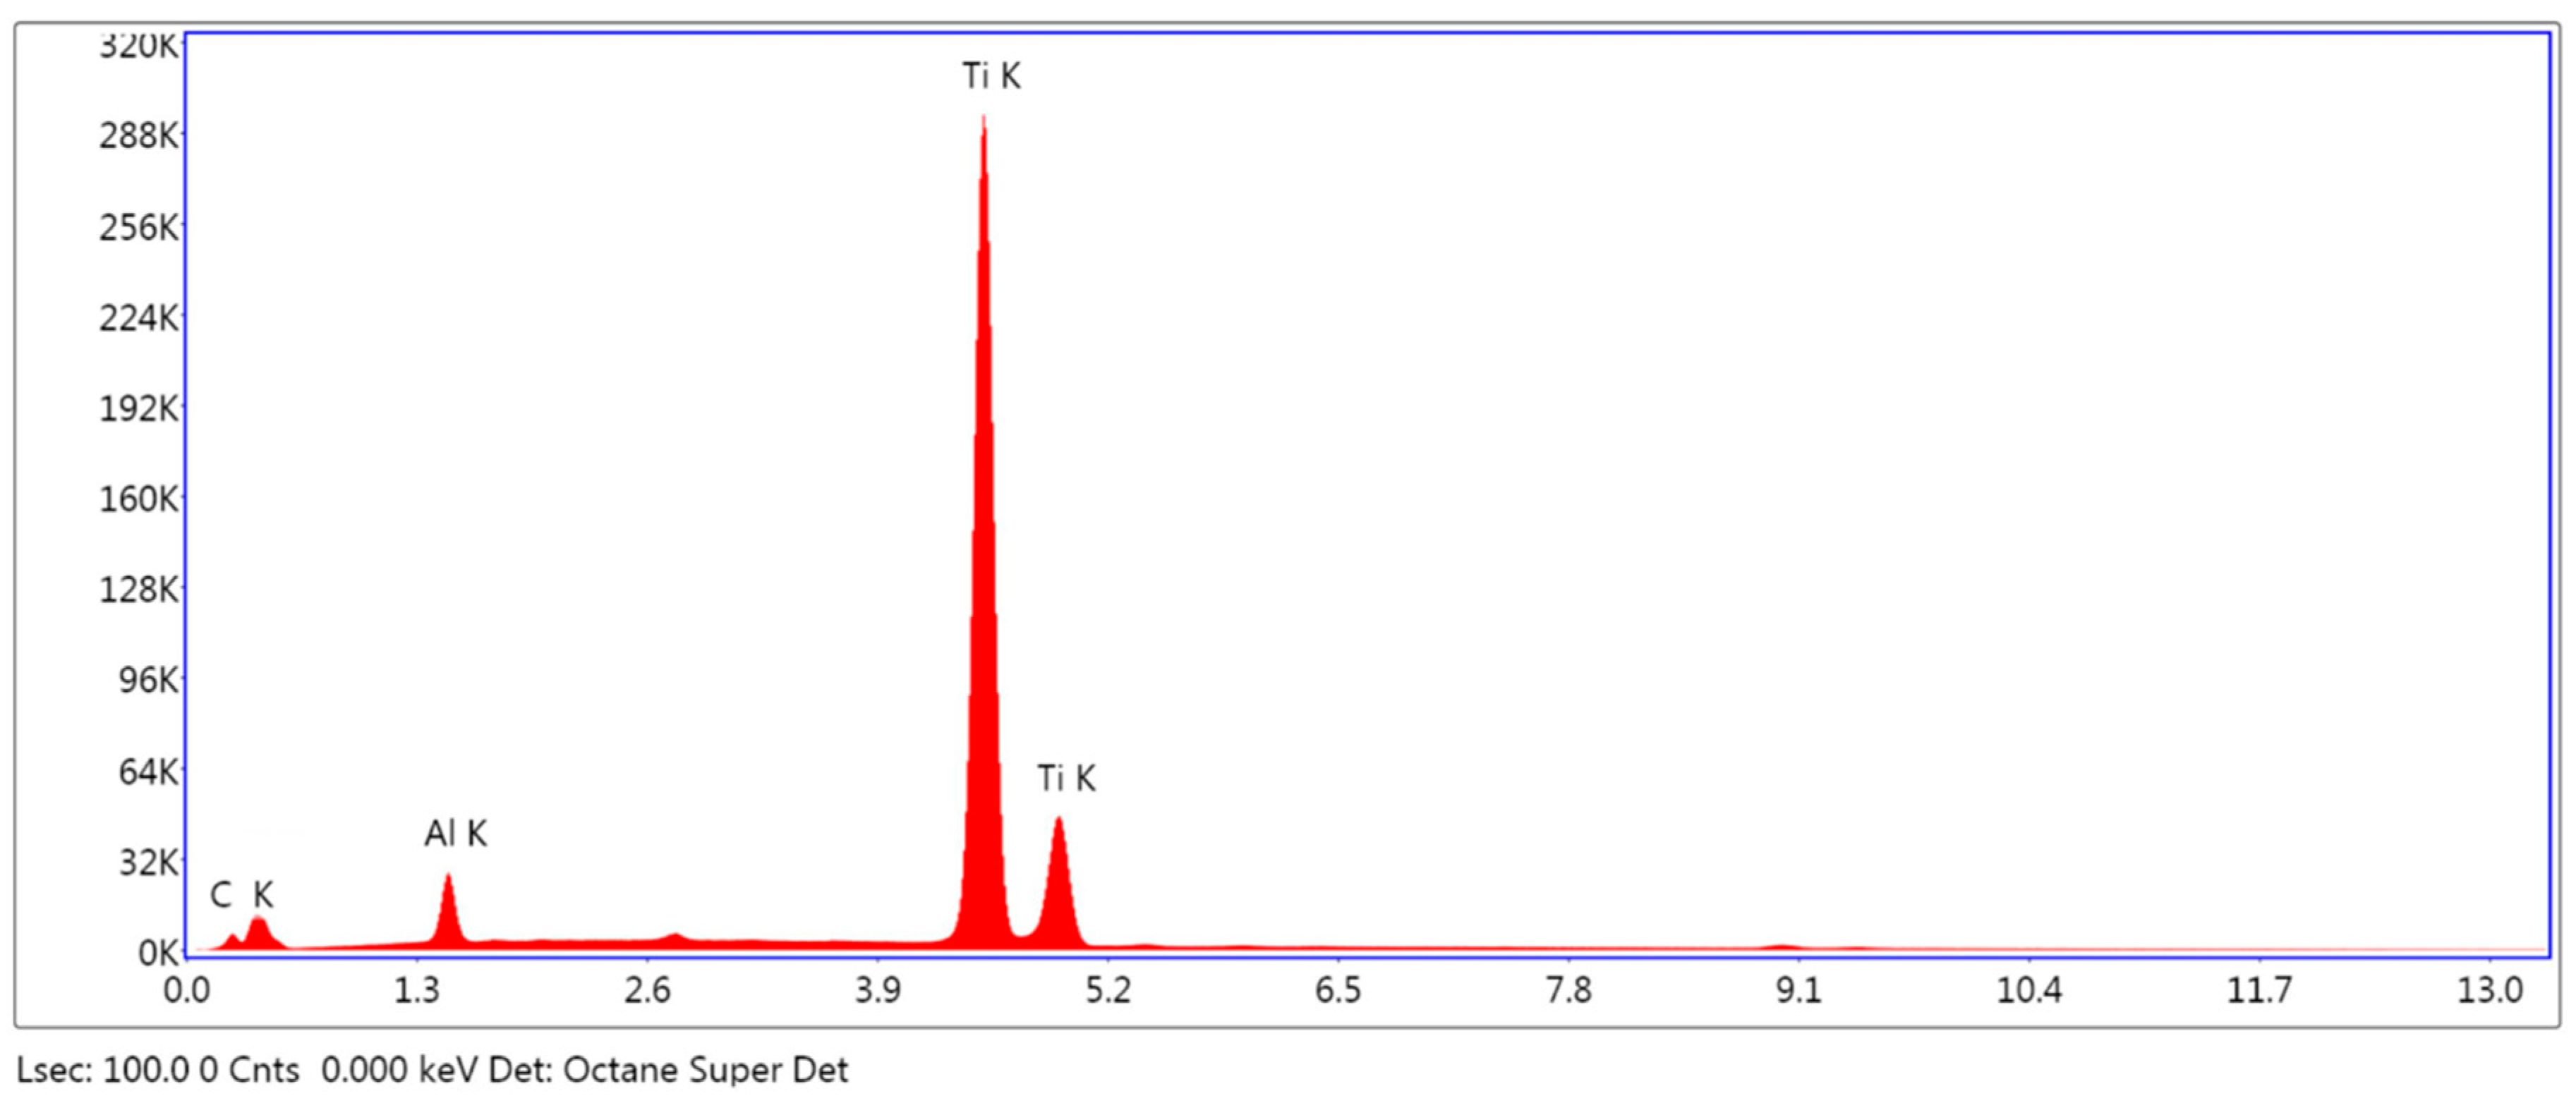
The compositional analysis of the different surfaces analyzed was carried out (Table 2). The percentage in elemental weight of hydrocarbon impurities detected on the surface of the HA/TCP group was much higher than that detected in the other samples. Titanium content was higher than 90% in all samples, and the HA + AW group was the group with the lower percentage. No aluminum was detected in the SLA group, due to the cleanliness of the aluminum particles from the sandblasting after the double acid etching. Ca and P are impurities derived from manufacturing. Energy dispersive spectroscopy analysis of the three surfaces is shown in Figure 9, Figure 10 and Figure 11.

3.1.3. Analysis of Surface Profile

Profile and surface roughness parameters were measured (Table 3 and Table 4). The SLA group had the lowest roughness values and the HA/TCP group had the highest. All groups presented statistically significant differences in their comparison (p < 0.05) except in the Sv variable.
The roughness profile is represented by peaks and troughs; however, topographic distribution is different between the groups. The profile of the SLA group shows peaks and valleys in the 3–4 μm range (Figure 12). In the case of HA/TCP, the profile is more irregular, with peaks in the 10–20 μm range and troughs in the 4–5 μm range (Figure 13). In the case of HA + AW, the profile is more regular but with deeper troughs in the 4–5 μm range (Figure 14). 3D top-view roughness images were obtained. Note that intervals between peaks and valleys differ between the three surfaces and, because of that, scales are different. Amplitude scales are 0–8.5 microns for SLA, 0–24 microns for HA/TCP, and 0–13 microns for HA + AW (Figure 15).

3.2. Cell Viability Study

A cell viability study was carried out based on the percentage of mitochondrial activity at 24 h, seeding 6 × 10⁵ cells/surface. The JC-1 reagent allowed to evaluate the red/green ratio of mitochondrial activity based on dead cells/live cells (Figure 16). In the case of the SLA surface, a ratio of activity of 93.85 was obtained, 97.74 in the HA/TCP surface, and 96.49 in HA + AW. Mitochondrial activity was high in the three surfaces, with HA/TCP being the one with higher ratio. No statistically significant differences were observed between the three groups, nor with respect to the negative control group.

3.3. Experimental Animal Study

Radiological analysis was performed using micro-computed tomography (Figure 17 and Figure 18). During this study, results obtained in relation to osseointegration indicated that radiological and histological data were favorable to Ziacom implants for the five variables studied. The bone volume, mean density, and accumulated density variables were higher in the SLA group, although not significantly so with respect to the other two groups (Table 5).
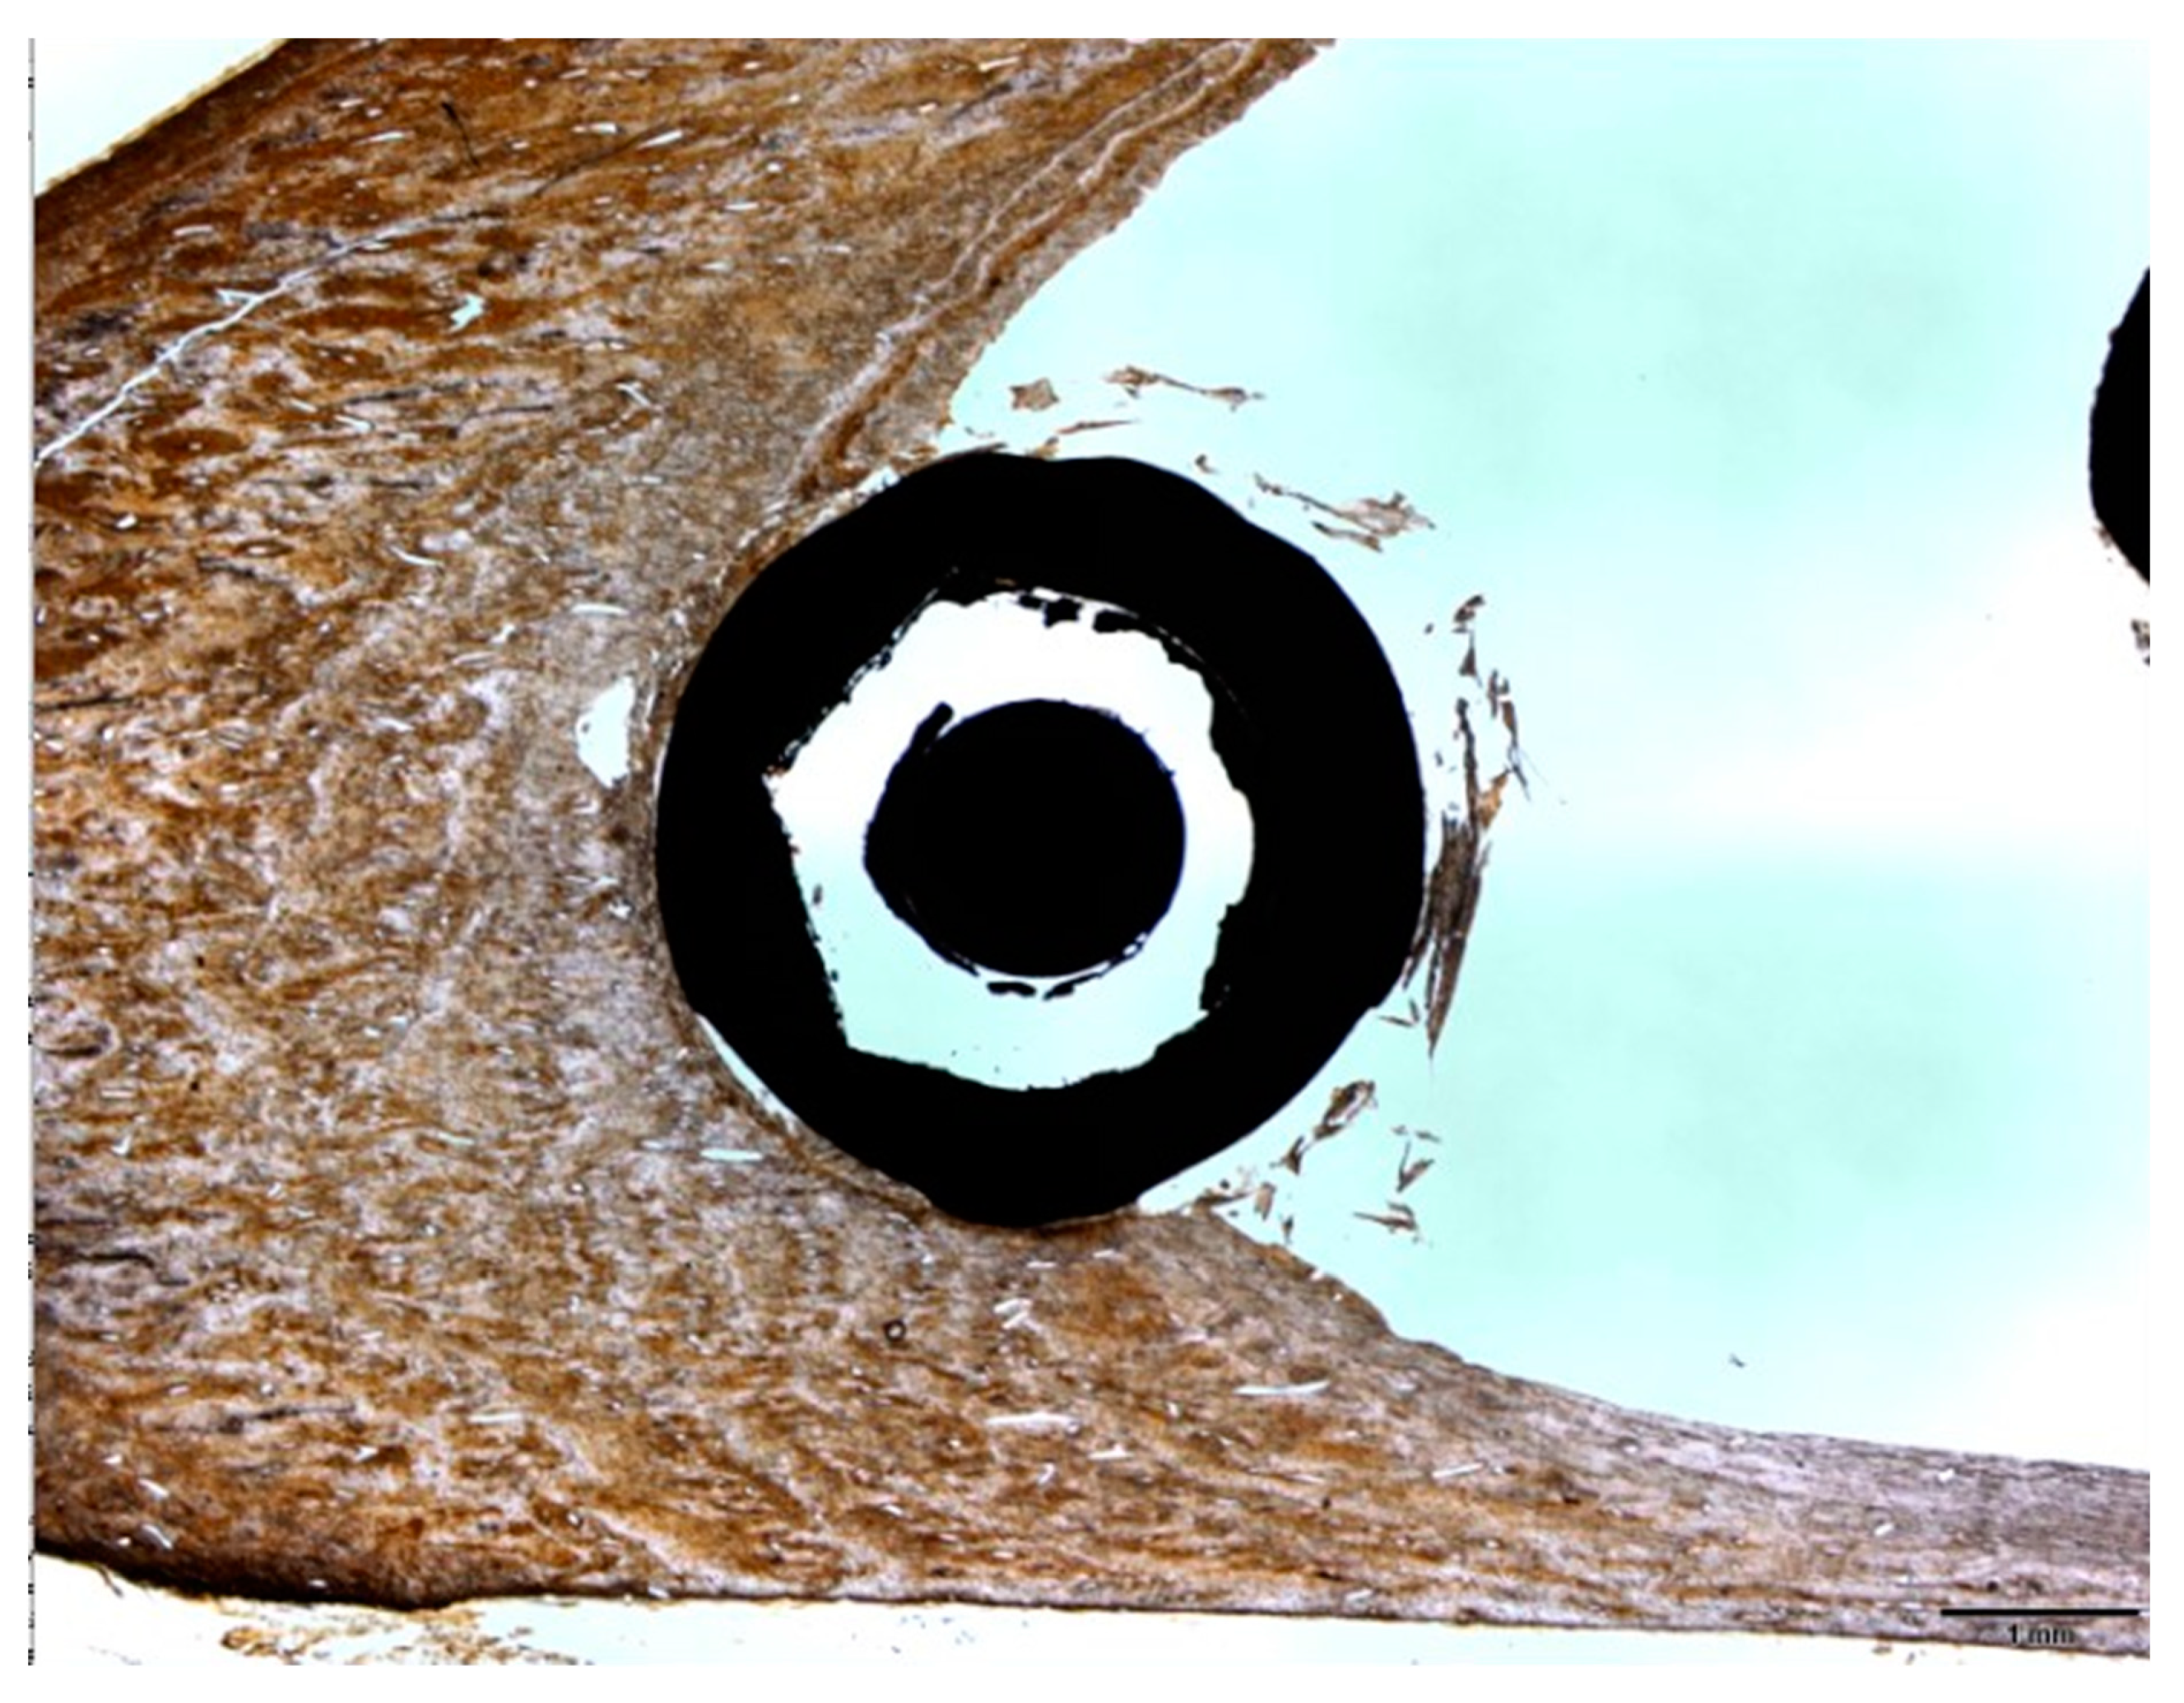
To evaluate the bone area and BIC, a histomorphometric evaluation was performed 6 weeks after implantation (Figure 19).
Regarding histological values, no significant differences were observed between the groups at the area level. The HA/TCP group had the highest BIC value, not significantly different from the SLA group. However, both groups were significantly different from HA + AW (Table 6).

4. Discussion

This study evaluated the influence of the surface of three dental implants on the in vitro cellular behavior and on animal osseointegration at the level of dimensions and bone density, as well as bone–implant contact.
The detailed procedure with which this type of surface treatment is carried out is something that manufacturers do not usually publish. Therefore, this type of surface is analyzed through EDS compositional studies, roughness measurements, and morphological analysis of the surface with a scanning electron microscope.
In the case of the Ziacom SLA surface, a three-dimensional surface structure with high peaks and wide valleys was observed; this is highly effective in promoting blood activation, clot formation, and growth factor release through platelet activation [22]. This type of surface could have an osteogenic effect thanks to its different topographic characteristics at the micrometric and nanometric level, which is similar to the osteoclastic resorption wells in bone [23].
Different manufacturers develop other types of surfaces. In the case of BioHorizons, the RBT® surface is based on sandblasting with synthetic resorbable bioceramic particles, such as titanium dioxide, hydroxyapatite, or tricalcium phosphate particles, to make the surface rougher [24,25]. The presence of these particles, which some of them are naturally part of the mineral bone phase, seeks to improve and accelerate the osseointegration phase [10]. Traditionally, sandblasting has been done with alumina, but there may be remains on the surface of the implant that hinder osseointegration, which is why the sandblasting method with resorbable bioceramic materials emerged years ago [26]. Furthermore, there is currently no consensus on this issue. While some authors argue that residual aluminum oxide has no effect on osseointegration [27], some others argue that it could become impregnated at the surface and hinder osseointegration. According to the published literature, this may be due to the Al ions competition action to calcium during the healing of implant bed and therefore producing inhibition of normal differentiation of bone marrow stromal cells and normal bone deposition and mineralization [28,29].
The main reason for selecting resorbable ceramic particles is that they remain on the surface and can absorb proteins such as fibrinogen and other serum proteins involved in platelet activation. The type of structure observed in the SEM analysis showed a markedly irregular surface with sharp-edged craters.
Zimmer MTX® surface is based on the combination of HA-blasting, an acid wash without etching and distilled water to remove material from sandblasting [30]. The observed surface showed an irregular topography with multiple craters and veins. This surface treatment intends to unify the benefits of both types of treatment (ceramic sandblasting and acid wash), although acid wash generates a different surface than acid etching, which resulted in the lowest BIC value in our study.
Surface roughness is a factor with a decisive influence on the balance between bone formation and resorption at the bone–implant interface, and therefore on its stability [31]. The profilometric study revealed that the surface with the highest profile and surface roughness was the HA/TCP group. According to the Albrektsson and Wennerberg classification, the HA/TCP group would show a surface with moderate roughness (Sa: 1–2 μm) and the other two groups would show minimum roughness (Sa: 0.5–1 μm). This moderate roughness is considered optimal to promote osseointegration [32]. Rp and Sp parameters are related to Ra and Sa and are important components in outstanding peaks and valleys, which increase the average roughness value.
The fact that the HA/TCP surface has the highest roughness is due to the fact that it is only sandblasted, which is the procedure that achieves the highest roughness. The other two groups (SLA and HA + AW) have less roughness, which would be due to the etching or acid washing treatment.
Viability was evaluated on MG-63 osteoblastic cells, which are used commonly to carry out this type of study [33]. A JC-1 test was performed to determine the mitochondrial activity ratio. Although it is true that the rougher surfaces show greater adhesion, proliferation, and osteoblastic differentiation [6,33], no statistically significant differences were observed at the level of cell viability despite the differences in topography and surface roughness. All three surfaces are considered to be biocompatible.
Implant stability depends on the bone density surrounding the implant as well as the bone-implant contact [5]. This last factor is linked to the transition from primary to secondary implant stability, obtained by the progression from a mechanical bond to the biological bond of new bone positioned on the implant surface at the end of the osseointegration period, which was a 6-week period in our study.
The bone deposited on the surface irregularities of the implant and in the chambers that form between the spirals of the implants matures and increases in volume and density through the formation of a greater number of blood vessels after 4 weeks [34]. Our study is not a “chambers” type as we used commercial implants, so new bone cannot be evaluated. Von Kossa stain is not able to detect new bone but only mineralized bone which is one of the aims of the study. New bone could be seen weeks before osseointegration, but this was not the goal of our study as it was evaluated after 6 weeks of implantation, considering this point in time as the end of the osseointegration process.
According to the literature reviewed, the maximum percentage of bone–implant contact is approximately 60%. Environmental contamination particles were detected on the EDS of the SLA surface (calcium and phosphorus) [35]. This contamination is inevitable and may also be due to the deposition of carbon impurities on the surface of the implant, which affects the complete adaptation of the bone–implant surface [35,36]. However, in this study, the HA/TCP group presented a higher percentage of carbon (18.46%) and was also the one with the highest BIC. Conversely, the HA + AW group obtained a significantly lower BIC value but with a carbon percentage of only 2.14%; it also had the lowest percentage of titanium of the three groups (91.69%). It is therefore reasonable to think that carbon accumulation did not have a determining influence, as has been observed in other studies [23]. In the same way, it can be stated that it did not influence either the cell viability or the bone variables analyzed. Although, EDS may not prove to be the most suitable method for measuring hydrocarbon impurities, X-ray photoelectron spectroscopy (XPS) should have been conducted.
The HA + AW group had significantly lower roughness than the other two groups, and its BIC value was also the lowest of the three. These BIC values are in accordance with roughness results, with HA/TCP and HA + AW being the groups with better profile and surface parameters (Ra, Rp, Rq, Rv, Sa, Sp, Sq, and Sv). These parameters define the surface microtopography and the latter has a key role in osseointegration [13], although some authors consider Sds and Sdr better options [37]. For this reason, this is considered a limitation of the study, since these additional parameters offer a better understanding of the surface microtopography.
These types of surfaces have often been compared in the literature. Fabbro et al. compared commercially pure titanium implants with HA blasting and subsequent acid etching (HA + AE), which were placed on mini pigs. BIC was analyzed in the coronal area. A total of 80.79% was obtained in the SLA group and 83.53% in the HA + AE group, without statistically significant differences between both [38]. These values are much higher than those obtained in our study, in which our comparable surfaces obtained values of 40.6% (SLA) and 27.60% (HA + AW); a statistically significant difference between both groups was observed.
Another study compared sandblasted surfaces with biphasic tricalcium phosphate (BCP) and surfaces with SLA treatment on implants placed in rabbits. BIC was evaluated at 8 weeks and SLA (≈68%) was found to have a significantly higher BIC value than BCP (≈47%). These authors explain these results by the fact that BCP-type surfaces are not treated with acid etching and, therefore, do not create a nanometer-scale topography, which would favor the adhesion and proliferation of osteoblasts [23]. In our study, no statistically significant difference was observed between both groups at the BIC level, as in other studies found in the literature [39,40,41,42].
Lukaszewska-Kuska et al. developed an in vitro study in which they compared titanium discs with different treatments similar to those carried out in this study: SLA, HA/TCP, and HA/TCP + acid etching. It is important to be cautious when comparing, since the latter group was sandblasted with TCP and then acid etched, unlike our HA + AW group which only has sandblasting with HA and washing with non-etching acid. As in our study, a viability test with MTS was carried out after 24 h. No statistically significant differences were observed between the groups [43].
Differences found in BIC when compared to other studies may be due, among other factors, to the fact that different animals are used (mini pigs, goats, dogs, or rats) whose bone characteristics may not be similar. Furthermore, the site of implantation may vary from one study to another (more or less trabecular or cortical area); therefore, comparisons between publications should be analyzed with caution.
To assess the results of our study, the macrodesign characteristics of each type of implants must also be integrated, although this has not been the primary objective of our study. For example, primary or mechanical stability depends mainly on three factors: the surgical procedure applied (relationship between the size of the implant and the surgical site prepared), bone density, and the design of the implant at both a macro and microscopic level [44].
On the other hand, the different elements of the implant (neck, body, and apical region), in addition to having the mission of procuring greater primary stability to the implant, are also involved in promoting the transmission of masticatory forces in the most homogeneous and natural way possible, as well as maintain a biological environment as compatible as possible with the function of dental implants [45,46].
Finally, the three groups showed good osseointegration according to the values obtained in terms of dimensions and bone density. The SLA group showed higher values in terms of bone volume, mean density, and accumulated density, although not significantly in comparison to the other two groups. Similarly, no significant differences were observed between the groups at the area level. In this sense, similar and good bone behavior can be observed in both pure titanium and alloy. In addition, there was also agreement between the in vitro study of cell viability and the in vivo histometric and bone density study.

5. Conclusions

This work evaluated the surface characteristics of several implants available in the market, as well as in vitro cell viability and their effect on different bone variables such as bone density and bone–implant contact. SLA and HA/TCP surfaces were the ones that obtained a higher BIC value. In the in vitro cell viability study, no statistically significant differences between the groups were observed. Likewise, no significant differences were observed at the level of volume, bone density, accumulated bone density, or area.
It is important to consider cautiously the results obtained, since this in vivo study with animals was carried out only during the osseointegration period (6 weeks) and parameters such as BIC could change over time. Therefore, in order to have evidence, more studies are needed to extend the study time.

Author Contributions

Conceptualization, M.-A.S.-F. and D.T.-L.; Formal analysis, M.R.-G., A.G.-d.-F. and J.-L.G.-P.; Funding acquisition, D.T.-L.; Investigation, M.R.-G., I.F.-A., A.G.-d.-F., C.V.-P., M.-A.S.-F., D.T.-L. and J.-L.G.-P.; Methodology, I.F.-A., A.G.-d.-F., M.-A.S.-F., D.T.-L. and J.-L.G.-P.; Project administration, J.-L.G.-P.; Resources, C.V.-P.; Validation, M.R.-G., M.-A.S.-F. and D.T.-L.; Writing—original draft, M.R.-G., I.F.-A., A.G.-d.-F., C.V.-P., M.-A.S.-F., D.T.-L. and J.-L.G.-P.; Writing—review and editing, M.R.-G., I.F.-A., A.G.-d.-F., C.V.-P., M.-A.S.-F., D.T.-L. and J.-L.G.-P. All authors have read and agreed to the published version of the manuscript.

Funding

This research was funded by Ziacom Medical SLU® (Madrid, Spain)—Grant FISEVI 2017.

Acknowledgments

The authors would like to express our gratitude to the technical staff of CITIUS-Central Research Services of the University of Seville.

Conflicts of Interest

The authors declare no conflict of interest. The funders had no role in the design of the study; in the collection, analyses, or interpretation of data; in the writing of the manuscript, or in the decision to publish the results.

References

  1. Albrektsson, T.; Wennerberg, A. On osseointegration in relation to implant surfaces. Clin. Implant Dent. Relat. Res. 2019, 21 (Suppl. 1), 4–7. [Google Scholar] [CrossRef] [Green Version]
  2. Babík, O.; Czán, A.; Holubjak, J.; Kameník, R.; Pilc, J. Identification of Surface Characteristics Created by Miniature Machining of Dental Implants Made of Titanium Based Materials. Procedia Eng. 2017, 192, 1016–1021. [Google Scholar] [CrossRef]
  3. Saini, M.; Singh, Y.; Arora, P.; Arora, V.; Jain, K. Implant biomaterials: A comprehensive review. World J. Clin. Cases 2015, 3, 52–57. [Google Scholar] [CrossRef] [PubMed]
  4. Elias, C.N.; Fernandes, D.J.; Resende, C.R.; Roestel, J. Mechanical properties, surface morphology and stability of a modified commercially pure high strength titanium alloy for dental implants. Dent. Mater. 2015, 31, e1–e13. [Google Scholar] [CrossRef]
  5. Bosshardt, D.D.; Chappuis, V.; Buser, D. Osseointegration of titanium, titanium alloy and zirconia dental implants: Current knowledge and open questions. Periodontol 2000 2017, 73, 22–40. [Google Scholar] [CrossRef] [PubMed]
  6. Annunziata, M.; Guida, L. The Effect of Titanium Surface Modifications on Dental Implant Osseointegration. Front. Oral Biol. 2015, 17, 62–77. [Google Scholar]
  7. Stanford, C.M. Surface modifications of dental implants. Aust. Dent. J. 2008, 53 (Suppl. 1), S26–S33. [Google Scholar] [CrossRef]
  8. Patil, P.; Bhongade, M. Dental Implant Surface Modifications: A Review. J. Dent. Med. Sci. 2016, 15, 132–141. [Google Scholar]
  9. Jemat, A.; Ghazali, M.J.; Razali, M.; Otsuka, Y. Surface Modifications and Their Effects on Titanium Dental Implants. BioMed Res. Int. 2015, 2015, 791725. [Google Scholar] [CrossRef] [Green Version]
  10. Park, N.I.; Kerr, M. Chapter 9: Dental Implant Surfaces. In Misch’s Contemporary Implant Dentistry, 4th ed.; Resnik, R., Ed.; Elsevier: Amsterdam, The Netherlands, 2020; p. 197. [Google Scholar]
  11. Barfeie, A.; Wilson, J.; Rees, J. Implant surface characteristics and their effect on osseointegration. Br. Dent. J. 2015, 218, E9. [Google Scholar] [CrossRef]
  12. Massaro, C.; Rotolo, P.; De Riccardis, F.; Milella, E.; Napoli, A.; Wieland, M.; Textor, M.; Spencer, N.D.; Brunette, D.M. Comparative investigation of the surface properties of commercial titanium dental implants. Part I: Chemical composition. J. Mater. Sci. Mater. Med. 2002, 13, 535–548. [Google Scholar] [CrossRef] [PubMed]
  13. Smeets, R.; Stadlinger, B.; Schwarz, F.; Beck-Broichsitter, B.; Jung, O.; Precht, C.; Kloss, F.; Gröbe, A.; Heiland, M.; Ebker, T. Impact of Dental Implant Surface Modifications on Osseointegration. Biomed. Res. Int. 2016, 2016, 6285620. [Google Scholar] [CrossRef] [Green Version]
  14. Hemlata, G.; Gaurav, B.; Arvind, G. Implant Surface Modifications: A Review. J. Clin. Diagn. Res. 2012, 6, 319–324. [Google Scholar]
  15. Park, J.Y.; Davies, J.E. Red blood cell and platelet interactions with titanium implant surfaces. Clin. Oral Implants Res. 2000, 11, 530–539. [Google Scholar] [CrossRef]
  16. Bornstein, M.M.; Reichart, P.A.; Buser, D.; Bosshardt, D.D. Tissue response and wound healing after placement of two types of bioengineered grafts containing vital cells in submucosal maxillary pouches: An experimental pilot study in rabbits. Int. J. Oral Maxillofac. Implants 2011, 26, 768–775. [Google Scholar]
  17. Castillo-Dalí, G.; Castillo-Oyagüe, R.; Terriza, A.; Saffar, J.L.; Batista-Cruzado, A.; Lynch, C.D.; Sloan, A.J.; Gutiérrez-Pérez, J.L.; Torres-Lagares, D. Pre-prostheticuseofpoly (lactic–co–glycolicacid) membranes treated with oxygen plasma and TiO2 nanocomposite particles for guided bone regeneration processes. J. Dent. 2016, 47, 71–79. [Google Scholar] [CrossRef] [PubMed]
  18. Bouxsein, M.L.; Boyd, S.K.; Christiansen, B.A.; Guldberg, R.E.; Jepsen, K.J.; Müller, R. Guidelines for assessment of bone microstructure in rodents using micro–computed tomography. J. Bone Miner. Res. 2010, 25, 1468–1486. [Google Scholar] [CrossRef] [PubMed]
  19. Donath, K.; Breuner, G. A method for the study of undecalcified bones and teeth with attached soft tissues. The Säge-Schliff (sawing and grinding) technique. J. Oral Pathol. 1982, 11, 318–326. [Google Scholar] [CrossRef] [PubMed]
  20. Torres-Lagares, D.; Castellanos-Cosano, L.; Serrera-Figallo, M.Á.; García-García, F.J.; López-Santos, C.; Barranco, A.; Rodríguez-Gonzalez Elipe, A.; Rivera-Jiménez, C.; Gutiérrez-Pérez, J.L. In Vitro and in Vivo Study of Poly (Lactic⁻co⁻Glycolic) (PLGA) Membranes Treated with Oxygen Plasma and Coated with Nanostructured Hydroxyapatite Ultrathin Films for Guided Bone Regeneration Processes. Polymers 2017, 9, 410. [Google Scholar] [CrossRef] [Green Version]
  21. Bernhardt, R.; Kuhlisch, E.; Schulz, M.C.; Eckelt, U.; Stadlinger, B. Comparison of bone-implant contact and bone-implant volume between 2D-histological sections and 3D-SRµCT slices. Eur. Cell Mater. 2012, 23, 237–247. [Google Scholar] [CrossRef]
  22. Kim, H.; Choi, S.H.; Ryu, J.J.; Koh, S.Y.; Park, J.H.; Lee, I.S. The biocompatibility of SLA-treated titanium implants. Biomed. Mater. 2008, 3, 025011. [Google Scholar] [CrossRef] [PubMed]
  23. Le Guehennec, L.; Goyenvalle, E.; Lopez-Heredia, M.A.; Weiss, P.; Amouriq, Y.; Layrolle, P. Histomorphometric analysis of the osseointegration of four different implant surfaces in the femoral epiphyses of rabbits. Clin. Oral Implants Res. 2008, 19, 1103–1110. [Google Scholar] [CrossRef] [PubMed]
  24. Coelho, P.G.; Granjeiro, J.M.; Romanos, G.E.; Suzuki, M.; Silva, N.R.; Cardaropoli, G.; Thompson, V.P.; Lemons, J.E. Basic research methods and current trends of dental implant surfaces. J. Biomed. Mater. Res. B 2009, 88, 579–596. [Google Scholar] [CrossRef] [PubMed]
  25. Yoon, W.J.; Kim, S.G.; Oh, J.S.; You, J.S.; Jeong, K.I.; Lim, S.C.; Jeong, M.A. Comparative study on the osseointegration of implants in dog mandibles according to the implant surface treatment. J. Korean Assoc. Oral Maxillofac. Surg. 2016, 42, 345–351. [Google Scholar] [CrossRef]
  26. Citeau, A.; Guicheux, J.; Vinatier, C.; Layrolle, P.; Nguyen, T.P.; Pilet, P.; Daculsi, G. In vitro biological effects of titanium rough surface obtained by calcium phosphate grid blasting. Biomaterials 2005, 26, 157–165. [Google Scholar] [CrossRef]
  27. Piattelli, A.; Degidi, M.; Paolantonio, M.; Mangano, C.; Scarano, A. Residual aluminum oxide on the surface of titanium implants has no effect on osseointegration. Biomaterials 2003, 24, 4081–4089. [Google Scholar] [CrossRef]
  28. Gehrke, S.A.; Taschieri, S.; Del Fabbro, M.; Coelho, P.G. Positive Biomechanical Effects of Titanium Oxide for Sandblasting Implant Surface as an Alternative to Aluminium Oxide. J. Oral Implantol. 2015, 41, 515–522. [Google Scholar] [CrossRef]
  29. Esposito, M.; Hirsch, J.M.; Lekholm, U.; Thomsen, P. Biological factors contributing to failures of osseointegrated oral implants. (II). Etiopathogenesis. Eur. J. Oral Sci. 1998, 106, 721–764. [Google Scholar] [CrossRef]
  30. Shafie, H.R.; Ballard, M.L. Abutment Preparation Techniques for One-Piece Titanium and Zirconia Implants. In Clinical and Laboratory Manual of Dental Implant Abutments; Shafie, H.R., Ed.; Wiley Blackwell: Hoboken, NJ, USA, 2014. [Google Scholar]
  31. Sezin, M.; Croharé, L.; Ibañez, J.C. Microscopic Study of Surface Microtopographic Characteristics of Dental Implants. Open Dent. J. 2016, 10, 139–147. [Google Scholar] [CrossRef] [Green Version]
  32. Albrektsson, T.; Wennerberg, A. Oral implant surfaces: Part 1–Review focusing on topographic and chemical properties of different surfaces and in vivo responses to them. Int. J. Prosthodont. 2004, 17, 536–543. [Google Scholar]
  33. Bachle, M.; Kohal, R.J. A systematic review of the influence of different titanium surfaces on proliferation, differentiation and protein synthesis of osteoblast-like MG63 cells. Clin. Oral Implants Res. 2004, 15, 683–692. [Google Scholar] [CrossRef]
  34. Buser, D.; Broggini, N.; Wieland, M.; Schenk, R.K.; Denzer, A.J.; Cochran, D.L.; Hoffmann, B.; Lussi, A.; Steinemann, S.G. Enhanced bone apposition to a chemically modified SLA titanium surface. J. Dent. Res. 2004, 83, 529–533. [Google Scholar] [CrossRef]
  35. Hayashi, R.; Ueno, T.; Migita, S.; Tsutsumi, Y.; Doi, H.; Ogawa, T.; Hanawa, T.; Wakabayashi, N. Hydrocarbon Deposition Attenuates Osteoblast Activity on Titanium. J. Dent. Res. 2014, 93, 698–703. [Google Scholar] [CrossRef] [Green Version]
  36. Ogawa, T.; Nishimura, I. Different bone integration profiles of turned and acid-etched implants associated with modulated expression of extracellular matrix genes. Int. J. Oral Maxillofac. Implants 2003, 18, 200–210. [Google Scholar]
  37. Rosa, M.B.; Albrektsson, T.; Francischone, C.E.; Schwartz Filho, H.O.; Wennerberg, A. The influence of surface treatment on the implant roughness pattern. J. Appl. Oral Sci. 2012, 20, 550–555. [Google Scholar] [CrossRef] [Green Version]
  38. Fabbro, M.D.; Taschieri, S.; Canciani, E.; Addis, A.; Musto, F.; Weinstein, R.; Dellavia, C. Osseointegration of Titanium Implants With Different Rough Surfaces: A Histologic and Histomorphometric Study in an Adult Minipig Model. Implant Dent. 2017, 26, 357–366. [Google Scholar] [CrossRef]
  39. Dundar, S.; Yaman, F.; Bozoglan, A.; Yildirim, T.T.; Kirtay, M.; Ozupek, M.F.; Artas, G. Comparison of Osseointegration of Five Different Surfaced Titanium Implants. J. Craniofac. Surg. 2018, 29, 1991–1995. [Google Scholar] [CrossRef]
  40. Coelho, P.G.; Bonfante, E.A.; Pessoa, R.S.; Marin, C.; Granato, R.; Giro, G.; Witek, L.; Suzuki, M. Characterization of five different implant surfaces and their effect on osseointegration: A study in dogs. J. Periodontol. 2011, 82, 742–750. [Google Scholar] [CrossRef]
  41. Bonfante, E.A.; Marin, C.; Granato, R.; Suzuki, M.; Hjerppe, J.; Witek, L.; Coelho, P.G. Histologic and biomechanical evaluation of alumina-blasted/acid-etched and resorbable blasting media surfaces. J. Oral Implantol. 2012, 38, 549–557. [Google Scholar] [CrossRef]
  42. Marin, C.; Granato, R.; Suzuki, M.; Janal, M.N.; Gil, J.N.; Nemcovsky, C.; Bonfante, E.A.; Coelho, P.G. Biomechanical and histomorphometric analysis of etched and non-etched resorbable blasting media processed implant surfaces: An experimental study in dogs. J. Mech. Behav. Biomed. Mater. 2010, 3, 382–391. [Google Scholar] [CrossRef]
  43. Lukaszewska-Kuska, M.; Wirstlein, P.; Majchrowski, R.; Dorocka-Bobkowska, B. Osteoblastic cell behaviour on modified titanium surfaces. Micron 2018, 105, 55–63. [Google Scholar] [CrossRef]
  44. Azcarate-Velázquez, F.; Castillo-Oyagüe, R.; Oliveros-López, L.G.; Torres-Lagares, D.; Martínez-González, A.J.; Pérez-Velasco, A.; Lynch, C.D.; Gutiérrez-Pérez, J.L.; Serrera-Figallo, M.A. Influence of bone quality on the mechanical interaction between implant and bone: A finite element analysis. J. Dent. 2019, 88, 103161. [Google Scholar] [CrossRef]
  45. Scarano, A.; Degidi, M.; Perrotti, V.; Degidi, D.; Piattelli, A.; Iezzi, G. Experimental evaluation in rabbits of the effects of thread concavities in bone formation with different titanium implant surfaces. Clin. Implant Dent. Relat. Res. 2014, 16, 572–581. [Google Scholar] [CrossRef]
  46. Scarano, A.; Lorusso, C.; Di Giulio, C.; Mazzatenta, A. Evaluation of the Sealing Capability of the Implant Healing Screw by Using Real Time Volatile Organic Compounds Analysis: Internal Hexagon Versus Cone Morse. J. Periodontol. 2016, 87, 1492–1498. [Google Scholar] [CrossRef]
Figure 1. Regions of interest of the surface characterization. Morphological and compositional measurements zone (blue rectangle). Roughness analysis zone (green rectangle).
Applsci 10 04790 g001
Figure 2. Selected zone for roughness measurement at the apical third of the implant.
Applsci 10 04790 g002
Figure 3. Clinical images of implant placement in animal test rabbits.
Applsci 10 04790 g003
Figure 4. Analysis of bone growth by micro-computed tomography (µ-CT). Schematic representation of 3D view (A) and 2D view (B) of the dimensions of the surrounding bone that were analyzed.
Applsci 10 04790 g004
Figure 5. Diagram of the area of bone analyzed: 1 mm around the implant surface.
Applsci 10 04790 g005
Figure 6. SEM images of the sandblasted and acid etched (SLA) surface 200× (left) and 12,000× (right).
Applsci 10 04790 g006
Figure 7. SEM images of the hydroxyapatite and tricalcium phosphate (HA/TCP) surface 200× (left) and 12,000× (right).
Applsci 10 04790 g007
Figure 8. SEM images of the surface of HA blast, and non-etching acid wash (HA + AW) 200× (left) and 12,000× (right).
Applsci 10 04790 g008
Figure 9. Energy dispersive spectroscopy analysis of SLA.
Applsci 10 04790 g009
Figure 10. Energy dispersive spectroscopy analysis of HA/TCP.
Applsci 10 04790 g010
Figure 11. Energy dispersive spectroscopy analysis of HA + AW.
Applsci 10 04790 g011
Figure 12. SLA surface profilometry.
Applsci 10 04790 g012
Figure 13. HA/TCP surface profilometry.
Applsci 10 04790 g013
Figure 14. HA + AW surface profilometry.
Applsci 10 04790 g014
Figure 15. Color map of surface roughness in SLA (left), HA/TCP (middle), and HA + AW (right).
Applsci 10 04790 g015
Figure 16. Balance of mitochondrial activity. (A) Negative control. (B) Positive control. (C) SLA. (D) HA + AW. (E) HA/TCP.
Applsci 10 04790 g016
Figure 17. Computerized microtomography of two of the tibias analyzed, in which the different types of implants used in the study are observed [1. HA/TCP (BioHorizons); 2. SLA (Ziacom); 3. HA + AW (Zimmer)].
Applsci 10 04790 g017
Figure 18. Radiological analysis by CT imaging following implantation. The strong artefacts along the screw axis made it impossible to analyze bone structures in these positions (i.e., frame 95). To avoid biases due to this issue, results were calculated as the difference between the values obtained in non-adjacent regions (i.e., frame 1) and the adjacent regions (i.e., frame 45).
Applsci 10 04790 g018
Figure 19. Histological image showing mineralized bone around the HA + AW implant. Von Kossa stain, 5× magnification. The difference in the quantity of the surrounding bone (between left and right sides) is due to the location of the implant in the most distal zone of the tibial metaphysis where bone is thinner. This is an anatomical limitation because this bone has different thickness over its whole length, being thicker on the proximal zone. This image is from a distal zone of implantation. To minimize this effect in all groups, implant locations in the proximal, middle, or distal zones was alternating for reducing this possible limitation/bias.
Applsci 10 04790 g019
Table 1. Description of the characteristics of the implants analyzed in the study.
Implant
Manufacturer
Surface NameGroup NameTitanium GradeReference
ZiacomSLA (sandblasted and acid etched)SLATi grade IVZSS4011
BioHorizonsRBT (resorbable hydroxyapatite and tricalcium phosphate (HA and TCP) blast texturing)HA/TCPTi-6Al-4V
(grade V)
PGR4009
ZimmerMTX (microtextured, HA blast, and non-etching acid wash)HA + AWTi-6Al-4V
(grade V)
TSVT4B8
Table 2. Compositional analysis of implant surfaces.
ElementWeight %
SLAHA/TCPHA + AW
C K9.38 (10.23)5.23 (8.05)3.91 (1.02)
Al K-4.60 (4.36)3.82 (0.19)
Ti K89.53 (11.77)84.76 (15.59)92.27 (0.82)
SLA, sandblasted and double acid etched.
HA/TCP, hydroxyapatite and tricalcium phosphate blasted.
HA + AW, hydroxyapatite blasted and non-etching acid wash.
Table 3. Profile roughness parameters.
ImplantRa (μm) (SD)Rq (μm) (SD)Rp (μm) (SD)Rv (μm) (SD)
SLA0.82 (0.10) *0.97 (0.08) *1.84 (0.04) **, ***2.21 (0.01)
HA/TCP1.11 (0.03) *1.45 (0.10) *2.97 (0.28) *, ***3.38 (1.28)
HA + AW0.97 (0.17)1.18 (0.24)2.07 (0.27) *, **3.11 (0.62)
*, **, *** There are significant differences between the pairs of values identified by the same number of asterisks.
Table 4. Three-dimensional surface roughness parameters.
ImplantSa (μm) (SD)Sq (μm) (SD)Sp (μm) (SD)Sv (μm) (SD)
SLA0.76 (0.01) **, ***0.97 (0.01) **, ***4.20 (0.12) *4.62 (0.20) *, **
HA/TCP1.61 (0.02) *, ***2.05 (0.01) *, ***11.69 (1.48) *9.35 (4.02) *
HA + AW0.92 (0.07) *, **1.21 (0.11) *, **10.67 (7.27)7.97 (0.68) **
*, **, *** There are significant differences between the pairs of values identified by the same number of asterisks.
Table 5. Bone structure analysis data obtained with the Imaris® software.
MeanSD
Volume (mm3)SLA0.1970.225
HA/TCP0.1290.242
HA + AW0.0090.007
Bone density (HU)SLA642.00149.14
HA/TCP505.83212.02
HA + AW442.25235.28
Accumulated density (HU)SLA4,806,900.005,857,115.70
HA/TCP1,862,223.173,282,273.12
HA + AW233,098.00225,000.53
Table 6. Data referring to the bone area and bone–implant contact (BIC).
MeanSD
Area (mm2)SLA24992026
HA/TCP31471978
HA + AW19331022
BIC (%)SLA40.6 *17.77
HA/TCP41.28 **11.26
HA + AW27.60 *, **9.62
*, ** There are significant differences between the pairs of values identified by the same number of asterisks.