Article

Temporal and Spatial Diversity of Renewable Groundwater Resources in the River Valley

Faculty of Geology, University of Warsaw, Żwirki i Wigury 93, 02-089 Warszawa, Poland
*
Author to whom correspondence should be addressed.
Appl. Sci. 2020, 10(14), 4827; https://doi.org/10.3390/app10144827
Submission received: 23 June 2020 / Revised: 10 July 2020 / Accepted: 12 July 2020 / Published: 14 July 2020
(This article belongs to the Section Environmental Sciences)

Abstract

:
Quantitative assessment of the amount of renewable resources allows their evaluation, valorization and protection in terms of the possibility of their environmental management under climate change conditions. The aim of the study was to determine the amount of renewable resources in the Middle Vistula valley, in the region of the Kampinos National Park, central Poland. The amount of renewable resources was calculated on a hydrodynamical model for three variants, as the average, the lowest and the highest infiltration recharge rate for a specified period of 1999–2013. The modelling research was conducted in a strongly differentiated hydrogeological valley unit, in which several geomorphological units could be delineated: the floodplain, over-flood terraces and the plain area. The hydrodynamic modelling results were verified by comparing the obtained data with both the amount of drainage in the valley zone and the underground streamflow. The assessment of renewable groundwater resources in three distinctive variants was the basis for calculating the groundwater footprints, defined as a quantitative assessment of the groundwater use in climate change conditions.

1. Introduction

In shallow hydrogeological systems, not threatened by excessive groundwater depletion, quantitative assessment of the renewable groundwater resources can be identified with infiltration recharge [1]. Therefore, the quantitative assessment of renewable groundwater resources is directly understood as the determination of infiltration recharge, and the result can be verified by the volume of groundwater outflow of the river only if defined as the drainage base [2,3].
The assessment of renewable resources in shallow aquifers is received in balance areas, which are river catchments [4,5,6,7]. Renewable groundwater resources are an essential element in planning for groundwater demand by both man and the environment, including groundwater-dependent ecosystems (GDEs). The assessment of renewable groundwater resources can also be the basis for determining the groundwater footprint defined as a quantitative assessment of groundwater use referenced to the aquifer area [8].
The methods of assessing the amount of infiltration recharge on a regional scale are the subject of many hydrogeological studies, and the synthesis was presented in some publication [2,9,10,11]. Groundwater infiltration recharge is a complex process that depends on many factors, including climatic conditions and the dynamics of their changes [12,13,14,15], permeability and texture of soils and the vadose zone [16,17,18,19], slope gradient and terrain relief [20,21,22], land use/land cover [10,14,23,24,25], thickness of the vadose zone [19,26] and factors associated with biological and microbial activity in the vadose zone [27,28,29].
The methodology for assessing the amount of infiltration recharge in regional terms considers review of two main aspects, i.e., the method of assessing the amount of infiltration recharge and the identification of the balance area in which renewable resources will be assessed. There is also a need to identify the changes in infiltration rate due to strong dependency from the precipitation value, which variable distribution can be defined as climate changes.
Hydrogeomorphological studies on hydrological processes and phenomena with respect to both morphological units and geomorphological processes [30,31] may refer to the assessment of groundwater flow [32] and to the indication of zones of potential groundwater occurrence [33,34].
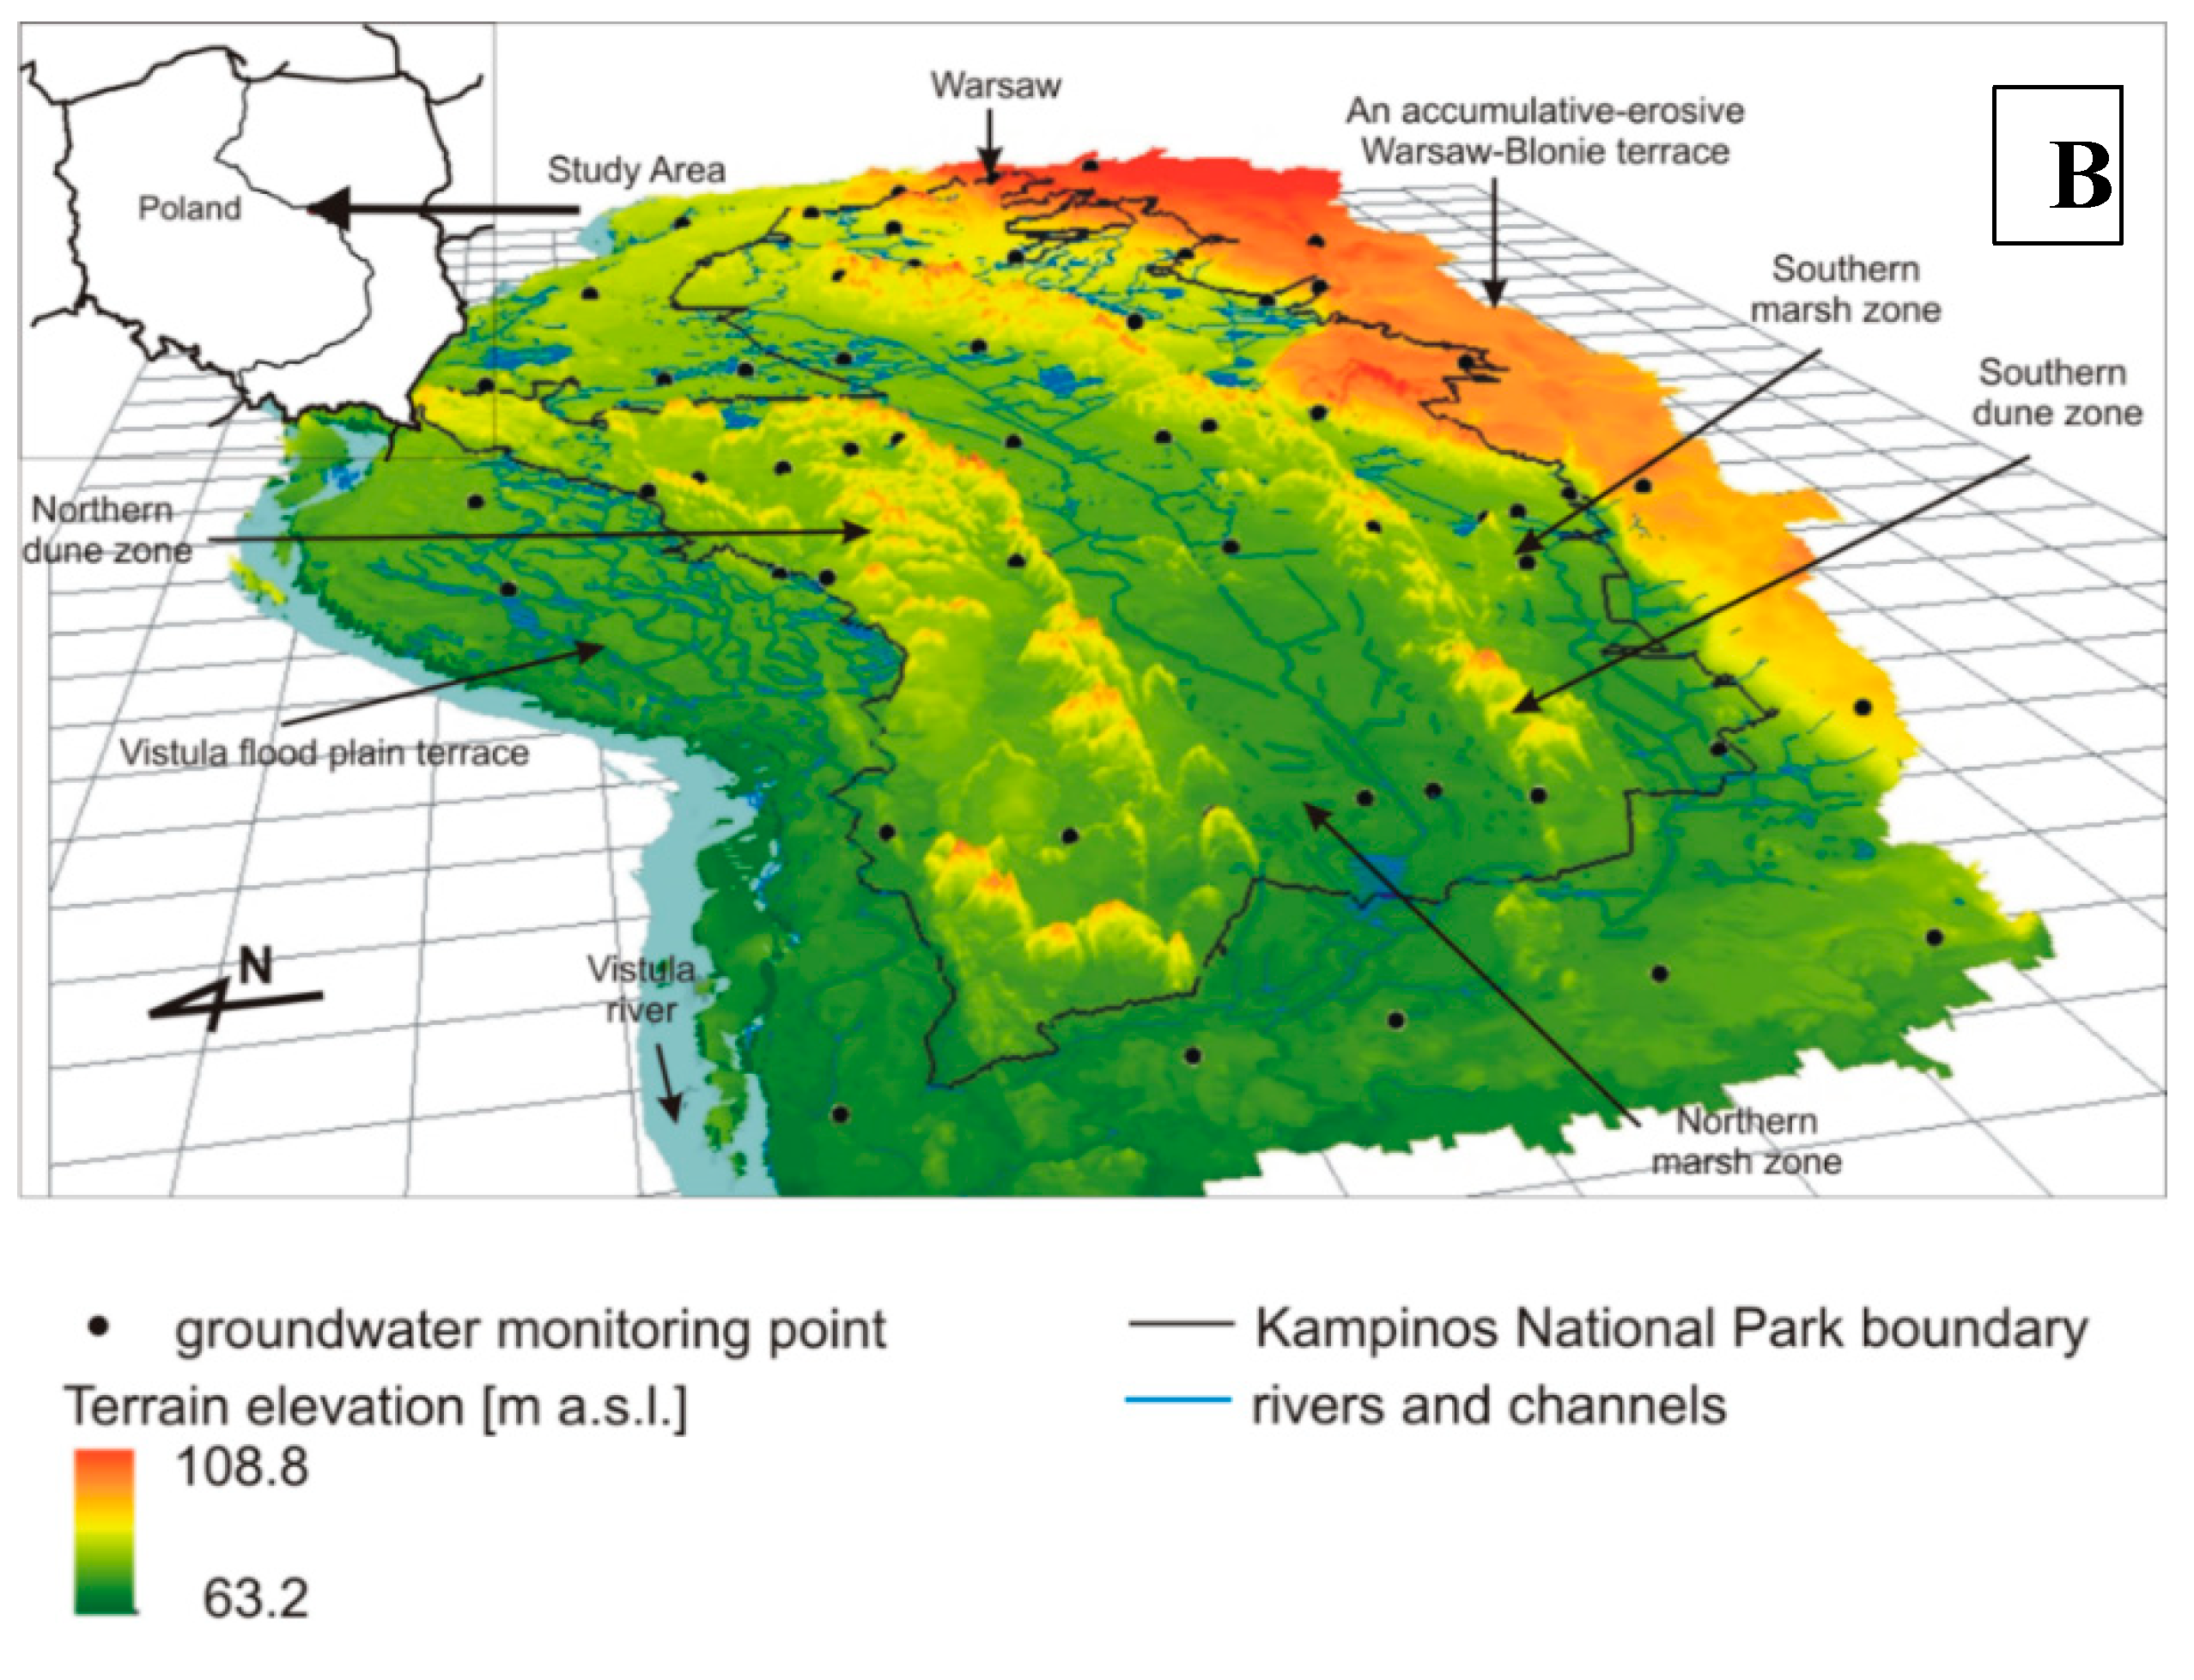
The aim of the study was to determine the amount of renewable resources in the Middle Vistula valley, in the region of the Kampinos National Park (KNP) (Figure 1), central Poland, in the specific conditions resulting from monitoring data and precipitation analysis. Quantitative assessment of the amount of renewable resources allows their evaluation, valorization and protection in terms of the possibility of their environmental management under climate change conditions. The amount of renewable resources was calculated on a model for three variants, as the average, the lowest and the highest rate for the period 1999–2013 in both a hydrogeological valley unit and geomorphological units located within it.
Defined changes in renewable resources enabled a variant assessment of the groundwater footprint.
The empirical method offers a quick assessment of infiltration recharge as a proportion of precipitation in terms of climate (generally atmospheric precipitation), land use, terrain and geology. Results of infiltration using the empirical method in the KNP area are from 119 in the swamp areas to 199 mm/year in the dunes [37].
The basis for the runoff calculations for catchment located in KNP (area of catchment = 441 km2) in the period of 1951–2000 was used. The runoff separation to the surface and underground components (by hydrograph separation) was done using an automated method called Base Flow Index [38]. In the period of 1951–2000 the river base runoff varied considerably: from 163 mm in 1967 to barely 43 mm in years 1952 and 1992 [39].
Infiltration recharge was determined in swamp zones located in the Middle Vistula valley in using the Water Table Fluctuation (WTF) method was also applied. The values of average annual infiltration recharge method for 1999–2013 was 96–98 mm/year for GDEs [40].

2. Background to the Study Site

2.1. Topography and Geomorphology

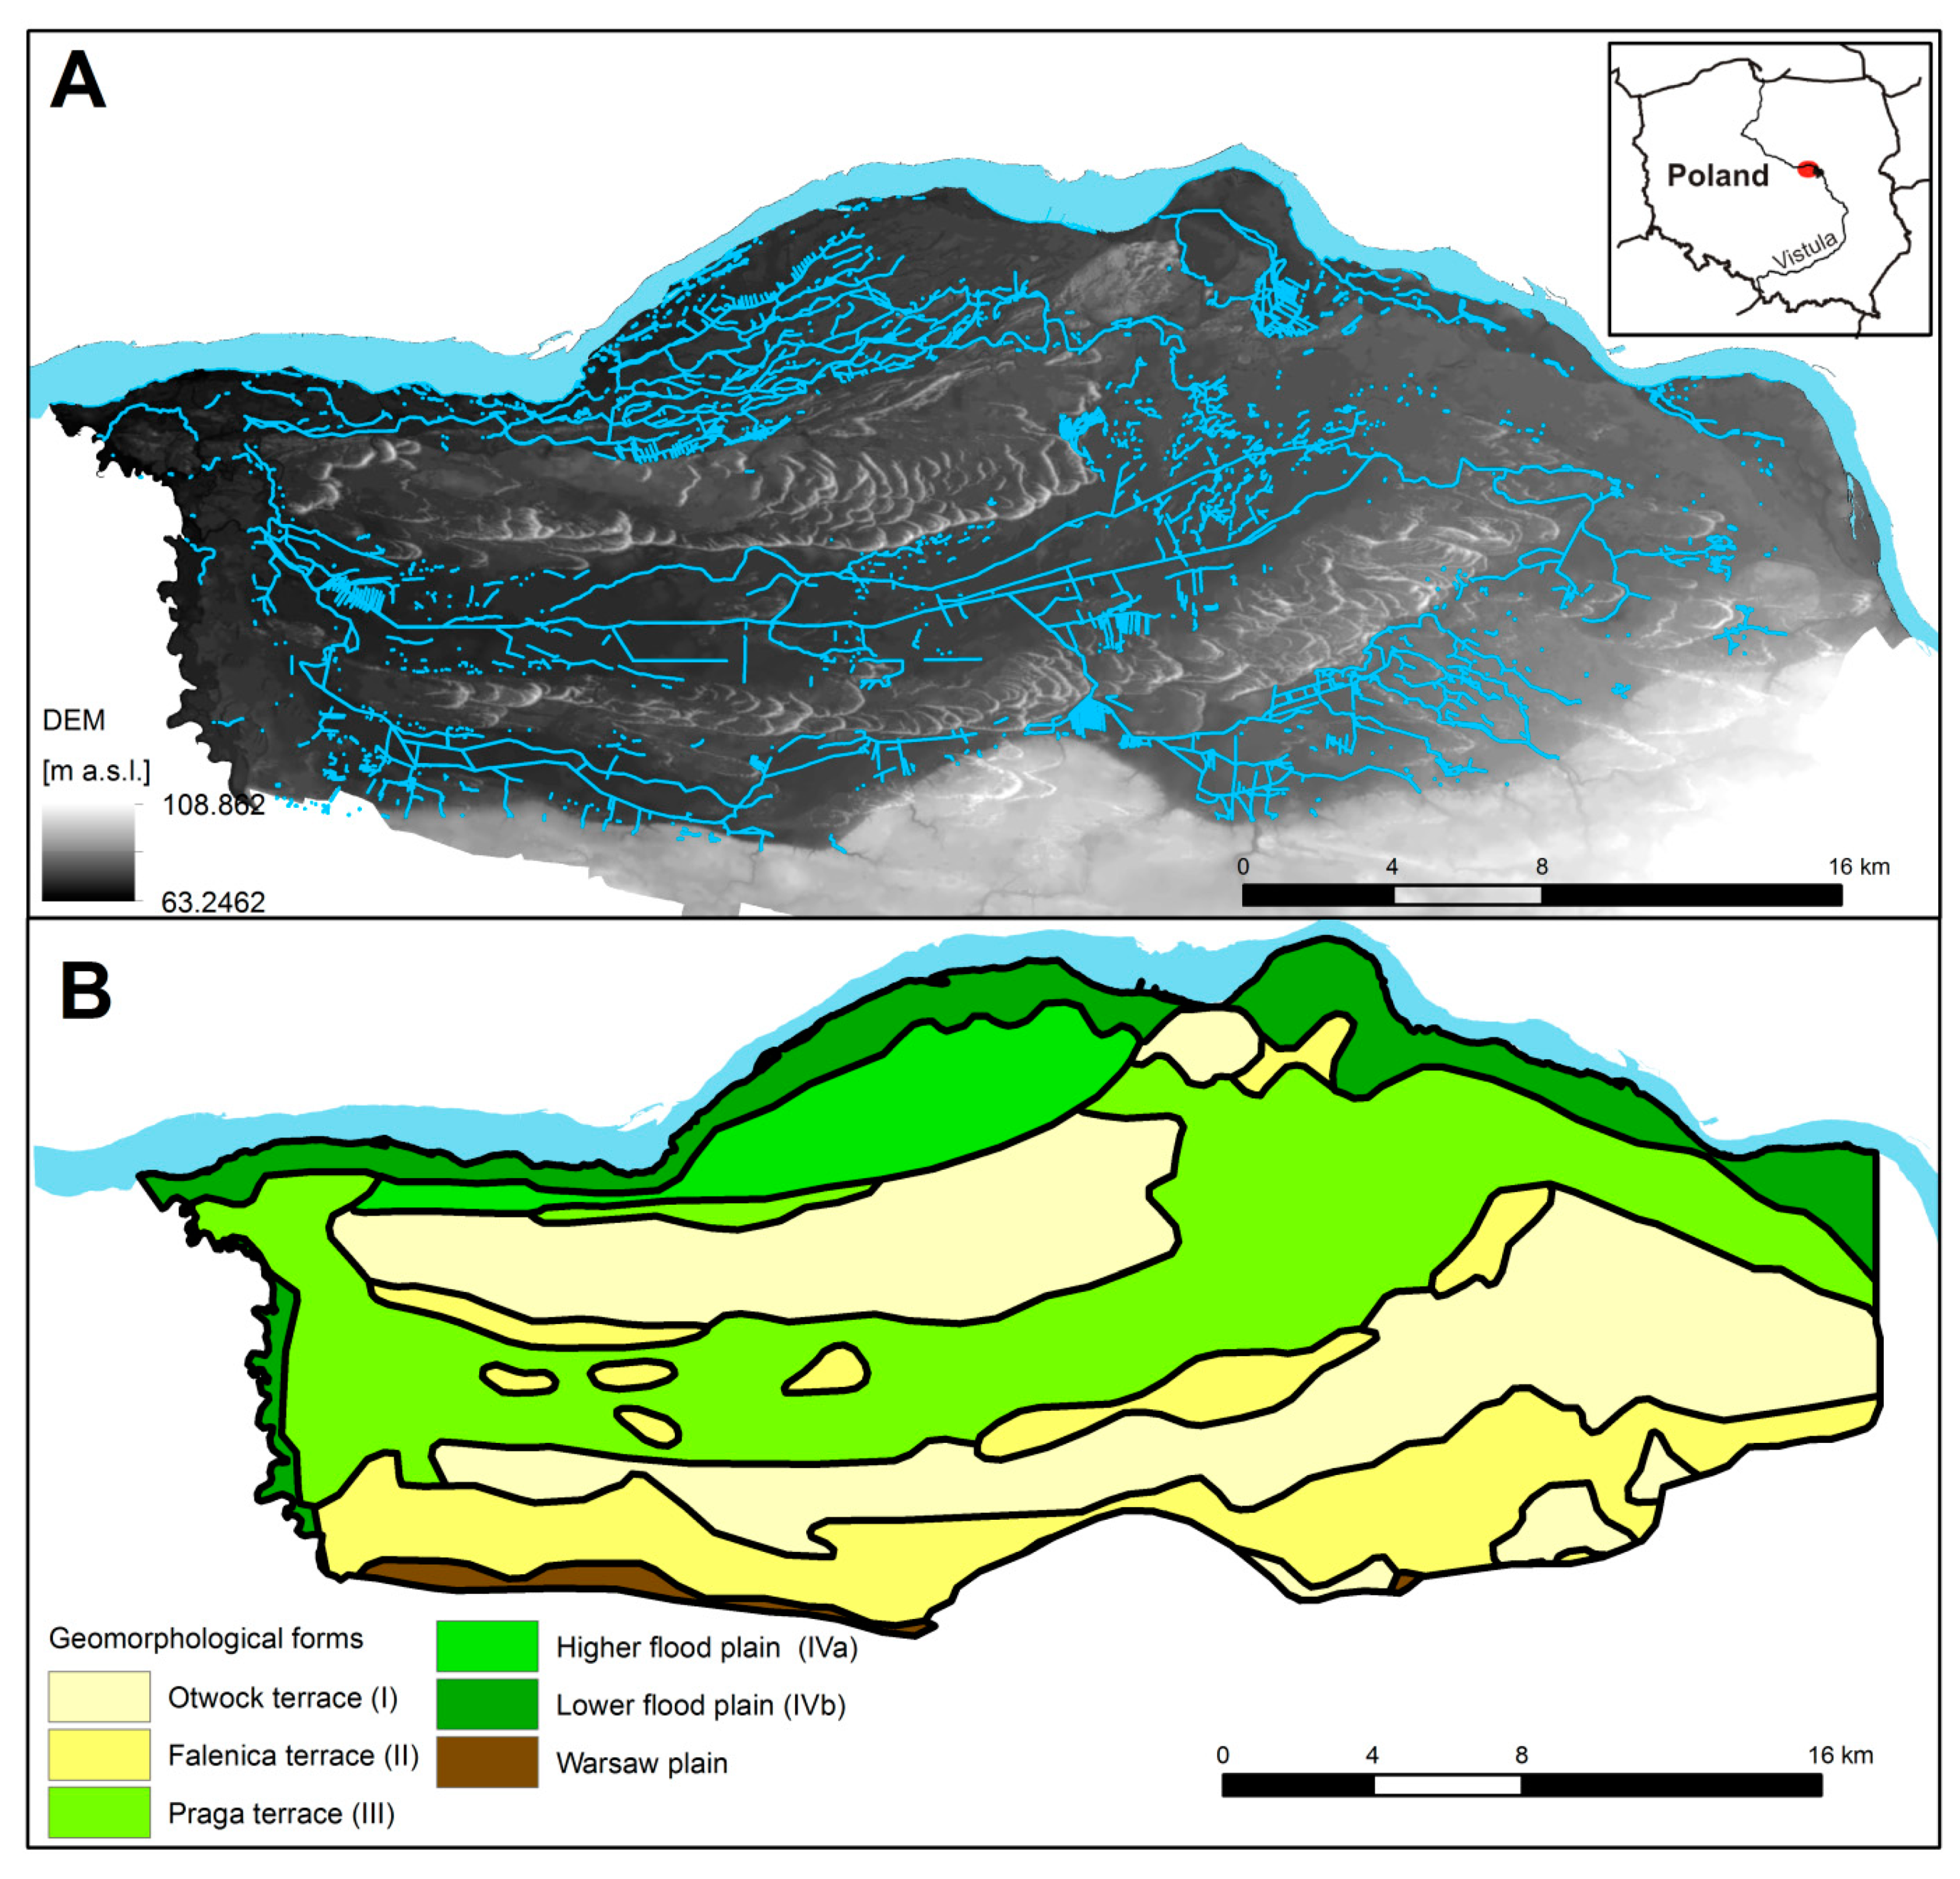
The research area is located in the Middle Vistula valley, in the Kampinos National Park region, where the main geomorphological units determining the current shape of the valley are the result of processes occurring from the end of the Pleistocene. The morphogenesis of the Vistula valley is typical of the Central European Lowlands and it represents a complete set of accumulative sequences that are not as well developed on other sections of the valley. It is associated most closely with the period of the last (Vistulian) glaciation, which was started by the accumulation of the youngest ice-dammed lake sediments in the Warsaw Plain, followed by the development of denudation, deep fluvial erosion, aeolian processes and sequence accumulation in the Vistula valley. As a result, three over-flood terraces of the Vistula River have developed: Otwock (I), Falenica (II) and Praga (III), built up in places by extensive dune complexes and accumulations of aeolian sands [41] (Figure 1 and Figure 2). In the Otwock Terrace (I), the dominant terrain forms are dune hills, giving the area a varied relief. Sediments of the Otwock Terrace reach a maximum thickness of 16 m. The terrain elevations within the terrace range from 66.19 to 100.58 m a.s.l. (above sea level), with an average of 77.28 m a.s.l. Dune-forming processes, related to the lowering of the groundwater table, started in the Oldest Dryas. The decline of dune-forming processes fell at the beginning of the Alleröd [42]. In the Oldest Dryas and Bölling periods, fluvial erosion led to the dissection of the Otwock sediments, followed by accumulation of the Falenica Terrace (II), also called the Kampinos Terrace. The Falenica Terrace (II), is a flat surface located at an elevation of 67.04–97.73 m a.s.l., with an average of 75.29 m a.s.l., approx. 7–10 m above the mean level of the Vistula River [41]. In the Older Dryas and the Alleröd, after dissection of the Falenica Terrace and locally the Otwock Terrace and because of subsequent accumulation, the Praga Terrace (III) was formed [41]. It occurs at an elevation of 63.24–95.74 m a.s.l., with an average of 72.77 m a.s.l., i.e., about 4–7 m above the mean level of the Vistula River [42]. In the Holocene, the Vistula valley was an area of fluvial accumulation of sands, mineral and organic sediments, and muds forming a two-part floodplain within a 7–8 m deep incision in the Praga Terrace [43,44]. The floodplain was divided on the lower (IVa) and upper (IVb) plain. The average elevation of the IVa area is 71.21 m a.s.l. For level IVb, the average elevation is 71.66 m a.s.l., higher than for IVa due to significant anthropogenic transformations of the terrain, represented by embankments and levees.

2.2. Hydrogeological Conditions

Detailed characteristics of the hydrogeological conditions of the Vistula valley have been presented in a number of publications based mainly on field reconnaissance and monitoring of groundwater and surface waters, functioning in the region since 1999, providing information on the functioning of GDE areas and confirming their dependence on groundwater based on various statistical methods, i.e., factor analysis [6,40,45,46,47,48].
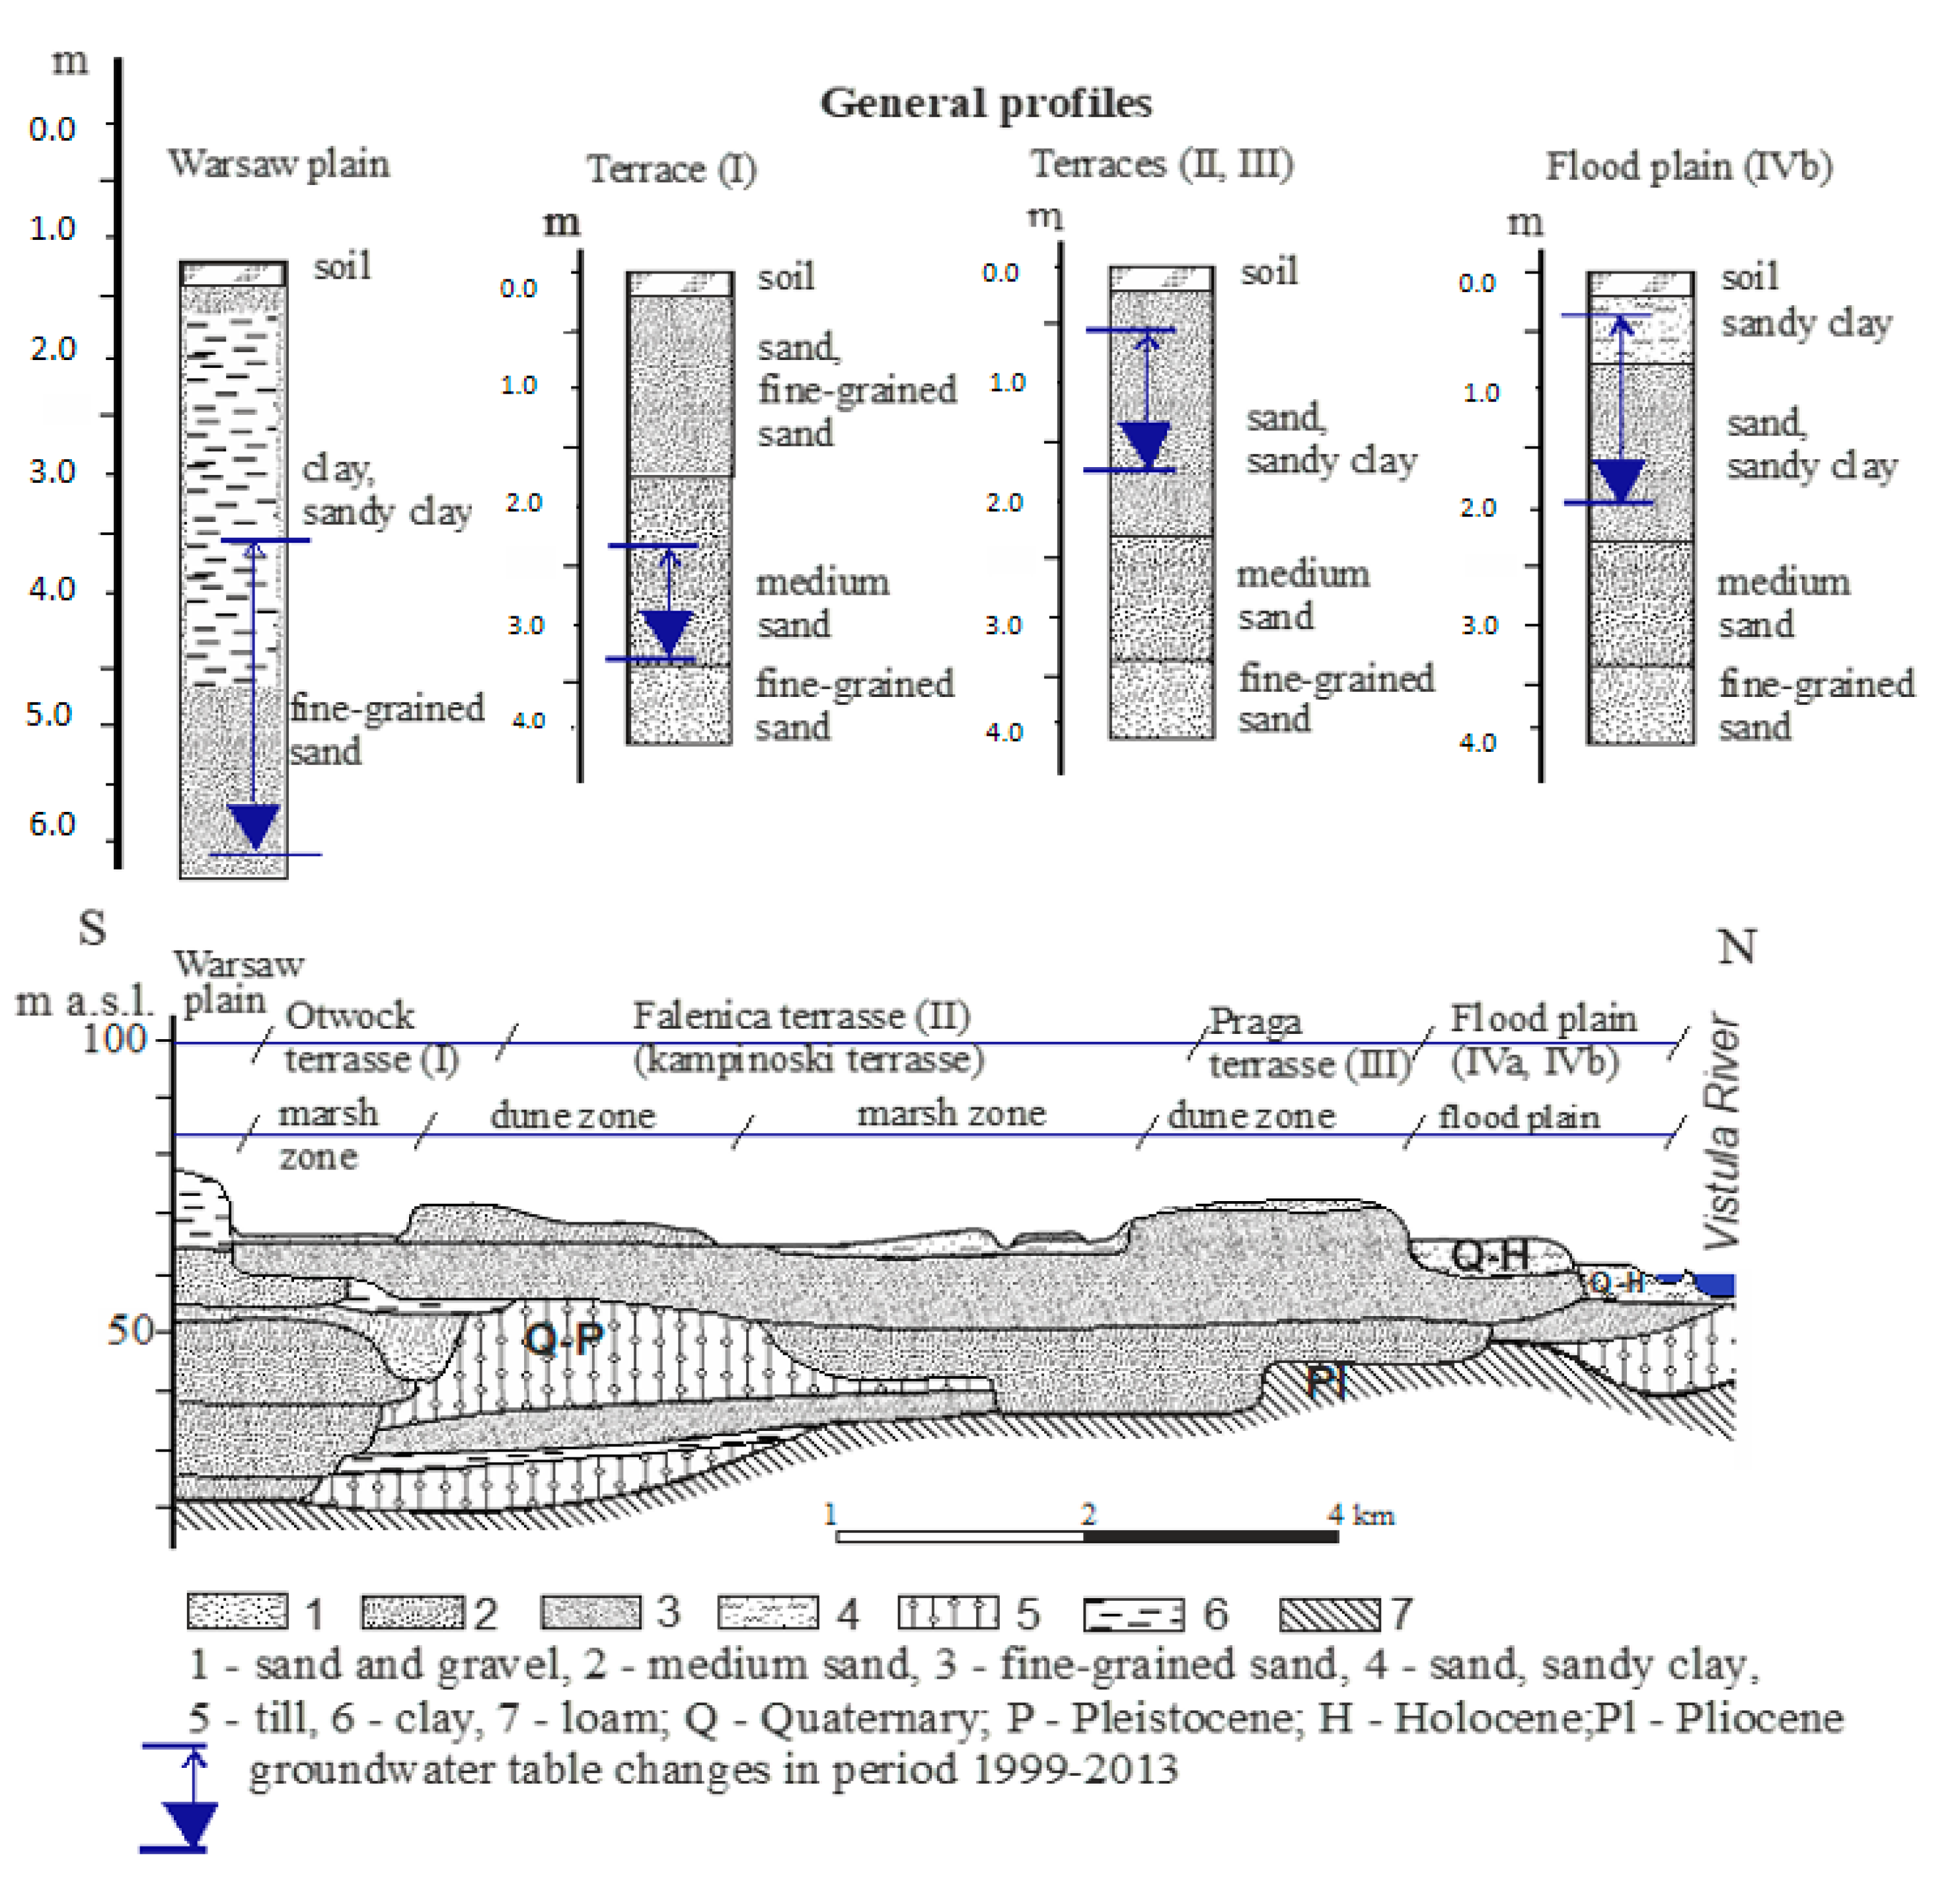
The groundwater table in the Quaternary deposits of the Vistula valley is unconfined and inclined towards the present-day Vistula River. The recharge of the aquifer occurs mainly through infiltration of precipitation water in the valley area. The lateral inflow from upland areas extending to the east, south and west is minimal [48]. The thickness of the aquifer varies from 9 to 45 m, and its bottom occurs at elevations from 2 to 54 m a.s.l. (Figure 2 and Figure 3). The groundwater resources available for development have been estimated at 31.075 m3/d, and 35.2% (0.49 L/s km2) of the resources are in use [36]. The Quaternary aquifer is underlain predominantly by Pliocene clays. The Paleogene–Neogene aquifer formation is represented by glauconite sands of Oligocene at a depth below 150 m.
The research area was included in the Main Groundwater Basin No. 222-Middle Vistula Valley [49], covering part of the Vistula valley, up to 15 km wide (Figure 1). MGBs are reservoirs established in Poland containing strategic groundwater resources, meeting specific quantitative and qualitative criteria, such as: the potential discharge rate of the well above 70 m3/h, well-field discharge rate above 10,000 m3/day, transmissivity above 10 m2/h and the water has to be suitable for supply purposes to the population in the raw state or after its possible simple treatment by substances of currently used and economically justified technologies.

3. Research Methods

3.1. Observation Period, Research Variants

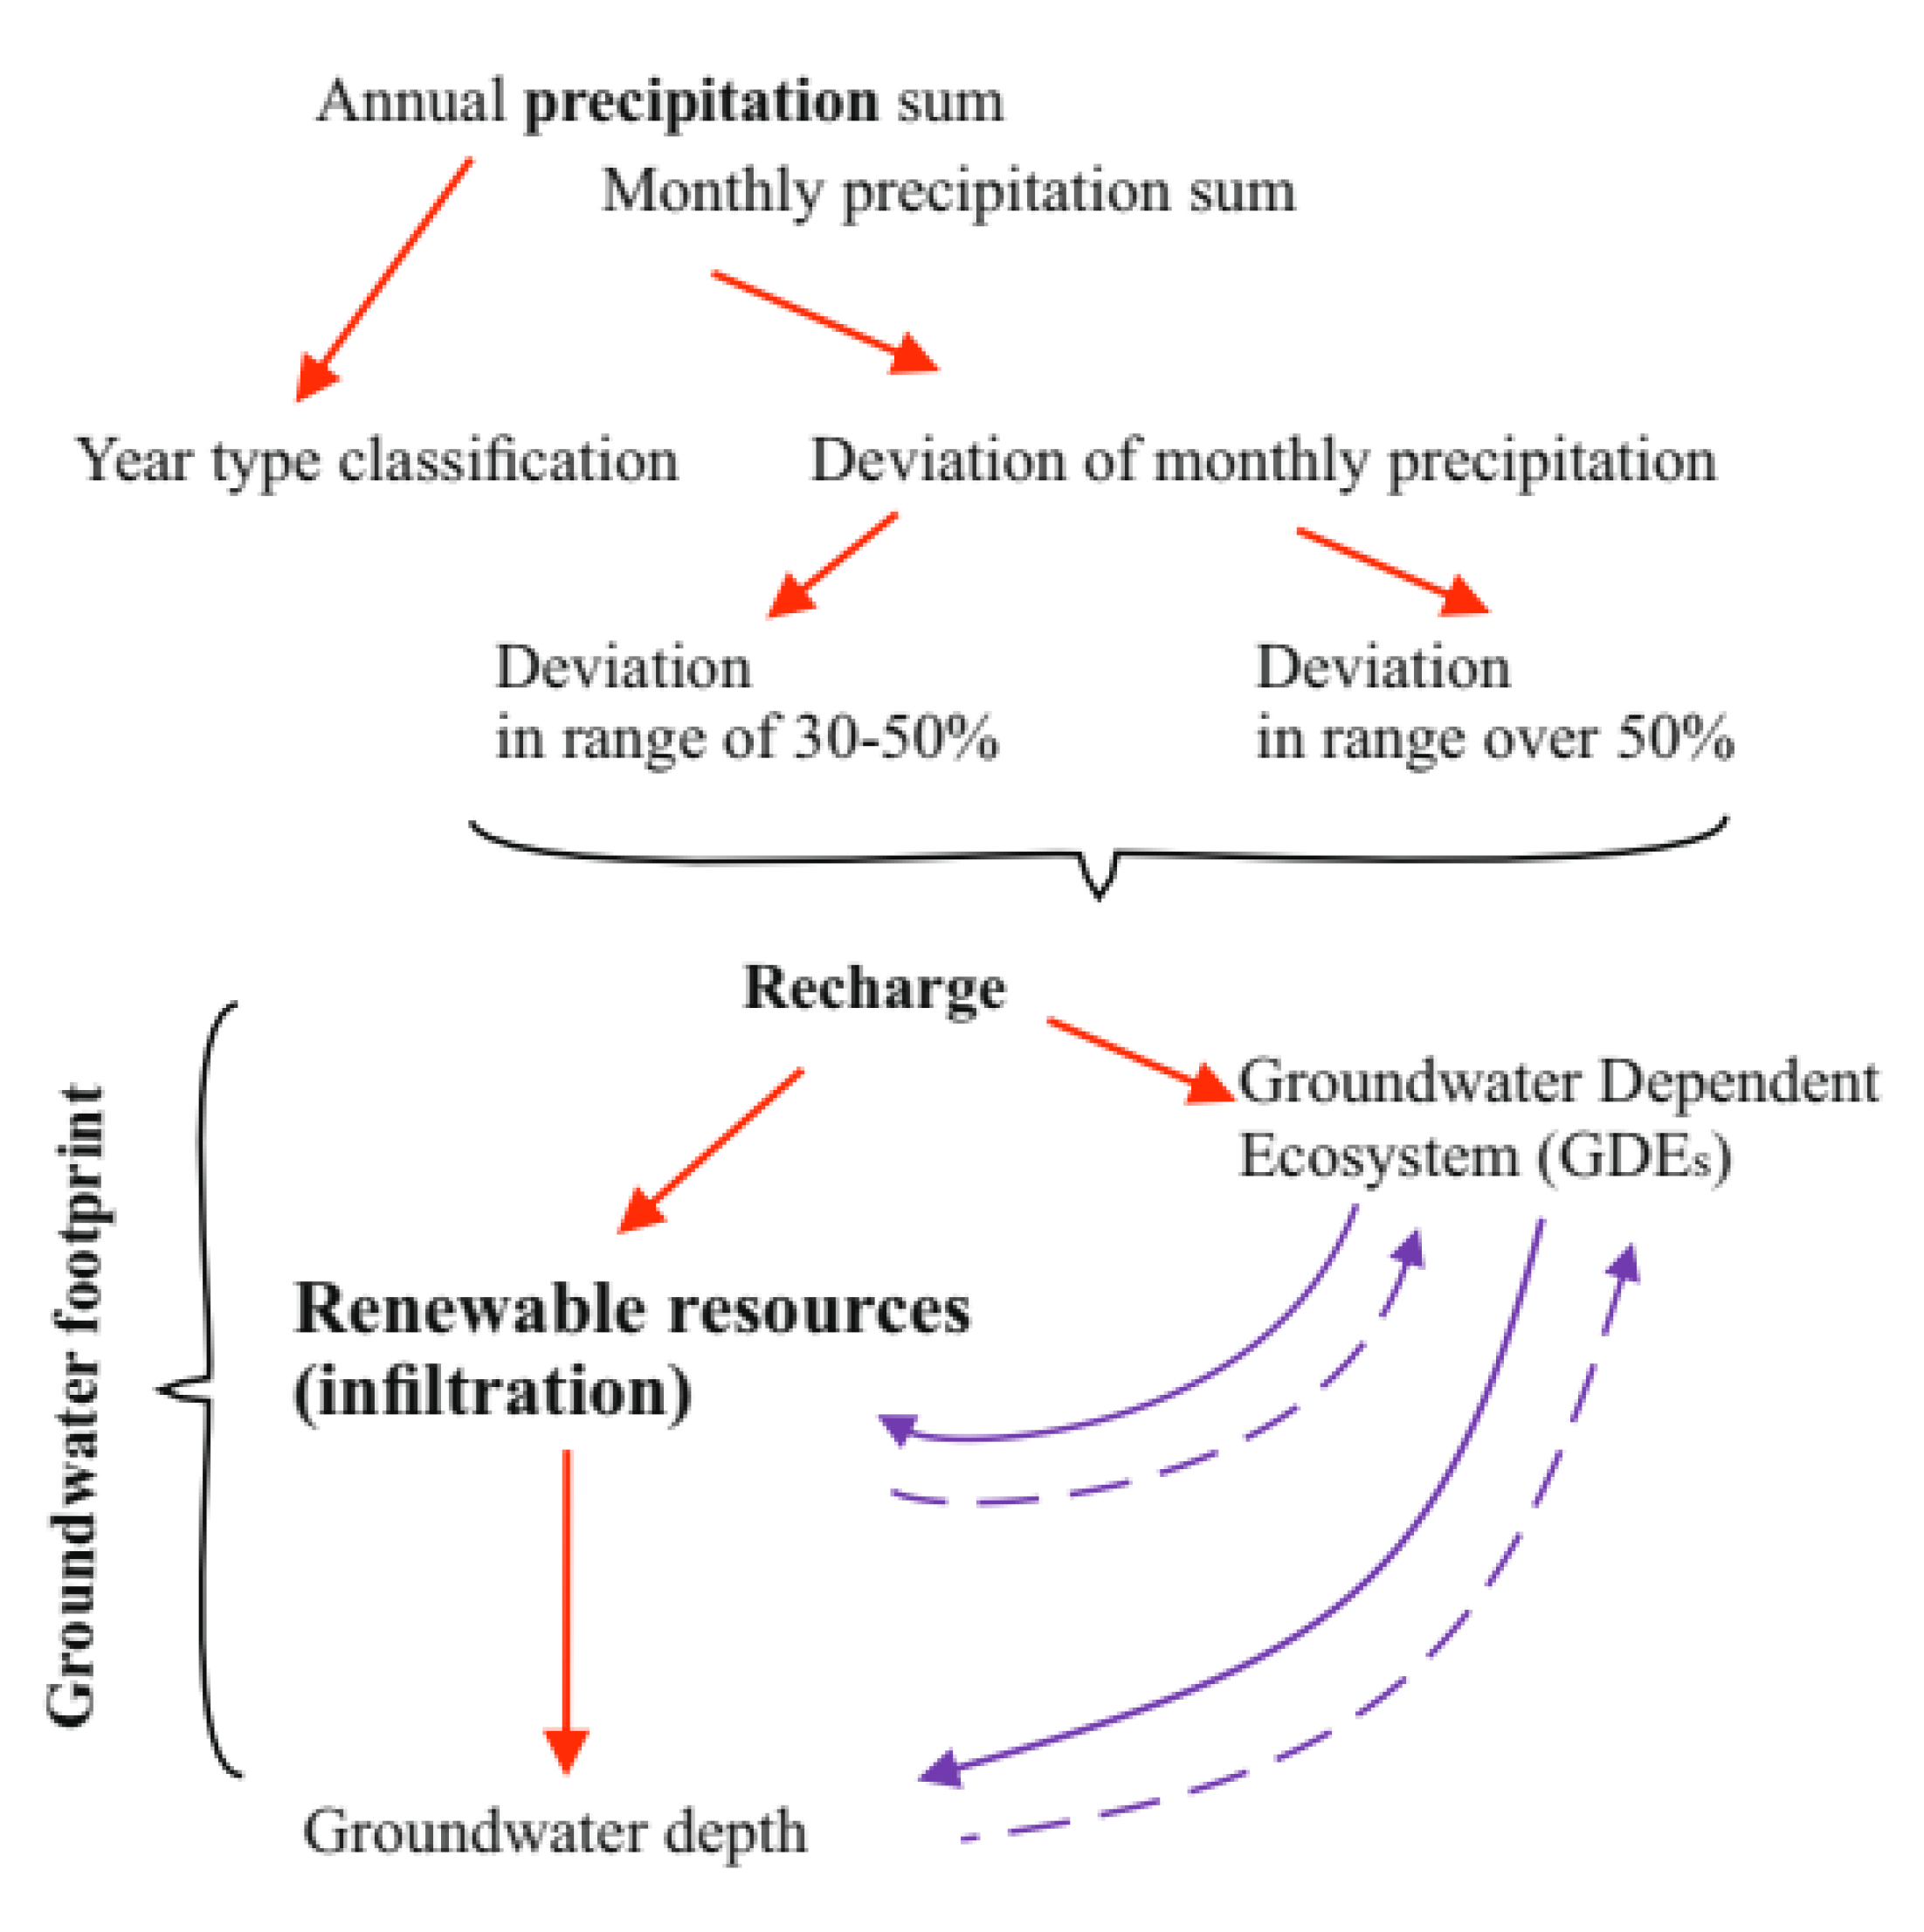
The quantitative assessment of the renewable groundwater resources can be identified with infiltration of recharge, so there is also a need to recognize the possibility of climate changes through the changes in a precipitation causing time-variable infiltration. Based on precipitation measurements in station located in the central part of the study area, the annual classification has been done in the reference to the average rainfall sum in 1999–2013 period [50]. The analysis concerning amount of deviation of monthly precipitation from average monthly precipitation sum also has been done (Figure 4). The amount of significant deviation of monthly precipitation in the range of 30–50% and over 50% was correlated with annual groundwater depth (GD) to define strength of this relationship (Table 1).
A general trend line for annual precipitation could not be found. Every two or three years, there has been noted an average type of year due to precipitation sum. There also have been registered two dry and very dry years, as well as three wet and one very wet year.
Precipitation analysis revealed the significant monthly deviation of precipitation and its amount per year. Deviation over 50% occurs with a frequency two to six times per year, while deviation in a range 30–50% occurs one to five times per year. The year 2009 was an exception, classified as normal with no significant deviation. In the time of 15 years of measurements, the largest deviations were positive values: 183% in 2006 and 171% in 2011, which can be interpreted as a short and intensive precipitation impulse, which usually does not transform into higher infiltration. Negative values reached −89% in 2000 and in 2011. There is a mosaic set in both cases, which means that precipitation changes and future infiltration changes cannot be predicted or forecast. Correlation of amount of deviation over 50% with annual groundwater depth is only notable in the presence of negative deviation (−0.36) and the direct correlation of annual precipitation sum with annual GD is very low (−0.19). Due to the lack of a clear relationship between precipitation and GD, it was decided to characterize renewable resource changes by analyzing groundwater levels and selecting extreme levels noted in1999–2013 period.
Groundwater and surface water levels were measured in the groundwater and surface water monitoring network. The analysis is based on observations from the years 1999–2013, conducted in 56 piezometers and 21 water gauges (Figure 1). Basic statistical parameters, such as average, maximum, minimum, standard deviation, 1st and 3rd quartile and amplitude have been determined on a seasonal, annual and long-term basis. The statistics obtained at each monitoring point were transposed onto the entire study area using a geostatistical analysis, in this case: an ordinary kriging tool [48]. Seasonal groundwater level changes occurred in a similar way at all observation points throughout the 1999–2013 period, and also during the growing season, when the increasing GD is the dominant trend.
Over the period of 1999–2013, the highest groundwater levels were recorded in 2011 at all observation points. At 12 of them, the levels periodically rose above the ground surface; at 3 points, it lasted 42 to 56 weeks [40]. In relation to precipitation, groundwater level in 2011 appeared to be the result of the cumulative impact of the positive deviations of precipitation in 2010 (very wet year) and 2011 (average year).
The analysis made it possible to indicate the periods of risk and occurrence of hydrogeological drought [47]. The risk of hydrogeological drought was defined as a period in which the groundwater table level remained lower than the annual low average level (SNG). In shallow aquifers, drought risk periods are interrupted by recharge periods; therefore, drought periods are considered hydrogeological periods in which the groundwater table repeatedly and systematically drops below the SNG [51]. In the study area, the hydrogeological drought period was defined as the level lower or equal to half of the sum of annual low (NNG) and mean groundwater levels (GD ≤ 0.5 (SNG + NNG) [47]. During the period of 1999–2013, the lowest levels were reported in 2003, where there was no additional recharge period from October of 2002 until October of 2003 caused by anomalous, positive deviation of monthly precipitation.
The analysis of groundwater levels allowed for variant calculations of renewable groundwater resources in the valley and in the identified geomorphological units. The calculations of renewable resources were done for three variants that refer to average and extreme values of groundwater level in relation to possible climate changes understood as time-variable precipitation. The following variants were considered:
  • variant 1-steady state level, defined as the mean annual hydrodynamic state for the 1999–2013;
  • variant 2-the highest groundwater levels in the period 1999–2013;
  • variant 3-the lowest groundwater levels in the period 1999–2013.

3.2. Model Studies

Model tests were done using Visual ModFLOW 4.2 and applied to determine renewable groundwater resources [52,53]. The steady state modelling made it possible to quantify the groundwater balance in a hydrogeological unit. Renewable groundwater resources (infiltration recharge) were calculated with reference to groundwater balance of the analyzed hydrogeological system from the groundwater flow model. Despite the fact that the Visual ModFLOW package is called evapotranspiration, this value actually applies to evaporation from shallow groundwater table and it is significantly lower than total evapotranspiration understood as a whole of processes that deplete groundwater resources. The values of evaporation from groundwater table are hard to measure directly, so the final values of this process were estimated during model calibration.
The study area was discretized by assuming a space discretization step of 0.01 km2 (100 × 100 m). The step value corresponds to the detail level of the hydrogeological and geological knowledge of the area. The step also enables reliable mapping of geomorphological units in the study area.
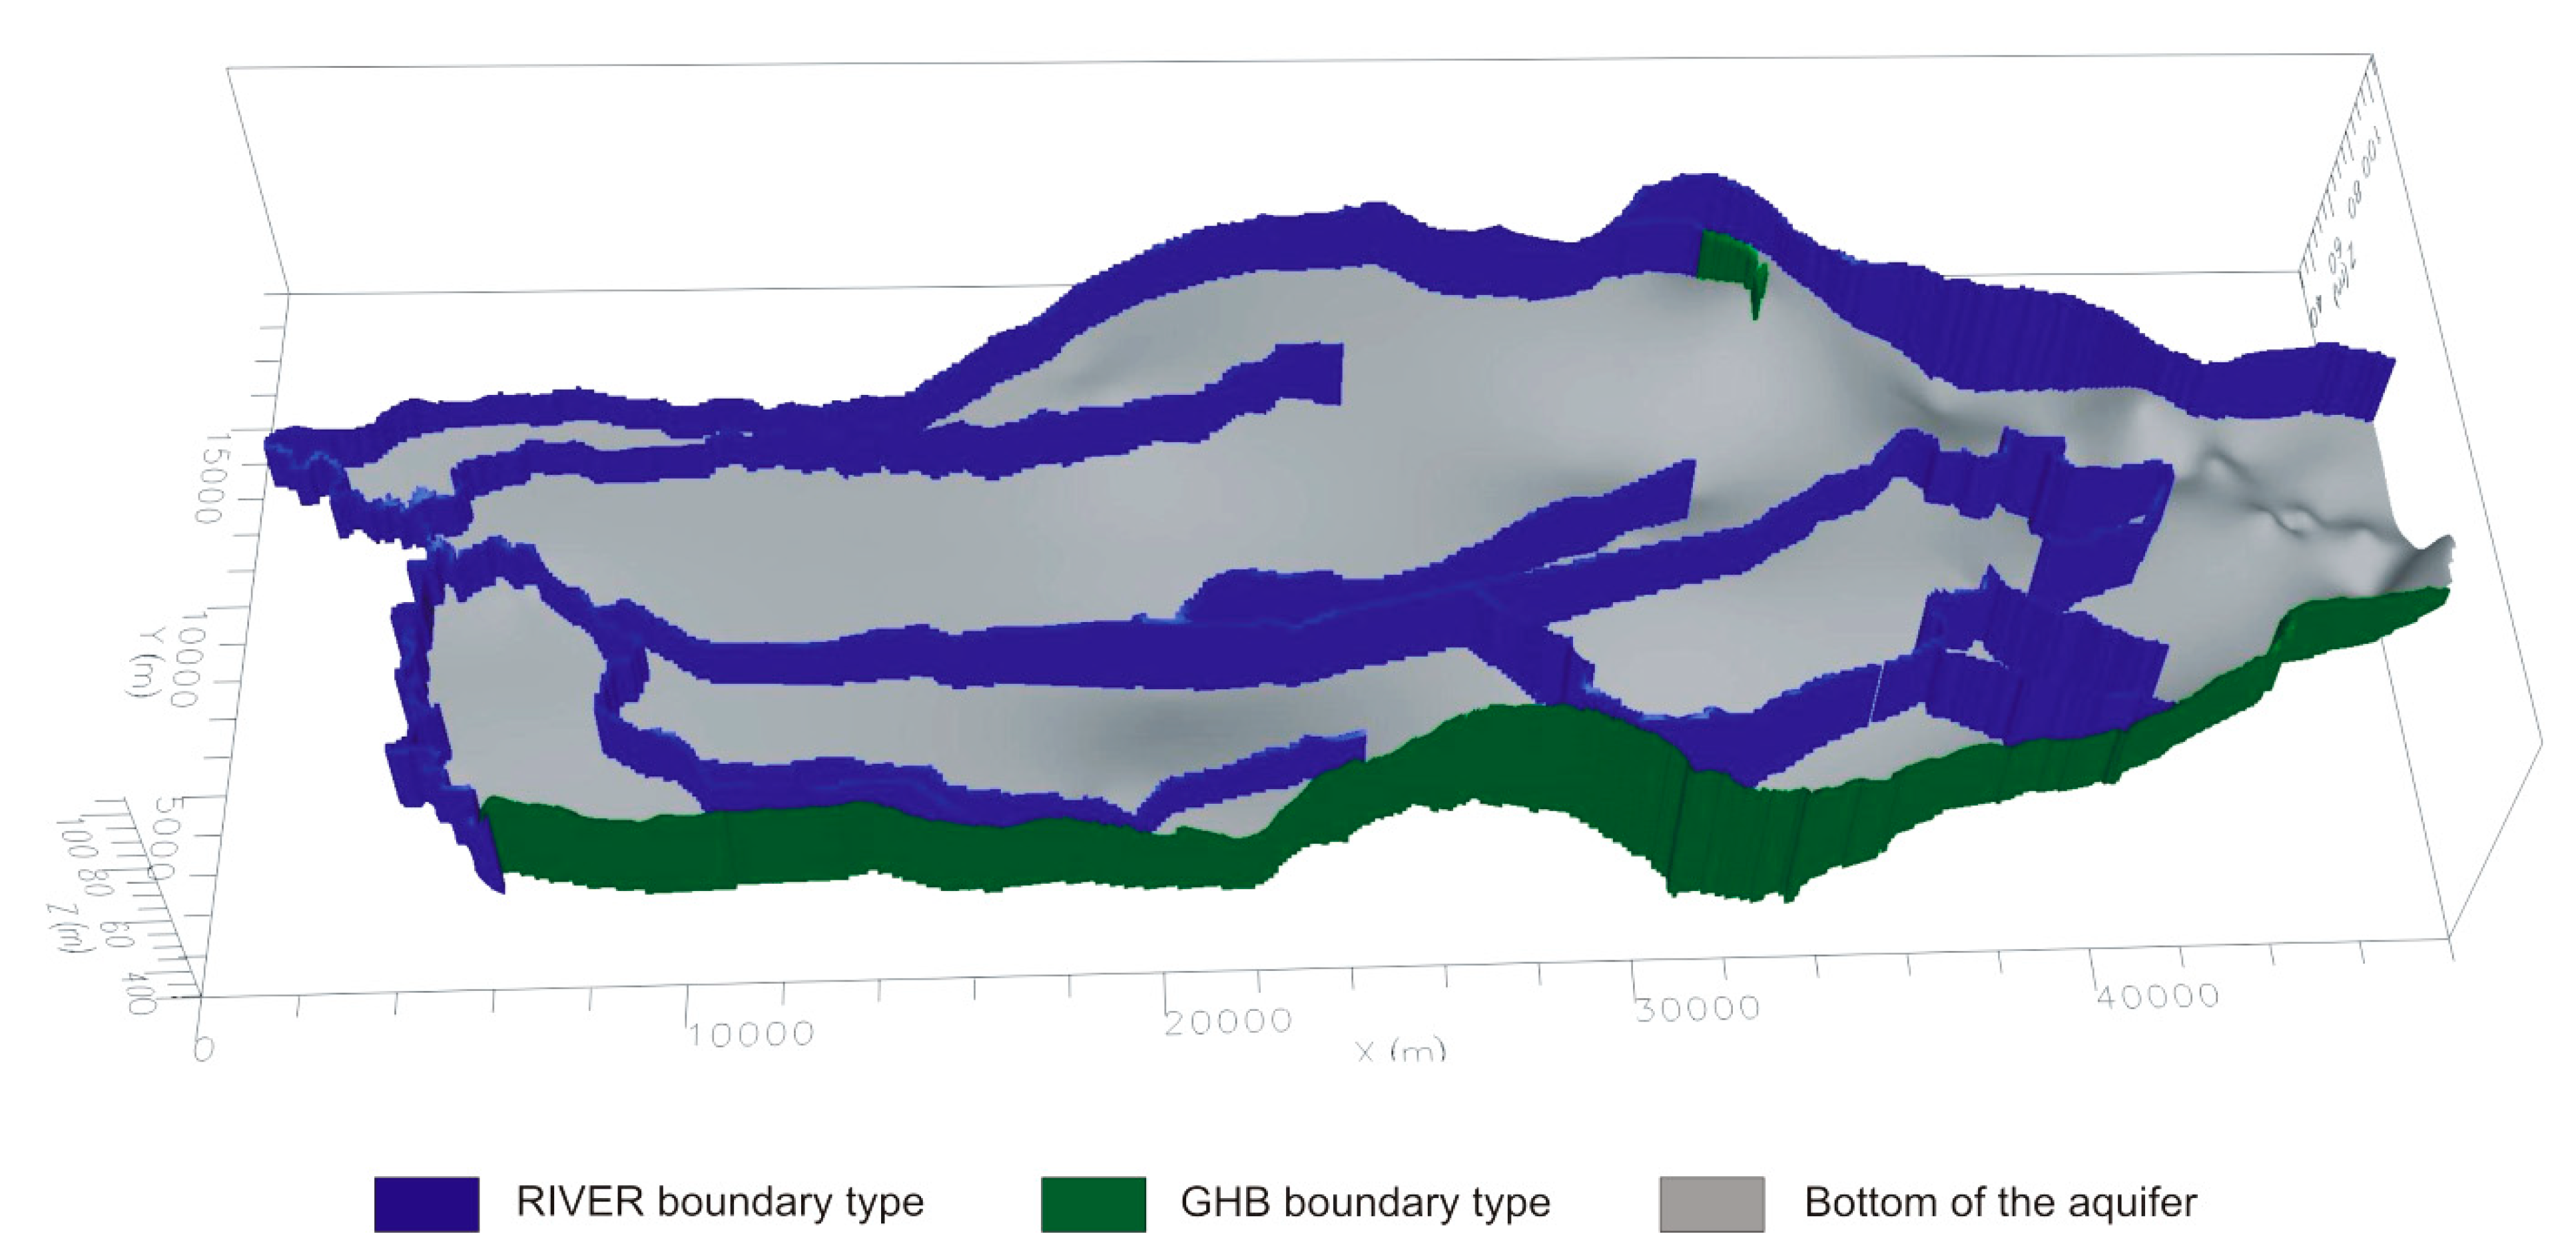
The model boundaries are the major rivers, which are natural hydrodynamic limits of hydrogeological units: the Vistula River in the north and the Bzura River in the west. In the south, the boundary is the edge of the Vistula valley. The eastern boundary of the model runs along the administrative borders of Warsaw. The lower boundary of the model is the top of poorly permeable Pliocene clays, occurring at depths of 30–50 m. The relationship between the aquifer formation and the environment was mapped using boundary conditions: river-type for the Vistula, Bzura and other smaller watercourses within the Vistula valley; general head boundary (GHB)-type along the erosional edge of the Vistula valley (Figure 5).
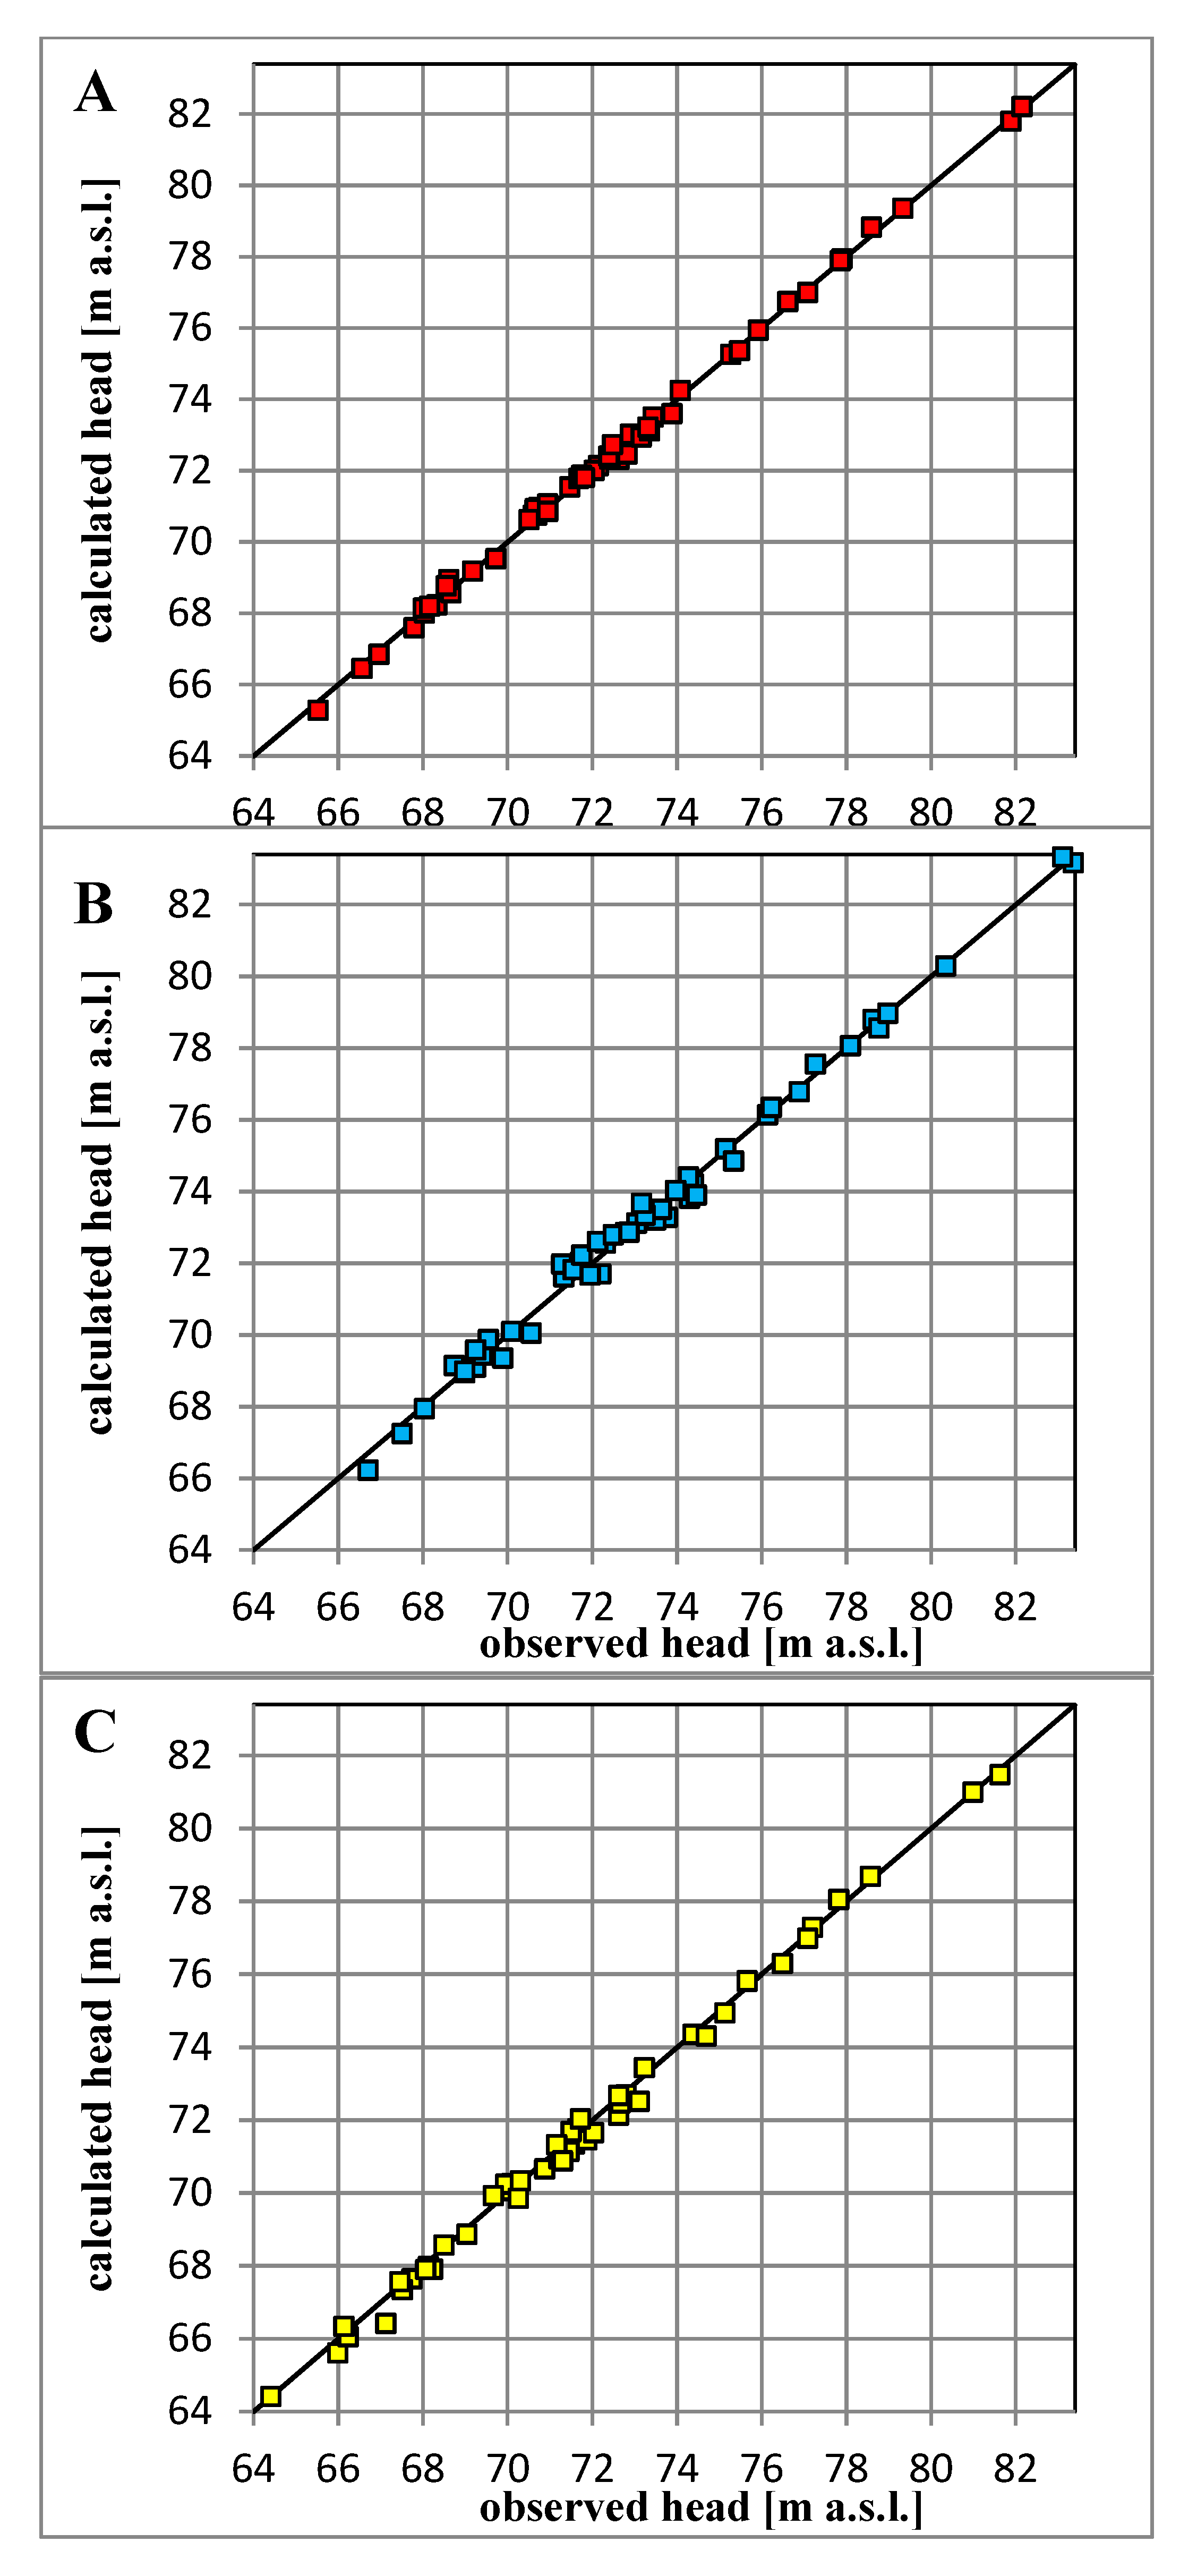
Model calibration and error analysis were calculated based on the correlation of observed and calculated heads in 56 monitoring points. The calibration was performed for all variants of the hydrodynamic state of the aquifer formation: for the average level in the period of 1999–2013–variant 1, the highest level–variant 2 and the lowest level-variant 3 (Figure 6).
The obtained parameters for all variants were as follows: standard error of the estimate 0.023–0.044 m; root mean squared 0.158–0.308 m; normalized RMS 0.953–1.849% (Table 2). After the calibration and verification process, the renewable resources were calculated based on recharge computed by program as a component of the groundwater balance (zone budget tool), referring to the unit area (1 square kilometer).

4. Results

4.1. Groundwater Depth (GD)

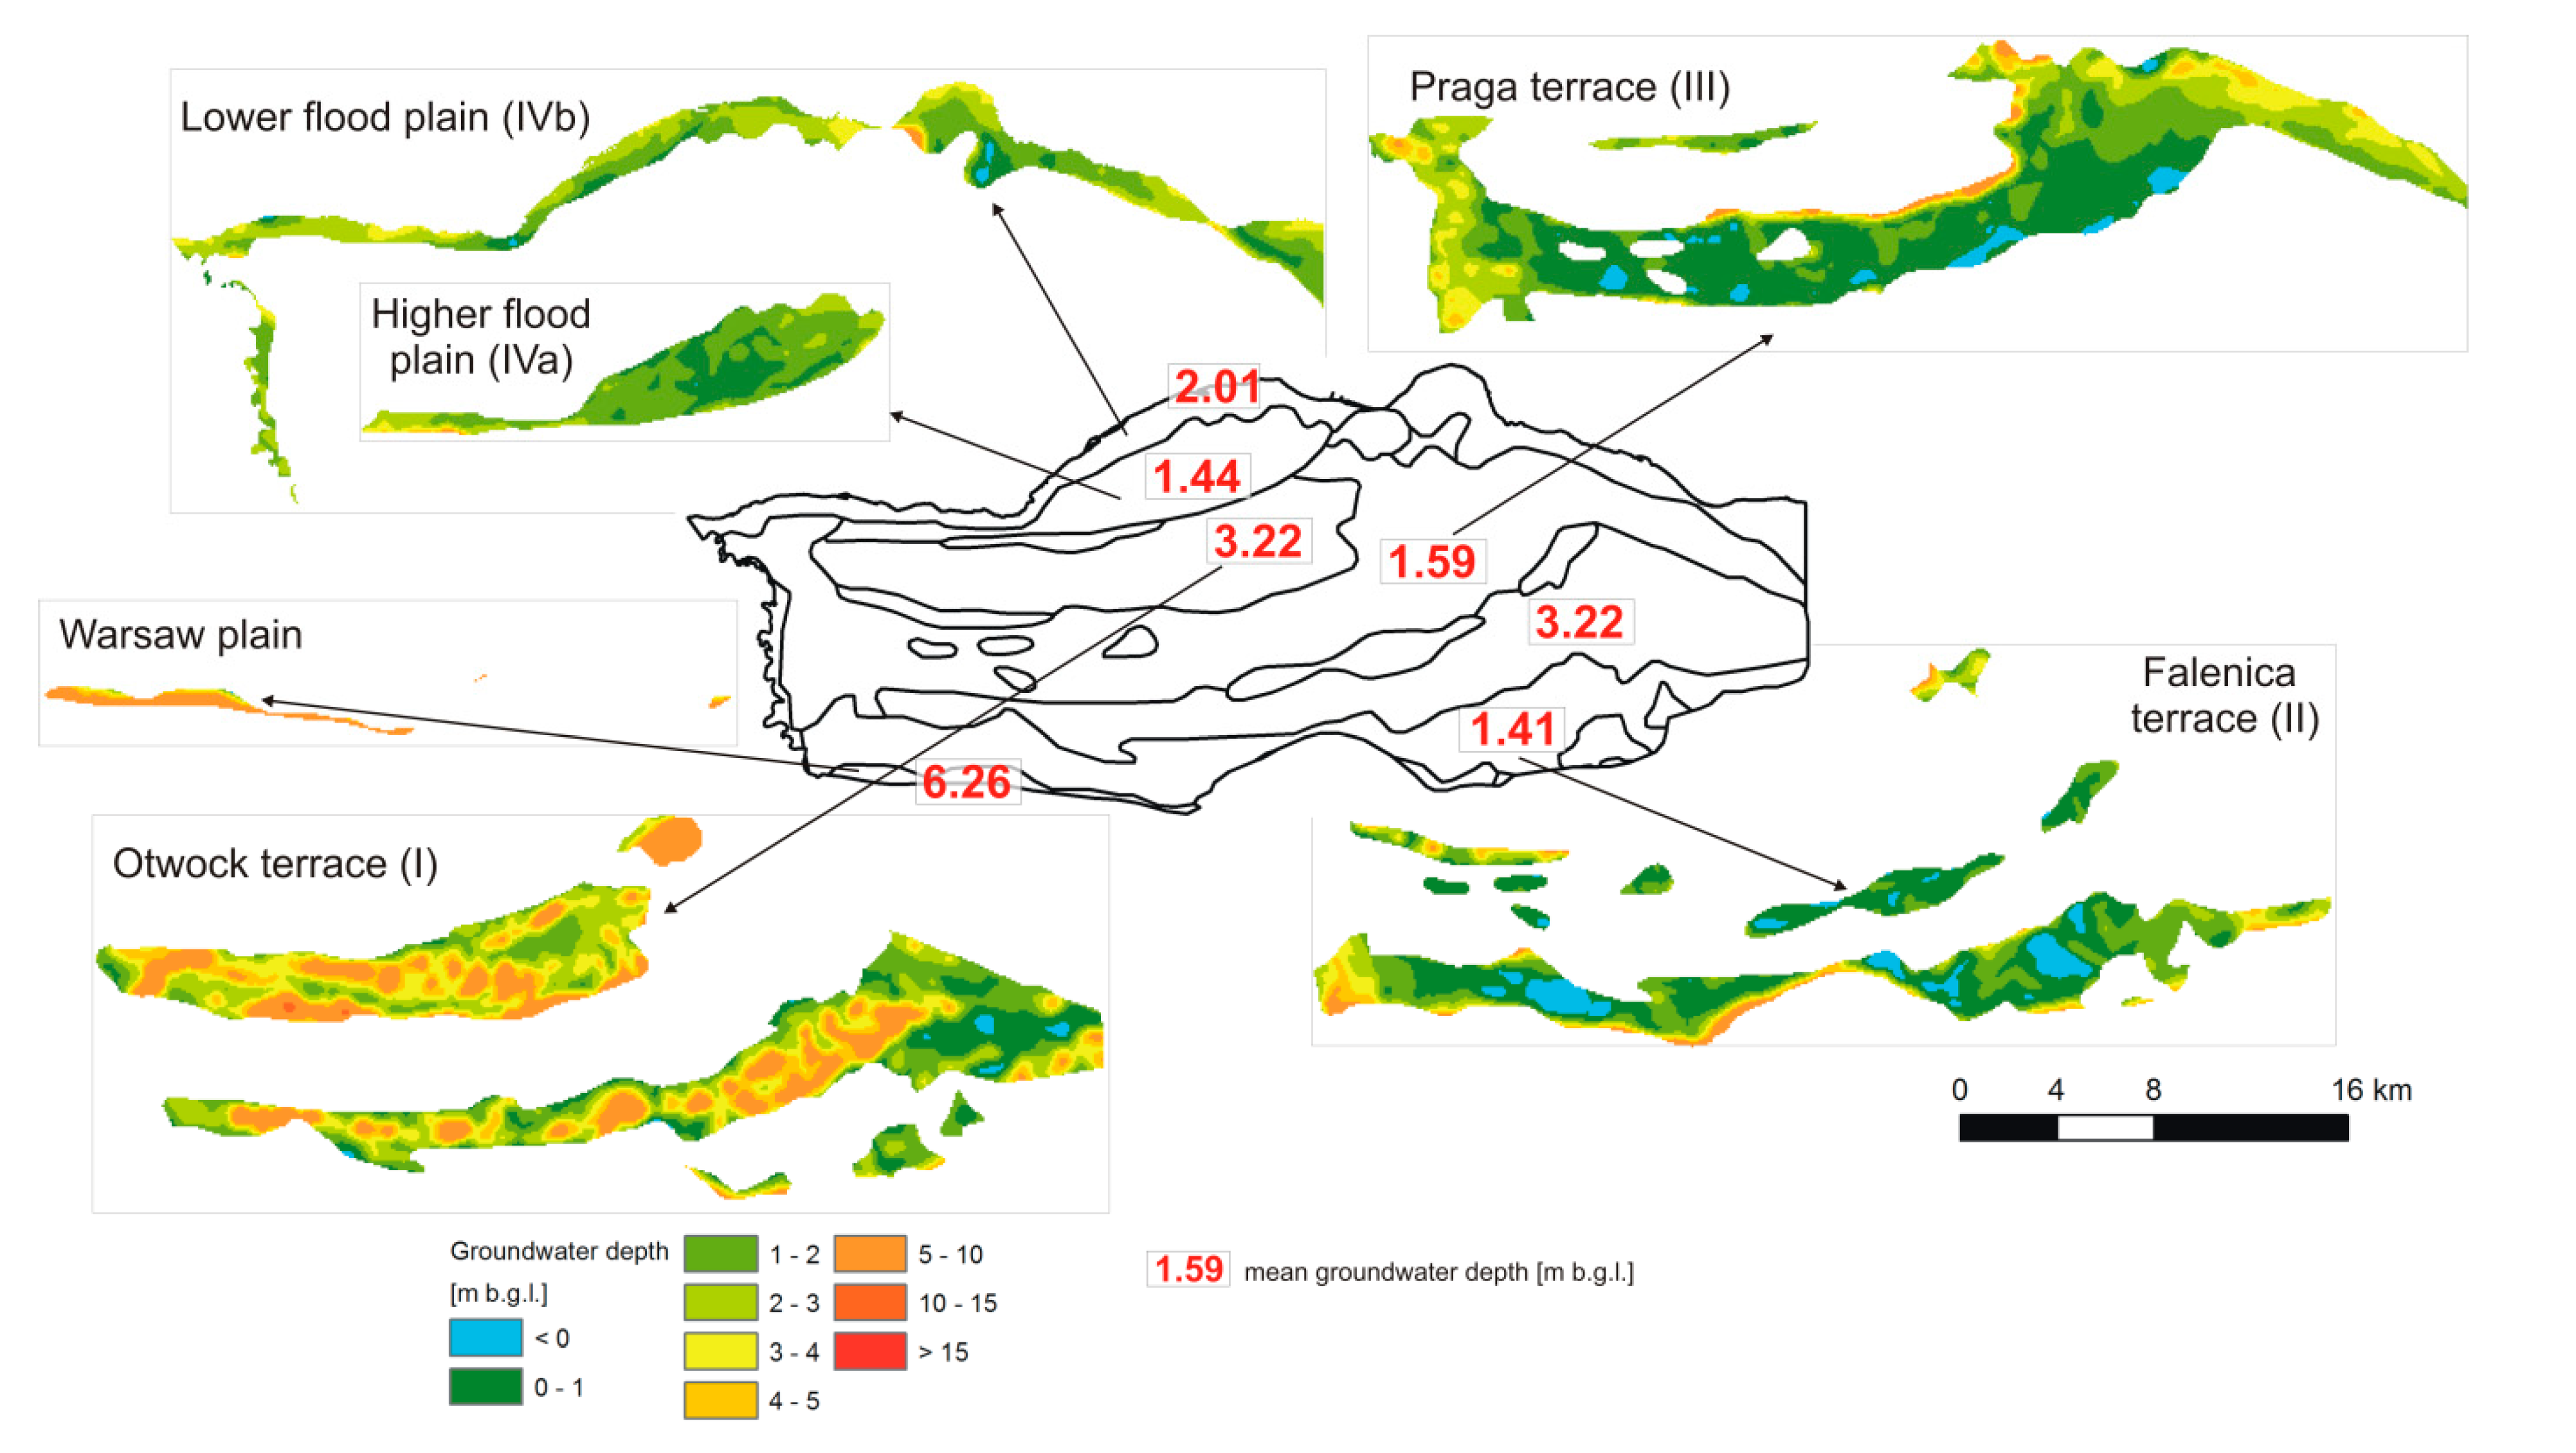
The model studies provided data on the average depths to groundwater throughout the study area and in the individual geomorphological units. The average depths to the groundwater table in the Vistula valley area in the years 1999–2013 varied from 1.41 to 6.26 m b.g.l (below ground level) in different parts of the valley (Table 3).
The shallowest groundwater level, ranging from 1.41 to 1.59 m b.g.l, was recorded in the Falenica (II) and Praga (III) terraces, classified as GDE areas (Table 3; Figure 7 and Figure 8). In the uppermost terrace (I), the groundwater table was at the greatest depth attaining the average of 3.22 m b.g.l. In the lowest part of the valley, in the floodplain (IVb), the GD was at the average of 2.01 m b.g.l.
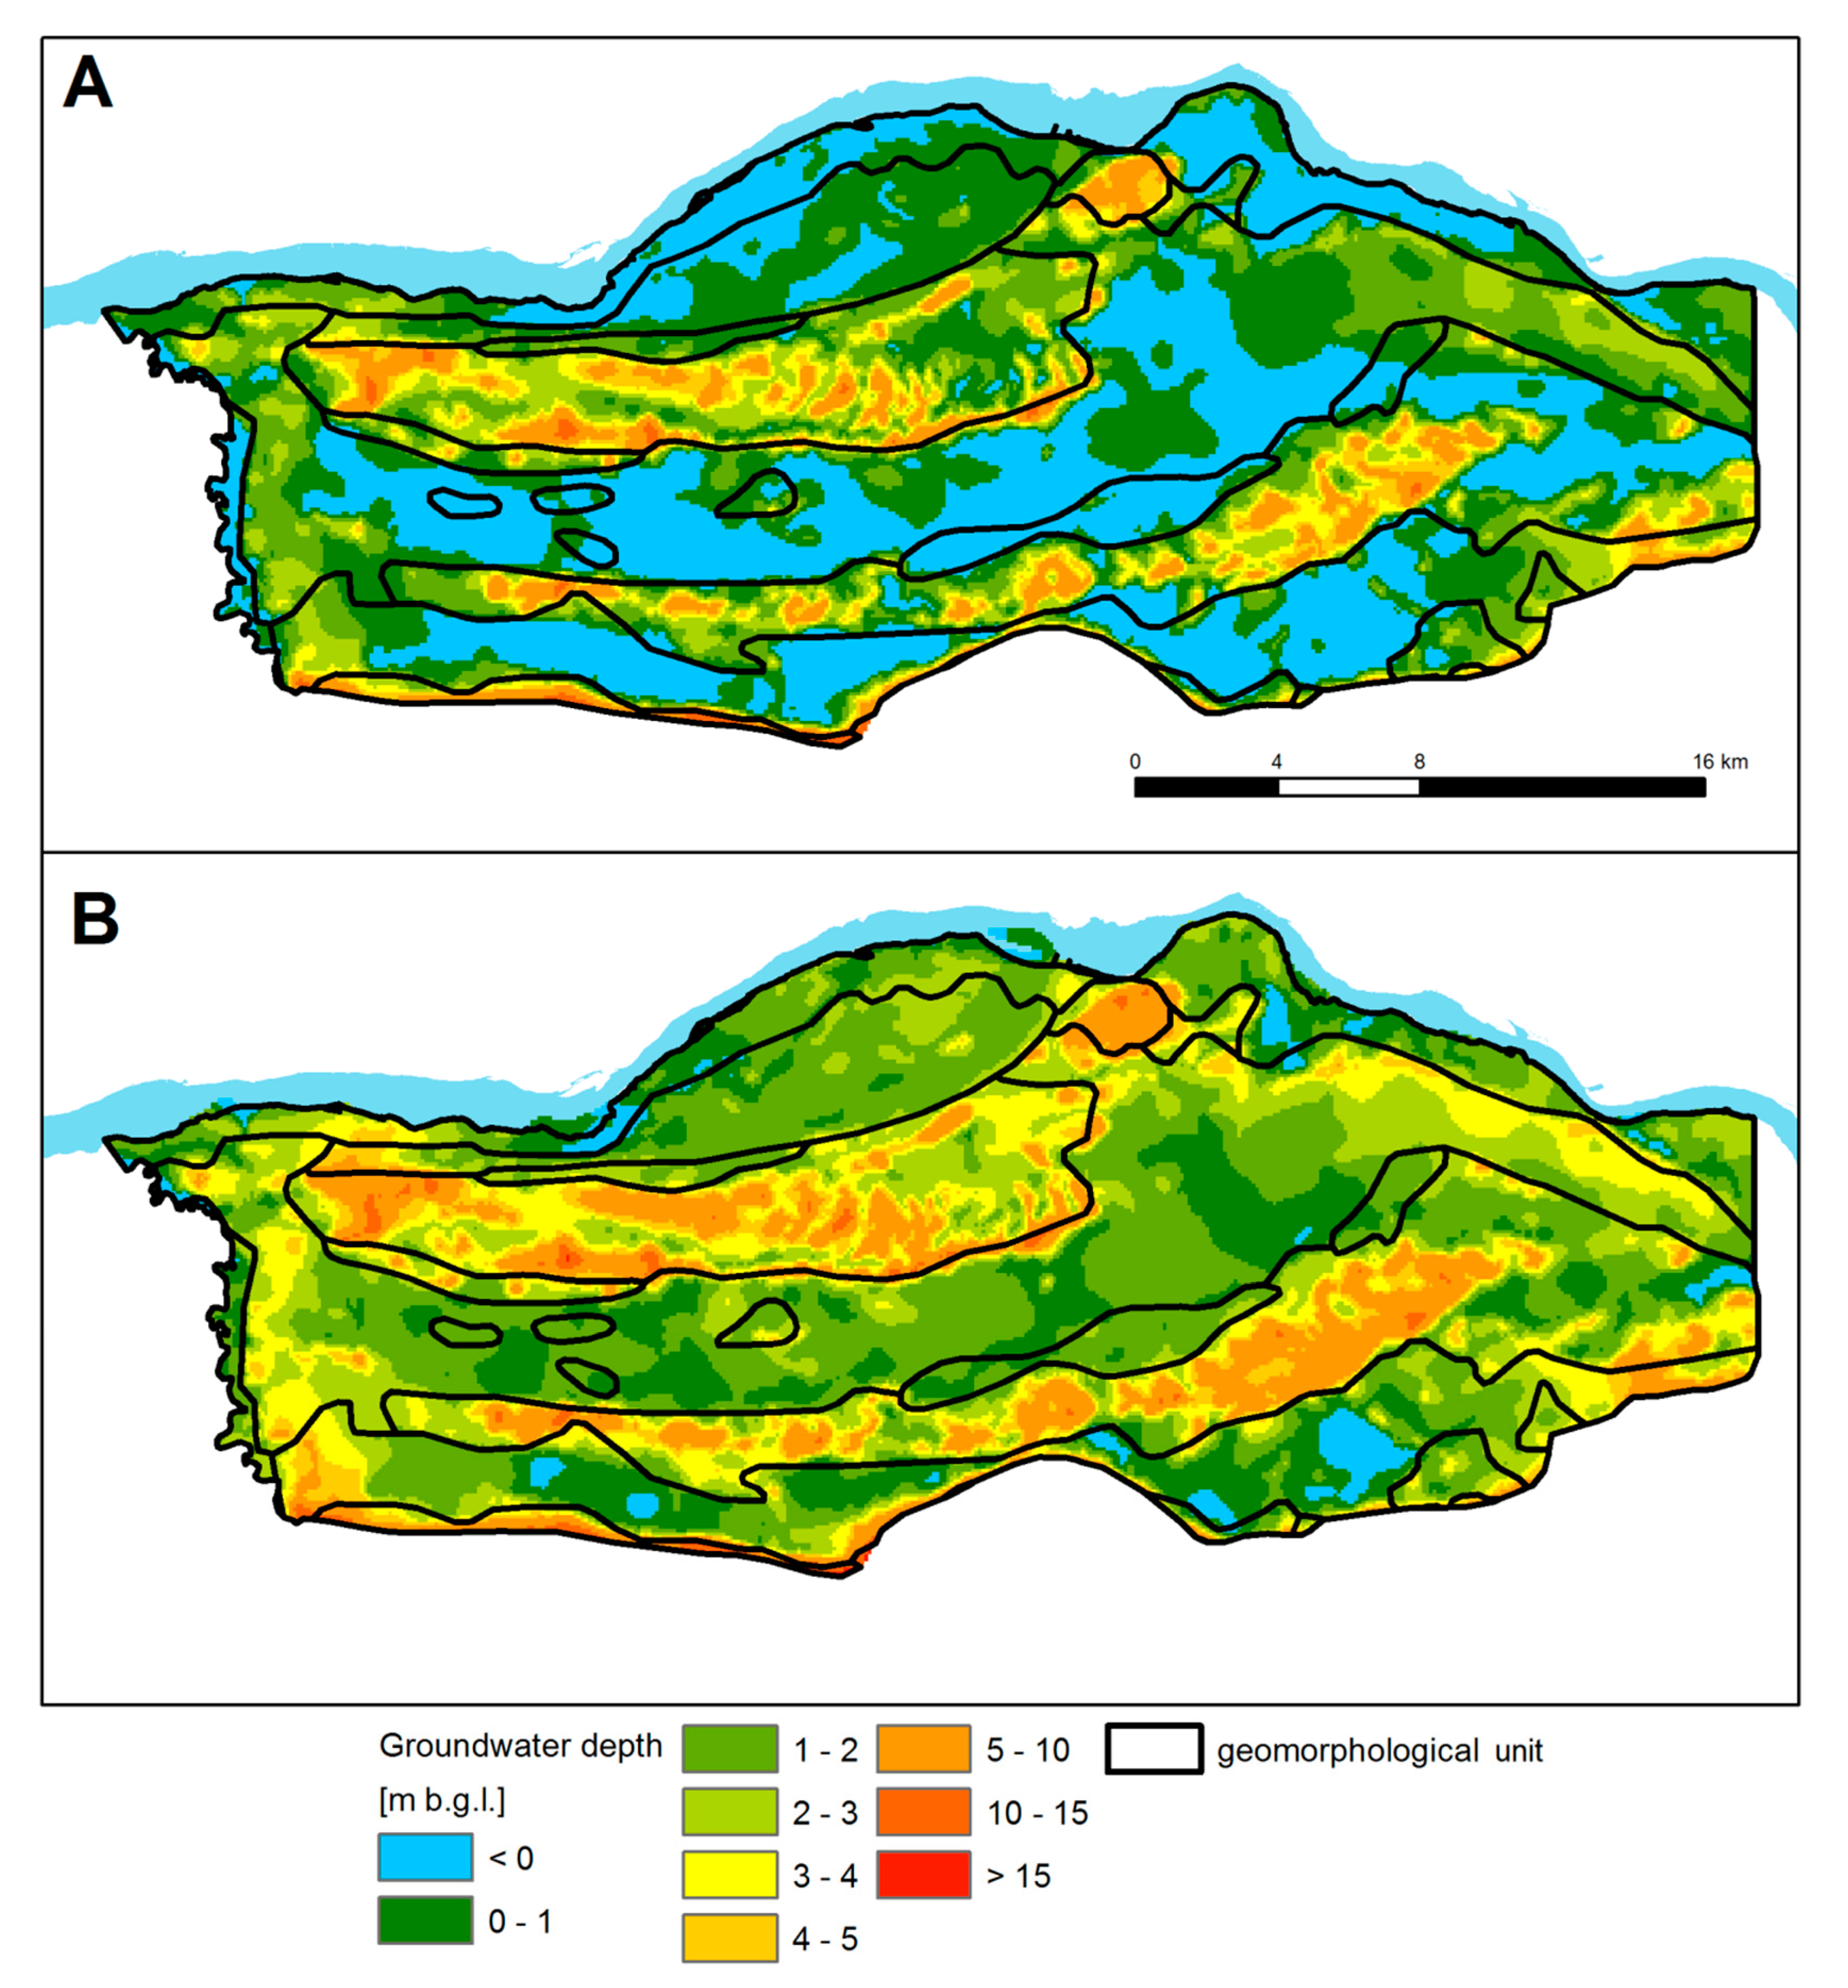
The GD also has been changed over time. The variations in depth for the individual variants are significant. During high levels (variant 2), the level rose in the valley by an average of 0.99 m compared to the average value in variant 1. In all the geomorphological units, the groundwater table was at a shallower depth ranging from 0.8 m (I) to 2.01 (IVb), except in the Warsaw Plain. In variant 3 of the lowest groundwater levels, identified with the period of possible hydrogeological drought, the depth of groundwater table was 0.43 m lower than an average depth. In all geomorphological units of the valley, the groundwater table was deeper compared to the mean values, i.e., at depths ranging from 0.36 (IVa) to 1.23 m (I) (Figure 7).

4.2. Renewable Groundwater Resources

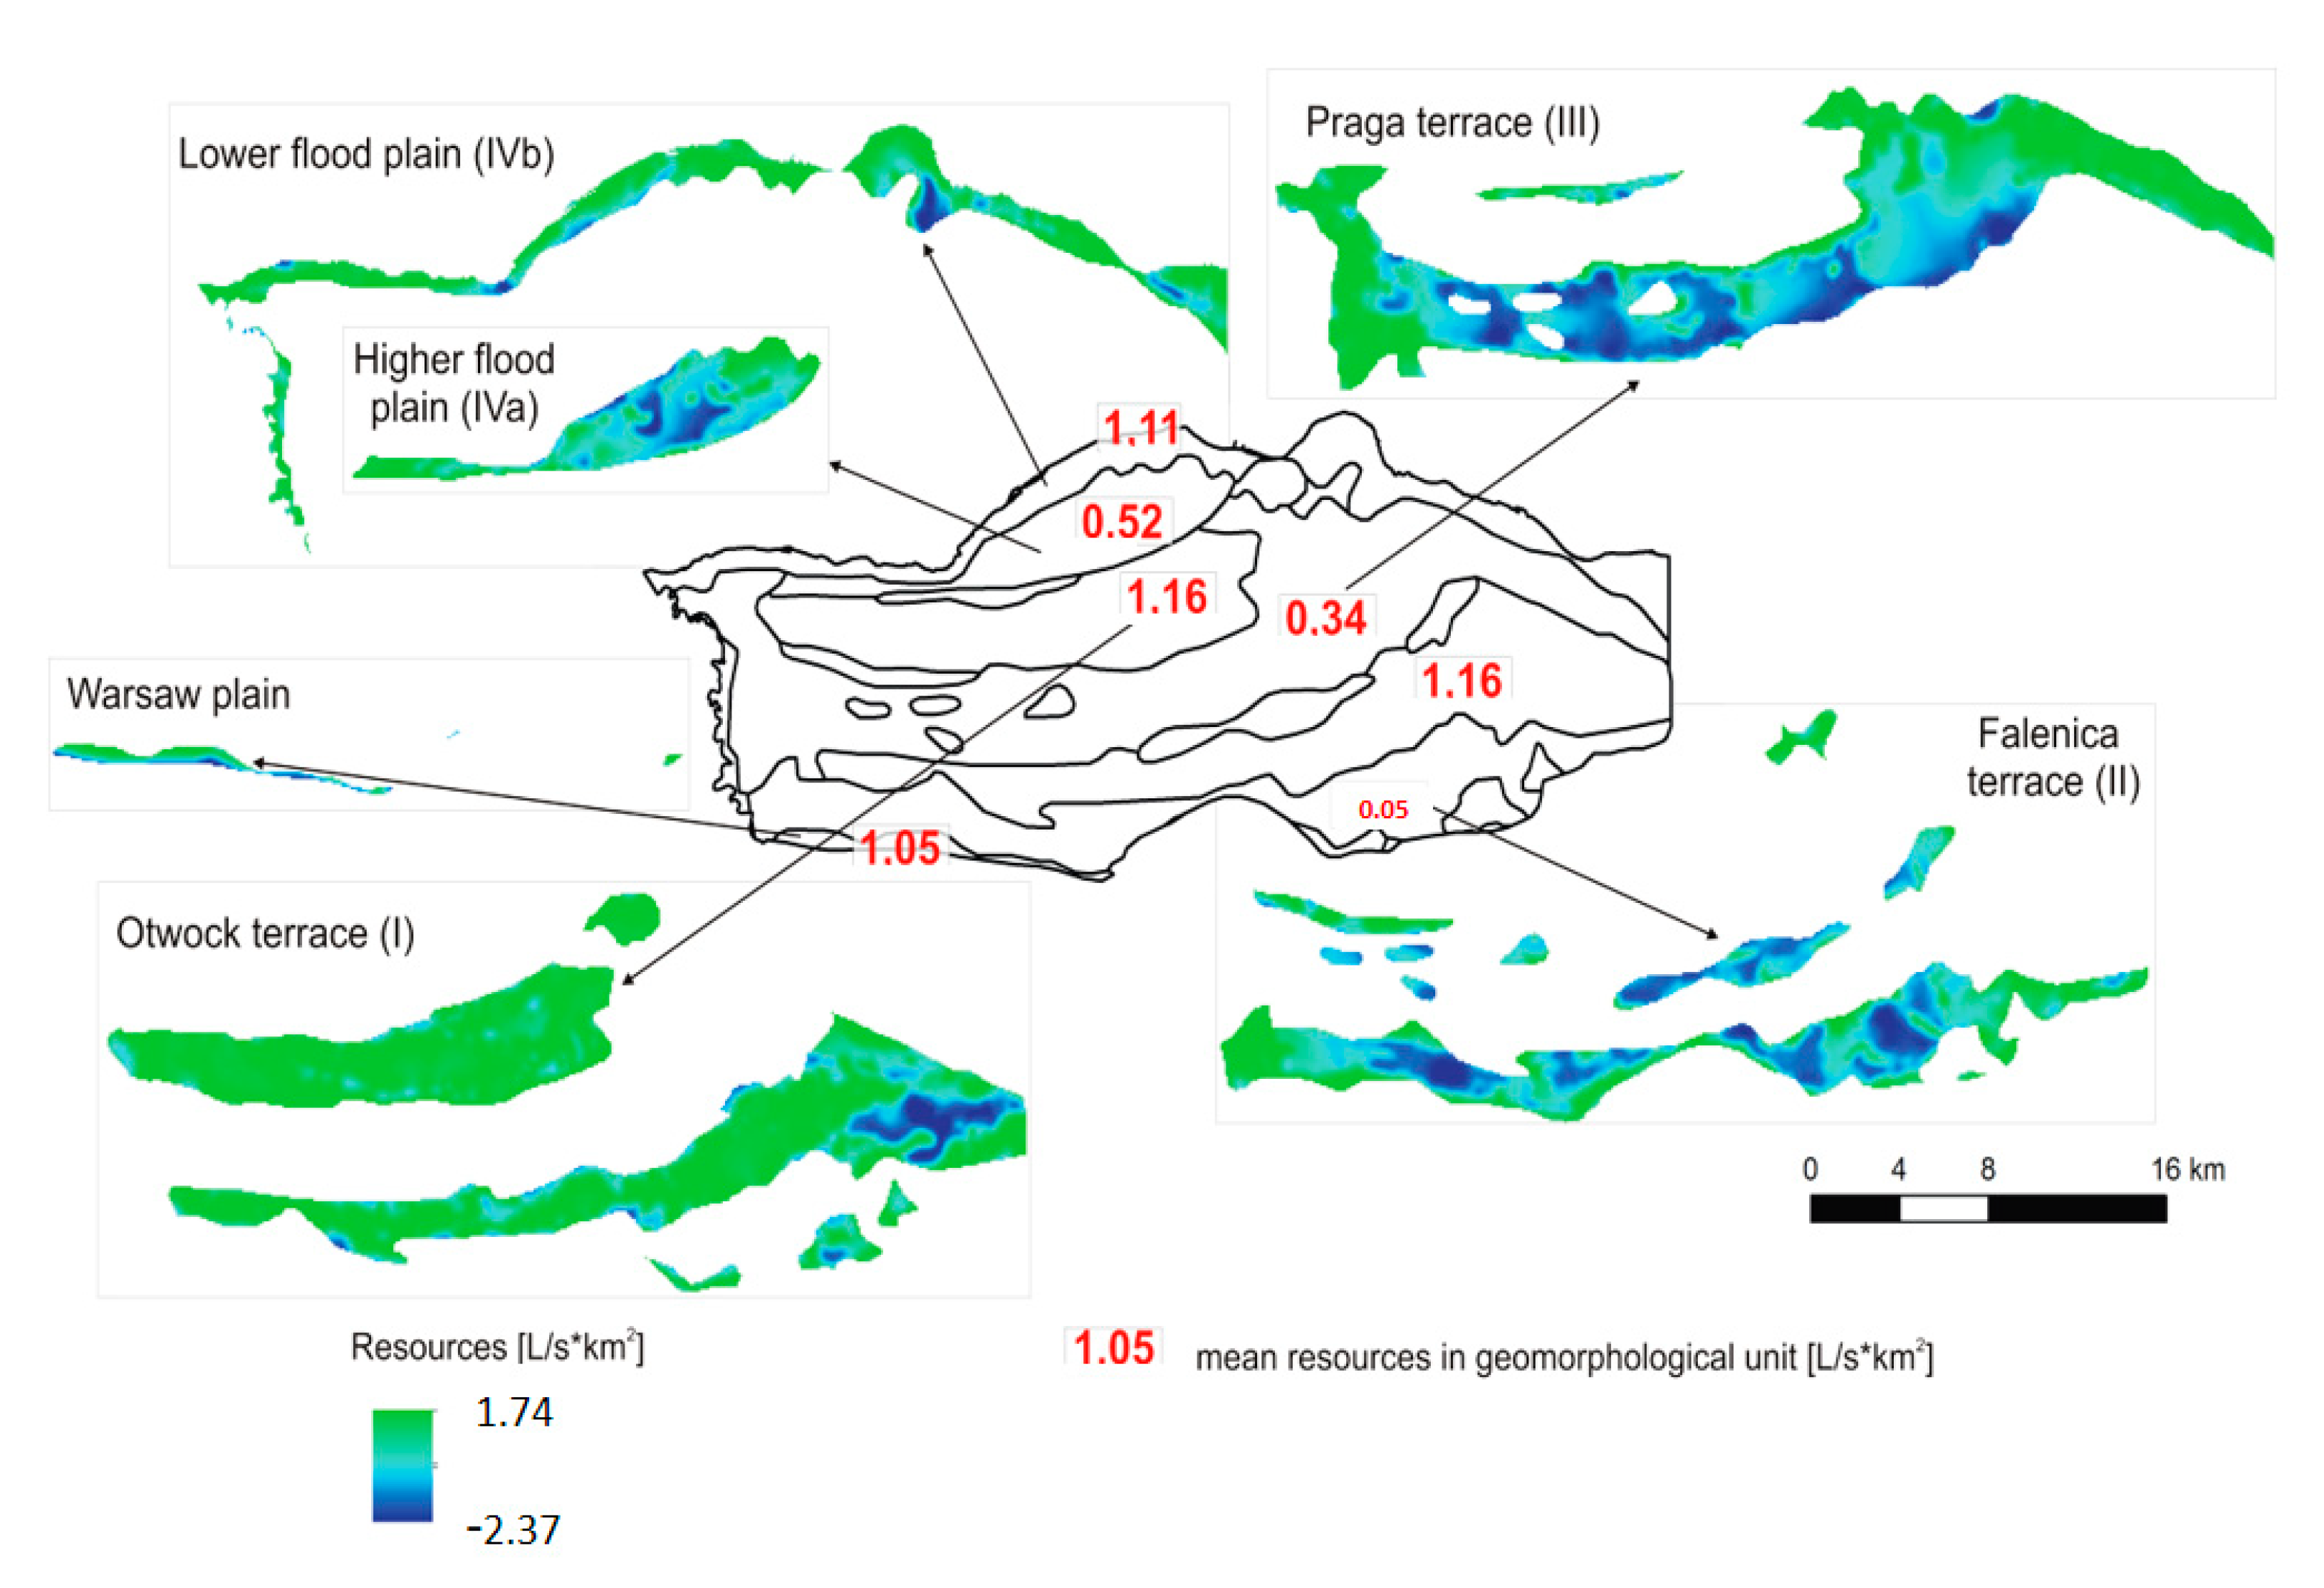
The modelling research was conducted to determine the infiltration recharge as renewable resources in all calculation variants. For the average groundwater state (variant 1), the volume of renewable resources was 0.65 L/s km2. Worth noting are the variable amounts of renewable resources within the geomorphological units (Table 4). The highest average value, 1.16 L/s km2, was found in the Otwock Terrace (I), while the lowest one was 0.05 L/s km2, in the Falenica Terrace (II) (Figure 9). The volume of the resources is spatially variable, both between the identified geomorphological units and within them. The lowest resources had negative values of −2.37 L/s km2, while the highest ones were 1.74 L/s km2. Negative values are indicative of evaporation. Values above 1.0 L/s km2 were achieved in the Otwock Terrace (I), in the Warsaw Plain and in the lower floodplain (IVb) whose surface has been raised and significantly transformed because of the construction of embankments and levees. The calculations conducted for a hydrogeological drought period (variant 3) and a highest level (variant 2) indicate much lower renewability during periods of extreme levels (Table 4).
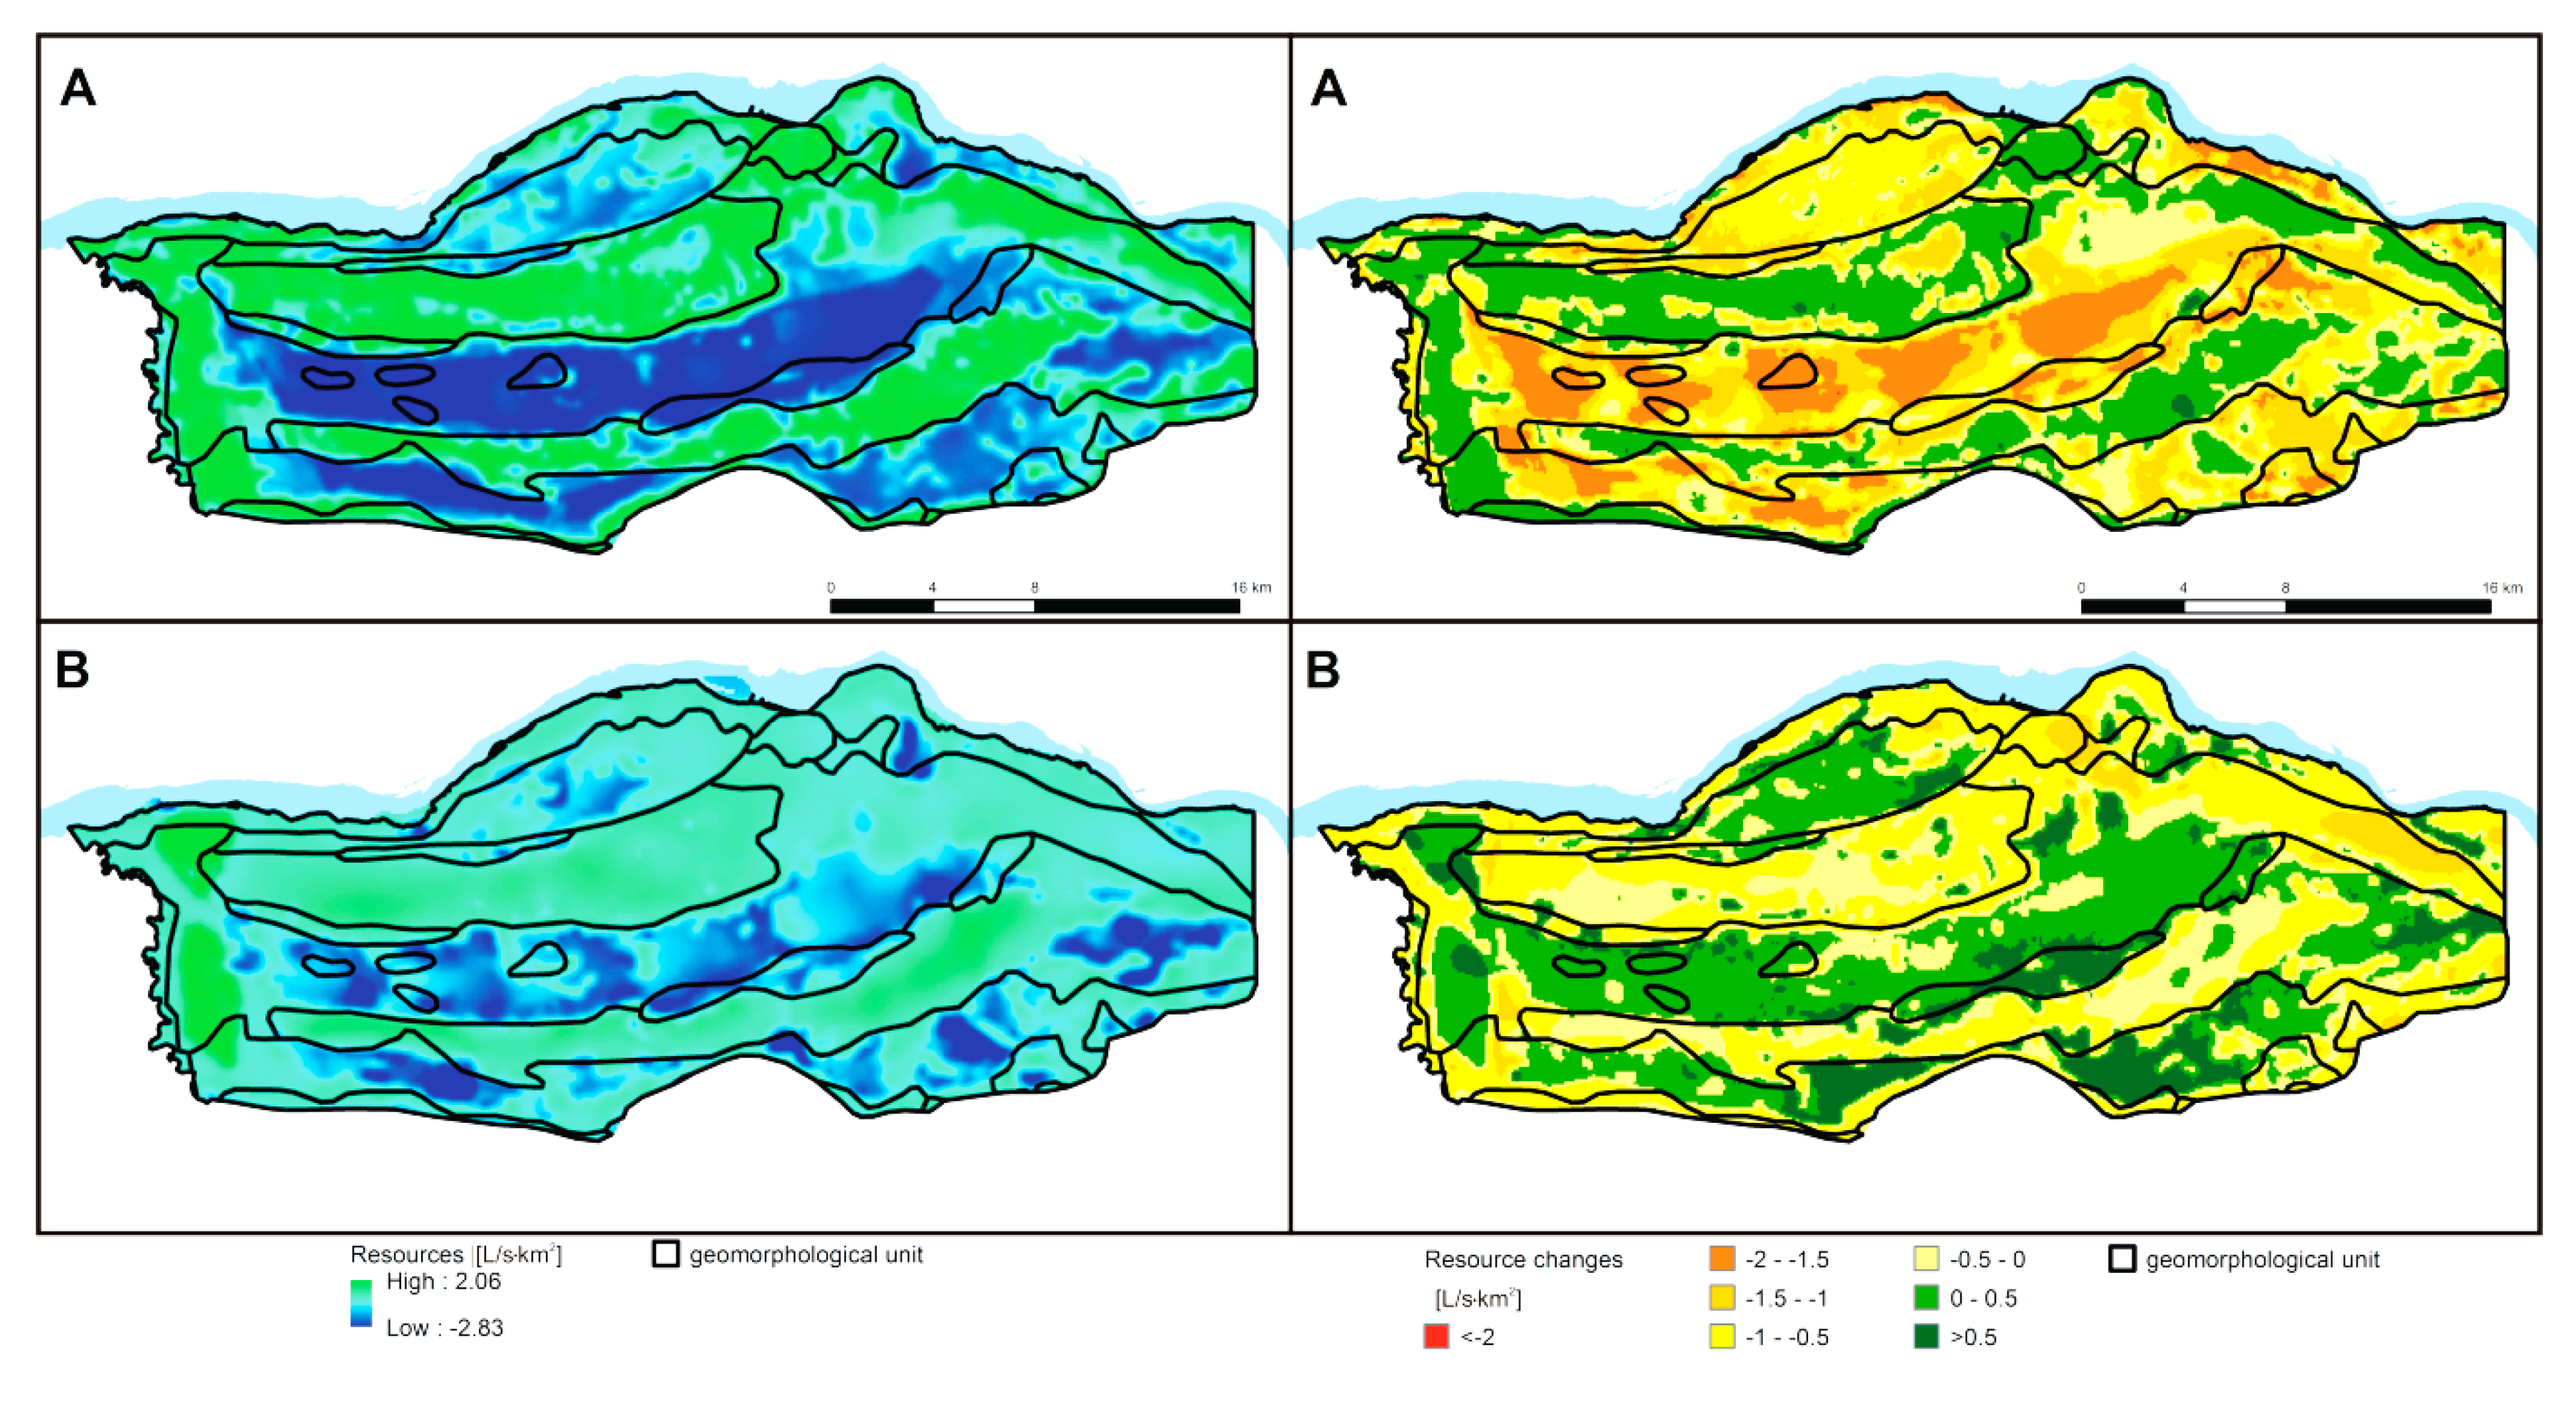
In 2011, the groundwater resource renewability was the lowest among the cases discussed, and ranged from −2.37 to 2.06 L/s km2 (Figure 10), while for the entire area it was merely 0.08 L/s km2. For areas where the groundwater table occurs at shallow depths or at the surface, the average values for the resources were negative: in the Falenica Terrace (II), 0.73 L/s km2, in the Praga Terrace (III), 0.45 L/s km2, and in the upper floodplain −0.25 L/s km2. Positive values covered the areas of floodplain (IVb) and the Otwock Terrace (I), although they were also lower by 57% and 18% respectively, than those measured for the period 1999–2013. The renewability was greater, by 23%, only in the ice-dammed lake plain, and amounted to 1.30 L/s km2 (Table 4; Figure 10).
During the lowest levels (variant 3), the volume of renewable resources was 0.46 L/s km2 on average, ranging from 0.09 to 0.68 L/s km2. Predominance of evapotranspiration over the amount of infiltration recharge was not found in any geomorphological unit of the valley; hence, the value of average renewable resources was positive. In the geomorphological units of low groundwater levels, a significant decrease in the renewability of groundwater resources was found, i.e., it was lower by 51% in the Warsaw Plain, by 39% in floodplain IVb, and by 30% in the Otwock Terrace (I). In the areas of shallower groundwater table, the decrease ranged from 15% in the upper floodplain (IVa) to 27% in the Praga Terrace (II). The average renewability attained higher values than in variant 1 only in the case of the Falenica Terrace (179% of the variant 1 value). Locally, the resources in all units still had negative values, even up to −2.83 L/s km2 (Table 4; Figure 10).
The volume of renewable groundwater resources was verified by comparing it with the water outflow determining by hydrological observation. For the variant 1, the outflow value calculated on the model was 0.103 m3/s, while the average low flow was determined at 0.022 m3/s [48]. This difference accounts for around 8% of the specified renewable resources.

4.3. Groundwater Footprint

The assessment of renewable groundwater resources made it possible to calculate the groundwater footprint (GF), quantifying groundwater demand by both man and the environment. Groundwater footprint was defined as GF = A[C/(R-E)], where A, C, R and E were defined as surface area, groundwater abstraction, infiltration recharge rate and outflow, respectively [8].
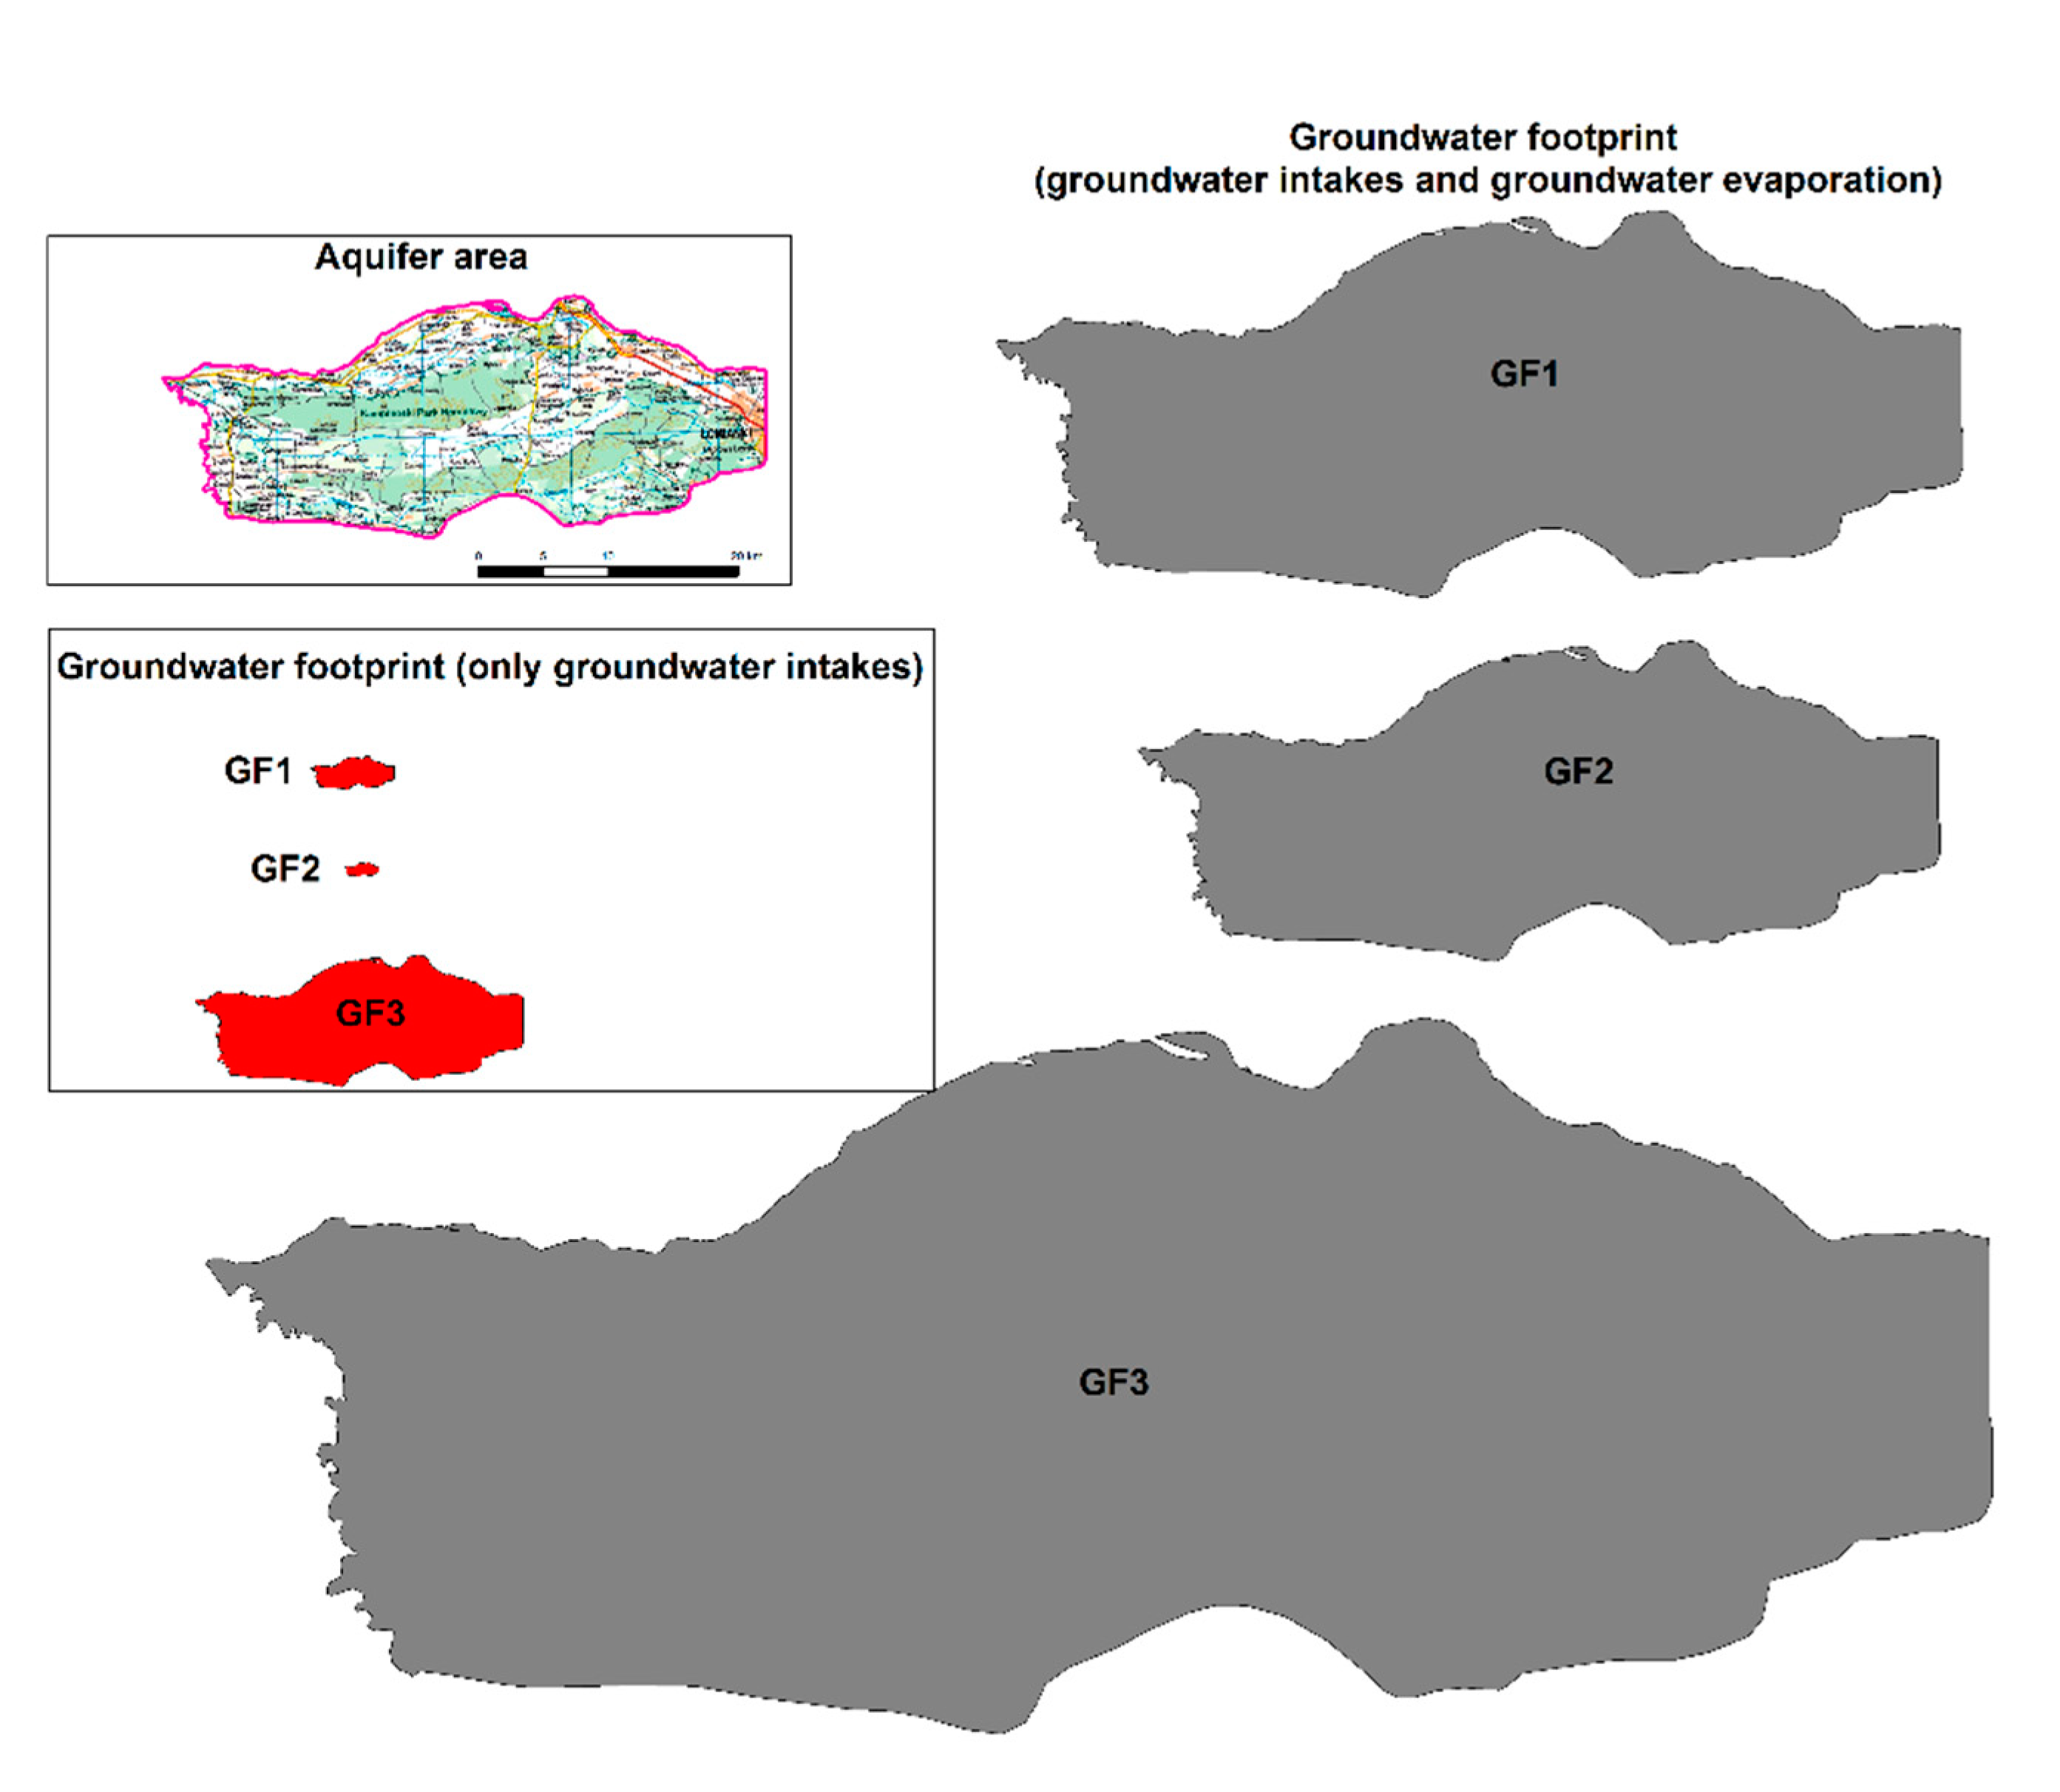
The groundwater footprint GF for the Vistula valley in the study area was calculated on 80.38 km2 for the average conditions presented in variant 1. The groundwater footprint index GF/A, determining the pressure on groundwater, is 0.14, classifying the aquifer as not threatened by excessive groundwater use, like those reported by Gleeson et al. (2012) in Europe (GF < 1). The groundwater use was low in the study area but water loss is possible on evapotranspiration. The groundwater footprint in this case was 931.84 km2 and the GF/A ratio was 1.6 (Table 5; Figure 11). The GF and GF/A indexes were also calculated for variant 2 and 3. The results indicate 36% smaller GF during highest groundwater level and lower renewable resources (variant 2) than variant 1, but GF/A index including evaporation still was over 1. The result of GF during groundwater drought (variant 3) was significantly higher than previous variants: over 84% higher than variant 1 and the GF/A index, including evaporation, reached 2.96.

5. Discussion

Hydrogeological studies, which include, inter alia, the assessment of the amount of renewable resources in geomorphological units and the dynamics of their changes, can be defined as morphohydrogeological research. Morphohydrogeological research can be used in regional and in the units’ spatial assessments of renewable resources in the field of hydrogeological research which have not been carried out. Morphohydrogeological analysis has allowed the characterization of the volume of renewable resources in the individual geomorphological units. The renewable groundwater resources were found to be directly related to both the depth to groundwater table and the use of water by GDEs in which evapotranspiration value decreases.
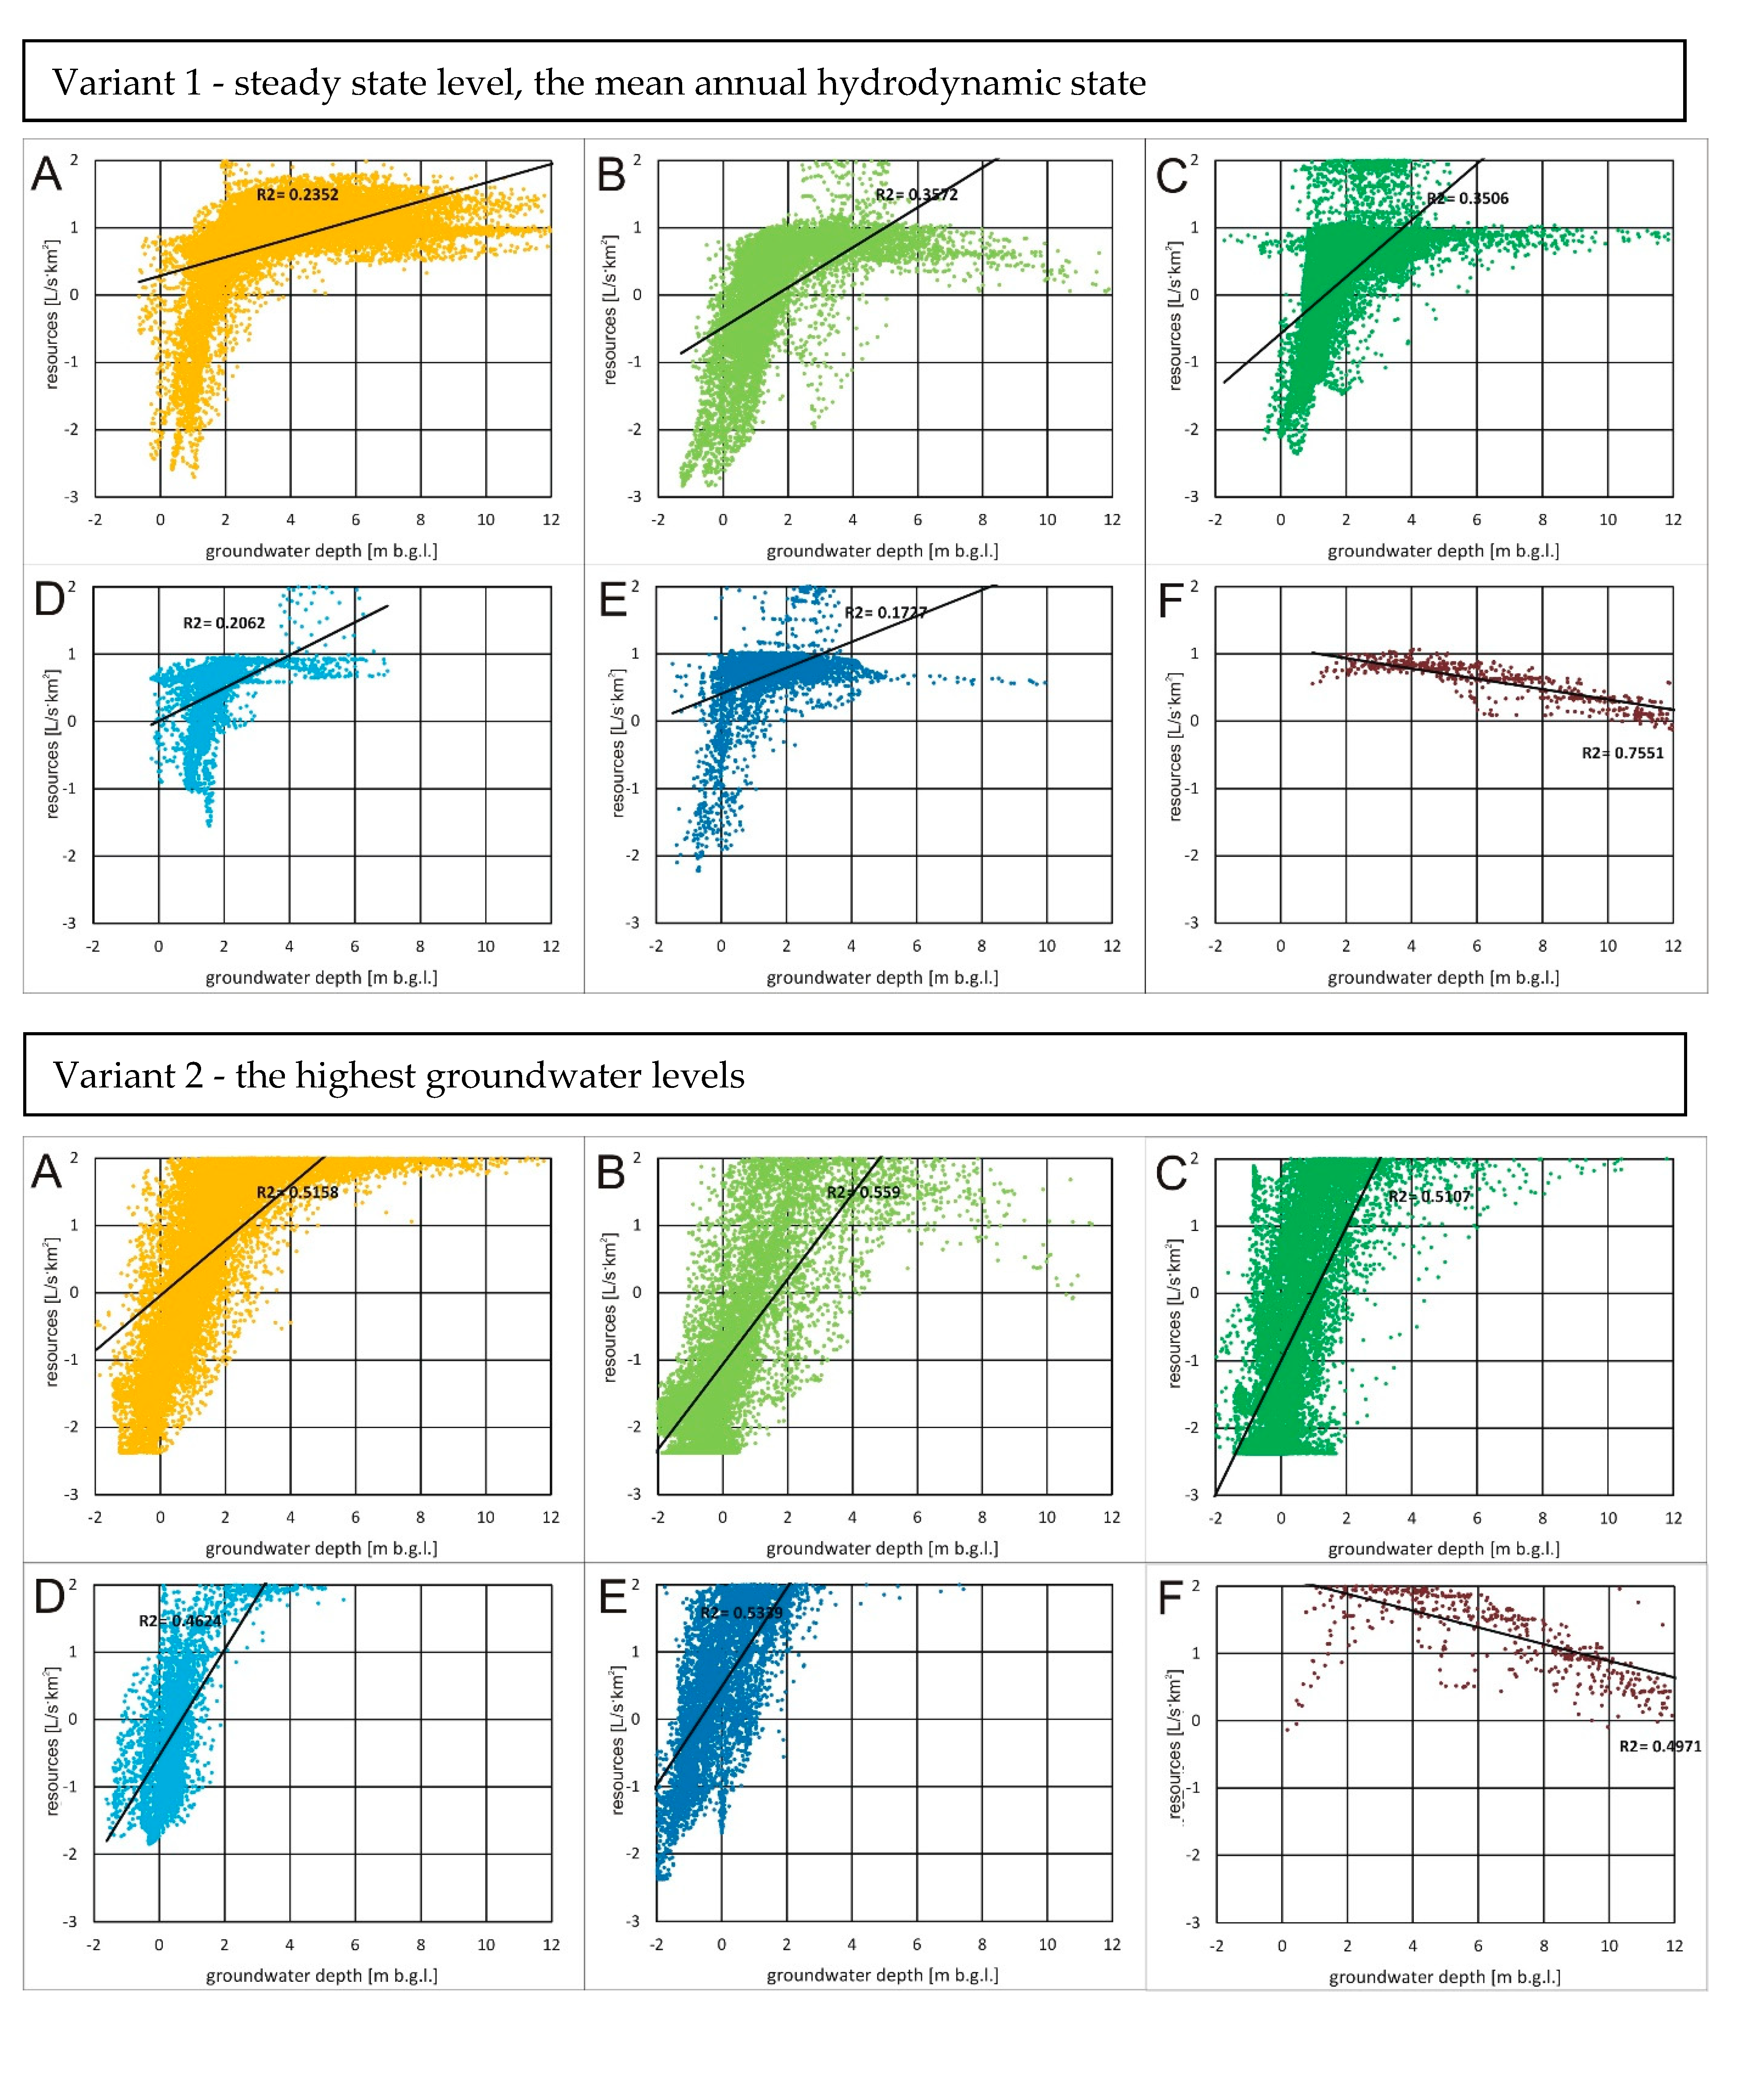
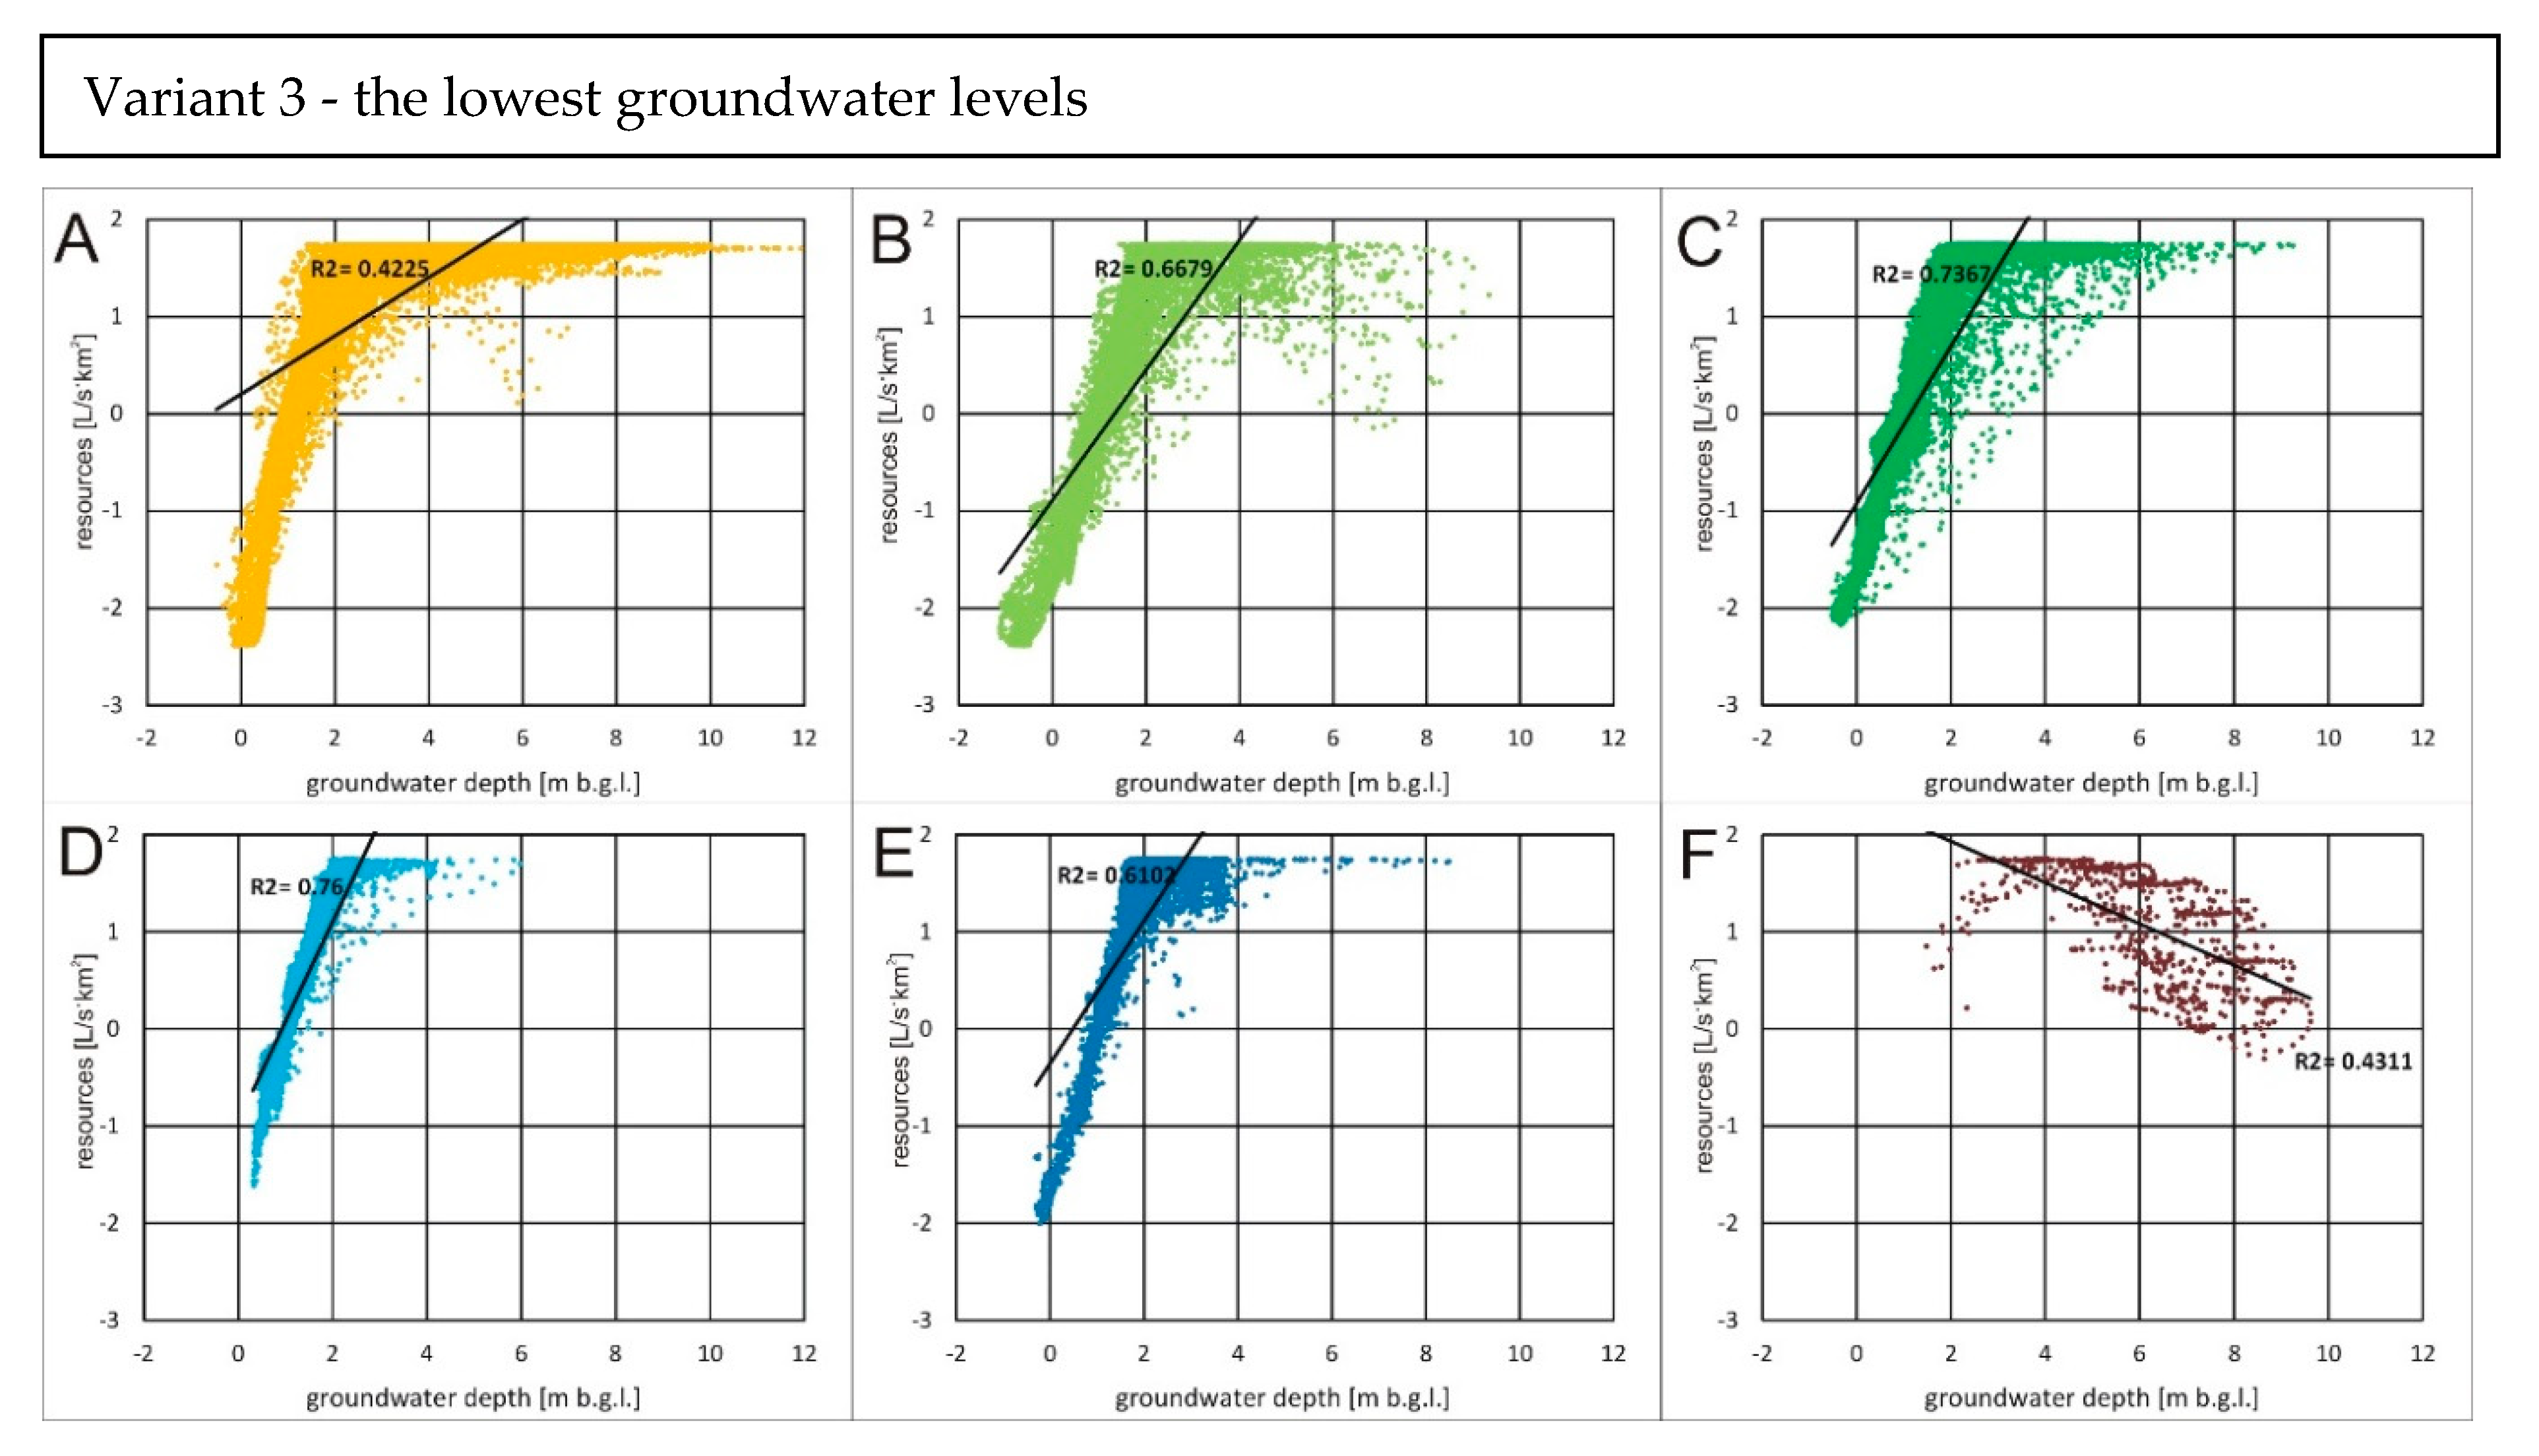
The correlation of groundwater levels and renewable resources was determined in all model blocks in 3 calculation variants. For all variants, the highest values were observed in geomorphological units located at higher elevations or where the ground surface has been raised due to the formation of embankments and levees. Their volume was also spatially variable, showing also a close relationship with the GD described by linear correlation coefficient (Figure 12).
In the Falenica Terrace (II) area, a correlation coefficient of 0.82 between these two statistics was calculated. It was observed as slightly lower than in the Praga Terrace (III) and the upper floodplain (IVa) (0.86 and 0.88, respectively). In morphologically elevated areas with a greater depth to groundwater table, the relationship was lower and amounted to 0.65 in the Otwock Terrace (I) and 0.78 in the lower floodplain (IVb). In the Warsaw Plain area, this relationship was reverse and amounted to −0.65. The correlations in variant 1 were the highest and the point cloud created from the amount of resources vs depth is compact. The relationship can be described by the simplest linear correlation, although the set exhibits some bipartition. Below a depth of 2 m, where evaporation from the groundwater is absent, the relationship strength is smaller.
The correlations were higher in the variant 2, the highest level (2011), only for the Otwock Terrace (I) and the Warsaw Plain and reached the values of 0.72 and −0.71, respectively. In the others, they were about 10% lower than in variant 1, as follows: 0.75 in the Falenica Terrace (II), 0.71 in the Praga Terrace (III), 0.68 in the upper floodplain (IVa) and 0.73 in the lower floodplain (IVb). This is primarily due to the strong dispersion of the points of cloud and their shift towards lower values in relation to depth.
The correlations were lowest in the variant 3, the lowest level (2003), and amounted to: 0.48 in the Otwock Terrace (I), 0.60 in the Falenica Terrace (II), 0.59 in the Praga Terrace (III), 0.45 in the upper floodplain (IVa) and 0.42 in the lower floodplain (IVb). In the Warsaw Plain, the correlation was very high and amounts to −0.87. The cloud-forming data set is very heterogeneous. Two subpopulations could be extracted: first where groundwater depth was lower than 2 m and resources varied in a range of −3 to 1 L/skm2, and the second with groundwater over 2 m and resources varying from 0.5 to 1 L/s km2. The points of clearly higher values of renewable resources were visible for a depth of 0–4 m in the range of 1–2 L/s km2-for terraces II-IVb.
The groundwater footprint and the footprint index were defined as a quantitative assessment of the use of groundwater in climate change conditions [8]. The parameters in the river valley have not been determined yet. Based on data on the amount of groundwater abstraction by intakes, it was found that the groundwater footprint was very low, and the water abstraction for living and economic purposes was sustainable for the period of 1999–2013. Actual groundwater use was set on only 7.7% of resources, which guarantees the preservation of sustainable groundwater management and allows to the groundwater stress index to be kept lower than 1. This footprint was insignificant even under conditions of low renewable resources related to hydrogeological drought (variant 2).
If the process of evaporation from the groundwater (more precisely, evaporation and water uptake by GDE vegetation) was considered, then a significant increase in the groundwater footprint was observed due to the use: 63%, 88% or 47% of renewable resources in variants 1–3, respectively. The groundwater stress was greater than 1 in all variants, which means aquifer was under pressure. Despite the very low renewability of the aquifer in variant 2 (2011), the largest groundwater footprint was calculated for a dry year (2003), when the footprint was twice as large as in the other variants.

6. Conclusions

  • The calculations of renewable resources were done for variants that refer to average and extreme values of groundwater level in relation to possible climate changes understood as time-variable precipitation. The quantitative assessment of renewable groundwater resources of a shallow aquifer was made based on model tests in 3 variants: variant 1-steady state level, defined as the average annual hydrodynamic state for the years 1999–2013, variant 2, the highest groundwater levels in the period 1999–2013, and variant 3, the lowest groundwater levels in this period.
  • For the average groundwater level, the volume of renewable resources was 0.65 L/s km2 for the area where the groundwater depth is 2.15 m. The amount of resources is spatially variable, both in relation to the identified geomorphological units and within them. The highest values appear in the uppermost Otwock Terrace (I) and are 1.16 L/s km2, where the groundwater depth is 3.22 m, while the lowest values are 0.05 L/s km2 in the Falenica terrace (II), where the average depth is 1.41 m.
  • The groundwater renewability is directly related to the depth to groundwater table. In a period of the highest water levels, virtually all geomorphological forms in the valley showed a prevalence of evapotranspiration over recharge. In a drought period, the value of renewable resources in all geomorphological units was positive. The diversity in the volume of renewable resources is associated also with the occurrence of GDEs in the valley. Any resource calculations should be based on geomorphological, hydrogeological and environmental analyses, defined as morphohydrogeological studies.
  • During the periods of hydrogeological drought (variant 2) and flood conditions (variant 3), the renewability of groundwater resources was much lower than in the period 1999–2013. It was 88% lower in the period of the highest levels and 30% less than the average during hydrogeological drought, when reduced precipitation did not influence the reduction in the amount of renewable resources as much as it did during the highest levels. Therefore, intensification of evaporation losses should be considered as the main reason for low (or lack of) renewability in the annual cycle.
  • The groundwater footprint and the footprint index were defined as a quantitative assessment of the use of groundwater in climate change conditions. For the Vistula valley in the study area, the groundwater footprint GF was 80.38 km2. The water footprint index GF/A, determining the pressure on groundwater, was 0.14, classifying the aquifer as not threatened by excessive abstraction. The groundwater footprint in various calculations ranged from 29.50 to 315.91 km2. Taking into account the evaporation, the groundwater footprint in various calculations ranged from 674.47 to 1722.30 km2. For areas of shallow groundwater table in a hydrogeological valley unit, the effect of evaporation should be considered as a key potential factor causing an increase in the groundwater footprint. Studies have shown that evaporation and associated functioning of GD significantly increase groundwater pressure.

Author Contributions

Conceptualization, E.K.; methodology, E.K., S.Z., K.S.; software, S.Z.; validation, E.K., S.Z., K.S.; investigation, E.K., S.Z., K.S.; resources, E.K., S.Z., K.S.; writing—original draft preparation, E.K., S.Z., K.S.; writing—review and editing, E.K., S.Z., K.S.; visualization, E.K., S.Z., K.S. All authors have read and agreed to the published version of the manuscript.

Funding

This research was funded by Warsaw University support.

Conflicts of Interest

The authors declare no conflict of interest.

References

  1. Chambel, A. The role of groundwater in the management of water resources in the World. Hydrological Sciences and Water Security: Past, Present and Future (Proceedings of the 11th Kovacs Colloquium, Paris, France, June 2014). IAHS Publ. 2014, 366, 107–108. [Google Scholar] [CrossRef]
  2. Scanlon, B.R.; Healy, R.W.; Cook, P.G. Choosing appropriate techniques for quantifying groundwater recharge. Hydrogeol. J. 2002, 10, 18–39. [Google Scholar] [CrossRef]
  3. Herbich, P.; Kapuściński, J.; Nowicki, K.; Rodzoch, A. Metodyka określania zasobów dyspozycyjnych wód podziemnych w obszarach bilansowych z uwzględnieniem potrzeb jednolitych bilansów wodnogospodarczych. In Poradnik Metodyczny; HYDROEKO.: Warszawa, Poland, 2013; p. 270. [Google Scholar]
  4. Halford, K.J.; Mayer, G.C. Problems Associated with Estimating Groundwater Discharge and Recharge from Stream Discharge Records. Ground Water 2000, 38, 331–342. [Google Scholar] [CrossRef]
  5. Otto, R. Estimating groundwater recharge rates in the southeastern Holstein region, northern Germany. Hydrogeol. J. 2001, 9, 498–511. [Google Scholar] [CrossRef]
  6. Krogulec, E. Vulnerability Assessment of Groundwater Pollution in the River Valley on the Basis of Hydrodynamic Evidence; Warsaw University Print: Warsaw, Poland, 2004; p. 124. (In Polish) [Google Scholar]
  7. Sanz, E. Springs in Spain: Classification according to their flows and lithologies and their hydraulic contributions. Ground Water 1996, 34, 1033–1041. [Google Scholar]
  8. Gleeson, T.; Wada, Y.; Bierkens, M.F.P.; van Beek, L.P.H. Water balance of global aquifers revealed by groundwater footprint. Nature 2012, 488, 197–200. [Google Scholar] [CrossRef] [PubMed]
  9. De Vries, J.J.; Simmers, I. Groundwater recharge: An overview of processes and challenges. Hydrogeol. J. 2012, 10, 5–17. [Google Scholar] [CrossRef]
  10. Scanlon, B.R.; Reedy, R.C.; Gates, J.B. Effects of irrigated agroecosystems: 1. Quantity of soil water and groundwater in the southern High Plains, Texas. Water Resour. Res. 2010, 46, W09537. [Google Scholar] [CrossRef] [Green Version]
  11. Assouline, S.; Tyler, S.W.; Selker, J.S.; Lunati, I.; Higgins, C.W.; Parlange, M.B. Evaporation from a shallow water table: Diurnal dynamics of water and heat at the surface of drying sand. Water Resour. Res. 2013, 49, 4022–4034. [Google Scholar] [CrossRef]
  12. Sanford, W.E. Recharge and groundwater models: An overview. Hydrogeol. J. 2002, 10, 110–120. [Google Scholar] [CrossRef]
  13. Yeh, H.F.; Lee, C.H.; Chen, J.F. Estimation of groundwater recharge using water balance model. Water Resour. 2007, 34, 153. [Google Scholar] [CrossRef]
  14. Crosbie, R.S.; Scanlon, B.R.; Mpelasoka, F.S.; Reedy, R.C.; Gates, J.B.; Zhang, L. Potential climate change effects on groundwater recharge in the High Plains Aquifer, USA. Water Resour. Res. 2013, 49, 3936–3951. [Google Scholar] [CrossRef] [Green Version]
  15. Meixner, T.; Manning, A.H.; Stonestrom, D.A.; Allen, D.M.; Ajami, H.; Blasch, K.W.; Walvoord, M.A. Implications of projected climate change for groundwater recharge in the western United States. J. Hydrol. 2016, 534, 124–138. [Google Scholar] [CrossRef] [Green Version]
  16. Pazdro, Z.; Kozerski, B. Hydrogeologia Ogólna; Wydawnictwo Geologiczne: Warszawa, Poland, 1990; p. 624. [Google Scholar]
  17. Daly, E.P. Groundwater resources of the Nore River basin; Geol. Report Series RS 94/1 (Groundwater); Geological Survey of Ireland: Dublin, Ireland, 1994; Unpublished internal GSI report. [Google Scholar]
  18. Acharya, S.; Jawitz, J.W.; Mylavarap, R.S. Analytical expressions for drainable and fillable porosity of phreatic aquifers under vertical fluxes from evapotranspiration and recharge. Water Resour. Res. 2012, 48, W11526. [Google Scholar] [CrossRef]
  19. Cao, G.; Scanlon, B.R.; Han, D. Impacts of thickening unsaturated zone on groundwater recharge in the North China Plain. J. Hydrol. 2016, 537, 260–270. [Google Scholar] [CrossRef]
  20. Brito, M.G.; Costa, C.N.; Almeida, J.A.; Vendas, D.; Verdial, P.H. Characterization of maximum infiltration areas using GIS tools. Eng. Geol. 2006, 85, 14–18. [Google Scholar] [CrossRef]
  21. Pratama, E.; Irawan, D.E.; Susanto, A.; Ardi, R.D.W. Influence of Lithology and Slope Gradient to Infiltration of the Mount Malabar, West Java. IOP Conf. Ser. Earth Environ. Sci. 2016, 29, 012025. [Google Scholar] [CrossRef] [Green Version]
  22. Huang, H.; Huang, T.; Pang, Z.; Liu, J.; Yin, L.; Edmunds, W.M. Groundwater recharge in an arid grassland as indicated by soil chloride profile and multiple tracers. Hydrogeol. Process. 2017, 31, 1047–1057. [Google Scholar] [CrossRef]
  23. McMahon, P.B.; Dennehy, K.F.; Bruce, B.W.; Böhlke, J.K.; Michel, R.L.; Gurdak, J.J.; Hurlbut, D.B. Storage and transit time of chemicals in thick unsaturated zones under rangeland and irrigated cropland, High Plains, United States. Water Resour. Res. 2006, 42, W03413. [Google Scholar] [CrossRef] [Green Version]
  24. Hunt, R.J.; Prudic, D.E.; Walker, J.F.; Anderson, M.P. Importance of unsaturated zone flow for simulating recharge in a humid climate. Groundwater 2008, 46, 551–560. [Google Scholar] [CrossRef]
  25. Wang, S.; Shao, J.; Song, X.; Zhang, Y.; Huo, Z.; Zhou, X.Y. Application of MODFLOW and geographic information system to groundwater flow simulation in North China Plain, China. Environ. Geol. 2008, 55, 1449–1462. [Google Scholar] [CrossRef]
  26. Zeng, Y.; Zhao, C.; Li, J.; Lv, G.; Liu, T. Effect of groundwater depth on riparian plant diversity along riverside-desert gradients in the Tarim River. J. Plant. Ecol. 2019, 12, 564–573. [Google Scholar] [CrossRef]
  27. Ginige, M.P.; Kaksonen, A.H.; Morris, C.; Shackelton, M.; Patterson, B.M. Bacterial community and groundwater quality changes in an anaerobic aquifer during groundwater recharge with aerobic recycled water. FEMS Microbiol. Ecol. 2013, 85, 553–567. [Google Scholar] [CrossRef] [Green Version]
  28. De Giglio, O.; Barbuti, G.; Trerotoli, P.; Brigida, S.; Calabrese, A.; Di Vittorio, G.; Lovero, G.; Caggiano, G.; Uricchio, V.F.; Montagna, M.T. Microbiological and hydrogeological assessment of groundwater in southern Italy. Environ. Monit. Assess. 2016, 188, 638. [Google Scholar] [CrossRef] [Green Version]
  29. Barba, C.; Folch, A.; Gaju, N.; Sanchez-Vila, X.; Carrasquilla, M.; Grau-Martínez, A.; Martínez-Alonso, M. Microbial community changes induced by Managed Aquifer Recharge activities: Linking hydrogeological and biological processes. Hydrol. Earth Syst. Sci. 2019, 23, 139–154. [Google Scholar] [CrossRef] [Green Version]
  30. Sidle, R.C.; Onda, Y. Hydrogeomorphology: Overview of an emerging science. Hydrol. Process. 2004, 18, 597–602. [Google Scholar] [CrossRef]
  31. Griffiths, J.S.; Abraham, J.K. Factors affecting the use of applied geomorphology maps to communicate with different end-users. J. Maps 2008, 4, 201–210. [Google Scholar] [CrossRef] [Green Version]
  32. Soman, K. Geology of Kerala; Geological Society of India: Bangalore, India, 2002; p. 32. [Google Scholar]
  33. Ramaiah, S.N.; Gopalakrishna, G.S.; Srinivasa Vittala, S.; Najeeb, K.M.D. Geomorphological Mapping for Identification of Ground Water Potential Zones in Hard Rock Areas Using Geo-spatial Information—A Case Study in Malur Taluk, Kolar District, Karnataka, India. Nat. Environ. Pollut. Technol. 2012, 11, 369–376. [Google Scholar]
  34. Rajaveni, S.P.; Brindha, K.; Elango, L. Geological and geomorphological controls on groundwater occurrence in a hard rock region. Appl. Water Sci. 2017, 7, 1377. [Google Scholar] [CrossRef] [Green Version]
  35. Krogulec, E.; Zabłocki, S.; Zadrozna, D. Variability of Intrinsic Groundwater Vulnerability to Pollution in River Valley due to Groundwater Depth and Recharge Changes. Appl. Sci. 2019, 9, 1133. [Google Scholar] [CrossRef] [Green Version]
  36. Available online: www.pgi.gov.pl/psh (accessed on 25 June 2020).
  37. Krogulec, E. Evaluation of infiltration rates within the Vistula River valley, central Poland. Acta Geol. Pol. 2000, 60, 617–628. [Google Scholar]
  38. Magnuszewski, A. Zautomatyzowany sposób obliczania charakterystyk niżówkowych (Automatized way of low water characteristics estimation). Przegląd Geofiz. 1990, 1–2, 79–83. (In Polish) [Google Scholar]
  39. Soczyńska, U.; Gutry-Korycka, M.; Pokojska, P.; Mikos, D. Bilans potamologiczny jako metoda oceny zmienności obiegu wody w dorzeczu Łasicy (Kampinoski Park Narodowy). Ecohydrol. Hydrobiol. 2003, 3, 291–309. (In Polish) [Google Scholar]
  40. Krogulec, E.; Zabłocki, S.; Sawicka, K. Changes in groundwater regime during vegetation period in groundwater dependent ecosystems. Acta Geol. Pol. 2016, 66, 525–540. [Google Scholar] [CrossRef] [Green Version]
  41. Baraniecka, M.D.; Konecka–Betley, K. Fluvial sediments of the Vistulian and Holocene in the Warsaw Basin. Geograph. Stud. 1987, 4, 151–170. [Google Scholar]
  42. Morawski, W. Objaśnienia do Szczegółowej mapy geologicznej Polski w skali 1: 50 000. arkusz Warszawa–Zachód (523); Wydawnictwo Geologiczne: Warszawa, Poland, 1980. [Google Scholar]
  43. Starkel, L. Historia doliny Wisły od ostatniego zlodowacenia do dziś. Polska Akademia Nauk. Instytut Geografii i Przestrzennego Zagospodarowania im. Stanisława Leszczyckiego. Monografie 2001, 2, 263. (In Polish) [Google Scholar]
  44. Kopczyńska–Żandarska, K. Objaśnienia do Szczegółowej mapy geologicznej Polski w skali 1: 50 000, arkusz Czerwińsk (485); Wydawnictwo Geologiczne: Warszawa, Poland, 1970. [Google Scholar]
  45. Krogulec, E. Podatność specyficzna i naturalna wód podziemnych na zanieczyszczenia w dolinie rzecznej. Hydrogeologia 2011, 445, 337–343. [Google Scholar]
  46. Krogulec, E. Intrinsic and specific vulnerability of groundwater in a river valley—Assessment, verification and analysis of uncertainty. J. Earth Sci. Clim. Chang. 2013, 4, 6. [Google Scholar] [CrossRef]
  47. Krogulec, E. Evaluating the risk of groundwater drought in groundwater-dependent ecosystems in the central part of the Vistula River Valley, Poland. Ecohydrol. Hydrobiol. 2018, 18, 82–91. [Google Scholar] [CrossRef]
  48. Krogulec, E.; Zabłocki, S. Relationship between the environmental and hydrogeological elements characterizing groundwater-dependent ecosystems in central Poland. Hydrogeol. J. 2015, 23, 1587–1602. [Google Scholar] [CrossRef] [Green Version]
  49. Kleczkowski, A.S. Map of Major Groundwater Reservoirs (GZWP) in Poland Requiring Special Protection, 1:500,000; AGH: Krakov, Poland, 1990. (In Polish) [Google Scholar]
  50. Kaczorowska, Z. Opady w Polsce w przekroju wieloletnim, [Precipitation in Poland]. Prace Geogr. IG PAN 1962, 33, 1–102. (In Polish) [Google Scholar]
  51. Tarka, R.; Olichwer, T.; Staśko, S. Evaluation of groundwater recharge in Poland using the in filtration coefficient method. Geol. Q. 2017, 61, 384–395. [Google Scholar] [CrossRef] [Green Version]
  52. McDonald, M.D.; Harbaugh, A.W. A Modular Three-Dimensional Finite-Difference Flow Model. Techniques of Water Resources Investigations of the U.S. Geological Survey; USGS Numbered Series 06-A1; U.S. Government Publishing Office: Washington, DC, USA, 1988; p. 586. [CrossRef]
  53. Harbaugh, A.W. MODFLOW-2005: The, U.S. Geological Surveymodular Ground-Water Model—The Ground-Water Flow Process; Methods, Book 6, series A16; U.S. Geol. Surv. Tech.: Reston, VA, USA, 2005. [CrossRef] [Green Version]
Figure 1. Location of the study area: (A)—on the background of Major Groundwater Reservoir no. 222; (B)—groundwater monitoring points (adapted from [35,36]).
Applsci 10 04827 g001aApplsci 10 04827 g001b
Figure 2. Study area characteristics: (A)–river network and morphology based on DEM 10 × 10 m; (B)–geomorphological units (adapted from [6,41]).
Applsci 10 04827 g002
Figure 3. Groundwater condition scheme in the study area (adapted from [6]).
Applsci 10 04827 g003
Figure 4. Scheme of groundwater recharge dependency in shallow hydrogeological systems, precipitation analysis.
Applsci 10 04827 g004
Figure 5. The boundary conditions and the discretization net of the modelled area.
Applsci 10 04827 g005
Figure 6. Groundwater model calibration diagram-calculated head vs observed head. (A)—variant 1; (B)—variant 2; (C)—variant 3.
Applsci 10 04827 g006
Figure 7. Groundwater depth in variant 1.
Applsci 10 04827 g007
Figure 8. Groundwater depth in: (A): variant 2; (B): variant 3.
Applsci 10 04827 g008
Figure 9. Spatial distribution and average values of renewable resources in geomorphological units in variant 1.
Applsci 10 04827 g009
Figure 10. Renewable resources and their changes according to steady state: (A): variant 2; (B): variant 3.
Applsci 10 04827 g010
Figure 11. Groundwater footprint of aquifer in the variant: GF1: variant 1; GF2: variant 2; GF3: variant 3.
Applsci 10 04827 g011
Figure 12. Correlation between groundwater depth and volume of resources in the different variants in geomorphological units: (A): Otwock Terrace (I); (B): Falenica Terrace (II); (C): Praga Terrace (III); (D): Higher flood plain (IVa); (E): Lower flood plain (IVb); (F): Warsaw plain.
Applsci 10 04827 g012aApplsci 10 04827 g012b
Table 1. Precipitation analysis.
Year199920002001200220032004200520062007200820092010201120122013
Type of year
in the reference
to average
precipitation
averagevery drywetaveragedryaverageDrywetwetaverageaveragevery wetaveragevery dryaverage
MonthDeviation of monthly precipitation D = (monthly precipitation · 100/average monthly precipitation) − 100
November−172631−27−8−3236−1512−11−1247118−98−48
December0−3621−1−6953−47183−19−51916−14−14−31
January−49−9−52513−4−3−1913377−16−46−25−4−1
February26−43−41126−6573194116−12−19−27−51−27−15
March−3570−446−571258−4925982−23−86−28−28
April133−8994−59−1552−4531−51−6−13−25−32250
May−9−58−19−1913−1514−255−29−14114−5−3481
June154−8815−10−29−32−3919−58−514−36757
July−446957−49−2−15−9−85−56−87171−21−72
August−66−26−4927−29−15−56182289−1293−21−50−14
September−23−49102−176−44−31−4122232157−89−3397
October55−81−1011211224−72030−152−78−8545−38
Deviation
of monthly precipitation
over 50%
454343332404624
Deviation
of monthly precipitation
in a range 30–50%
343202451102233
Average annual
GD
1.721.972.041.902.121.982.042.021.851.942.011.651.341.661.86
Table 2. Statistics and errors of the modelled variants.
StatisticsModelled Variants
Variant 1Variant 2Variant 3
Max. residual [m]−0.3590.692−0.715
Min. residual [m]0.06000.0000.000
Abs. residual mean [m]0.1280.2450.209
Standard error of the estimate [m]0.0230.0440.035
Root mean squared [m]0.1580.3080.258
Normalized RMS [%]0.9531.8491.501
Correlation coefficient 0.9990.9970.998
Table 3. Average groundwater depth in geomorphological units.
Geomorphological UnitGroundwater Depth in Model Variant–Average Value
Variant 1 (Figure 7)Variant 2 (Figure 8)Variant 3 (Figure 8)
Lower flood plain (IVb)2.010.001.47
Higher flood plain (IVa)1.440.431.80
Praga Terrace (III)1.590.561.98
Falenica Terrace (II)1.410.531.96
Otwock Terrace (I)3.222.423.85
Warsaw plain6.266.667.49
Average value2.151.162.58
Table 4. Changes of groundwater resources in groundwater model variants.
Variant 1
(Figure 9)
Geomorphological UnitRenewable Resources [L/s km2]Area [km2]
MinMeanMaxStandard Deviation
Lower flood plain (IVb)–2.011.111.740.8159.20
Higher flood plain (IVa)–1.610.521.740.8039.00
Praga Terrace (III)–2.170.341.741.18171.03
Falenica Terrace (II)–2.370.051.741.19108.88
Otwock Terrace (I)–2.371.161.740.90185.07
Warsaw plain–0.311.051.740.576.54
Average value: 0.65 sum:569.72
Variant 2
(Figure 10)
Geomorphological UnitRenewable Resources [L/s km2]Area [km2]
MinMeanMaxStandard Deviation
Lower flood plain (IVb)–2.370.472.061.1259.20
Higher flood plain (IVa)–1.85–0.212.060.9639.00
Praga Terrace (III)–2.37–0.452.061.73171.03
Falenica Terrace (II)–2.37–0.732.061.45108.88
Otwock Terrace (I)–2.370.942.061.26185.07
Warsaw plain–0.291.302.060.646.54
Average value: 0.08 sum:569.72
Variant 3
(Figure 10)
Geomorphological UnitRenewable Resources [L/s km2]Area [km2]
MinMeanMaxStandard Deviation
Lower flood plain (IVb)–2.220.682.060.4959.2
Higher flood plain (IVa)–1.550.442.040.5039
Praga Terrace (III)–2.360.252.040.87171.03
Falenica Terrace (II)–2.830.092.060.85108.88
Otwock Terrace (I)–2.700.812.060.64185.07
Warsaw plain–0.230.511.060.326.54
Average value: 0.46 sum:569.72
Table 5. Groundwater footprint, groundwater stress in variant 1–3.
DataSymbolVariant 1Variant 2Variant 3
(1999–2013)(Year 2011)(Year 2003)
Area [km2]RemarksA581.8581.8581.8
Groundwater intakes [m3/d] C4779.74779.74779.7
Recharge [m3/d]Modelling research in 3 variantsR79622.9118841.345362.28
Run off [m3/d]Modelling research in 3 variantsE45028.324583.436559.64
Groundwater evaporation [m3/d]Modelling research in 3 variantsGE50629104492.421278.72
Groundwater footprintonly groundwater intakesGFGF1 = 80.38GF2 = 29.50GF3 = 315.91
[km2]
Groundwater footprintgroundwater intakes and groundwater evaporationGFGF1 = 931.84GF2 = 674.47GF3 = 1722.30
[km2] – Figure 11
Groundwater stress only groundwater intakesGF/A0.140.050.54
Groundwater stressgroundwater intakes and groundwater evaporationGF/A1.61.162.96