Article

Observation of Distribution of π-Orbital-Oriented Domains in PAN- and Pitch-Based Carbon Fibers Using Scanning Transmission X-ray Microscopy

1
Advanced Technology Research Laboratories, Research and Development, Nippon Steel Corporation, Futtsu 2938511, Japan
2
Department of Materials Structure Science, School of High Energy Accelerator Science, The Graduate University for Advanced Studies (SOKENDAI), Tsukuba 3050801, Japan
3
Photon Factory, Institute of Materials Structure Science, High Energy Accelerator Research Organization (KEK), Tsukuba 3050801, Japan
4
Business Development Planning Department, Nippon Steel Chemical & Material, Chuo-ku 1030027, Japan
*
Author to whom correspondence should be addressed.
Appl. Sci. 2020, 10(14), 4836; https://doi.org/10.3390/app10144836
Submission received: 11 June 2020 / Revised: 5 July 2020 / Accepted: 6 July 2020 / Published: 14 July 2020
(This article belongs to the Special Issue Imaging and Characterization of Applied Materials)

Abstract

:
The mechanical properties of carbon fibers (CFs) can be controlled by their internal structures such as the distribution of π-orbital-oriented domains, as well as the diameter and cross-sectional shape of the fiber. In this study, we investigated the carbon chemical structure maps of commercial polyacrylonitrile (PAN)- and pitch-based CFs using scanning transmission X-ray microscopy to evaluate the differences in the distribution of π-orbital-oriented domains. The graphene sheets in the PAN-based CFs have a fiber texture that is aligned along the fiber direction and randomly oriented within the cross section. The domain sizes within the cross section are less than the resolution limit (i.e., 50 nm). By contrast, the graphene sheets in the pitch-based CFs are aligned parallel to each other and form aggregates with a size ranging from approximately 100 nm to 1 μm within the cross sections. They form 200–300-nm stripes along the CF axis in the longitudinal sections.

1. Introduction

The microtexture of carbon fibers (CFs) plays a dominant role in controlling their physical properties (e.g., tensile strength, tensile modulus) [1,2,3]. However, useful information on the nanoscopic structure cannot be obtained using conventional elemental mapping techniques (e.g., electron probe micro analyzer) because CFs are composed entirely of carbon. Thus, more advanced techniques for describing the chemical structure (e.g., functional groups, orbital orientation of chemical bonds, valences, and magnetic states) are required. The spatial resolutions of the conventional techniques that analyze chemical structures, such as X-ray photoelectron spectroscopy (XPS) and X-ray absorption near-edge structure (XANES) spectroscopy [4,5], range from μm to mm. This makes it difficult to observe detailed information on the inner texture of CFs. The spatial resolution of electron energy loss spectroscopy in a transmission electron microscope (TEM-EELS) is much higher (less than 1 nm) than that of conventional spectroscopic techniques. However, TEM-EELS might not be appropriate for organic and carbon compounds because the strong electron beams may damage these materials [6]. In contrast, X-ray beams cause less damage than electron beams. X-ray microscopy has advanced in the past few decades owing to improvements in lithographic fabrication techniques, facilitating the use of optical devices such as Fresnel zone plates (FZP), in which the spatial resolution is approximately 20–100 nm.
Therefore, to map the chemical structure of CFs, this study employed scanning transmission X-ray microscopy (STXM), which can be used to map the chemical structure with a spatial resolution at the nanometer level [7]. This technique, with its high spatial resolution and with less damage to samples, can be particularly useful to elucidate the structural details of various materials at the sub-micrometer scale: not only carbon materials but also biomaterials, photonic materials, thermoelectrics, and 3D printed materials [8,9,10,11]. In general, CFs can be broadly classified into polyacrylonitrile (PAN)- and pitch-based types. In this study, we performed chemical structure mapping of carbon for commercial CFs of both types using STXM to evaluate the differences in the distribution of the π-orbital-oriented domains. Moreover, we utilized two types of orthogonal linearly polarized X-rays. Herein, the π-orbital-oriented domain and stacked structure of graphene sheets are defined as follows. In general, CFs are composed of crystallites of graphite. The π-orbital-oriented domains are defined as regions where the π-orbitals in each crystallite of graphite are aligned in the same direction to the extent that Bragg’s law is not satisfied [12]. In contrast, the stacked structures of graphene sheets are the stacks of graphene sheets in a single crystallite of graphite.

2. Materials and Methods

The manufacturer and physical properties of commercial PAN- and pitch-based CFs in this study are shown in Table 1. They were embedded in epoxy resins and sliced into thin films using focused ion-beam processing. The sample thicknesses were adjusted to 100 nm via Ar milling. We fabricated two thin films from the cross and longitudinal sections of the PAN- and pitch-based CFs. STXM measurements were performed using a compact STXM [13] at Beamline BL-13A of the Photon Factory of the High Energy Accelerator Research Organization (KEK) in Japan. STXM enabled us to obtain XANES mapping at a spatial resolution of approximately 50 nm. The APPLE-II type undulator of BL-13 can generate synchrotron X-rays with both linear horizontal (LH) and linear vertical (LV) polarization modes [14]. An image stack measurement, where a XANES spectrum around the C K-edge was obtained for each sample position, was performed using both polarized X-rays [7]. It is generally known that the intensity of the peak in XANES, corresponding to the excitation of the 1s→π* transitions (due to C = C), is proportional to the square of the inner product between the directions of the orbital and the polarization vector of the X-ray [15,16,17,18,19]. To analyze the distribution of the oriented π-orbitals, we performed XANES mapping across the entire cross and longitudinal sections using two types of polarized X-rays: LH and LV, respectively. The aXis2000 software was used for the analysis of the image stacks (a set of X-ray absorption images for a sequence of synchrotron radiation X-ray energies near the C K-edge) [20].
X-ray diffraction (XRD) measurements were also performed to evaluate the crystallinity of graphite in each CF using pulverized specimens. Powders of the model samples were packed into an aluminum sample holder (sample part: φ 20 mm × 0.5 mm depth), and XRD measurements were performed with a diffractometer (Smartlab®, Rigaku Corporation). The tube current and tube voltage were set at 36 mA and 40 kV, respectively. The goniometer radius was 285 mm. A high-speed, one-dimensional detector was used as the X-ray detector, and measurements were performed using the Bragg–Brentano focusing geometry (i.e., the Kβ filter method with Co Kα using Fe filters). The measurement conditions were as follows: measurement angle range 2θ = 15–40°, step angle width Δ2θ = 0.02°. The Halder–Wagner method was used to calculate the crystallite size of graphite [21].

3. Results and Discussion

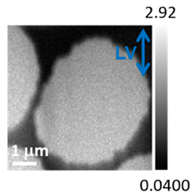
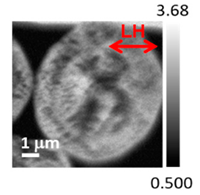
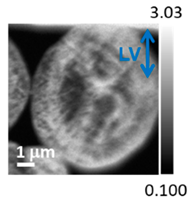
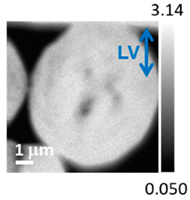
Table 2 shows the TEM and X-ray absorption images obtained using STXM at the energies 285.4 eV (1s→π*) and 292.0 eV (1s→σ*) of the cross sections of the PAN- and pitch-based CFs. The red and blue arrows in Table 2 indicate the X-ray polarization directions of LH and LV, respectively. Each STXM image consists of 150 × 150 pixels (1 pixel = 40 nm) and 200 × 200 pixels (1 pixel = 40 nm) for the PAN- and pitch-based CFs, respectively. With respect to the PAN-based CFs, the contrast (optical density, OD) in X-ray absorption images at 285.4 eV (b,c in Table 2) and 292.0 eV (d,e in Table 2) was independent of the direction of the X-ray polarization.
Here, OD is defined as
O D μ ( E ) t = ln I 0 I
where μ(E) is the absorption coefficient, t is the sample thickness, and I0(E) and I(E) are the incoming and transmitted X-ray intensities, respectively. Note that I0(E) is the intensity of the X-ray that directly enters the detector without passing through the sample during the measurement.
In the PAN-based CFs, the OD images at E = 285.4 eV in b,c in Table 2 were independent of the direction of X-ray polarization. Similarly, the OD images at E = 292.0 eV in d,e in Table 2 were independent of the direction of the X-ray polarization. This is because the σ-orbital has no spatial anisotropy, while the π-orbital forms a uniaxial orbit. Therefore, even in X-ray absorption at the carbon K-edge, the absorption peak intensity derived from the π-orbital is anisotropy not observed in that of the σ-orbital [15]. In general, OD is proportional to cos2θ when the angle between the vector of the polarized electric field of the X-rays and the direction of the orbit is θ [15,16,17,18,19]. These results, depicted in b,c in Table 2, are similar to those reported in earlier studies [19]. Thus, it is suggested that the domain sizes within the cross section of the PAN-based CFs are less than the spatial resolution of STXM (i.e., 50 nm). In contrast, in the pitch-based CFs, the OD images at E = 285.4 eV shown in g,h in Table 2 were dependent on the polarization direction and showed an opposite contrast between the LH and LV polarizations. However, the OD images at E = 292.0 eV, shown in i,j in Table 2, were independent of the direction of the X-ray polarization. Due to the symmetry of the σ-orbital, there is no polarization dependence. It was suggested that the pitch-based CFs consisted of π-orbital-oriented domains whose sizes are approximately 100 nm–1 μm, which is greater than the spatial resolution of STXM (i.e., 50 nm). Note that we consider that even a detailed observation of a single fiber section can have a representative discussion because there is no significant difference among fibers within the range (1–10 mm2) that can be seen with scanning electron microscopy (SEM) or optical microscopy. In addition, for other research projects, we have performed STXM measurements of some types of PAN- and pitch-based CFs. In the case of PAN-based CFs, there was no polarization dependence of the OD contrast in the cross sections in at least five fibers for two different types. In the case of the cross section of pitch-based CFs, the polarization dependence of OD contrast as reported in this paper was observed in at least five fibers for three different types.
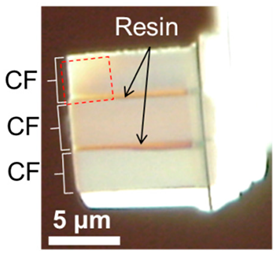
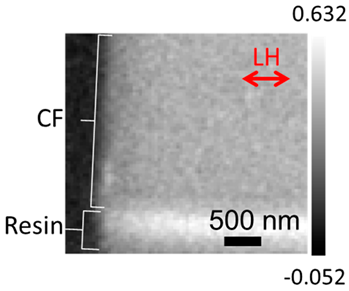
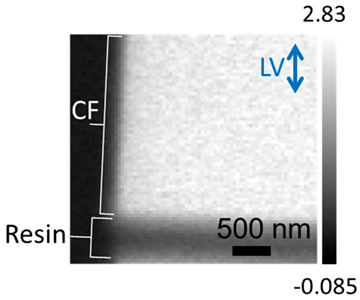
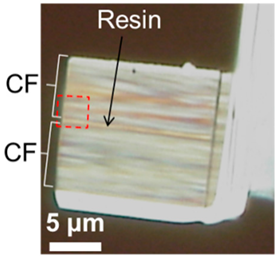
Areas in a,d in Table 3 shows the visible light microscopy images of the longitudinal sections of the PAN- and pitch-based CFs, respectively. The STXM measurements were performed in the areas enclosed by the red dotted lines in a,d in Table 3. Each X-ray absorption image consists of 73 × 73 pixels (1 pixel = 41 nm). We also used polarized X-rays, as indicated by the red and blue arrows in Table 3. For the PAN-based CFs, as shown in b,c in Table 3, homogenous OD contrast images were obtained at both X-ray polarizations. In addition, OD was higher under LV (OD = 2.4, c in Table 3) than under LH (OD = 0.3, b in Table 3), indicating that the orientations of the π-orbitals on the plane radial to the CF axis were nearly perpendicular to the fiber axis. Figure 1 shows the averaged C K-edge spectra of the CF areas in b,c in Table 3. The spectra were normalized using the OD at 292.0 eV. The difference between the spectra in Figure 1 also indicates that the π-orbitals in the PAN-based CFs were oriented perpendicular to the fiber axis. In addition, the results shown in b–e in Table 2 and b,c in Table 3 suggest that the graphene sheets in the PAN-based CFs have a fiber texture where they are aligned along the fiber direction and randomly oriented within the cross section.
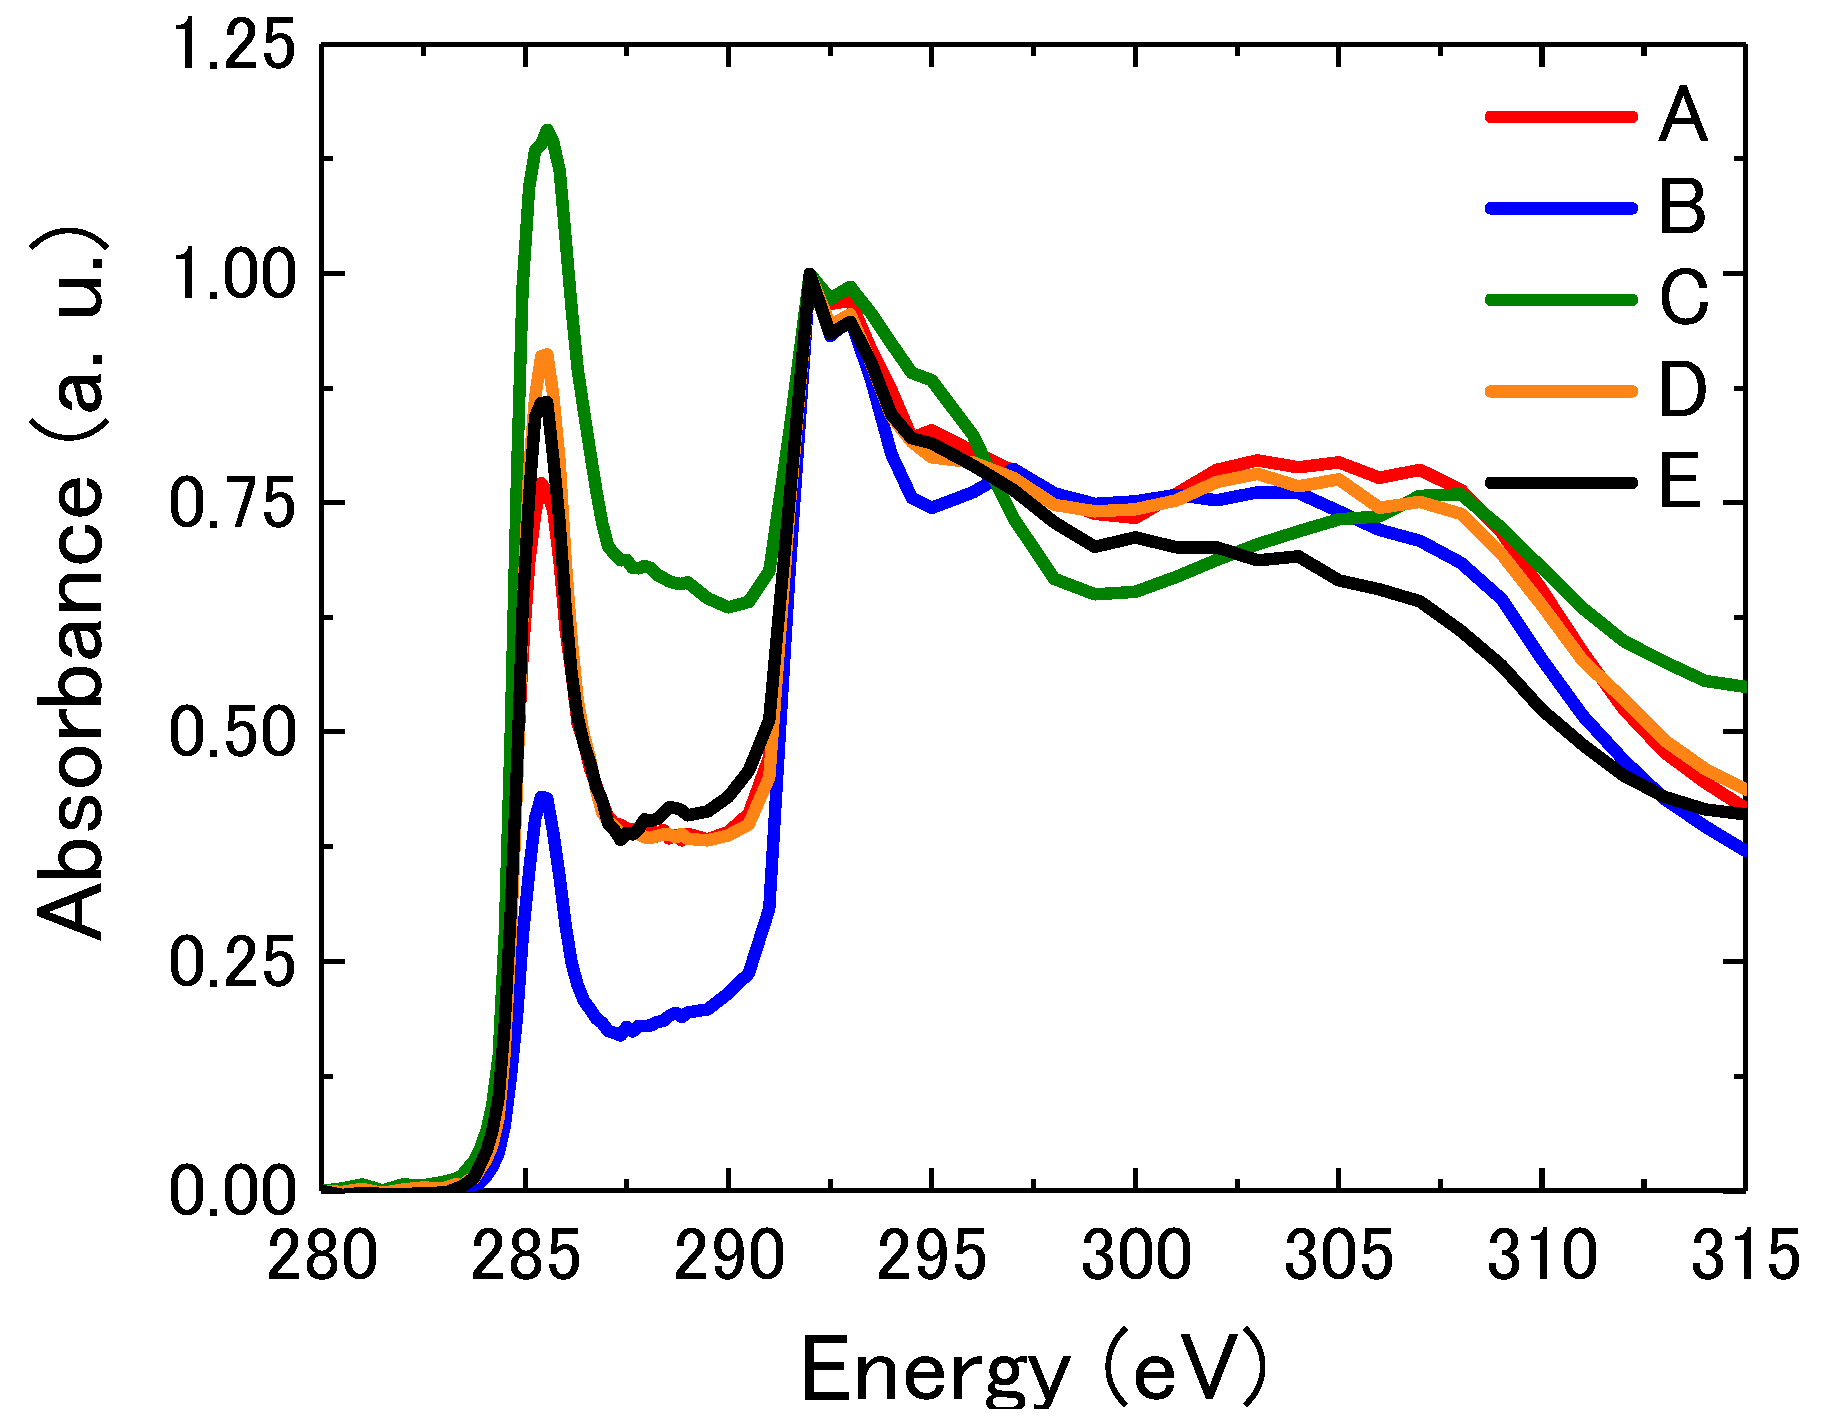
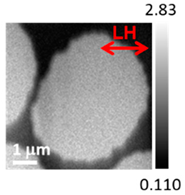
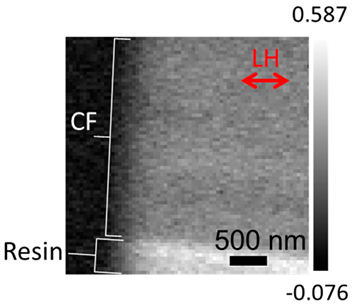
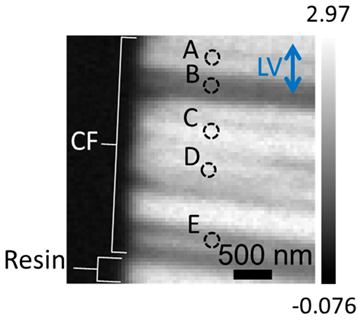
In contrast, for the pitch-based CFs, as shown in f in Table 3, stripe-like contrasts with a width of 200–300 nm were observed in the STXM image with vertical polarization. The OD of the CF area ranged from 1.1 to 2.4, whereas it was homogeneous in e in Table 3. This suggests that the domains with widths from 200 to 300 nm were aligned along the fiber direction, and the π-orbitals of each domain were randomly oriented in the cross-sectional plane. Figure 2 shows the C K-edge spectra averaged over areas A to E in f in Table 3. Each spectrum was normalized using the OD at E = 292.0 eV. The OD intensity of the peak corresponding to the 1s→π* excitation differed in each area, which confirms that the OD contrast observed in f in Table 3 could be attributed to the domains consisting of oriented π-orbitals.
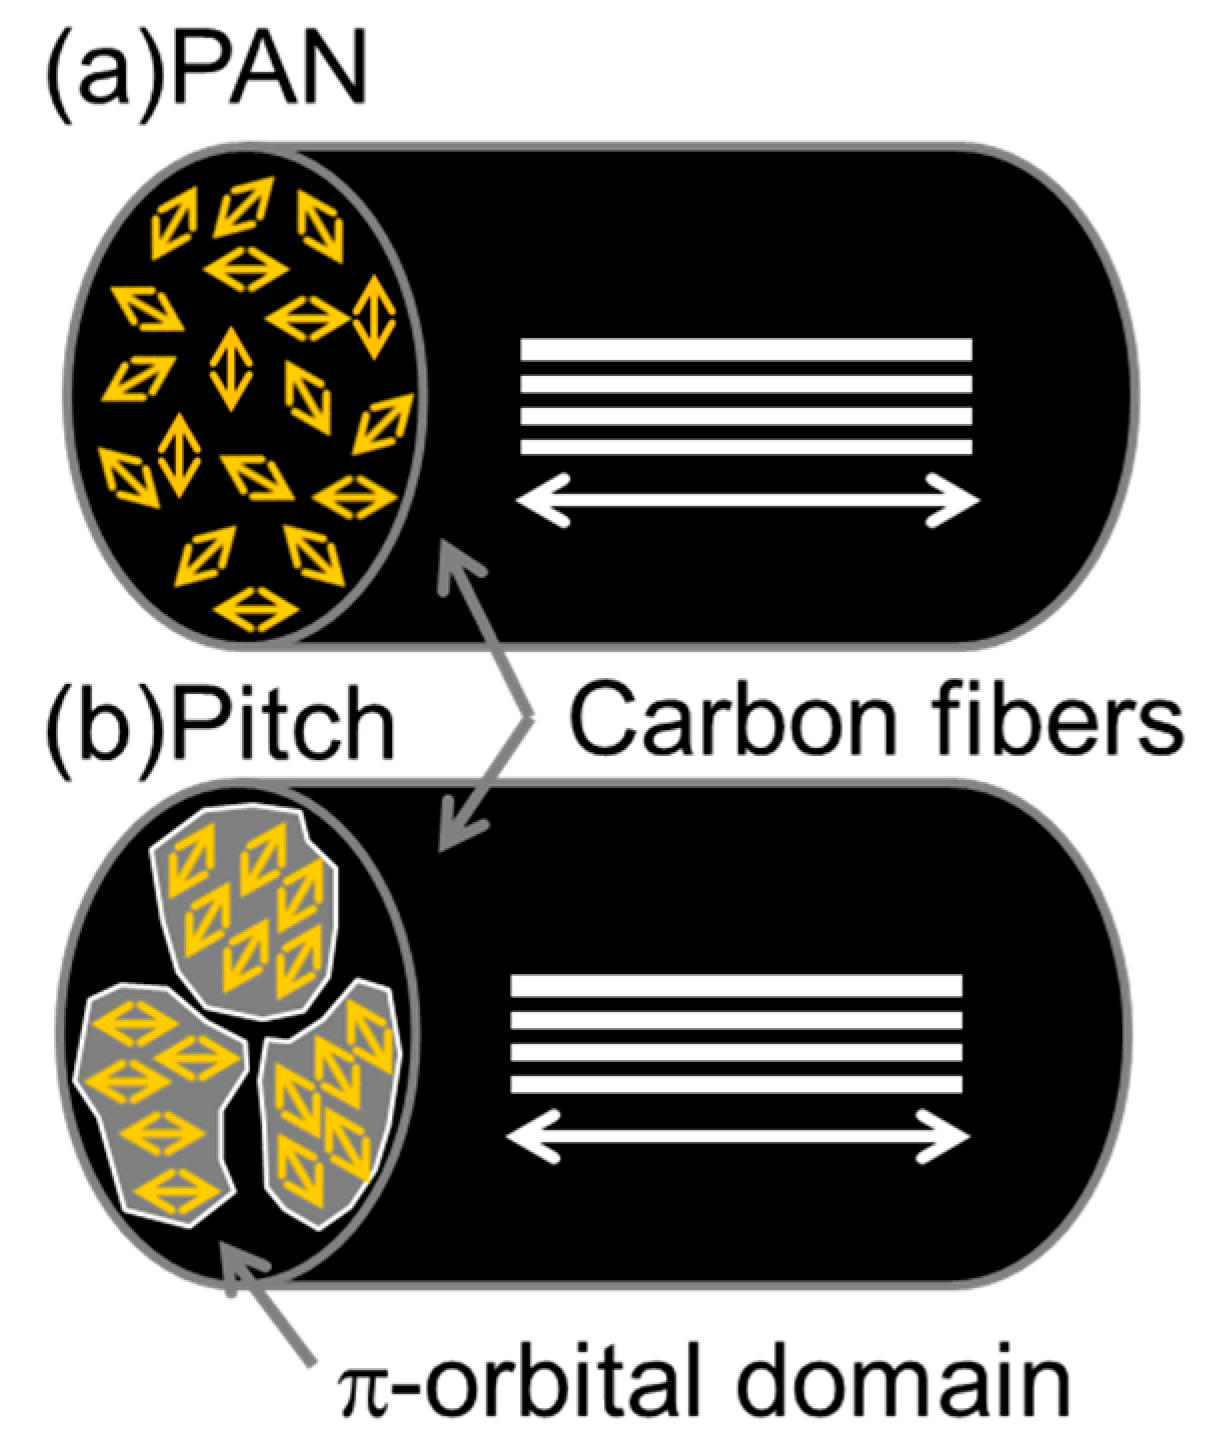
As far as measured, these results revealed that the size and distribution of the π-orbital-oriented domains were different between the PAN- and pitch-based CFs, as schematically illustrated in Figure 3. The direction of the graphene sheets in the PAN-based CFs is parallel to the axis of the fibers that are randomly oriented within the cross section. The size of the π-orbital-oriented domains, if it exists, is less than approximately 50 nm. By contrast, the pitch-based CFs consist of π-orbital-oriented domains whose sizes are approximately 100 nm–1 μm. The direction of the graphene sheets in the pitch-based CFs is also parallel to the axis of the fibers.
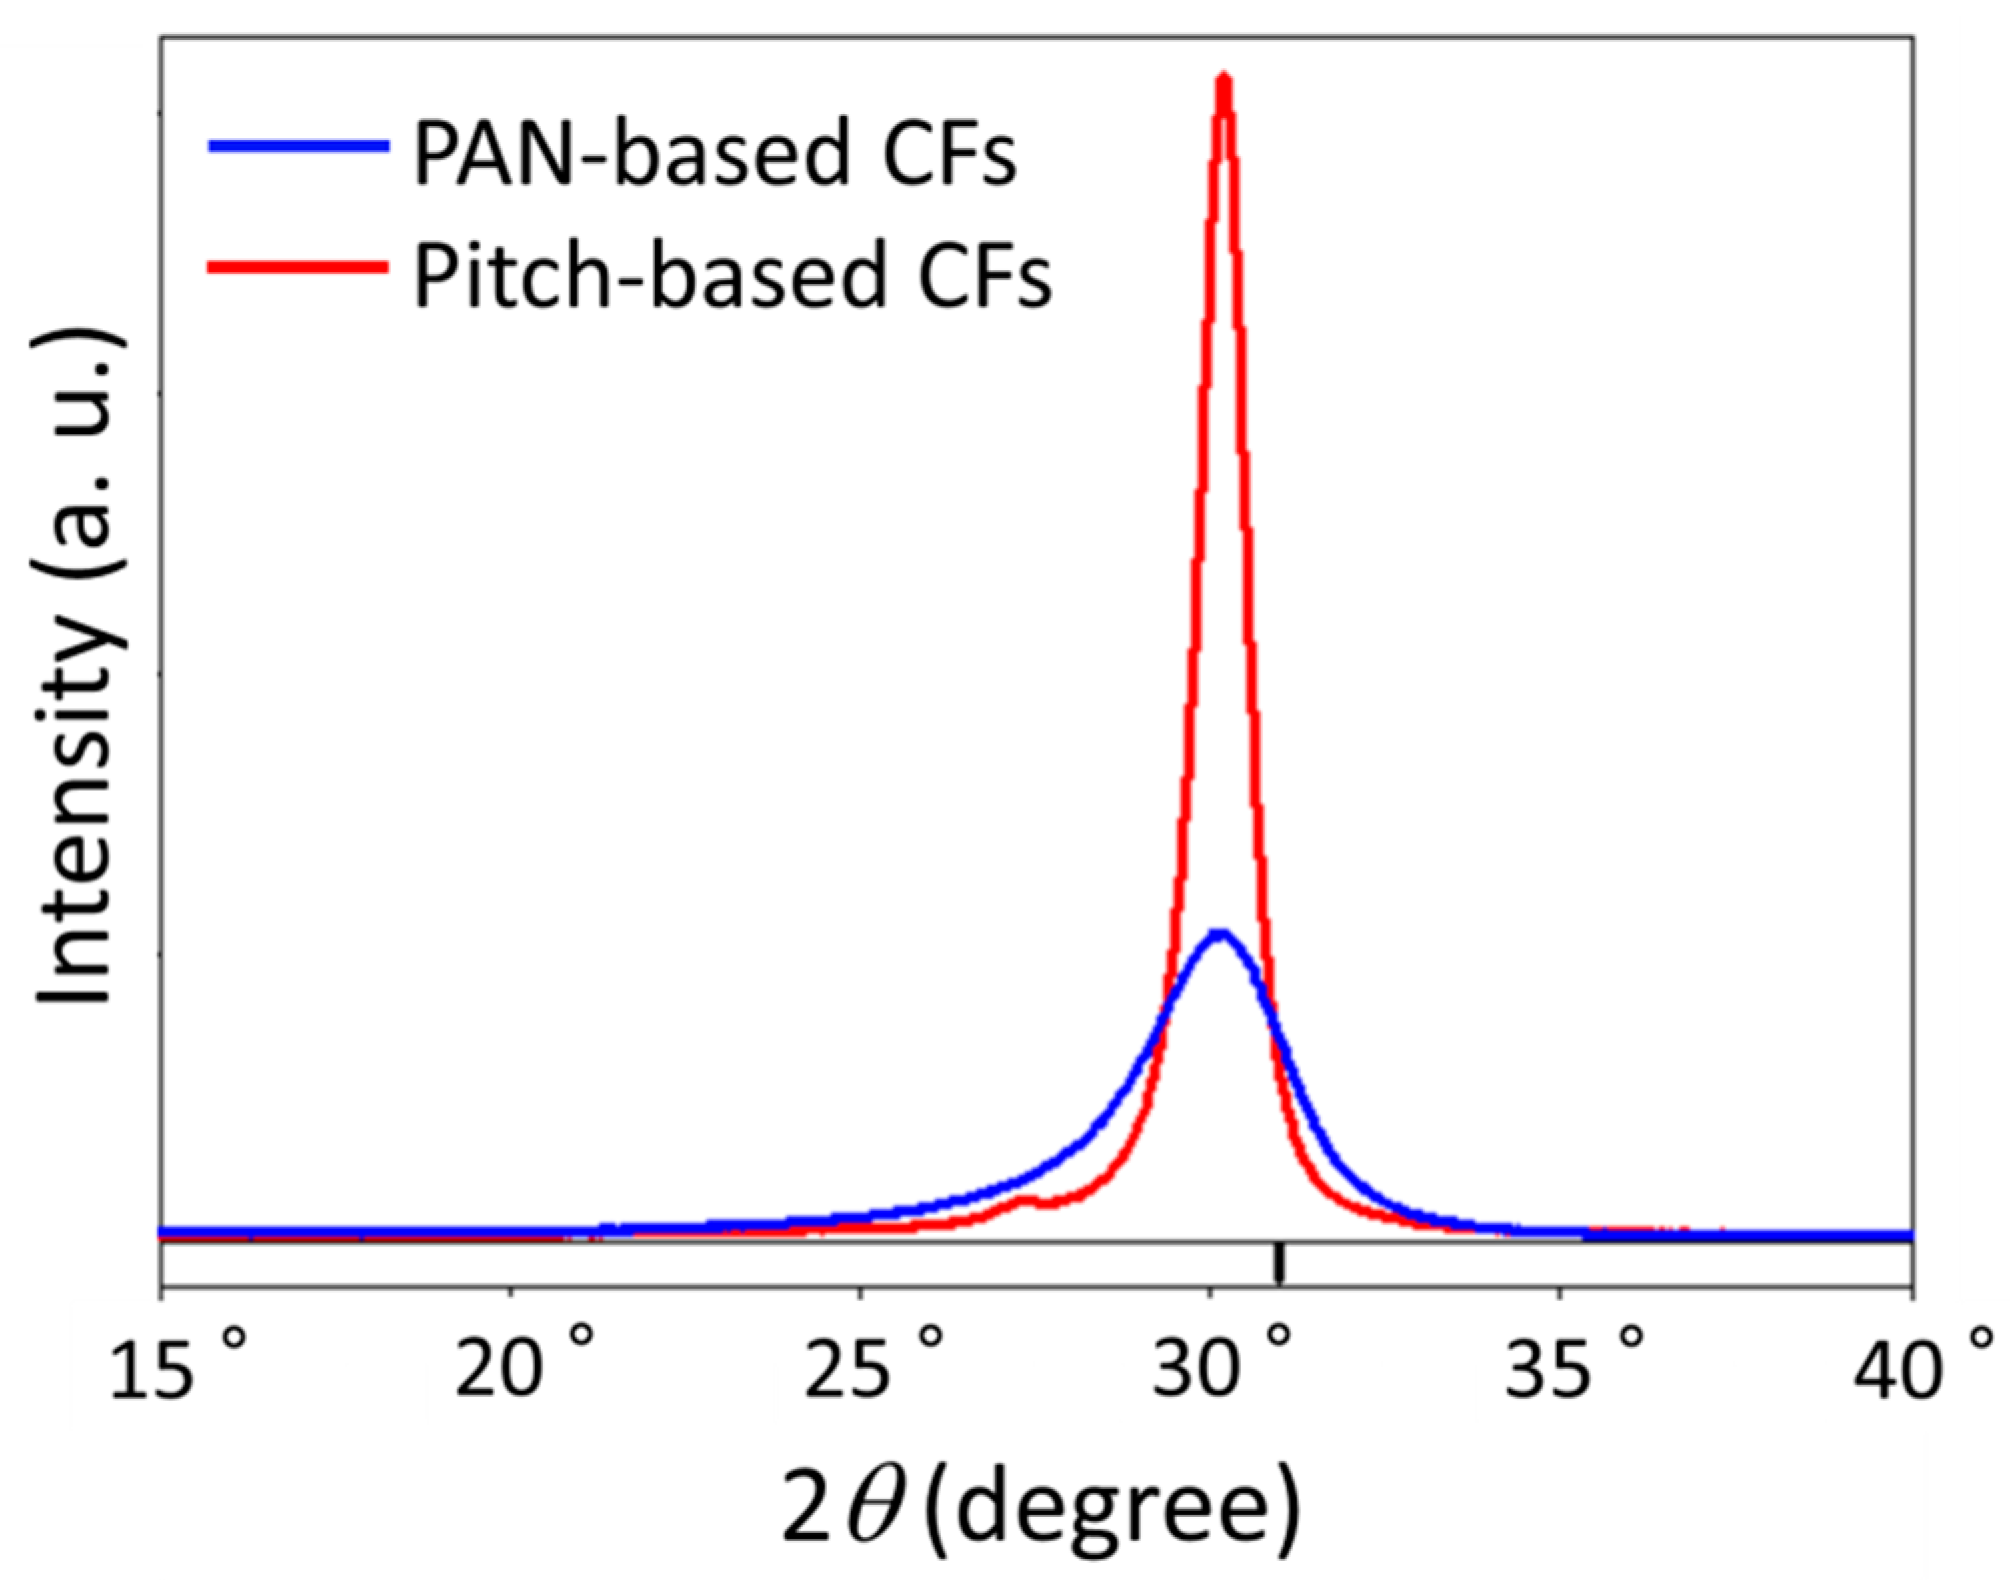
Figure 4 shows the XRD patterns of the PAN- and pitch-based CFs. The bar in Figure 4 denotes the XRD peak position of the (002) plane of the graphite in a previous study [22]. The lattice spacing of the (002) plane of the graphite (d(002)) and the size of the crystallites were calculated from the position of the peak originating from the diffraction of the (002) planes and the full width at half maximum, respectively (Table 4). The d(002) value of the pitch-based CFs is closer to those of graphite [22] than that of the PAN-based CFs. This is because the raw material of the pitch-based CFs contains aromatic moieties, while that of the PAN-based CFs is composed of a linear carbon backbone [3].
From the above results, it was found that the scale of the stack size of graphene sheets along the c axis of graphite (crystallite size, PAN: 4.06 nm, pitch: 12.3 nm) is considerably different from those of the π-orbital-oriented domains (PAN: < 40 nm, pitch: 100 nm–1 μm). It is considered that pitch-based CFs with larger domains cause larger stress at the domain boundary due to the fact that contraction in the c-axis direction during graphitization results in high tensile modulus. On the other hand, it is considered that the amount and distribution of defects and voids, which are more likely to generate at such boundaries, influence the tensile strength of PAN- and pitch based CFs. In addition, the size and distribution of π-orbital-oriented domains could be investigated by STXM. Although there are a few techniques for investigating the π-orbital-oriented domains in CFs on a submicron scale, we recommend STXM for the concurrent elucidation of the crystallite size and the characteristics (size and distribution) of the π-orbital-oriented domains, which are important when considering the mechanical properties of CFs.

4. Conclusions

Using STXM and two orthogonal linearly polarized X-rays, we performed carbon chemical structure mapping of the cross and longitudinal sections of PAN- and pitch-based CFs, both with similar elastic modulus. The results showed that the distribution of the π-orbital-oriented domains in the CFs varied considerably, depending on the raw material. In contrast, no difference in the distribution of the σ-orbital orientations between the PAN- and pitch-based CFs could be observed. With respect to the PAN-based CFs, the graphene sheet structure was distributed along the fiber axis direction, and the cross section consisted of randomly distributed domains with sizes less than approximately 50 nm, as reported in a previous study [19]. By contrast, the pitch-based CFs were composed of aggregates of graphite domains with π-orbital-oriented domains in the cross sections ranging from ~100 nm to 1 μm. It was confirmed that these domains exhibited a striped shape with a width of 200–300 nm along the CF axis (longitudinal section). The size and distribution of the π-orbital-oriented domains, in addition to the crystallite sizes, may be the determining factors of the mechanical properties of the CFs.
The use of STXM can provide information on the chemical structure of various molecules. In particular, STXM will be indispensable in clarifying and proposing design guidelines for other highly functional materials, when chemical structures, such as π-orbital-oriented domains, are closely related with macroscopic properties.

Author Contributions

Conceptualization, T.H., M.U., Y.A., R.M., and N.N.; methodology, Y.T. and M.K.; software, Y.T.; validation, T.H., Y.T., and M.K.; data curation, T.H. and Y.T.; writing—original draft preparation, T.H. and M.K.; writing—review and editing, T.H., Y.T., M.U., Y.A., and R.M.; visualization, T.H.; supervision, M.K.; project administration, R.M. and M.K.; funding acquisition, R.M. and M.K. All authors read and agreed to the published version of the manuscript.

Funding

This research received no external funding.

Acknowledgments

We are grateful to Takafumi Takahashi and Koji Kanehashi (Nippon Steel Corporation) for discussions in this study. We would like to thank Yuri Mizuo, Eiji Oda, Tetsuya Nagai, and Shuichi Moriwake (Nippon Steel Technology Co. Ltd.) for useful discussions and support on the manufacturing process of CFs. The technical advice and support received from Kazuhiko Mase at BL-13A (KEK) is also gratefully acknowledged. The experiment was conducted with the approval of the Photon Factory Program Advisory Committee (proposal nos. 2015C206 and 2019C202).

Conflicts of Interest

The authors declare no conflict of interest.

References

  1. Miller, B.; Muri, P.; Rebenfeld, L. A microbond method for determination of the shear strength of a fiber/resin interface. Compos. Sci. Technol. 1987, 28, 17–32. [Google Scholar] [CrossRef]
  2. Otani, S.; Oya, A. Progress of Pitch-Based Carbon Fiber in Japan. ACS Symp. Ser. 1986, 303, 323–334. [Google Scholar]
  3. Soo-Jin, P. Carbon Fibers; Springer Singapore: Gateway East, Singapore, 2018; pp. 101–133. [Google Scholar]
  4. Dongxing, Y.; Velamakanni, A.; Bozoklu, G.; Park, S.; Stoller, M.; Piner, R.D.; Stankovich, S.; Jung, I.; Field, D.A.; Ventrice, C.A.; et al. Chemical analysis of graphene oxide films after heat and chemical treatments by X-ray photoelectron and Micro-Raman spectroscopy. Carbon 2009, 47, 145–152. [Google Scholar]
  5. Boudou, J.P.; Parent, P.; Suarez-Garcia, F.; Villar-Rodil, S.; Martinez-Alonso, A.; Tascon, J.M.D. Nitrogen in aramid-based activated carbon fibers by TPD, XPS and XANES. Carbon 2006, 44, 2452–2462. [Google Scholar] [CrossRef] [Green Version]
  6. Ponsonnet, L.; Donnet, C.; Varlot, K.; Martin, J.M.; Grill, A.; Patel, V. EELS analysis of hydrogenated diamond-like carbon films. Thin Solid Films 1998, 319, 97–100. [Google Scholar] [CrossRef]
  7. Hitchcock, A.P. Soft X-ray imaging and spectromicroscopy. In Handbook of Nanoscopy; Van Tendeloo, G., Dyck, D.V., Pennycook, S.J., Eds.; Wiley Online Library: Hoboken, NJ, USA, 2012; Volume 2, pp. 745–791. [Google Scholar]
  8. Fernandez, M.P.; Black, C.; Dawson, J.; Gibbs, D.; Kanczler, J.; Oreffo, R.O.C.; Tozzi, G. Exploratory full-field strain analysis of regenerated bone tissue from osteoinductive biomaterials. Materials 2020, 13. [Google Scholar]
  9. Minxiang, Z.; Shah, S.A.; Dali, H.; Parviz, D.; Yi-Hsien, Y.; Xuezhen, W.; Green, M.J.; Zhengdong, C. Aqueous exfoliation of graphite into graphene assisted by sulfonyl graphene quantum dots for photonic crystal applications. ACS Appl. Mater. Interfaces 2017, 9, 30797–30804. [Google Scholar]
  10. Jood, P.; Mehta, R.J.; Yanliang, Z.; Peleckis, G.; Xiaolin, W.; Siegel, R.W.; Borca-Tasciuc, T.; Dou, S.X.; Ramanath, G. Al-doped zinc oxide nanocomposites with enhanced thermoelectric properties. Nano Lett. 2011, 11, 4337–4342. [Google Scholar] [CrossRef] [PubMed]
  11. Minxiang, Z.; Yanliang, Z. Colloidal nanoparticle inks for printing functional devices: emerging trends and future prospects. J. Mater. Chem. A 2019, 7, 23301–23336. [Google Scholar]
  12. Rouzaud, J.-N. Conribution of Transmission Electron Microscopy to the study of the coal carbonization processes. Fuel Process. Technol. 1990, 24, 55–69. [Google Scholar] [CrossRef]
  13. Takeichi, Y.; Inami, N.; Suga, H.; Miyamoto, C.; Ueno, T.; Mase, K.; Takahashi, Y.; Ono, K. Design and performance of a compact scanning transmission X-ray microscope at the Photon Factory. Rev. Sci. Instrum. 2016, 87, 013704-1–013704-7. [Google Scholar] [CrossRef] [PubMed]
  14. Sasaki, S.; Kakuno, K.; Takada, T.; Shimada, T.; Yanagida, K.; Miyahara, Y. Design of a new type of planar undulator for generating variably polarized radiation. Nucl. Instrum. Methods Phys. Res. Sect. A 1993, 331, 763–767. [Google Scholar] [CrossRef]
  15. Stöhr, J. NEXAFS Spectroscopy; Springer: Berlin, Germany, 1992; pp. 169–172; 96–126. [Google Scholar]
  16. Ohigashi, T.; Nagasaka, M.; Horigome, T.; Kosugi, N.; Rosendahl, S.M.; Hitchcock, A.P. Development of in-situ sample cells for scanning transmission X-ray microscopy. In Proceedings of the 12th International Conference on Synchrotron Radiation Instrumentation (SRI), New York, NY, USA, 6–10 July 2015; pp. 050002-1–050002-4. [Google Scholar]
  17. Watts, B.; Schuettfor, T.; McNeill, C.R. Mapping of Domain Orientation and Molecular Order in Polycrystalline Semiconducting Polymer Films with Soft X-ray Microscopy. Adv. Funct. Mater. 2011, 21, 1122–1131. [Google Scholar] [CrossRef]
  18. Watts, B.; McNeill, C.R.; Raabe, J. Imaging nanostructures in organic semiconductor films with scanning transmission X-ray spectro-microscopy. Synth. Met. 2012, 161, 2516–2520. [Google Scholar] [CrossRef]
  19. Harano, T.; Murao, R.; Takeichi, Y.; Kimura, M.; Takahashi, Y. Observation of the Interface between Resin and Carbon Fiber by Scanning Transmission X-ray Microscopy. In Proceedings of the 13th International X-Ray Microscopy Conference (XRM), Diamond Light Source, Oxford, UK, 15–19 August 2016; pp. 012023-1–012023-4. [Google Scholar]
  20. Hitchcock, A.P. aXis 2000. Available online: http://unicorn.mcmaster.ca/aXis2000.html (accessed on 25 December 2019).
  21. Halder, N.C.; Wagner, C.N.J. Separation of particle size and lattice strain in integral breadth measurements. Acta Crystallogr. 1966, 20, 312–313. [Google Scholar] [CrossRef]
  22. Howe, J.; Rawn, C.J.; Jones, L.E.; Ow, H. Improved crystallographic data for graphite. Powder Diffr. 2003, 18, 150–154. [Google Scholar] [CrossRef]
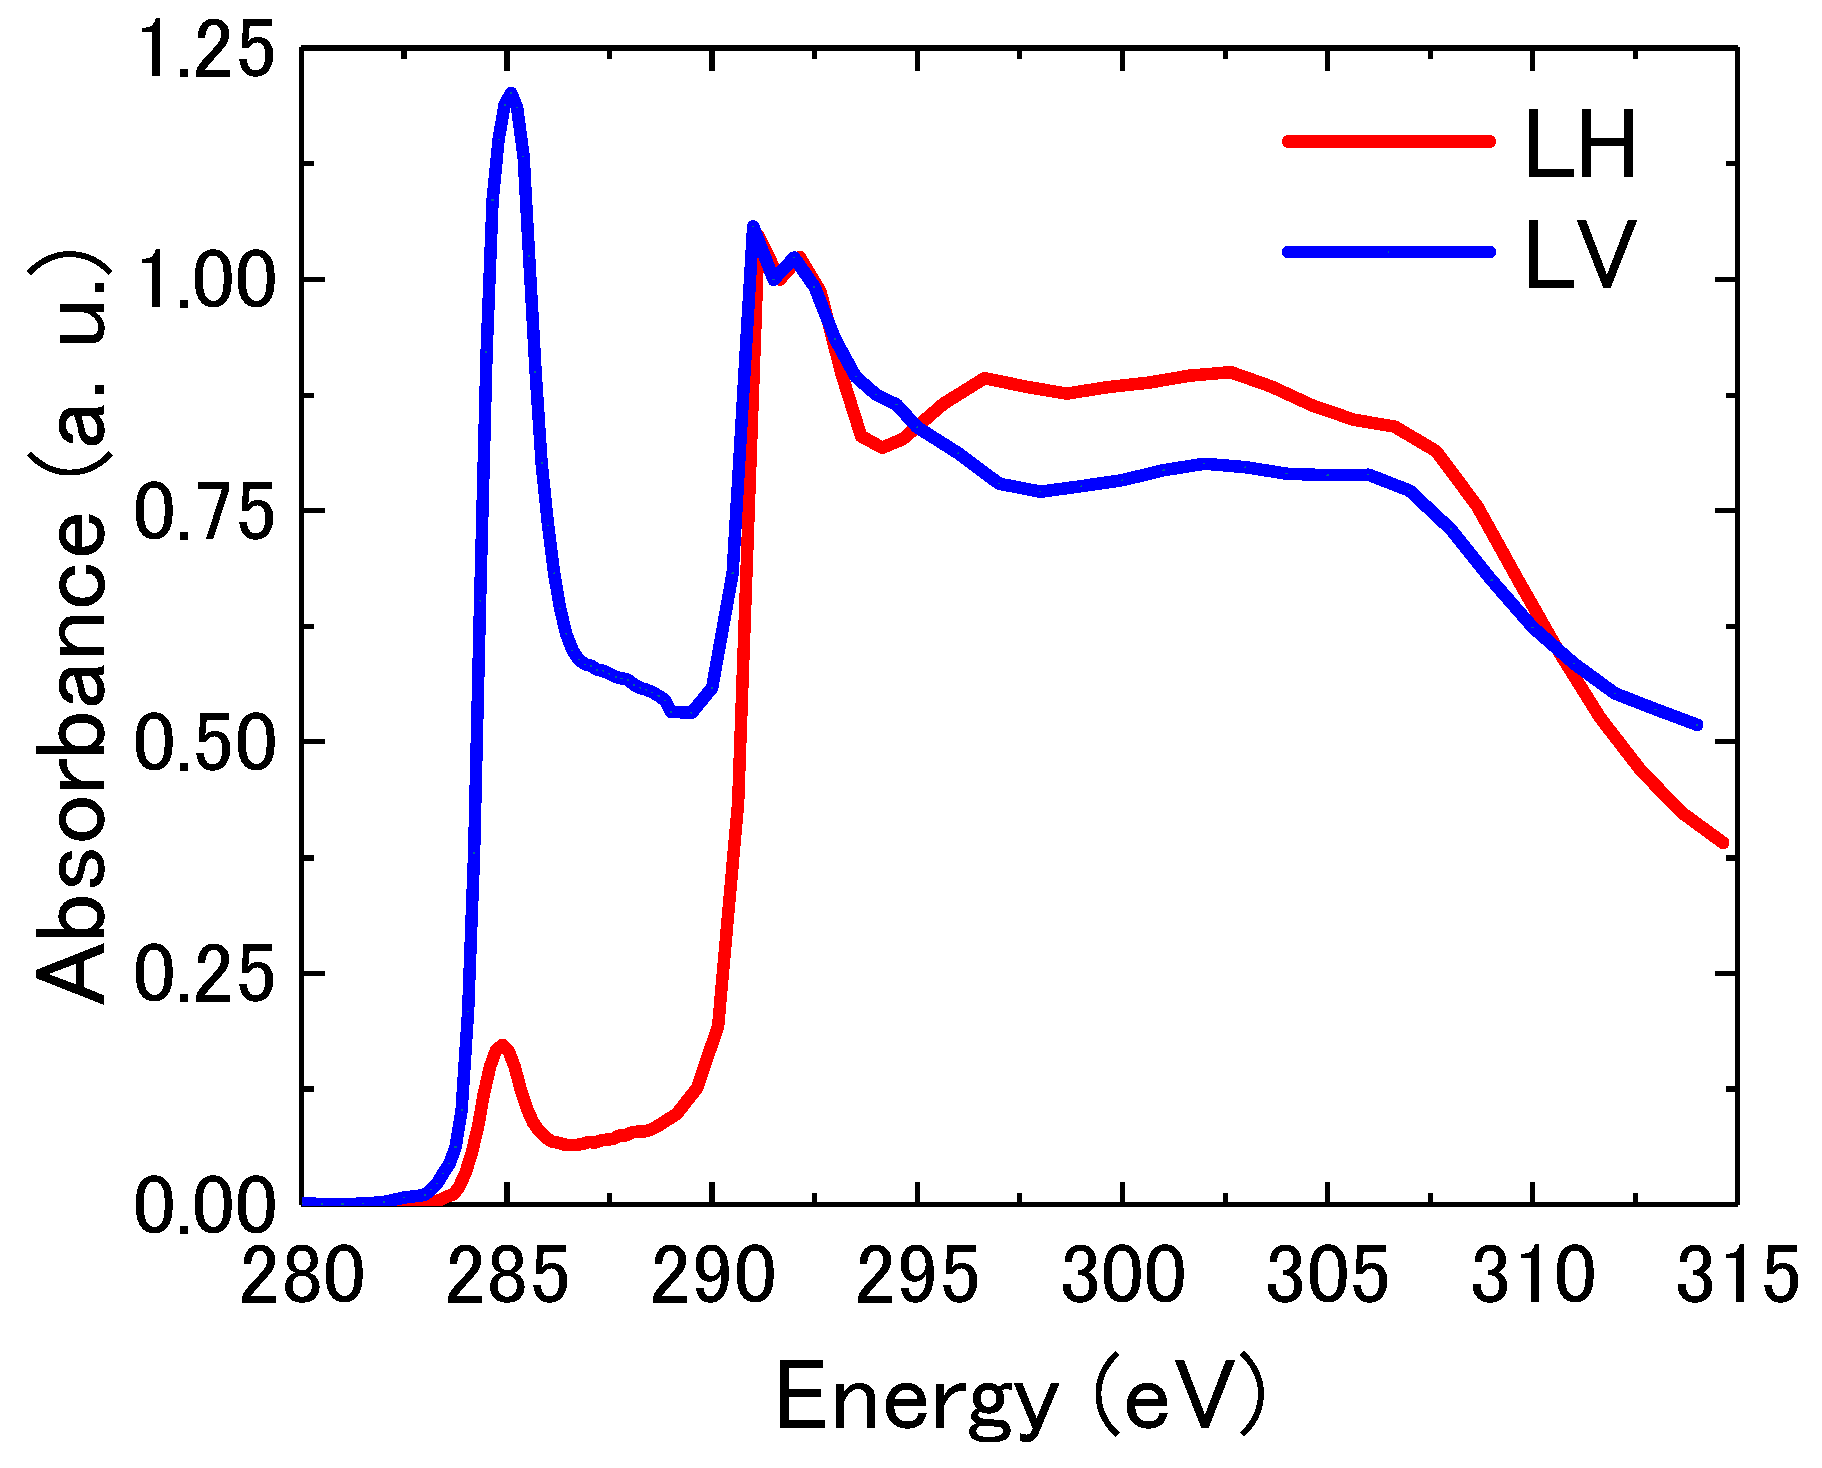
Figure 1. Average C K-edge spectra of the CF areas in b,c in Table 3.
Applsci 10 04836 g001
Figure 2. Average C K-edge spectra of the areas A to E shown in f in Table 3.
Applsci 10 04836 g002
Figure 3. Schematic of the distribution of the π-orbital-oriented domains and the stacks of graphene sheets in a single (a) PAN- and (b) pitch-based CF, respectively. The white and yellow two-way arrows represent the directions of the graphene sheets along the fiber and within the fiber cross section, respectively.
Applsci 10 04836 g003
Figure 4. XRD patterns of PAN- and pitch-based CFs. The bar denotes the XRD peak position of the (002) plane of the graphite in a previous study [22].
Applsci 10 04836 g004
Table 1. The manufacturer and physical properties of commercial polyacrylonitrile (PAN-) and pitch-based carbon fibers (CFs) in this study.
PAN-Based CFPitch-Based CF
ManufacturerToray Industries, Inc.Nippon Graphite Fiber Corporation
Product nameM46JYSH50A
Density (g/cm3)1.842.10
Tensile strength (MPa)42103830
Tensile modulus (GPa)436520
Table 2. (a), (f) TEM (bright field) images of the cross sections of the PAN- and pitch-based CFs, respectively; (be), (gj) optical density (OD) images obtained using STXM at the energies 285.4 eV (1s→π*) and 292 eV (1s→σ*) with linear horizontal (LH) and linear vertical (LV) polarized beams. (f) is rotated to align with other X-ray absorption images (g–j).
TEMSTXM (OD)
E = 285.4 eV (1s→π* (C = C))E = 292.0 eV (1s→σ* (C-C))
LHLVLHLV
PAN Applsci 10 04836 i001 Applsci 10 04836 i002 Applsci 10 04836 i003 Applsci 10 04836 i004 Applsci 10 04836 i005
(a)(b)(c)(d)(e)
Pitch Applsci 10 04836 i006 Applsci 10 04836 i007 Applsci 10 04836 i008 Applsci 10 04836 i009 Applsci 10 04836 i010
(f)(g)(h)(i)(j)
Table 3. (a), (d) Visible light microscopy images of the longitudinal sections of PAN- and pitch-based CFs, respectively, which contain the field of view of STXM (OD) images (red dotted line areas); (bc), (ef) the STXM images of PAN- and pitch-based CFs, respectively, are the OD contrast of the X-ray absorption with linear horizontal (LH) and linear vertical (LV) polarized beams.
Visible Light MicroscopySXTM (E = 285.4 eV)
LHLV
PAN Applsci 10 04836 i011 Applsci 10 04836 i012 Applsci 10 04836 i013
(a)(b)(c)
Pitch Applsci 10 04836 i014 Applsci 10 04836 i015 Applsci 10 04836 i016
(d)(e)(f)
Table 4. Values of the lattice spacing of the (002) plane of the graphite (d(002)) and crystallite size of PAN- and pitch-based CFs, and graphite from the literature.
PAN-Based CFsPitch-Based CFsGraphite
The lattice spacing of the (002) plane of the graphite (d(002)) (nm)0.3460.3440.335 [22]
Crystallite size (nm)4.112-