Hg2+ Optical Fiber Sensor Based on LSPR with PDDA-Templated AuNPs and CS/PAA Bilayers

Abstract
:1. Introduction
2. Materials and Methods
2.1. Materials
2.2. Synthesis Method of the AuNPs
2.3. Preprocessing of the Optical Fiber
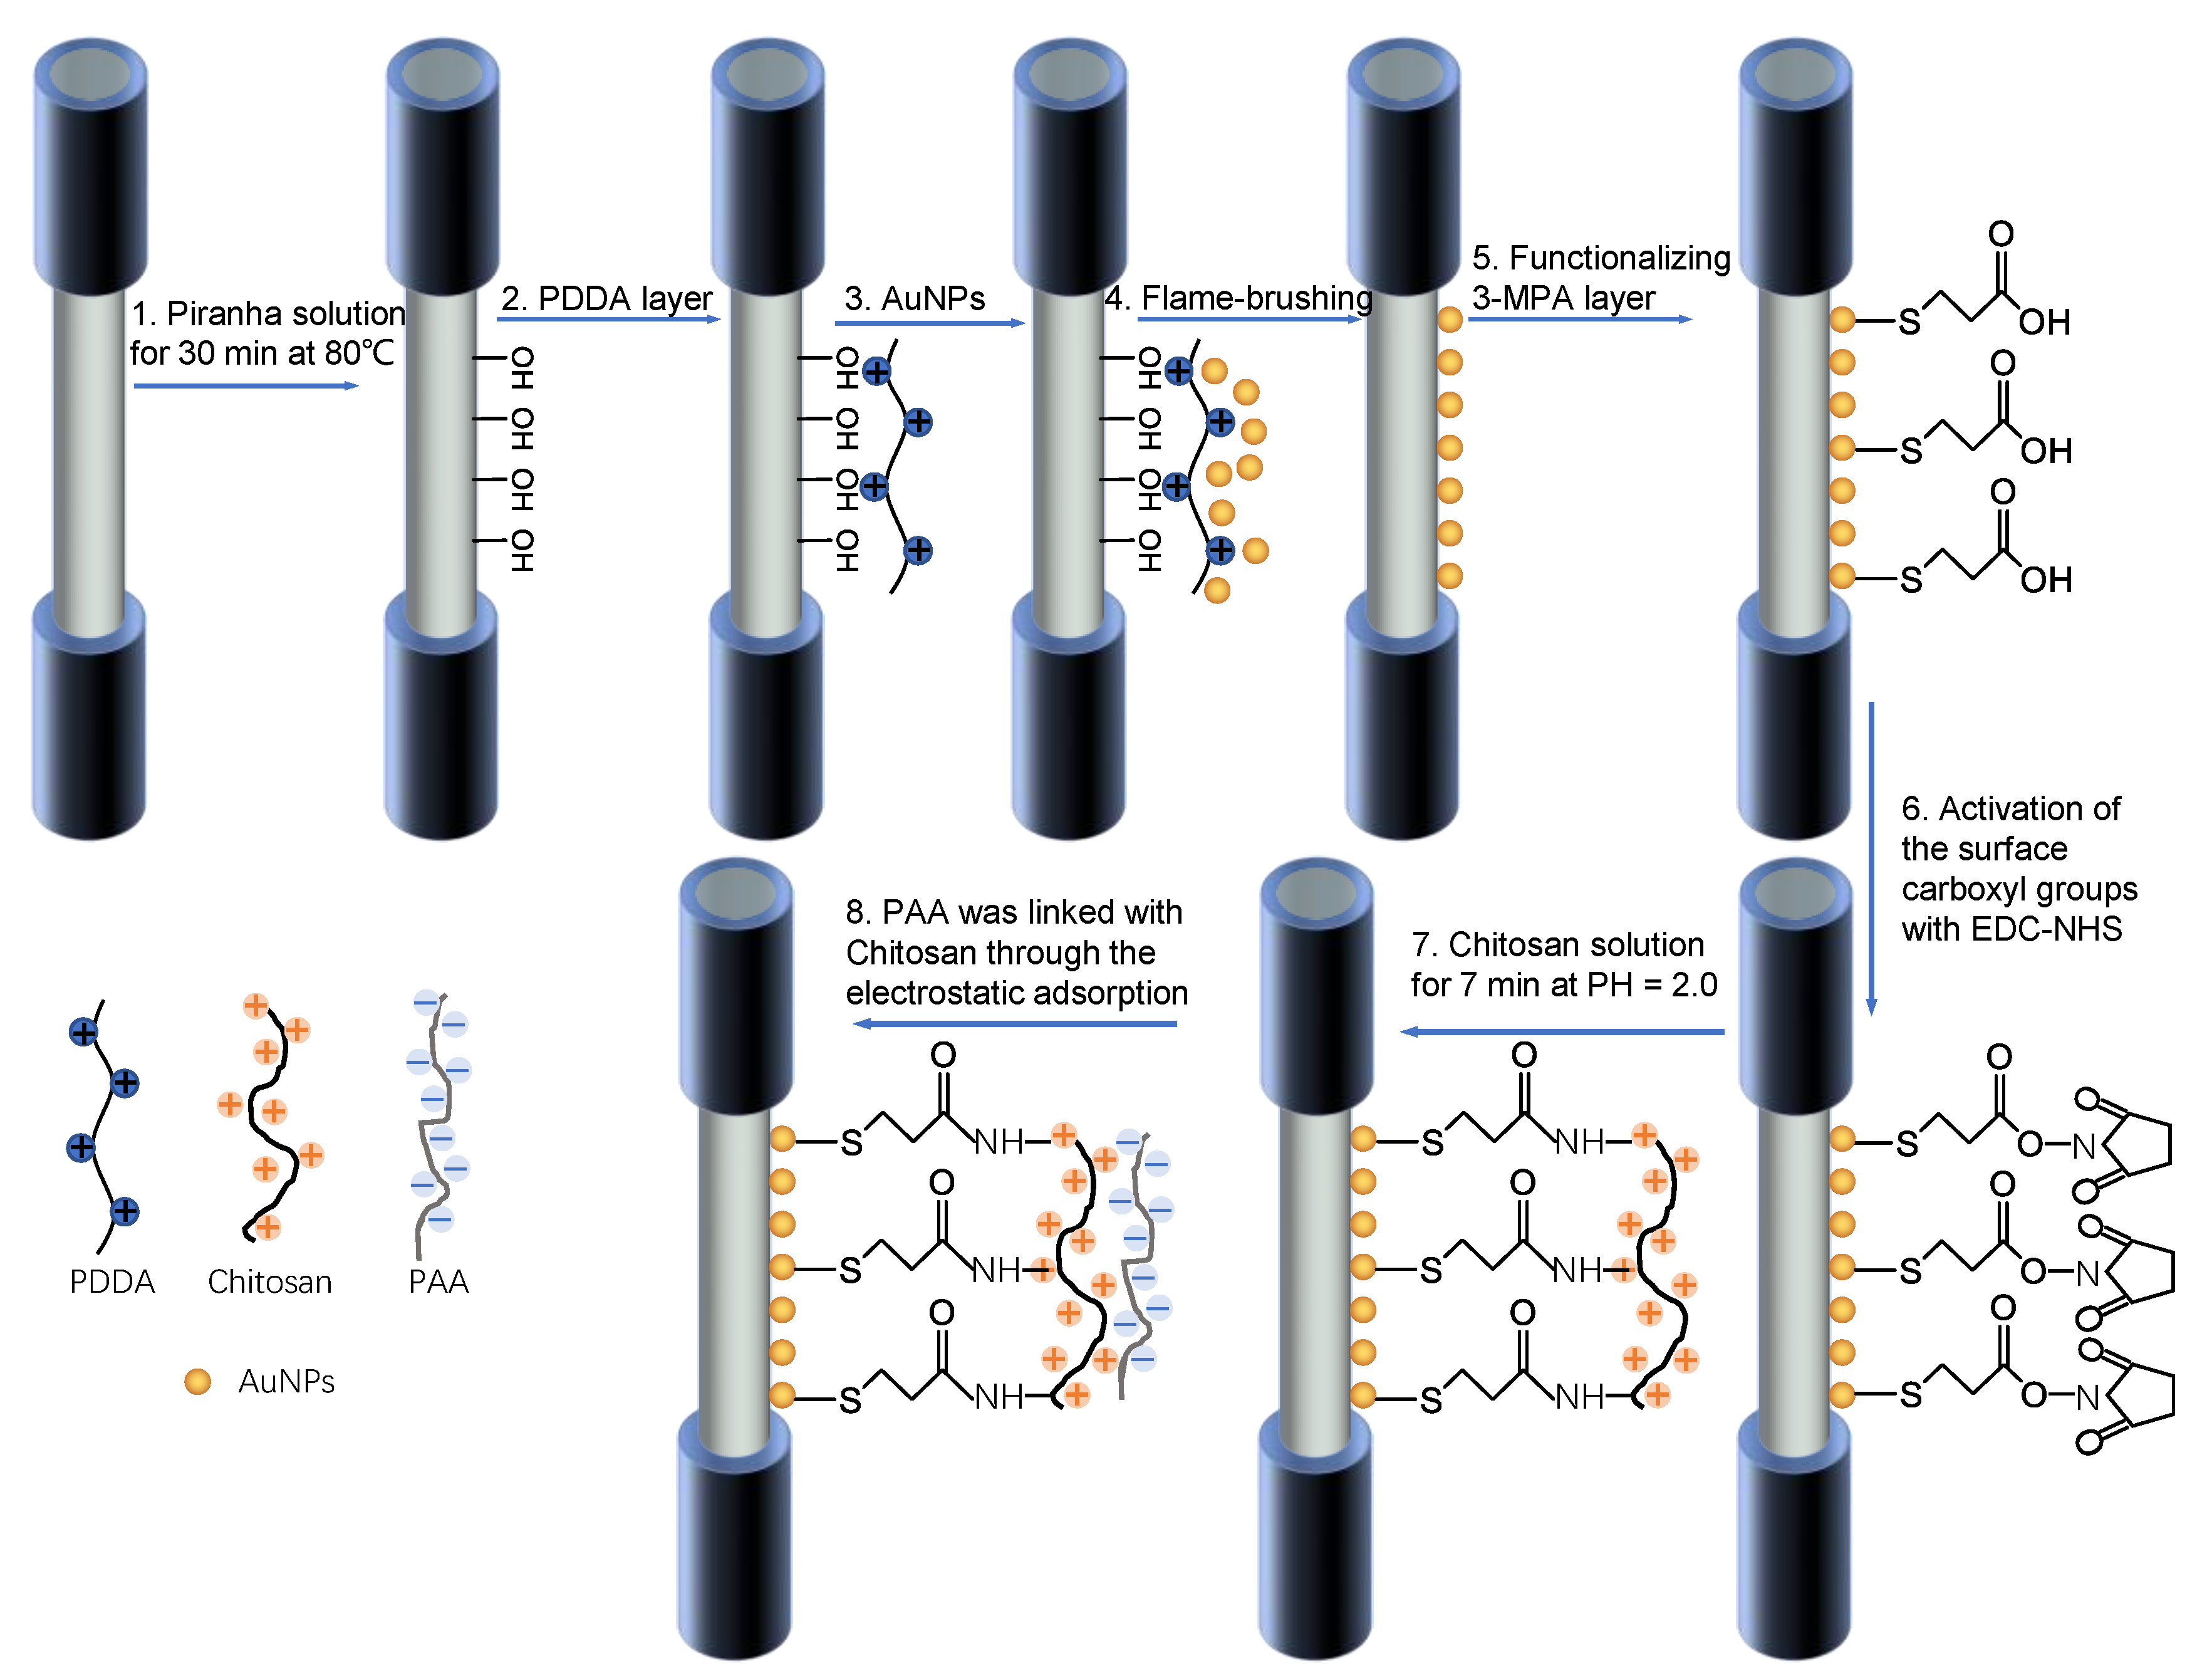
2.4. Functionalization of the Optical Fiber
2.5. Experimental Setup for the Detection of the Refractive Index and the Heavy Metal
3. Results
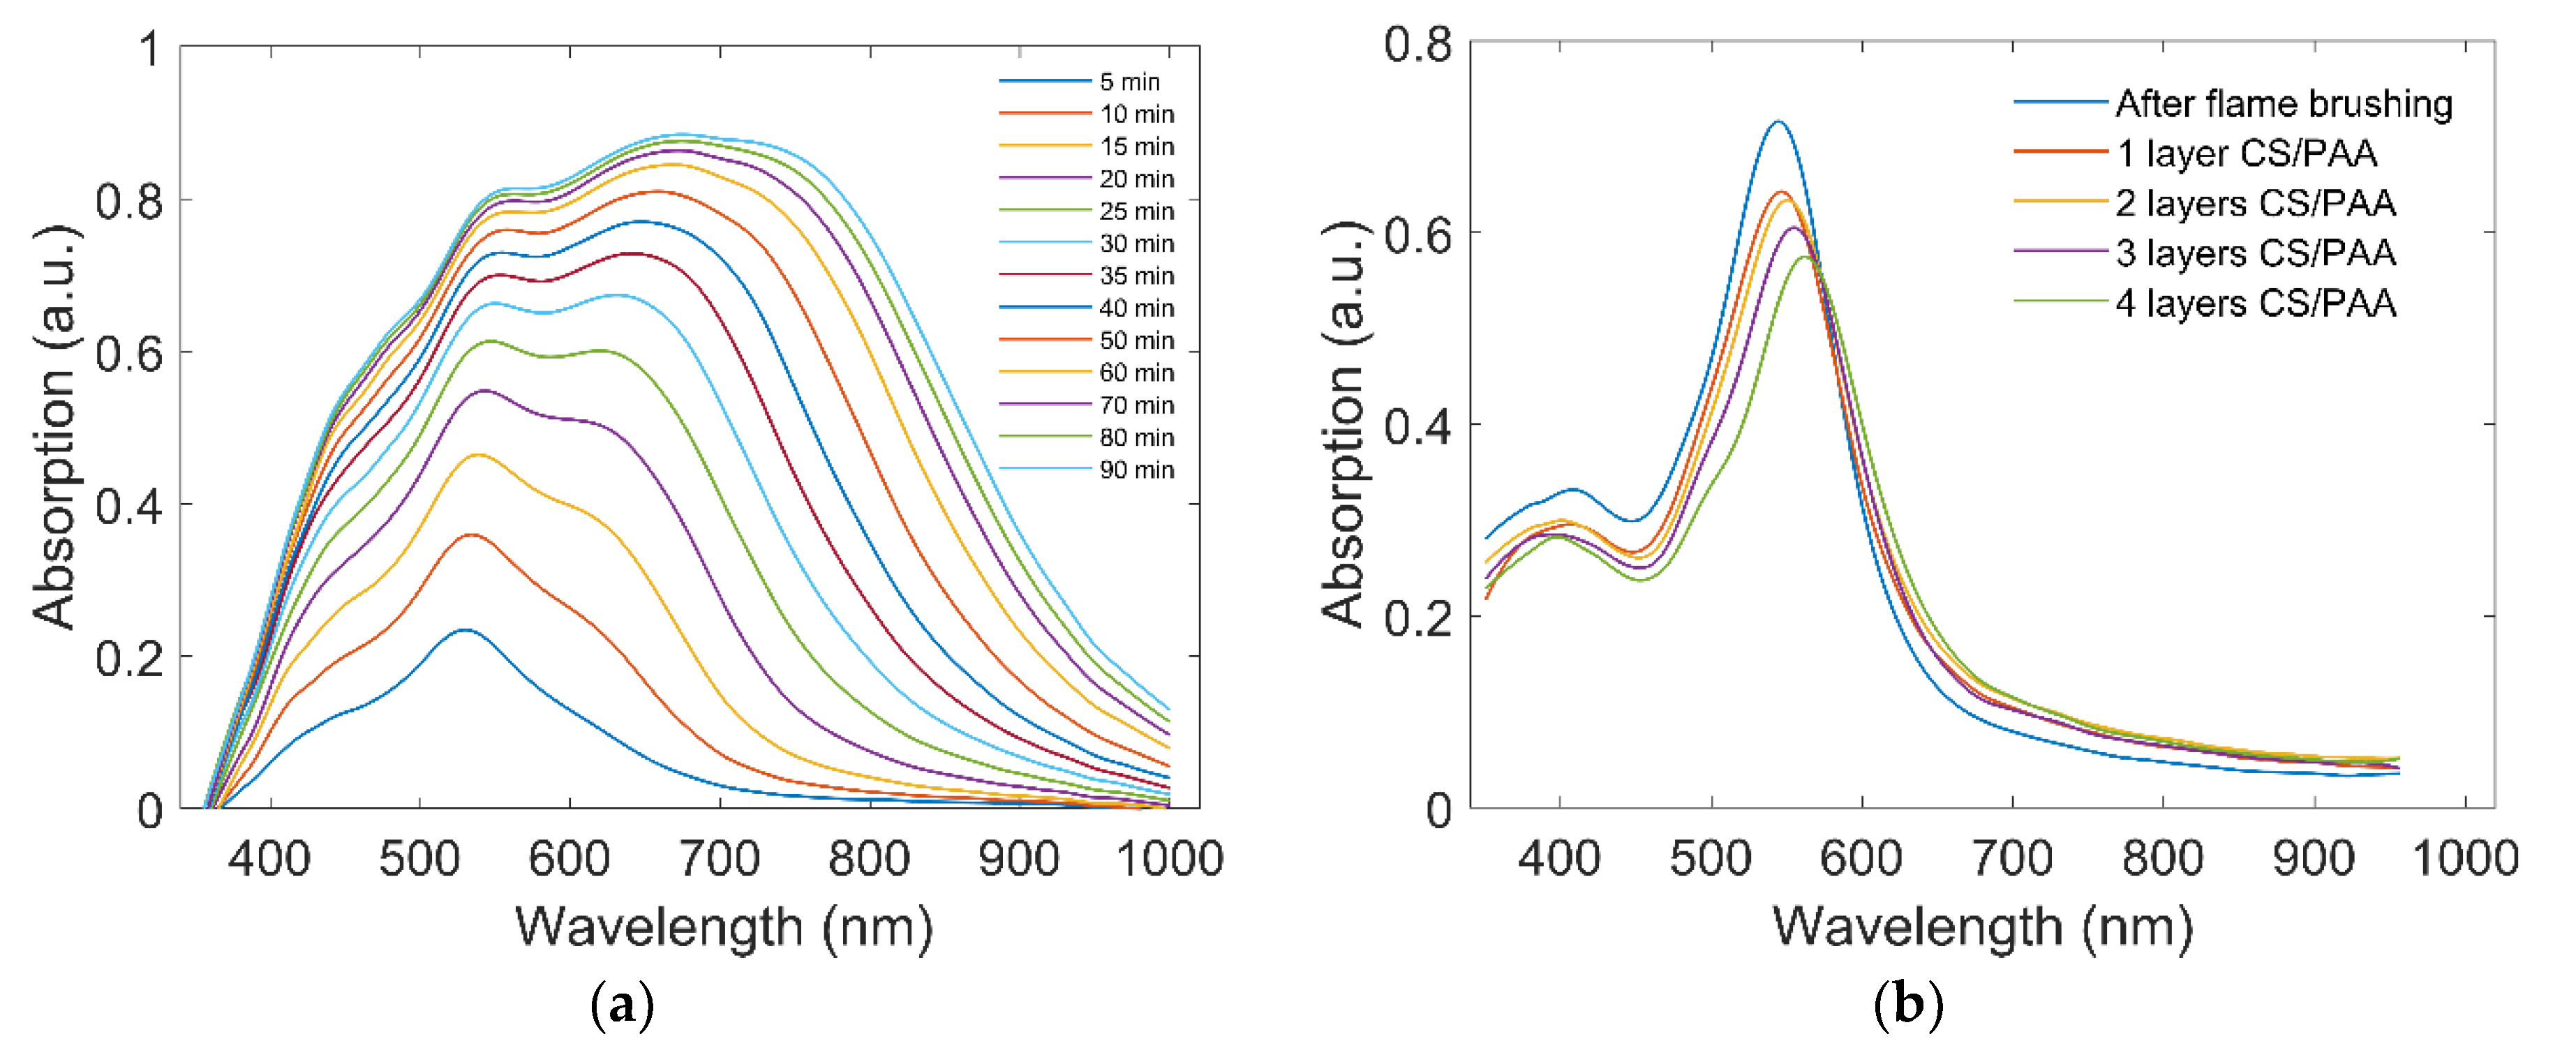
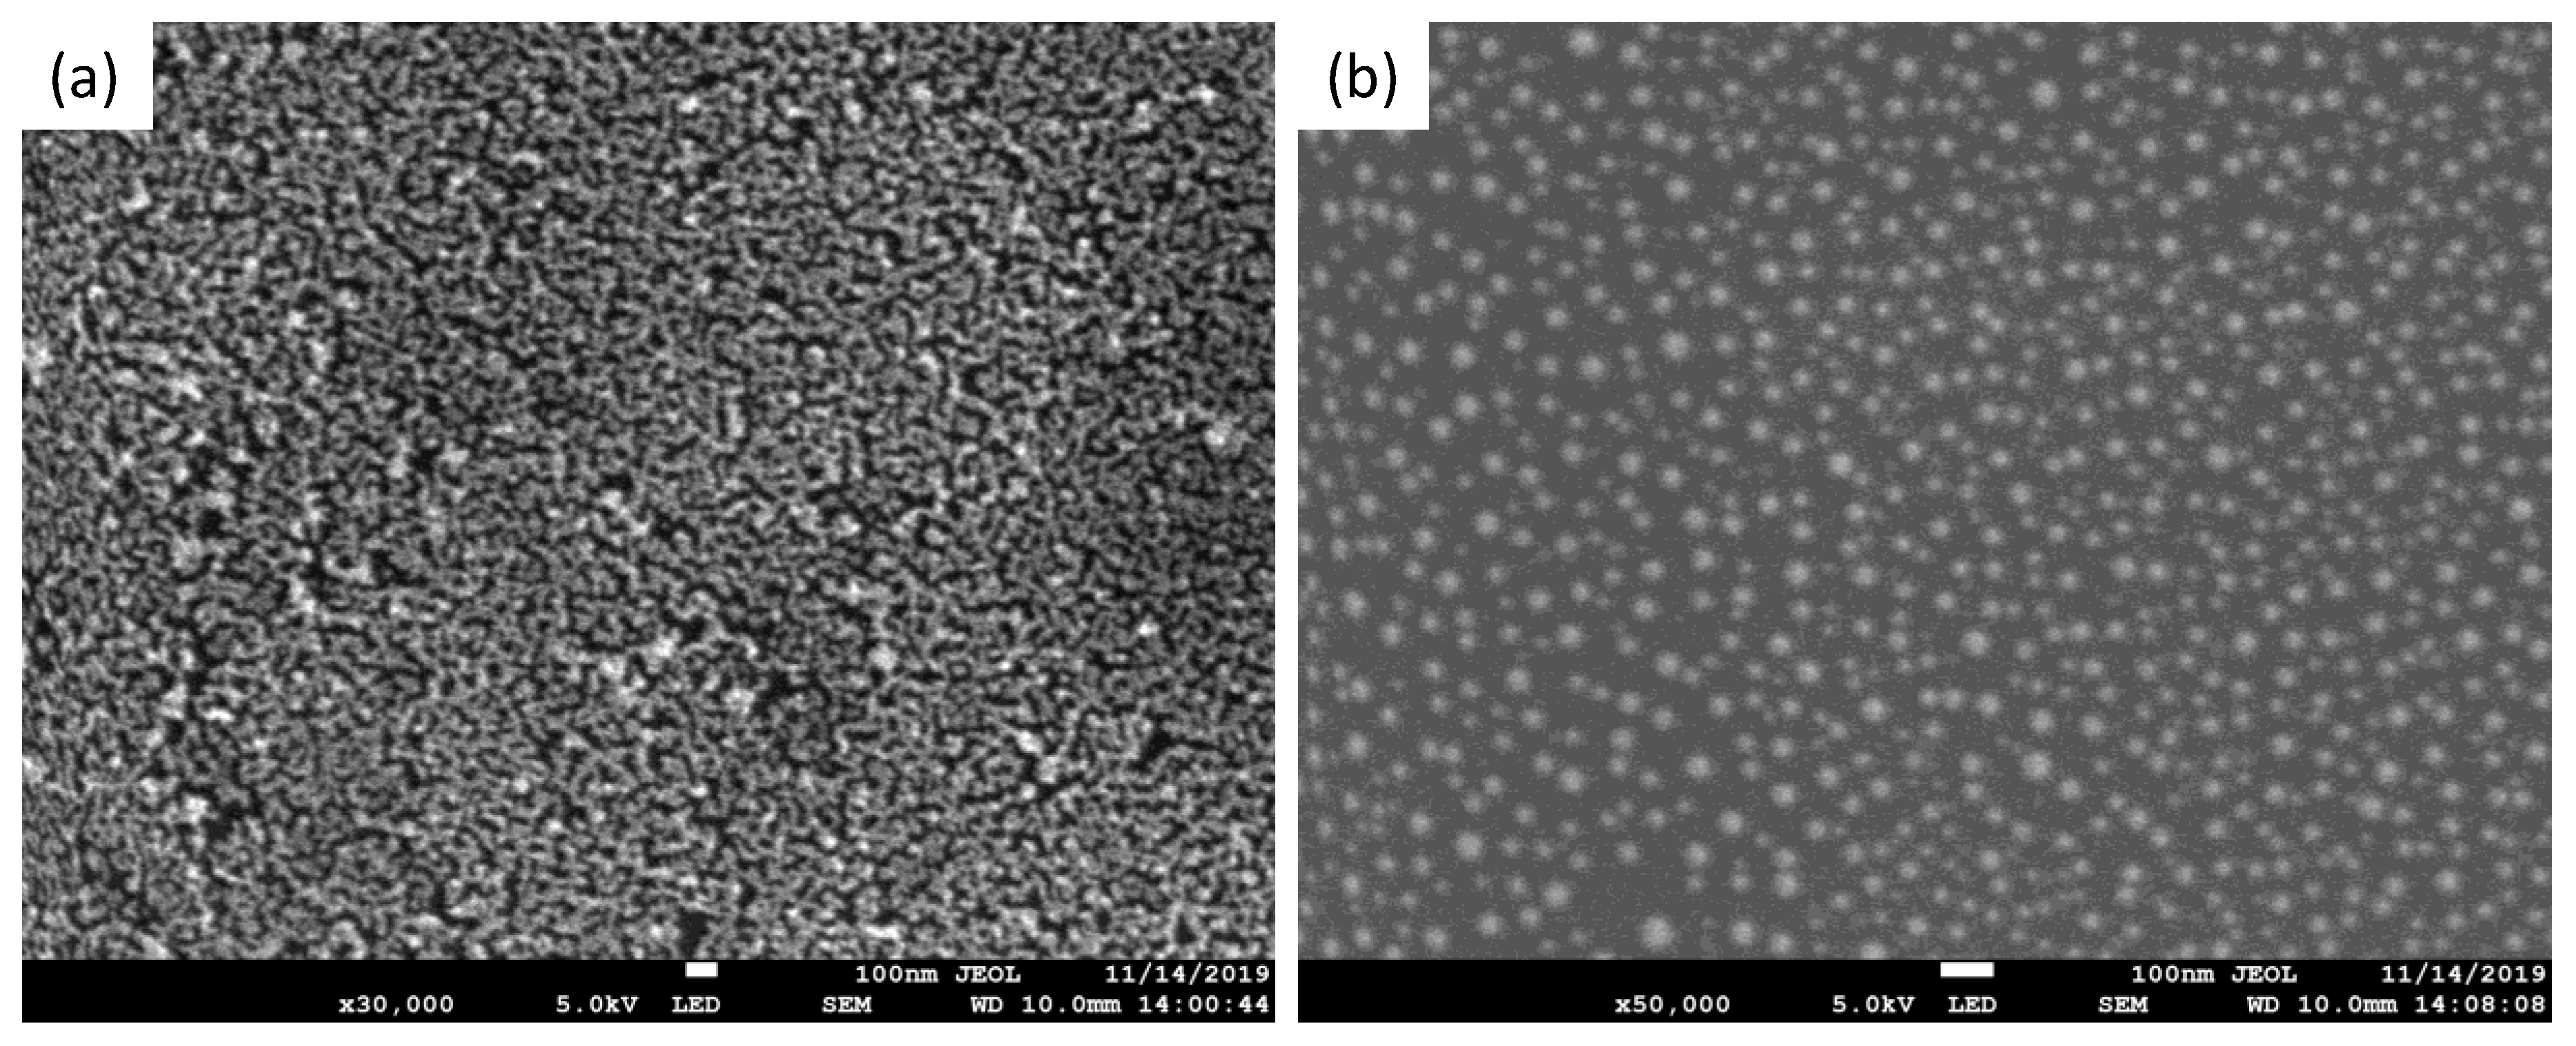
3.1. Characterization of the Sensor Device
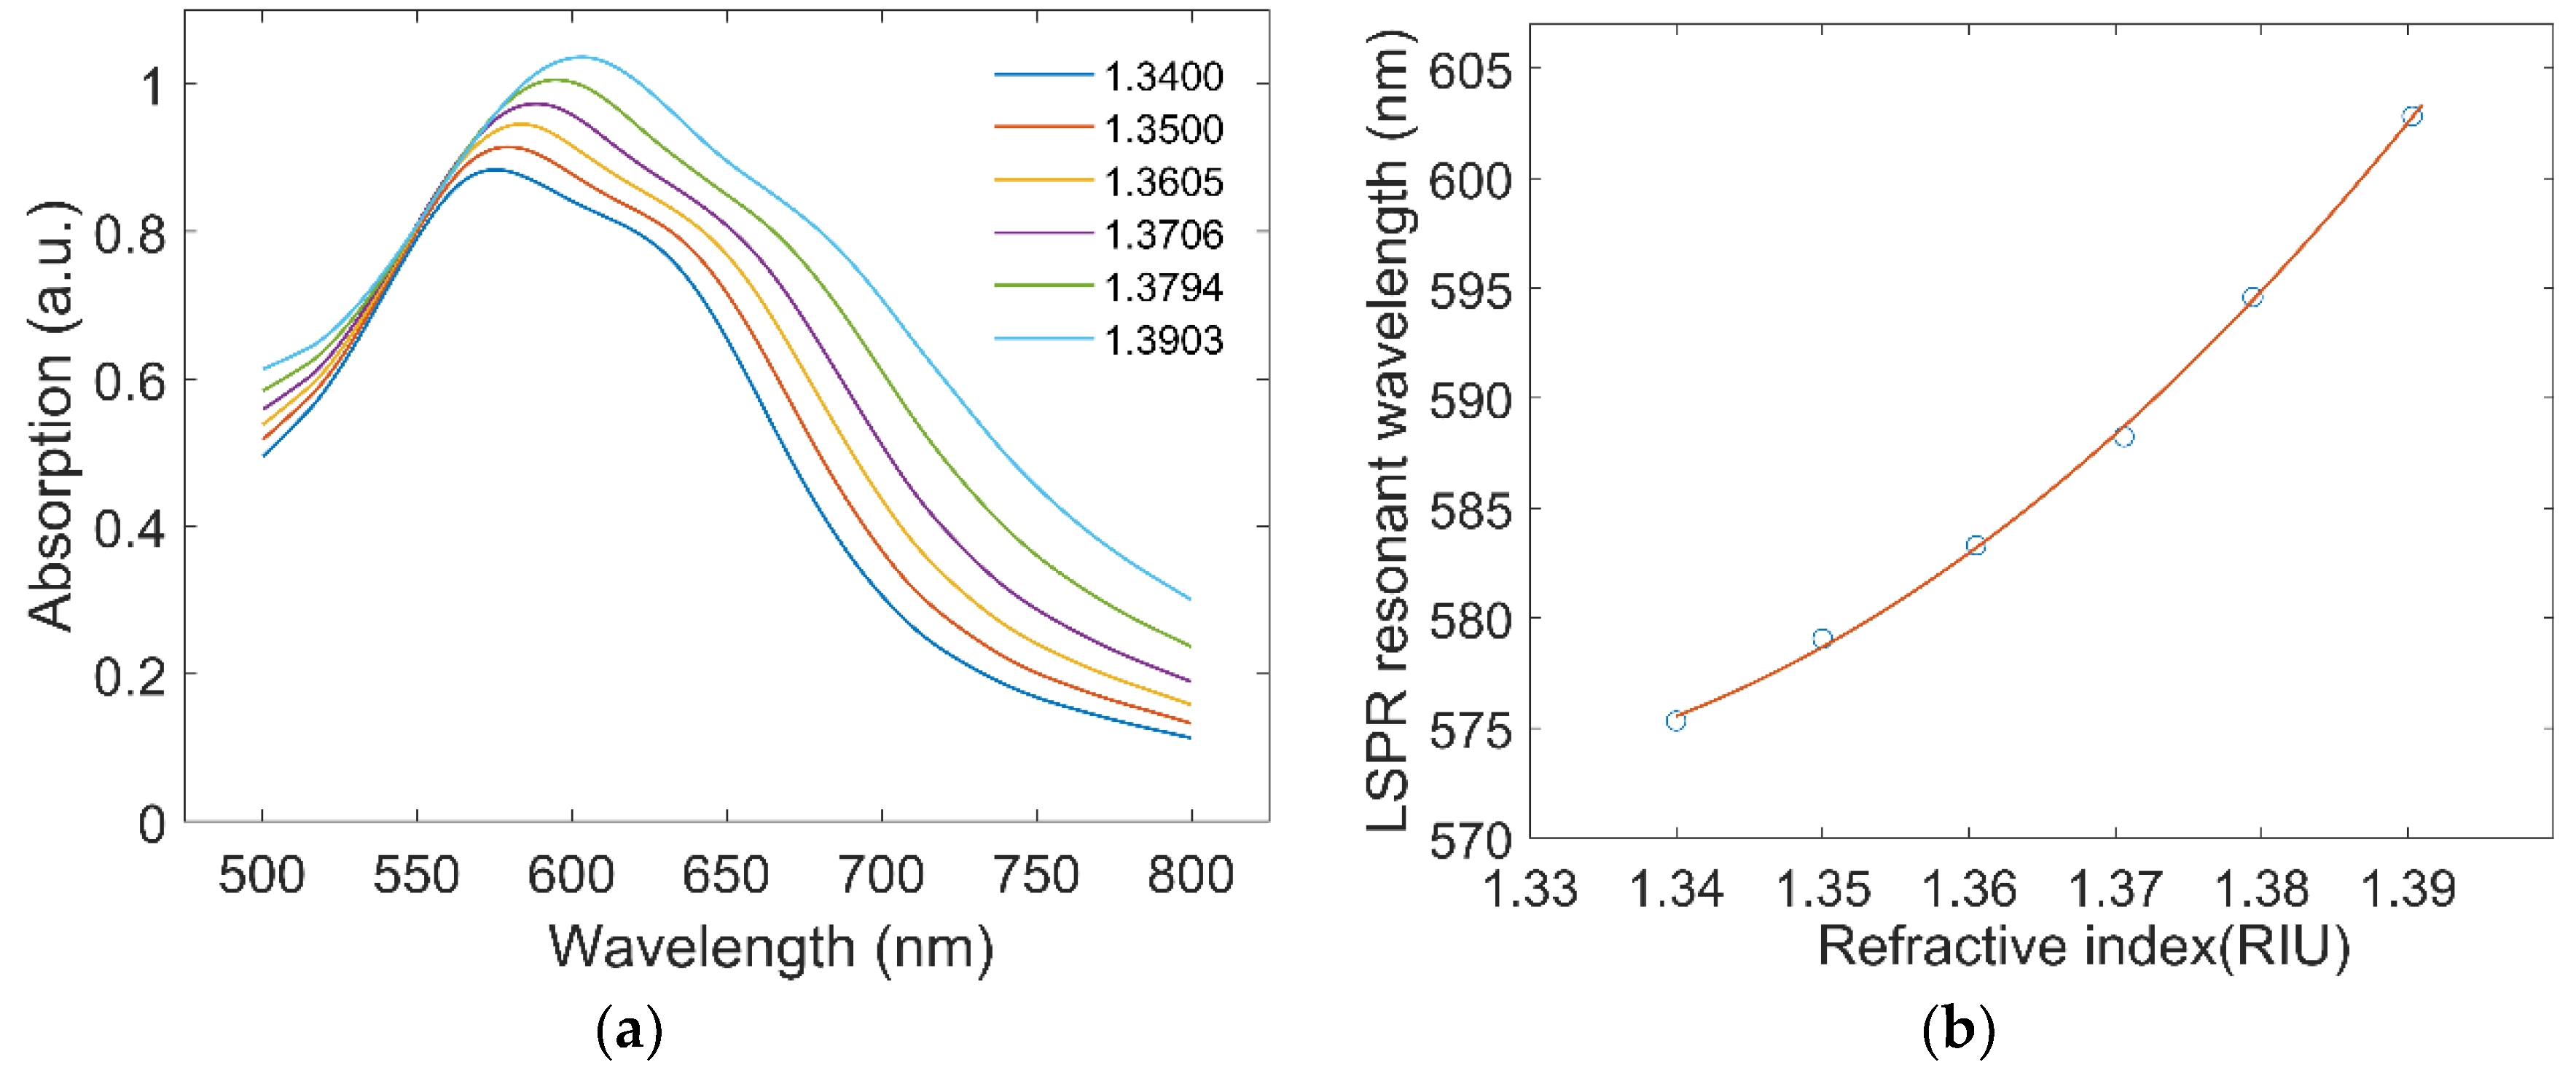
3.2. Refractive Index Response
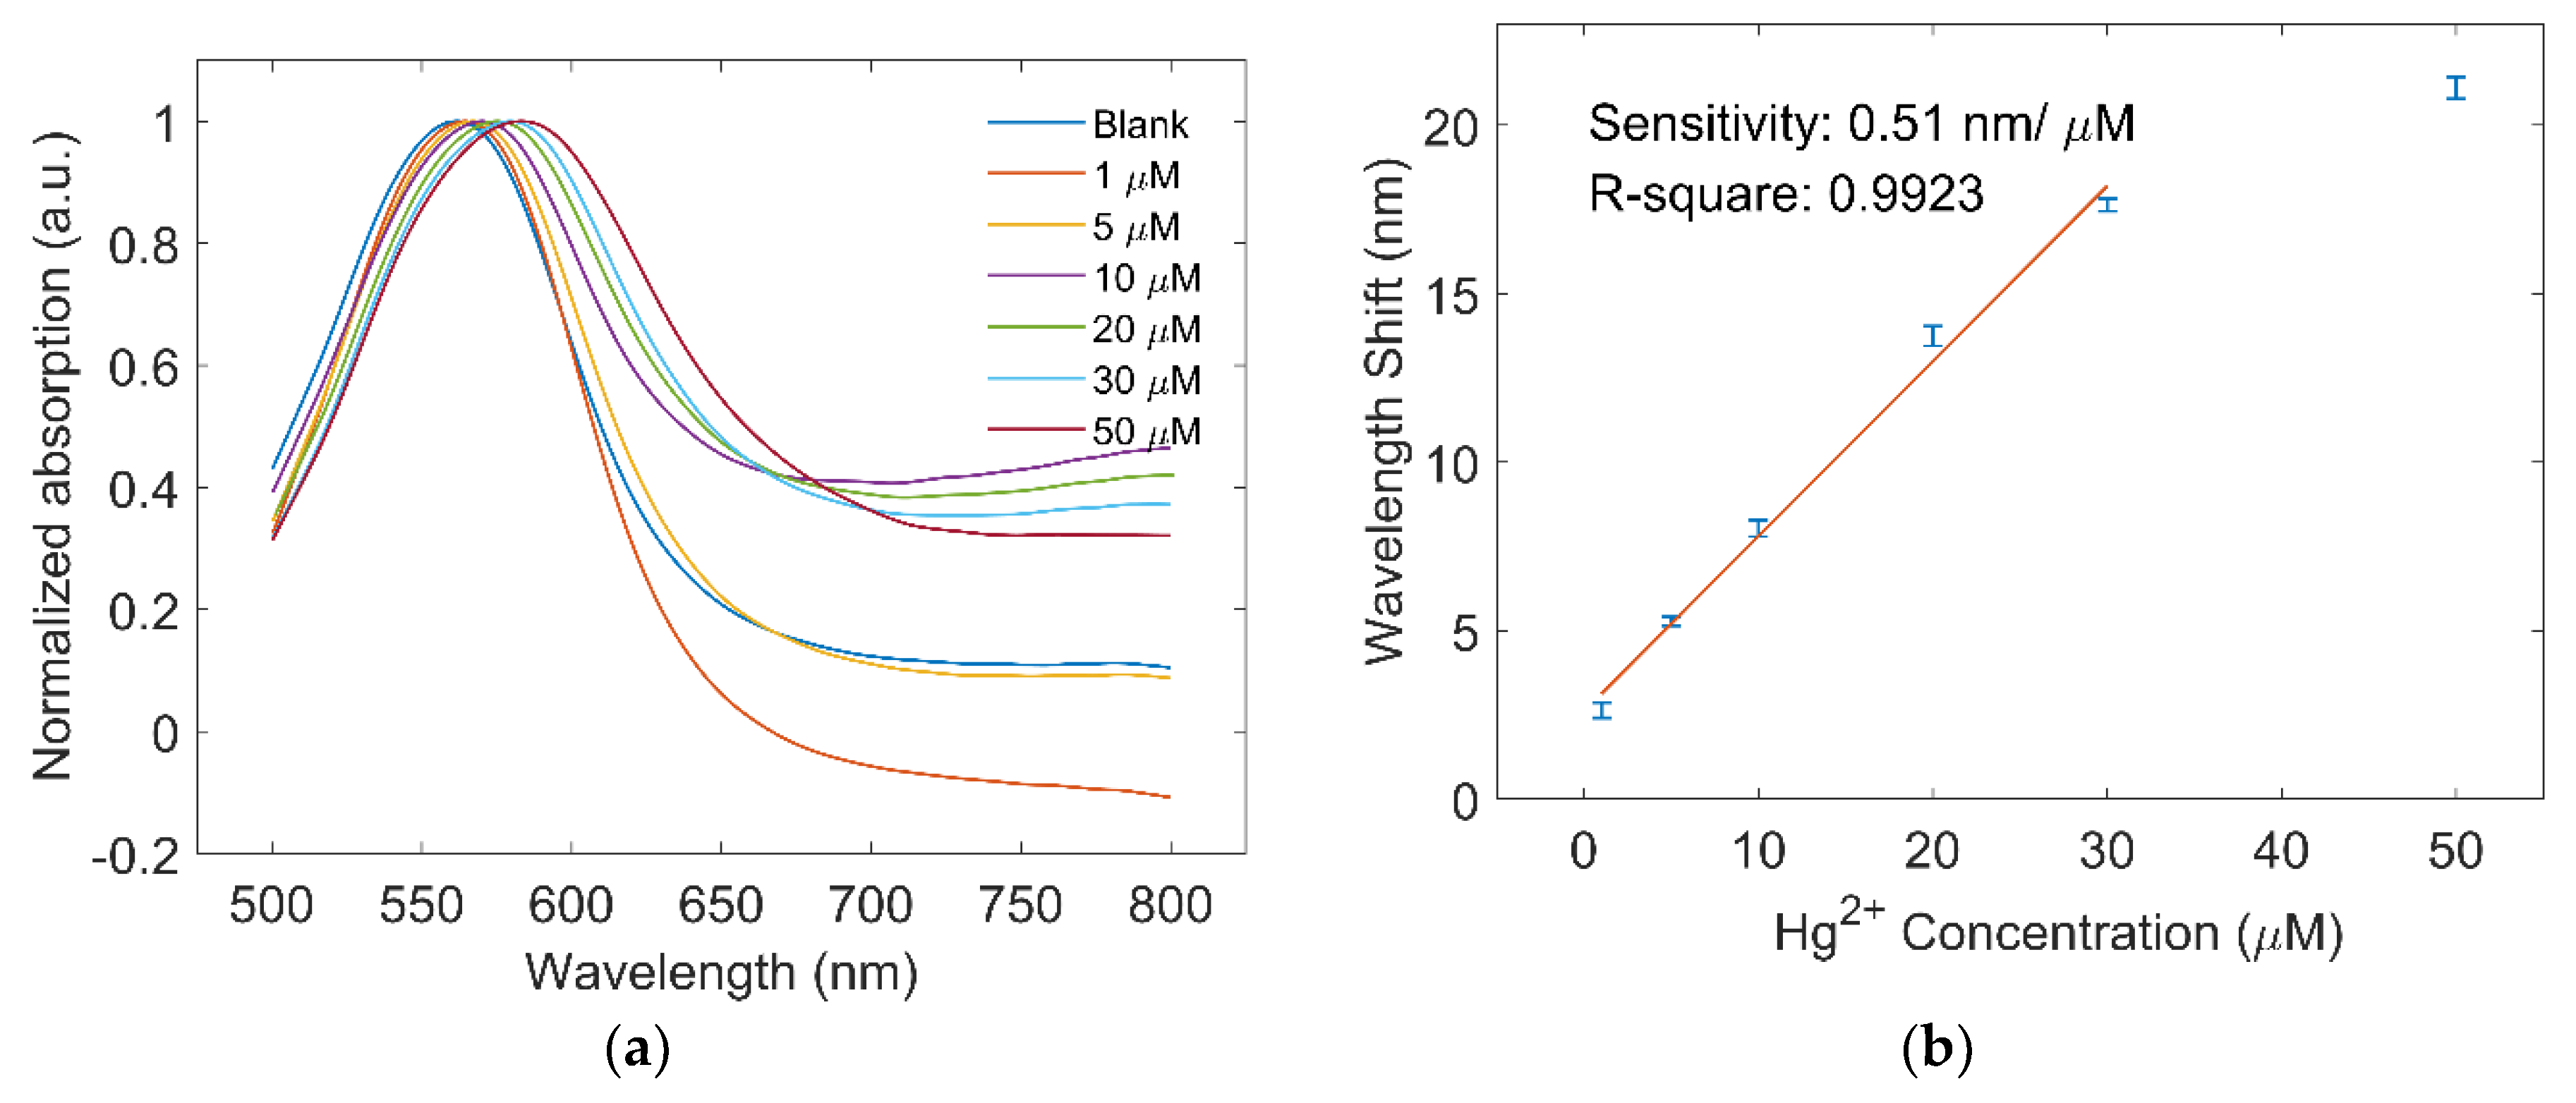
3.3. Hg2+ Detection
4. Discussion
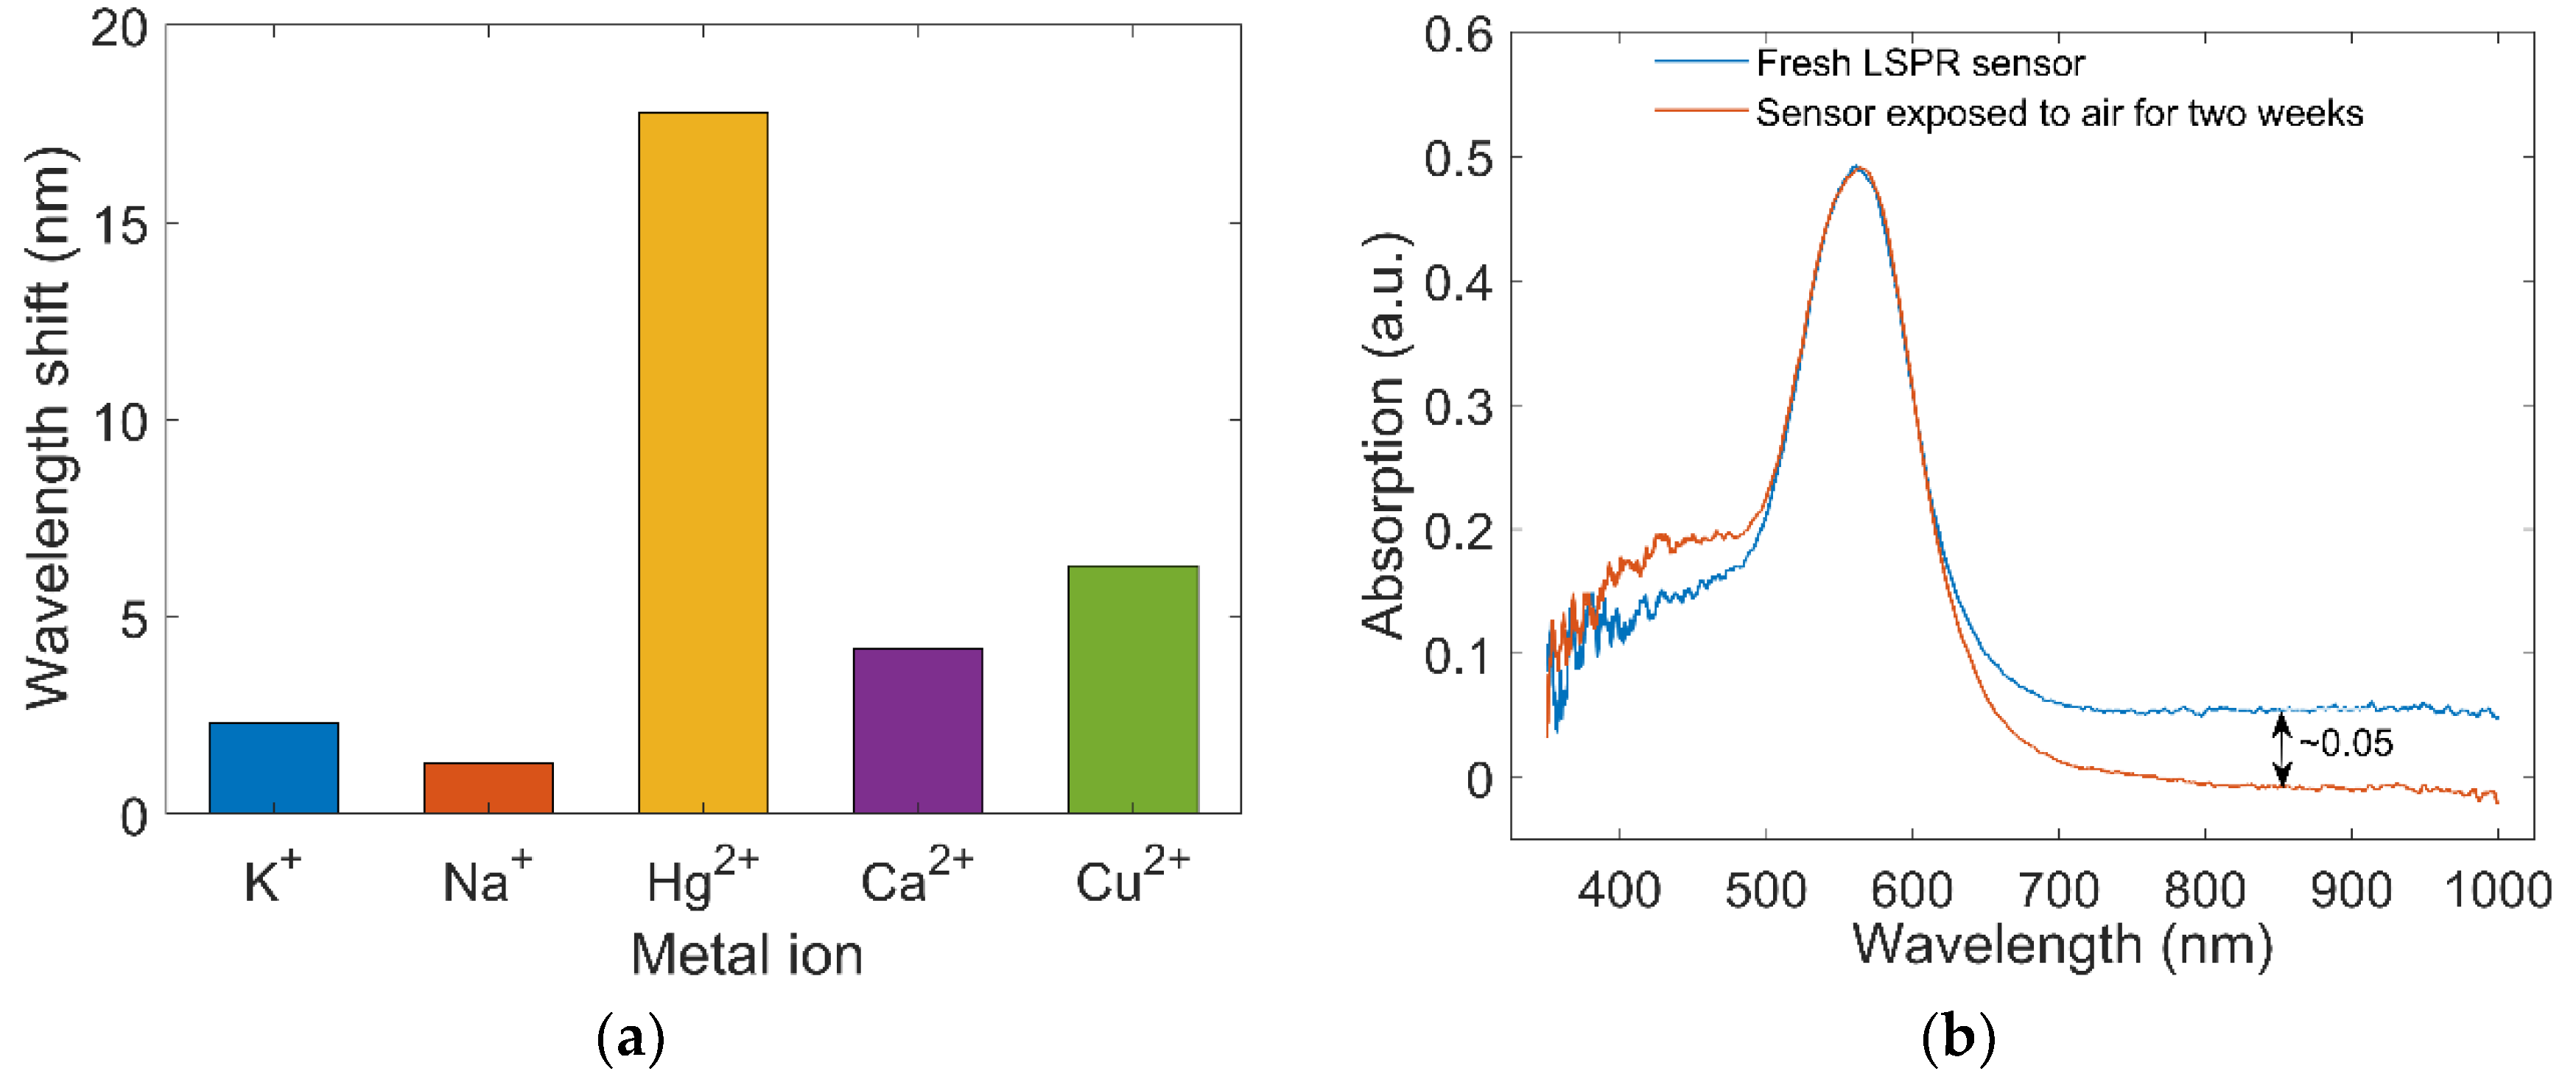
4.1. Specificity
4.2. Stability
5. Conclusions
Author Contributions
Funding
Conflicts of Interest
References
- Clarkson, T.W.; Magos, L. The Toxicology of Mercury and Its Chemical Compounds. Crit. Rev. Toxicol. 2006, 36, 609–662. [Google Scholar] [CrossRef] [PubMed]
- Tahán, J.E.; Granadillo, V.A.; Romero, R.A. Electrothermal atomic absorption spectrometric determination of Al, Cu, Fe, Pb, V and Zn in clinical samples and in certified environmental reference materials. Anal. Chim. Acta 1994, 295, 187–197. [Google Scholar] [CrossRef]
- Elfering, H.; Andersson, J.T.; Poll, K.G. Determination of organic lead in soils and waters by hydride generation inductively coupled plasma atomic emission spectrometry. Analyst 1998, 123, 669–674. [Google Scholar] [CrossRef]
- Lee, B.H.; Kim, Y.H.; Park, K.S.; Eom, J.B.; Kim, M.J.; Rho, B.S.; Choi, H.Y. Interferometric Fiber Optic Sensors. Sensors 2012, 12, 2467–2486. [Google Scholar] [CrossRef] [PubMed] [Green Version]
- Yin, G.; Lou, S.; Zou, H. Refractive index sensor with asymmetrical fiber Mach–Zehnder interferometer based on concatenating single-mode abrupt taper and core-offset section. Opt. Laser Technol. 2013, 45, 294–300. [Google Scholar] [CrossRef]
- Fu, Q.; Zhang, J.; Liang, C.; Ikechukwu, I.P.; Yin, G.; Lu, L.; Shao, Y.; Liu, L.; Liu, D.; Zhu, T. Intensity-modulated directional torsion sensor based on in-line optical fiber Mach-Zehnder interferometer. Opt. Lett. 2018, 43, 2414–2417. [Google Scholar] [CrossRef] [PubMed]
- Jiang, B.; Bi, Z.; Hao, Z.; Yuan, Q.; Feng, D.; Zhou, K.; Zhang, L.; Gan, X.; Zhao, J. Graphene oxide-deposited tilted fiber grating for ultrafast humidity sensing and human breath monitoring. Sens. Actuators B Chem. 2019, 293, 336–341. [Google Scholar] [CrossRef]
- Liu, Y.; Tang, X.; Huang, W.; Yin, G.; Deng, M.; Cao, Y.; Shi, L.; Zhu, T.; Huang, L.; Ikechukwu, I.P.; et al. A fluorometric optical fiber nanoprobe for copper(II) by using AgInZnS quantum dots. Microchim. Acta 2020, 187, 146. [Google Scholar] [CrossRef]
- Mosier-Boss, P.A. Review of SERS Substrates for Chemical Sensing. Nanomaterials 2017, 7, 142. [Google Scholar] [CrossRef] [Green Version]
- Chen, Z.; Han, K.; Zhang, Y.N. Reflective Fiber Surface Plasmon Resonance Sensor for High-Sensitive Mercury Ion Detection. Appl. Sci. 2019, 9, 1480. [Google Scholar] [CrossRef] [Green Version]
- Ding, Z.; Ravikumar, R.; Zhao, C.; Chen, L.; Chan, C. Chitosan/Poly (Acrylic Acid) Based Fiber-Optic Surface Plasmon Resonance Sensor for Cu2+ Ions Detection. J. Lightwave Technol. 2019, 37, 2246–2252. [Google Scholar] [CrossRef]
- Kazanskiy, N.L.; Khonina, S.N.; Butt, M.A. Plasmonic sensors based on Metal-insulator-metal waveguides for refractive index sensing applications: A brief review. Physica E 2019, 117, 11379813. [Google Scholar] [CrossRef]
- Jia, S.; Bian, C.; Sun, J.; Tong, J.; Xia, S. A wavelength-modulated localized surface plasmon resonance (LSPR) optical fiber sensor for sensitive detection of mercury(II) ion by gold nanoparticles-DNA conjugates. Biosens. Bioelectron. 2018, 114, 15–21. [Google Scholar] [CrossRef] [PubMed]
- Dhara, P.; Kumar, R.; Binetti, L.; Nguyen, H.T.; Alwis, L.S.; Sun, T.; Grattan, K.T.V. Optical Fiber-Based Heavy Metal Detection Using the Localized Surface Plasmon Resonance Technique. IEEE Sens. J. 2019, 19, 8720–8726. [Google Scholar] [CrossRef]
- Martínez-Hernández, M.E.; Goicoechea, J.; Arregui, F.J. Hg2+ Optical Fiber Sensor Based on LSPR Generated by Gold Nanoparticles Embedded in LBL Nano-Assembled Coatings. Sensors 2019, 19, 4906. [Google Scholar] [CrossRef] [Green Version]
- Sadani, K.; Nag, P.; Mukherji, S. LSPR based optical fiber sensor with chitosan capped gold nanoparticles on BSA for trace detection of Hg (II) in water, soil and food samples. Biosens. Bioelectron. 2019, 134, 90–96. [Google Scholar] [CrossRef]
- Li, M.; Cushing, S.K.; Wu, N. Plasmon-enhanced optical sensors: A review. Analyst 2015, 140, 386–406. [Google Scholar] [CrossRef] [Green Version]
- Cao, J.; Sun, T.; Grattan, K.T.V. Gold nanorod-based localized surface plasmon resonance biosensors: A review. Sens. Actuators B Chem. 2014, 195, 332–351. [Google Scholar] [CrossRef]
- Tu, M.H.; Sun, T.; Grattan, K.T.V. LSPR optical fibre sensors based on hollow gold nanostructures. Sens. Actuators B Chem. 2014, 191, 37–44. [Google Scholar] [CrossRef]
- Mitsui, K.; Handa, Y.; Kajikawa, K. Optical fiber affinity biosensor based on localized surface plasmon resonance. Appl. Phys. Lett. 2004, 85, 4231–4233. [Google Scholar] [CrossRef]
- Cheng, S.F.; Chau, L.K. Colloidal gold-modified optical fiber for chemical and biochemical sensing. Anal. Chem. 2003, 75, 16–21. [Google Scholar] [CrossRef] [PubMed]
- Freeman, R.G.; Grabar, K.C.; Allison, K.J.; Bright, R.M.; Davis, J.A.; Guthrie, A.P.; Hommer, M.B.; Jackson, M.A.; Smith, P.C.; Walter, D.G.; et al. Self-Assembled Metal Colloid Monolayers: An Approach to SERS Substrates. Science 1995, 267, 1629–1632. [Google Scholar] [CrossRef]
- Grabar, K.C.; Smith, P.C.; Musick, M.D.; Davis, J.A.; Walter, D.G.; Jackson, M.A.; Guthrie, A.P.; Natan, M.J. Kinetic Control of Interparticle Spacing in Au Colloid-Based Surfaces: Rational Nanometer-Scale Architecture. J. Am. Chem. Soc. 1996, 118, 1148–1153. [Google Scholar] [CrossRef]
- Zhao, W.B.; Park, J.; Caminade, A.-M.; Jeong, S.J.; Jang, Y.H.; Kim, S.O.; Majoral, J.P.; Cho, J.; Kim, D.H. Localized surface plasmon resonance coupling in Au nanoparticles/phosphorus dendrimer multilayer thin films fabricated by layer-by-layer self-assembly method. J. Mater. Chem. 2009, 19, 2006–2012. [Google Scholar] [CrossRef]
- Shao, Y.; Xu, S.; Zheng, X.; Wang, Y.; Xu, W. Optical Fiber LSPR Biosensor Prepared by Gold Nanoparticle Assembly on Polyelectrolyte Multilayer. Sensors 2010, 10, 3585–3596. [Google Scholar] [CrossRef] [Green Version]
- Goicoechea, J.; Rivero, P.J.; Sada, S.; Arregui, F.J. Self-Referenced Optical Fiber Sensor for Hydrogen Peroxide Detection Based on LSPR of Metallic Nanoparticles in Layer-by-Layer Films. Sensors 2019, 19, 3872. [Google Scholar] [CrossRef] [Green Version]
- Lu, M.D.; Zhu, H.; Bazuin, C.G.; Peng, W.; Masson, J.F. Polymer-Templated Gold Nanoparticles on Optical Fibers for Enhanced-Sensitivity Localized Surface Plasmon Resonance Biosensors. ACS Sens. 2019, 4, 613–622. [Google Scholar] [CrossRef]
- Jin, Y.; Wong, K.H.; Granville, A.M. Developing localized surface plasmon resonance biosensor chips and fiber optics via direct surface modification of PMMA optical waveguides. Colloids Surf. Physicochem. Eng. Aspects 2016, 492, 100–109. [Google Scholar] [CrossRef]
- Daniel, M.C.; Astruc, D. Gold Nanoparticles: Assembly, Supramolecular Chemistry, Quantum-Size-Related Properties, and Applications toward Biology, Catalysis, and Nanotechnology. Chem. Rev. 2004, 104, 293–346. [Google Scholar] [CrossRef]
- Jana, N.R.; Gearheart, L.; Murphy, C.J. Seeding Growth for Size Control of 5−40 nm Diameter Gold Nanoparticles. Langmuir 2001, 17, 6782–6786. [Google Scholar] [CrossRef]
- Grabar, K.C.; Freeman, R.G.; Hommer, M.B.; Natan, M.J. Preparation and Characterization of Au Colloid Monolayers. Anal. Chem. 1995, 67, 735–743. [Google Scholar] [CrossRef]
- Feng, T.; Ding, L.; Chen, L.; Di, J. Deposition of gold nanoparticles upon bare and indium tin oxide film coated glass based on annealing process. J. Exp. Nanosci. 2019, 14, 13–22. [Google Scholar] [CrossRef] [Green Version]
- Chen, C.H.; Tsao, T.C.; Tang, J.L.; Wu, W.T. A Multi-D-Shaped Optical Fiber for Refractive Index Sensing. Sensors 2010, 10, 4794–4804. [Google Scholar] [CrossRef] [PubMed] [Green Version]
- Sucrose Solution Percent by Weight Concentration (Brix Value) Versus Refractive Index at 20 Celsius and 589nm Wavelength (per ICUMSA). Available online: https://www.reichertai.com/clientuploads/directory/download_pdfs/ICUMSA%20Brix%20Table.PDF (accessed on 5 May 2020).

© 2020 by the authors. Licensee MDPI, Basel, Switzerland. This article is an open access article distributed under the terms and conditions of the Creative Commons Attribution (CC BY) license (http://creativecommons.org/licenses/by/4.0/).
Share and Cite
Zhong, X.; Ma, L.; Yin, G.; Gan, M.; Wei, Y. Hg2+ Optical Fiber Sensor Based on LSPR with PDDA-Templated AuNPs and CS/PAA Bilayers. Appl. Sci. 2020, 10, 4845. https://doi.org/10.3390/app10144845
Zhong X, Ma L, Yin G, Gan M, Wei Y. Hg2+ Optical Fiber Sensor Based on LSPR with PDDA-Templated AuNPs and CS/PAA Bilayers. Applied Sciences. 2020; 10(14):4845. https://doi.org/10.3390/app10144845
Chicago/Turabian StyleZhong, Xiujuan, Li Ma, Guolu Yin, Mengyu Gan, and Yong Wei. 2020. "Hg2+ Optical Fiber Sensor Based on LSPR with PDDA-Templated AuNPs and CS/PAA Bilayers" Applied Sciences 10, no. 14: 4845. https://doi.org/10.3390/app10144845