Article

Multi-mode Microscopic Hyperspectral Imager for the Sensing of Biological Samples

1
Centre for Optical and Electromagnetic Research, National Engineering Research Center for Optical Instruments, Zhejiang Provincial Key Laboratory for Sensing Technologies, College of Optical Science and Engineering, Zhejiang University, Hangzhou 310058, China
2
Ningbo Research Institute, Zhejiang University, Ningbo 315100, China
*
Author to whom correspondence should be addressed.
Appl. Sci. 2020, 10(14), 4876; https://doi.org/10.3390/app10144876
Submission received: 1 June 2020 / Revised: 11 July 2020 / Accepted: 15 July 2020 / Published: 16 July 2020
(This article belongs to the Special Issue Hyperspectral Imaging: Methods and Applications)

Abstract

:
In this work, we develop a multi-mode microscopic hyperspectral imager (MMHI) for the detection of biological samples in transmission imaging, reflection imaging and fluorescence mode. A hyperspectral image cube can be obtained with 5 μm spatial resolution and 3 nm spectral resolution through push-broom line scanning. To avoid possible shadows produced by the high magnification objective with a short working distance, two illumination patterns are designed to ensure the co-axiality of the illumination and detection. Three experiments for the detection of zebrafish and fingerprints and the classification of disaster-causing microalgae verify the good capability and functionality of the system. Based on the detected spectra, we can observe the impacts of β-carotene and melanin in zebrafish, hemoglobin in the fingertip, and chlorophyll in microalgae, respectively. Multi-modes can be switched freely according to the application requirement and characteristics of different samples, like transmission mode for the transparent/translucent sample, reflection mode for the opaque sample and fluorescence mode for the fluorescent sample. The MMHI system also has strong potential for the non-invasive and high-speed sensing of bio or clinical samples.

1. Introduction

The appearance of microscopy opens the door for humans to explore the micro world, and spectral analysis provides the intrinsic absorption or fingerprint characteristics of specific substances [1]. Recently, the combination of hyperspectral technology and optical microscopic imaging in bio-sensing has been widely used in tumor cell detection [2], food detection [3], zooplankton classification [4] and other applications [5]. In these applications, the separation of a microscopic imaging module and a hyperspectral detection module may easily cause the detection errors and increase the cost of the system. Hyperspectral imaging (HSI) technology, with the advantage of acquiring two-dimensional image and corresponding spectrum of each pixel, has strong potential for, e.g., on-site monitoring, clinic diagnose and biomedicine [6,7,8]. Through single scanning, a hyperspectral cube containing both spatial and spectral information can be obtained. The spectral information can be used in point-to-point spectral analysis for interested regions in the 2D hyperspectral spatial image.
At present, HSI technology is widely used in some remote sensing area, which is a macroscopic observation. Most of the commercial imaging spectrometers work in a single detection mode, e.g., collecting the reflection or transmission signal from the sample [9,10], which greatly limits their ability to test a variety of samples. Microscopic applications are mainly limited by the detection efficiency, spatial and spectral resolutions of the HSI system. Some experiments on cancerous tissues and tumor detection [2,8] show spatial and spectral resolutions of 30 μm and 5 nm, respectively. Moreover, the dyeing steps for some samples also increase the complexity of experiments in microscopic applications.
In this work, we present a multi-mode microscopic hyperspectral imager (MMHI) with 5 μm spatial resolution and 3 nm spectral resolution that works in the transmission mode, reflection mode and fluorescence mode. To avoid possible shadows produced by the short working distance of a high magnification objective, epi-illumination [11] and trans-illumination [12] patterns are designed to ensure the co-axiality between the illumination and detection. By switching the illumination pattern or light source, an appropriate detection mode can be selected for samples with different characteristics. Here, three experimental detections on zebrafish (translucent sample), human fingerprint (opaque sample) and disaster-causing microalgae (fluorescence samples) were performed to verify the system’s capability. Due to the realization of uniform-illumination of the whole focal plane, it is easy to exchange objectives with different magnification, meeting the demands of the corresponding resolution, amplification or field-of-view (FOV). As implemented, the imager has the advantages of low cost, high accuracy and good sensitivity, multiple application scenarios, and has the potential for on-site micro environment monitoring and clinical applications.
The structure of this paper is as follows: Section 1 provides a brief introduction to the background of the HSI technology and the motivations for the MMHI system. Section 2 describes the construction and calibration of the MMHI system in detail, illustrates the shadow issue and demonstrates two illumination patterns to overcome the shadow issue. Section 3 introduces three experiments under different detection modes, to show the capability of the MMHI system. Section 4 summarizes the present work, and provides future prospects and the possible improvement of the MMHI system.

2. Materials and Methods

2.1. System Setup and Calibration

The schematic of the microscopic hyperspectral imager is shown in Figure 1a,b. The system consists of the objective, imaging lens, slit, collimator lens, prism-grating-prism (PGP) structure, tube lens and CMOS (complementary metal oxide semiconductor) sensor. All of the optical components, with Ø1” (25.4 mm) diameter, were installed in aluminum tubes of SM1 thread standard. In this system, the signal emitted from the focal plane is captured by a plane achromatic 40×/0.65 objective (RMS40X, Olympus, Tokyo, Japan), then passes through the imaging lens (f = 50 mm, DHC, Beijing, China) and converges onto a slit with 10 um width. After passing through the slit, the signal is collimated by a doublet lens (f = 50 mm, DHC, Beijing, China) and then dispersed by the PGP structure. The parameters of the grating are 300 grooves per millimeter with a 17.5 degree groove angle (GT25-03, Thorlabs, Newton, NJ, USA), and the deflection angle of the prism is 10 degree. The PGP structure is used to deflect the 1st order diffraction pattern into the detection module. The spread spectrum is finally focused on the CMOS sensor (ASI74MM, ZWO, Suzhou, China) through a tube lens (f = 50 mm, DHC, Beijing, China). The short and long axes of the camera were set as the spatial and spectral axes, respectively. The imager was mounted on a traditional microscopy, whose specimen holder was on an XYZ three-axis motion stage (HDS-CBMS-XYZ-I-R, HEIDSTAR, Xiamen, China). Through single push-broom scanning, a hyperspectral cube of tested sample can be obtained. Figure 1h shows the whole prototype of this system.
We then performed the wavelength calibration to translate the pixel index to wavelength. A mercury lamp (HG-1 calibration source, Ocean Optics, Largo, FL, USA) was used as the standard optical source [13], whose spectrum was captured by the imager and shown in Figure 1c. There were six vertical lines in the spectral image, representing 435.833 nm, 546.074 nm, 578.013 nm, 750.387 nm, 763.511 nm and 772.376 nm light lines emitted from the mercury lamp source. The corresponding pixel index values in the spectral axis of the CMOS were 1381, 1070, 979, 517, 483 and 459. The wavelength of the imager is assumed to be a polynomial function of the pixel index of the spectral axis:
λ = α 0 + α 1 x + α 2 x 2
where λ is wavelength, x is pixel index, and α 0 ,   α 1 , α 2 are calibration coefficients. A least squares polynomial fit method [14] is employed to investigate the relationship between the wavelength and pixel index, giving the values of the calibration coefficients as 952.9, −0.4022 and 2.017 × 10⁻⁵, respectively. The calibration result is shown in Figure 1e. After wavelength calibration, each pixel index corresponds to a specific wavelength. Figure 1d shows the spectrum of the calibration source obtained from the imager, and the full width at half maximum (FWHM) of the spectrum line of 546.074 nm is about 3 nm, suggesting the spectral resolution of our system is 3 nm. As a comparison, we also measured the spectrum of the same mercury lamp by a commercial spectrometer (PG 2000 Pro, Fuxiang, Shanghai, China), and the result is shown in Figure 1f. It is found that the wavelengths for the spectral peaks are consistent with (d), indicating the accuracy of our imager for spectral measurement. However, there exist some differences of peak intensities in several wavelength, due to the difference in the optical intensity response of the CMOS camera.
Due to the aberration introduced by the diffraction module, the actual lateral spatial resolution of the imager is inferior to the theoretical calculated resolution of the microscopy (0.61× λ/NA). In order to demonstrate the specific resolution of the imager, a hyperspectral imaging experiment for a resolution test target (1951 USAF-R1DS1P, Thorlabs, Newton, NJ, USA) was performed. A series of hyperspectral images were captured as the imager scanned the entire target plane. The target and slit must be strictly perpendicular to the scanning direction, otherwise the restored image will be distorted. All images are stitched along the scanning direction, and the restored image is shown in Figure 1g. The results show that our system can distinguish the lines of (group 6, element 6), for which the line width is 4.39 μm, indicating our system has a spatial resolution of about 5 μm.

2.2. Epi-illumination and Trans-illumination

Under the previous illumination pattern (lateral illumination), an objective with high magnification and short working distance (sub-millimeter level) may cause some ununiformed illumination or possible shadows covering of the focal plane [15]. Figure 2a describes the generation of some shadows, from which we can see part of the lateral illumination light is blocked by the objective or sample, causing the shadow in the FOV. In addition, the illumination intensity decreases gradually with the propagation distance of light, which also leads to ununiformed illumination of the sample plane. These drawbacks will affect the imaging quality and detection efficiency. To overcome the shadow issue, two illumination patterns were proposed to make the illumination and detection coaxial, while ensuring the uniformity of illumination within the FOV. Generally speaking, epi-illumination is sensitive to the scattered light and fluorescence from the surface [16], and thus is suitable for a reflection or fluorescence detection mode of opaque specimen, while trans-illumination is suitable for a transmission detection mode of translucent or transparent samples [17].
In the epi-illumination pattern, the light source is coupled to a single-mode optical fiber and is outputted to an air-spaced doublet collimator (F810SMA-780, Thorlabs, Newton, NJ, USA). The collimated light firstly passes through a doublet lens (f = 50 mm, DHC, Beijing, China), then is deflected by a beam splitter (BSX10R, Thorlabs, Newton, NJ, USA), and finally converges onto the back focal plane of the objective. After passing through the objective, a parallel light can be generated since the light source is emitted from the back focal point, and consequently uniformly-illuminated condition can be achieved in the focal plane of the objective. The reflected/scattered/fluorescence signal can be captured by the same objective and imaged onto the CMOS. A long pass filter (FELH0450, Thorlabs, Newton, NJ, USA) is adopted to eliminate the excited light when choosing the fluorescence detection mode. By selecting a broadband light source or blue-violet laser source, the reflection or fluorescence mode can be realized, respectively.
In contrast to epi-illumination, the trans-illumination structure is relatively simple. A collimated light (uniformly-illuminated light) is incident from below and captured by the imager above after penetrating the sample. Thus, transmission imaging can be realized and the sample absorption characteristics can be obtained at the same time.
By switching among different illumination patterns, multi-mode detection can be achieved for different samples and applications.

3. Results

In this section, we demonstrate three examples of experimental detections to verify the capability of our MMHI system, namely, detections of zebrafish and human fingerprints, as well as classification of disaster-causing microalgae. Based on the transmission and reflection spectra, we successfully observe the impacts of β-carotene, melanin and hemoglobin in zebrafish and fingertips. In addition, the difference contents of chlorophyll in the five kinds of microalgae provide the basis for classification. In order to avoid the disturbance from the external or surrounding light, all measurements were performed in a dark room.

3.1. Zebrafish Detection on Transmission Mode

To illustrate the performance of our MMHI system, we firstly performed the transmission detection of a translucent sample. Here, a zebrafish larva (supplied by core facilities, Zhejiang University school of medicine) was chosen as the tested sample (embedded in 1% agarose), and an optical microscopic image was captured through a traditional microscopy, as shown in Figure 3a.
In the transmission mode, the broadband light is emitted from below the motion stage, and is captured by the imager after penetrating the sample. A push-broom scanning experiment was conducted to verify the feasibility of the hyperspectral imaging. The sample was placed on a glass slide and moved at an interval of 1 μm on the motion stage to realize the scan process. A series of 1000 spectral images was obtained with a total scanning time of 100 s. The scanning speed was mainly limited by the efficiency of the CMOS camera to transfer the captured images to a computer hard disk. These images were subsequently processed by MATLAB and stitched into a 3D hyperspectral cube, in which the spatial image was obtained by summing the spectral images over all wavelength bands [18], as shown in Figure 3b. Compared the hyperspectral image with the optical image, we found that the MMHI system had excellent imaging performance.
We further analyzed three regions of interest (ROI, shown as Figure 3c) to investigate their transmission spectra. There are some methods for the ROI extraction of a biomedical image, such as semantic segmentation, multi-feature clustering and convolutional neural networks [19,20,21], which can greatly improve the accuracy of ROI selection. Here, fin (marked as red dot), speckle (marked as blue star) and yolk sac (marked as yellow triangle) were selected as ROI, and their corresponding spectra were shown in Figure 3d. Since the 3D hyperspectral cube of the zebrafish was obtained, every pixel in the 2D hyperspectral image corresponded to a specific spectrum. To avoid the spectral error of single pixel, we calculated the average spectrum of the corresponding area. Due to the transparency of the fin, its transmission spectrum was almost the same as the spectrum of the broadband light source. The speckle part contained a large amount of melanin, which caused the absorption in the whole visible light band. The existences of β-carotene and hemoglobin [22] in the yolk sac led to absorptions at 480 nm and 580 nm. Based on the above result, our MMHI system is shown to have the ability to detect translucent or transparent samples.

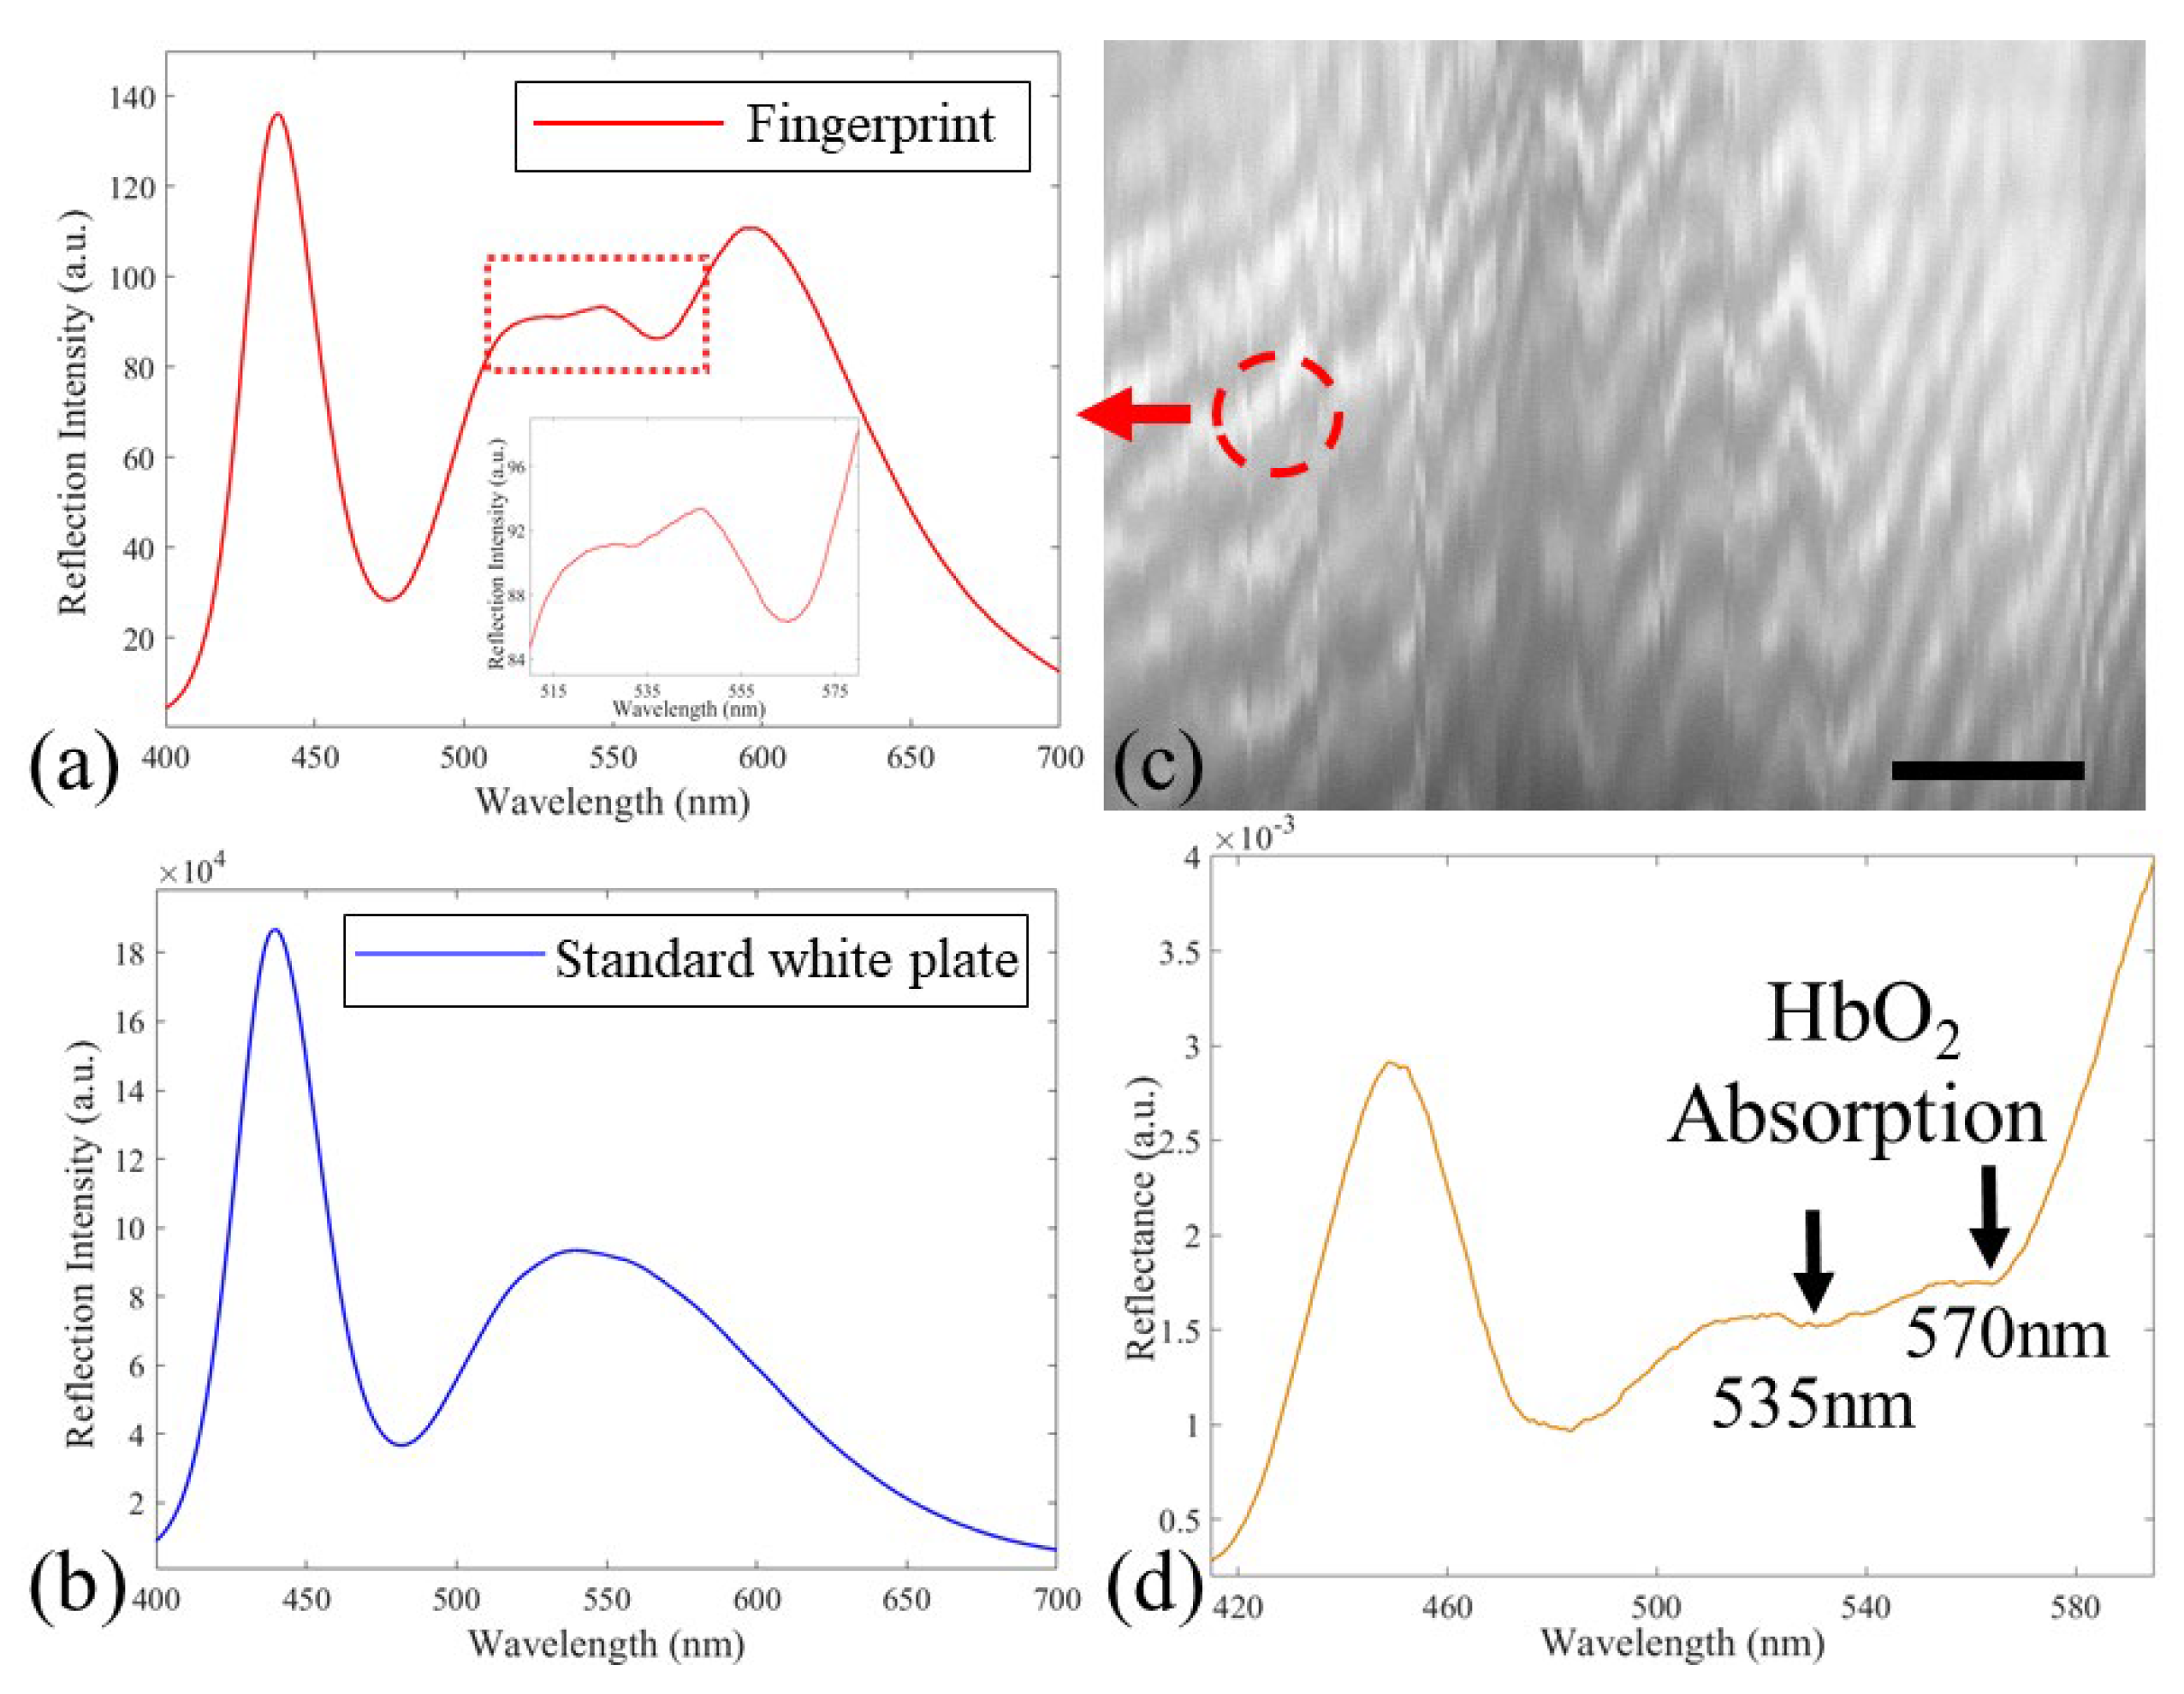
3.2. Human Fingerprint Detection in Reflection Mode

A similar scan imaging experiment was carried out to detect a human fingerprint under reflection mode. A light-emitting diode (LED) lamp was chosen as the broadband light source. The measured finger was fixed on the motion stage, and a total of 200 spectral images were captured with 20 s scanning time. To avoid possible touch and pollution between the finger and 40× objective (0.6 mm working distance), reduce the difficulty of experimental operation, and increase the scanning FOV, we replaced the 40× objective with a 10× objective (RMS10X, 10.6 mm working distance, Olympus, Tokyo, Japan). The restored spatial image of the fingerprint was shown as Figure 4b. Due to the uneven surface of the finger itself, as well as the unconscious slight shaking during the scanning process, the restored image has some blur or distortion. However, some details can still be distinguished and we believe the result can still be used to demonstrate the feasibility of our system.
We selected a ROI (marked as dotted circle) to study the reflection spectrum of the fingerprint. Two average reflection spectra of the ROI and a standard white plate (STD-WS, Fuxiang, Shanghai, China) were shown in Figure 4a,c, which were defined as R o λ and R w λ , respectively. The standard white plate was used as the reference for reflectance. A reflectance spectrum was calculated using the following equation:
R λ = R o λ D R w λ D
where D was defined as dark noise, and was neglected in our calculation because it was weak. Figure 4d shows the reflectance spectrum of the fingerprint. We can observe two absorption bands around 535 nm and 570 nm, which stem from the absorption of oxygenated hemoglobin (HbO2) [22]. The values of reflectance provide a potential method for the qualitative assessment of the blood concentration, and a smaller numerical value refers to a higher concentration, indicating the MMHI system may be useful for biometrics applications.

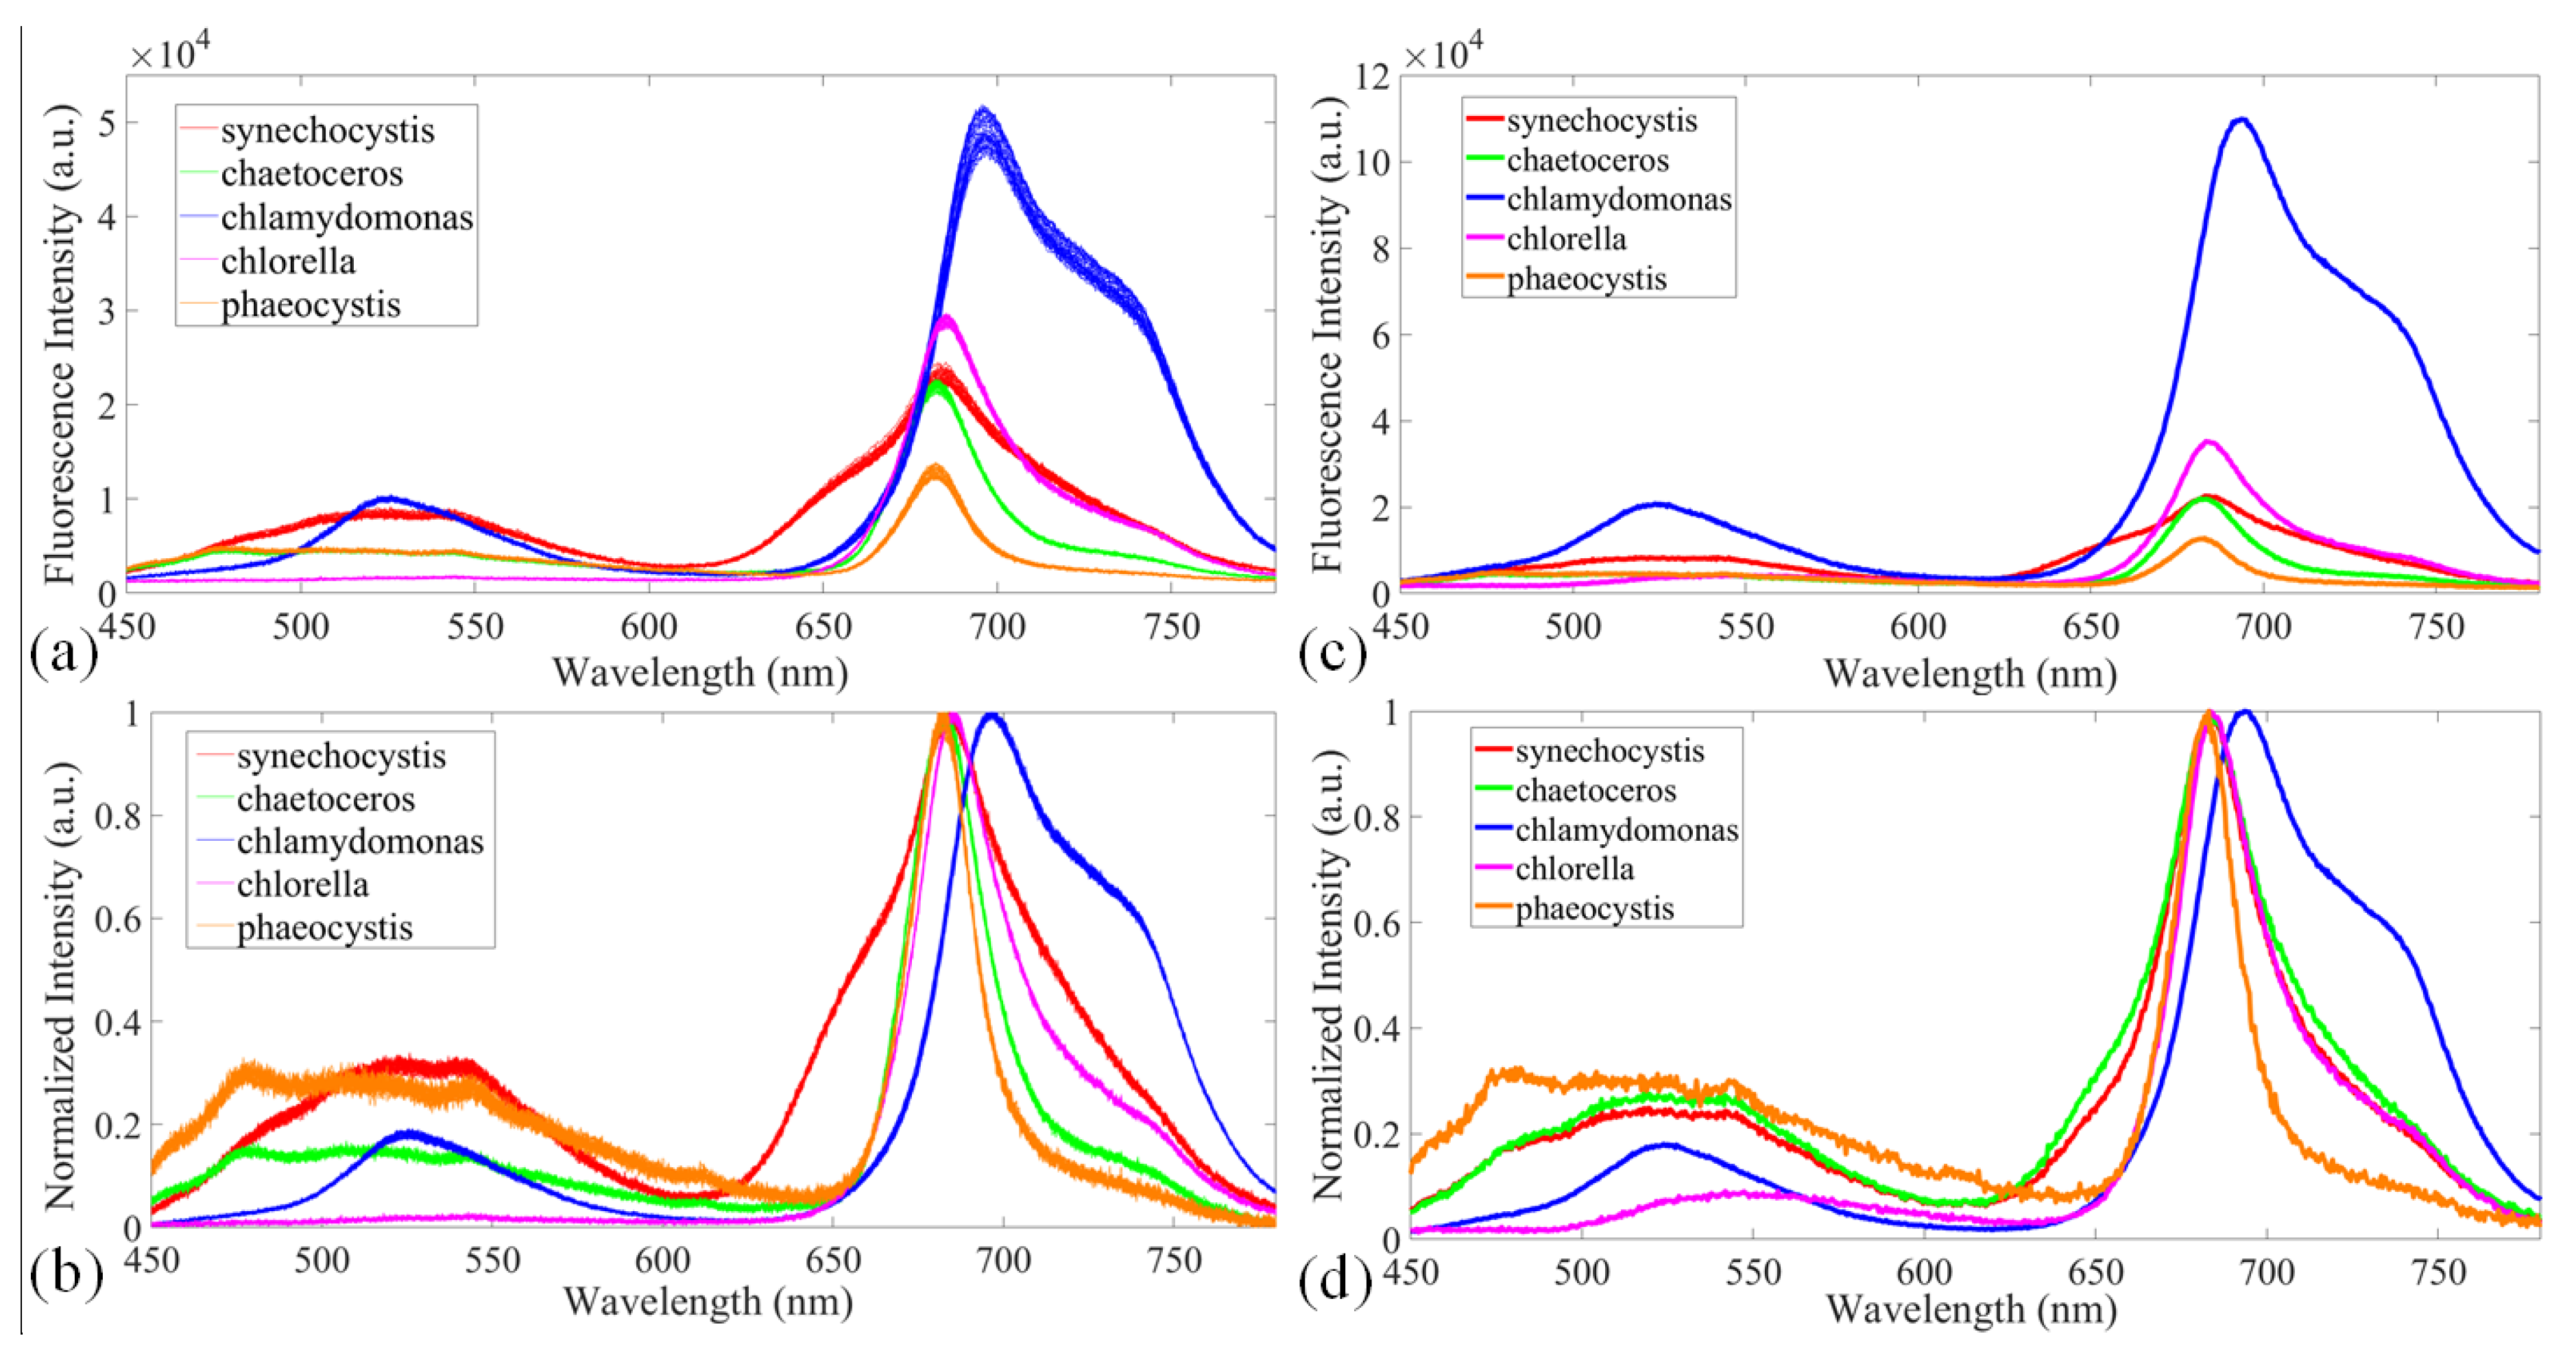
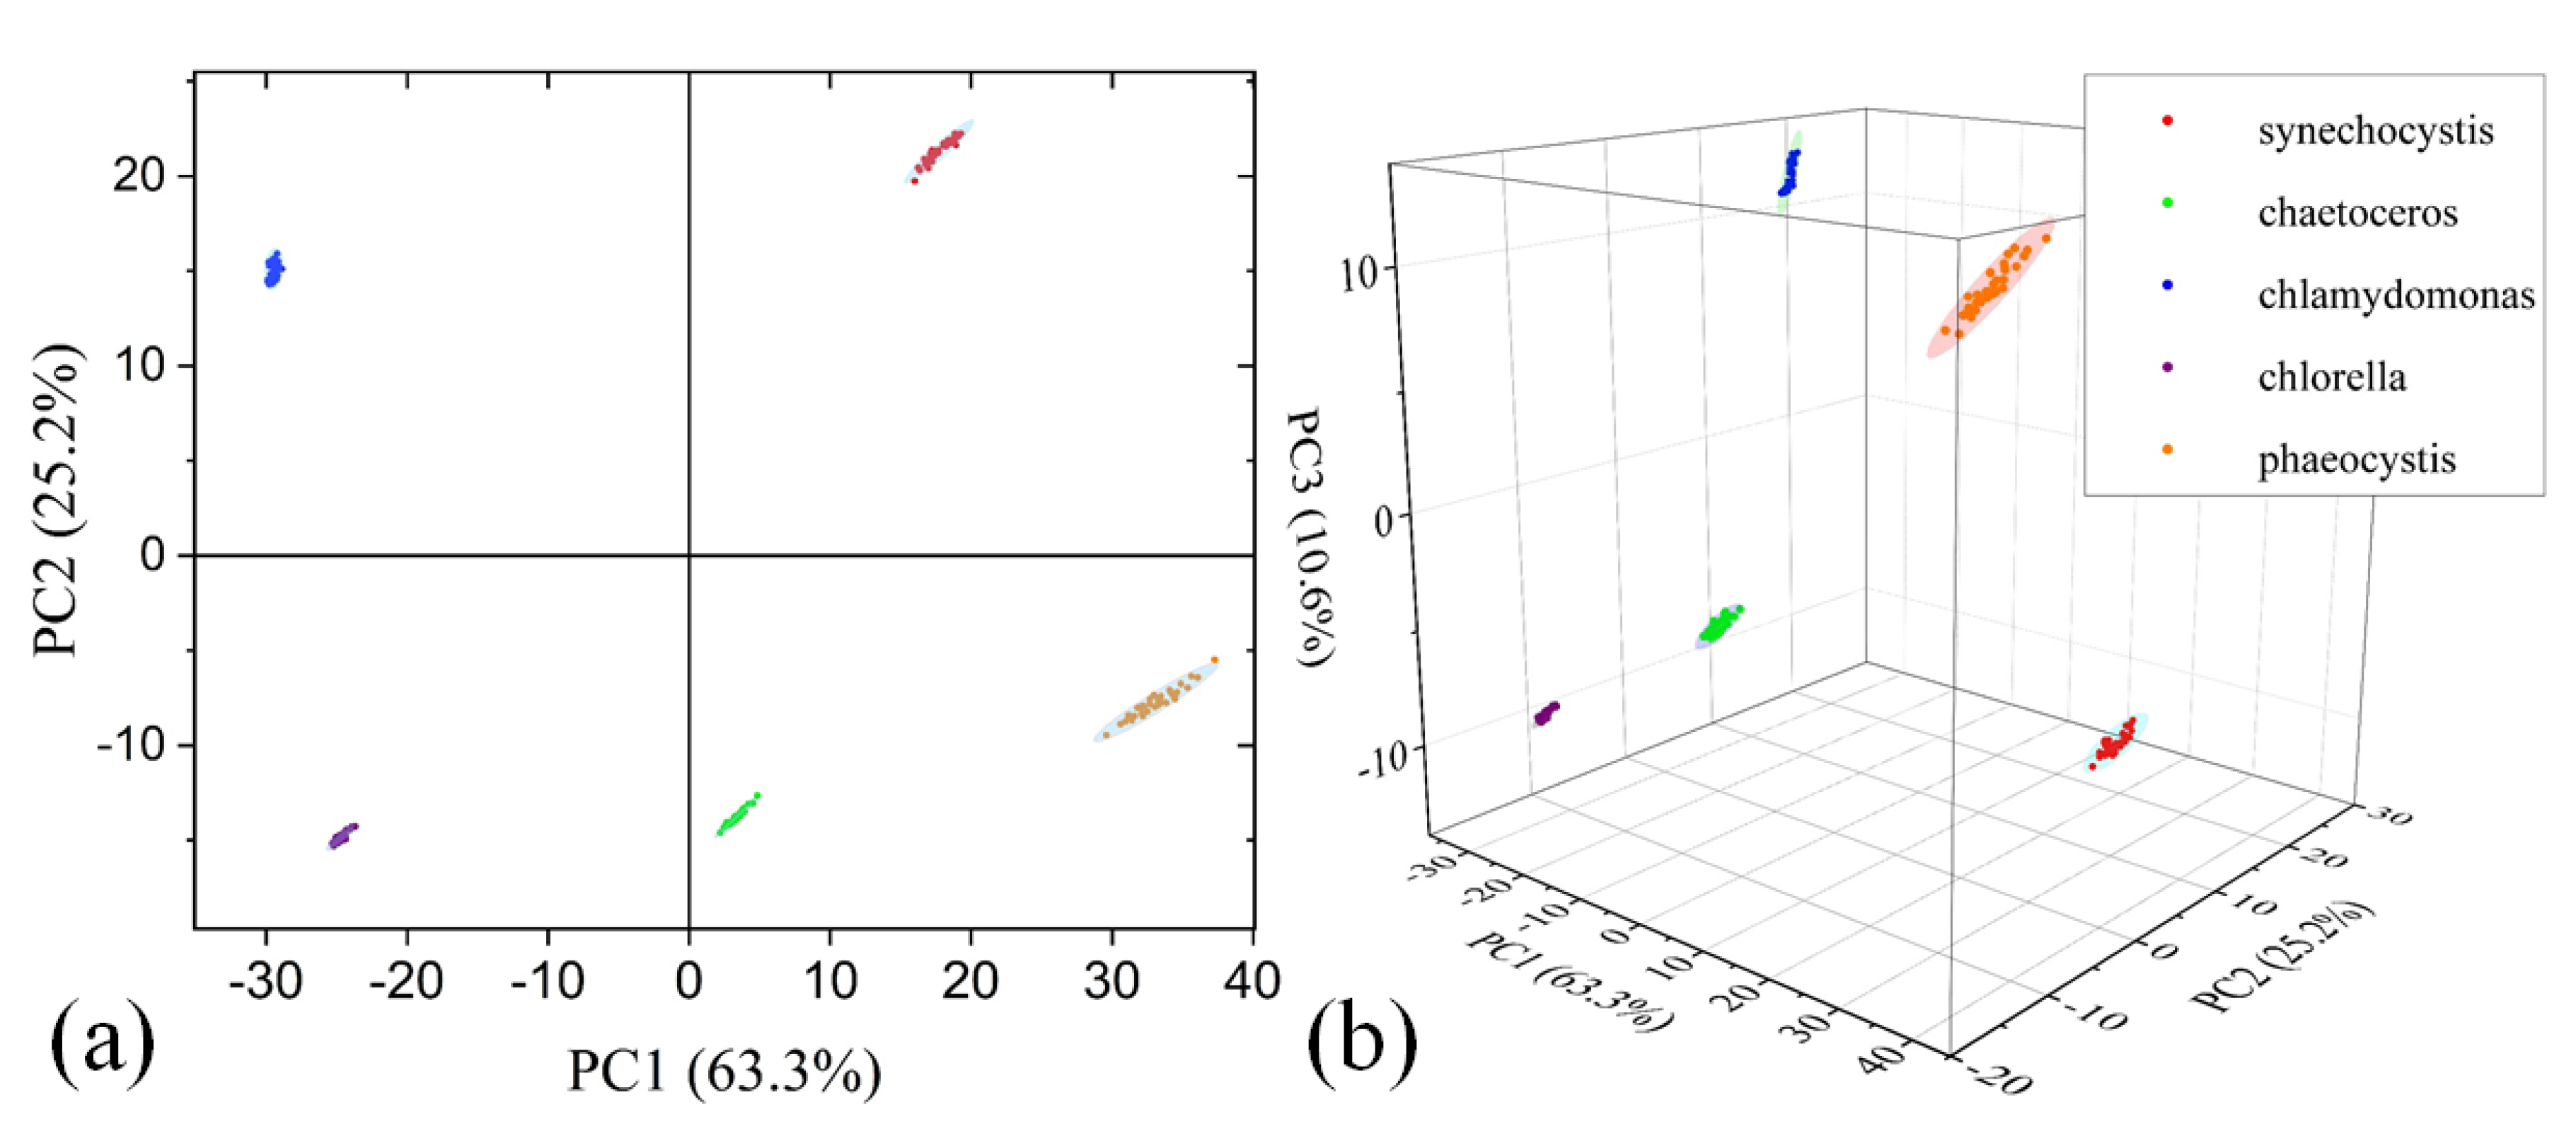
3.3. Disaster-causing Microalgae Classification on Fluorescence Mode

In this experiment, five different types of disaster-causing microalgae (synechocystis, chaetoceros, chlamydomonas, chlorella and phaeocystis, supplied by South China Sea Fisheries Research Institute, CAFS) were detected and classified under the fluorescence mode. Here, the microalgae species were cultured in culture medium of no fluorescence to form microalgae solution. Phaeocystis and chlorella were cultured in F/2 medium, chaetoceros was cultured in F/2+si medium, synechocystis was cultured in BG-11 medium, and chlamydomonas was cultured in Tris-Acetate-Phosphate (TAP) medium. All of the microalgae were cultured in a light incubator with a constant temperature of 18 °C, a light intensity of 2000 lux and a light-to-dark ratio of 12 h:12 h. Five cuvettes were used to hold the microalgae solution. A 405 nm blue-violet laser source (UVL4052006D20-AL, SHHO, Zhongshan, China) with 200 mW power was used as the excitation source. Note that scan imaging is not needed here, since the size of single microalgae (~2 μm) is less than the spatial resolution limit of our system (5 μm) and the extreme weak fluorescence of single microalgae is hard to detect. For each kind of microalgae, 35 fluorescence spectra were captured by adjusting the position of cuvette. Figure 5a provides a total of 35 × 5 fluorescence spectra for five kinds of microalgae in a wavelength range of 450~780 nm. To obviate the influence of solution concentration, each spectrum was normalized by the following equation and shown in Figure 5b.
I norm λ = I origin λ I min I max I min
As shown in Figure 5b, the normalized spectra of the five types of disaster-causing microalgae are slightly different from each other, owing to the different kinds and contents of chlorophyll. Those differences indicate the possibility to identify them through fluorescence signals.
The fluorescence spectra were also detected by another commercial spectrometer (STS-VIS, Ocean Optics, Largo, FL, USA) to validate the measurement accuracy of our MMHI system. The measured and normalized results are shown in Figure 5c,d. The difference of fluorescence intensity between (a) and (c) is due to the different exposure and gain of the two systems, and the slight difference of normalized results between (b) and (d) is attributed to the different wavelength responses of the detectors in the two systems. We found that the results measured by the MMHI and commercial spectrometer have high consistency, which proves the feasibility and accuracy for microalgae classification of our system.
The principal component analysis (PCA) is a common method for substantial reduction of redundant data features, which is widely used in the classification of biological samples [23]. The original data matrix of our experiments is 175 × 923, in which 175 is the total number of microalgae samples (35 × 5) and 923 is the number of spectral sampling points for each microalgae. After dimensional reduction through the PCA procedure, a three-dimensional matrix containing the first three principal components (PCs) can be obtained, which contains 99.2% information. With a 95% interval confidence, the relationship between PC1 and PC2 is shown in Figure 6a by covariance error ellipses, while the relationship among PC1, PC2 and PC3 is shown in Figure 6b by covariance error ellipsoids. The classification results show that different types of microalgae samples are well-separated using this method. In addition, the fluorescence detection mode also shows great potential for marine microalgae discrimination as well as environmental monitoring.

4. Discussion

We developed a multi-mode microscopic hyperspectral imager (MMHI) for the sensing of biological samples. The coaxial structure of illumination and detection ensures a uniformly-illuminated condition in FOV, so that possible shadows in the focal plane can be obviated. The spatial and spectral resolutions are 5 μm and 3 nm, respectively, to meet the microscopic observation for most biological samples. By replacing the objective with a higher magnification or the slit with narrower width, the spatial or spectral resolution can be further improved. Since the system adopts a push-broom scan mode, a large imaging region can be achieved for various application scenarios.
Three experimental detections in Section 3 demonstrated the capacity of our MMHI system in the transmission, reflection and fluorescence modes, providing potential areas of application, such as zooplankton detection [4], biometric applications [24,25] and environmental monitoring [26]. These experiments also show the feasibility of the MMHI system to detect samples with different characteristics, such as the transmission mode for transparent/translucent samples, the reflection mode for opaque samples and the fluorescence mode for fluorescent samples. We may additionally combine the results under different detection modes with artificial intelligence, e.g., the supervised learning algorithm [20], to achieve the feature extraction of a specific sample from a complex environment. If the captured images are written into the CMOS camera memory directly rather than a computer hard disk, a scanning rate of 1000 frames per second can be expected, which will greatly improve the applicable ability in on-site scenarios.
In terms of future improvements, higher speed of imaging, wider range of detected wavelength and multi-dimensional detection should be considered. The staring imaging mode through a galvanometer mirror can largely improve the scanning as well as imaging efficiency, providing a low-cost solution for fast measurement. Additionally, by designing optical structure and selecting special components, the wavelength band of the MMHI can be expanded to near-IR band for in-vivo detection [27]. Furthermore, combining the hyperspectral imaging technology with 3D microscopic inspection methods [28], the 2D hyperspectral image may be extended to 3D hyperspectral topography. We believe that the MMHI will have more applications in multi-functional bio detections in the future.

Author Contributions

Z.X. designed/modified the experimental optical path and instrument, Z.X. and Y.J. performed the experiments and analyzed the data, Z.X. and S.H. wrote this manuscript. S.H. supervised the work and finalized the manuscript. All authors have read and agreed to the published version of the manuscript.

Funding

This work was supported by the National Key Research and Development Program of China (No. 2018YFC1407503), the Fundamental Research Funds for the Central Universities (Zhejiang University NGICS Platform), the National Natural Science Foundation of China (11621101), and the Science and Technology Development Plan Project of Changshu (No.CS201806).

Acknowledgments

The authors are grateful to Fuhong Cai, Xiang Chen, Jiali Ji and Xin Li for valuable discussion and help.

Conflicts of Interest

The authors declare no conflict of interest.

References

  1. Wang, G.; Kulinski, P.; Hubert, P.; Deguine, A.; Petitprez, D.; Crumeyrolle, S.; Fertein, E.; Deboudt, K.; Flament, P.; Sigrist, M.W.; et al. Filter-Free Light Absorption Measurement of Volcanic Ashes and Ambient Particulate Matter Using Multi-Wavelength Photoacoustic Spectroscopy. Prog. Electromagn. Res. 2019, 166, 59–74. [Google Scholar] [CrossRef] [Green Version]
  2. Ishikawa, M.; Okamoto, C.; Shinoda, K.; Komagata, H.; Iwamoto, C.; Ohuchida, K.; Hashizume, M.; Shimizu, A.; Kobayashi, N. Detection of pancreatic tumor cell nuclei via a hyperspectral analysis of pathological slides based on stain spectra. Biomed. Opt. Express 2019, 10, 4568–4588. [Google Scholar] [CrossRef]
  3. Cai, F.; Chen, J.; Xie, X.; Xie, J. The design and implementation of portable rotational scanning imaging spectrometer. Opt. Commun. 2020, 459, 125016. [Google Scholar] [CrossRef]
  4. Nielsen, J.H.; Pedersen, C.; Kiorboe, T.; Nikolajsen, T.; Brydegaard, M.; Rodrigo, P.J. Investigation of autofluorescence in zooplankton for use in classification of larval salmon lice. Appl. Opt. 2019, 58, 7022–7027. [Google Scholar] [CrossRef]
  5. Tan, S.; Tsang, L. Efficient Broadband Evaluations of Lattice Green's Functions via Imaginary Wavenumber Components Extractions. Prog. Electromagn. Res. 2019, 164, 63–74. [Google Scholar] [CrossRef] [Green Version]
  6. Mollaei, M.; Kurdjumov, S.; Hurshkainen, A.; Simovski, C. Decoupling of Two Closely Located Dipoles by a Single Passive Scatterer for Ultra-High Field MRI. Prog. Electromagn. Res. 2019, 164, 155–166. [Google Scholar] [CrossRef] [Green Version]
  7. Cai, F.; Wang, T.; Wu, J.; Zhang, X. Handheld four-dimensional optical sensor. Optik 2020, 203. [Google Scholar] [CrossRef]
  8. Lu, G.; Fei, B. Medical hyperspectral imaging: A review. J. Biomed. Opt. 2014, 19, 10901. [Google Scholar] [CrossRef]
  9. Baek, I.; Kim, M.; Cho, B.-K.; Mo, C.; Barnaby, J.; McClung, A.; Oh, M. Selection of Optimal Hyperspectral Wavebands for Detection of Discolored, Diseased Rice Seeds. Appl. Sci. 2019, 9, 1027. [Google Scholar] [CrossRef] [Green Version]
  10. Fournier, G.; Ardouin, J.-P.; Levesque, M. Modeling Sea Bottom Hyperspectral Reflectance. Appl. Sci. 2018, 8, 2680. [Google Scholar] [CrossRef] [Green Version]
  11. Schie, I.W.; Alber, L.; Gryshuk, A.L.; Chan, J.W. Investigating drug induced changes in single, living lymphocytes based on Raman micro-spectroscopy. Analyst 2014, 139, 2726–2733. [Google Scholar] [CrossRef]
  12. Perrin, S.; Li, H.; Leong-Hoi, A.; Lecler, S.; Montgomery, P. Illumination conditions in microsphere-assisted microscopy. J. Microsc. 2019, 274, 69–75. [Google Scholar] [CrossRef]
  13. Craig, J.; Sansonetti, M.; Joseph, R. Wavelengths of spectral lines in mercury pencil lamps. Appl. Opt. 1996, 35, 1. [Google Scholar] [CrossRef] [Green Version]
  14. Cho, J.; Gemperline, P.J.; Walker, D. Wavelength calibration method for a CCD detector and multichannel fiber-optic probes. Appl. Spectrosc. 1995, 49, 1841–1845. [Google Scholar] [CrossRef]
  15. Cai, F.; Wang, Y.; Gao, M.; He, S. The design and implementation of a low-cost multispectral endoscopy through galvo scanning of a fiber bundle. Opt. Commun. 2018, 428, 1–6. [Google Scholar] [CrossRef]
  16. Leblond, F.; Davis, S.C.; Valdes, P.A.; Pogue, B.W. Pre-clinical whole-body fluorescence imaging: Review of instruments, methods and applications. J. Photochem. Photobiol. B 2010, 98, 77–94. [Google Scholar] [CrossRef] [Green Version]
  17. Damestani, Y.; Galan-Hoffman, D.E.; Ortiz, D.; Cabrales, P.; Aguilar, G. Inflammatory response to implantation of transparent nanocrystalline yttria-stabilized zirconia using a dorsal window chamber model. Nanomedicine 2016, 12, 1757–1763. [Google Scholar] [CrossRef]
  18. Cai, F.; Gao, M.; Li, J.; Lu, W.; Wu, C. Compact Dual-Channel (Hyperspectral and Video) Endoscopy. Front. Phys. 2020, 8. [Google Scholar] [CrossRef]
  19. Zhu, Y.; Yin, X.; Jia, X.; Hu, J. Latent Fingerprint Segmentation Based on Convolutional Neural Networks. In Proceedings of the IEEE Workshop on Information Forensics and Security (WIFS), Rennes, France, 4–7 December 2017; IEEE: Piscataway, NJ, USA, 2017; ISBN 9781509067701. [Google Scholar] [CrossRef]
  20. Militello, C.; Rundo, L.; Minafra, L.; Cammarata, F.P.; Calvaruso, M.; Conti, V.; Russo, G. MF2C3: Multi-Feature Fuzzy Clustering to Enhance Cell Colony Detection in Automated Clonogenic Assay Evaluation. Symmetry 2020, 12, 773. [Google Scholar] [CrossRef]
  21. Ruiz-Santaquiteria, J.; Bueno, G.; Deniz, O.; Vallez, N.; Cristobal, G. Semantic versus instance segmentation in microscopic algae detection. Eng. Appl. Artif. Intell. 2020, 87, 103271. [Google Scholar] [CrossRef]
  22. Edwards, P.; Zhang, C.; Zhang, B.; Hong, X.; Nagarajan, V.K.; Yu, B.; Liu, Z. Smartphone based optical spectrometer for diffusive reflectance spectroscopic measurement of hemoglobin. Sci. Rep. 2017, 7, 12224. [Google Scholar] [CrossRef] [Green Version]
  23. De Oliveira, M.A.S.; Campbell, M.; Afify, A.M.; Huang, E.C.; Chan, J.W. Hyperspectral Raman microscopy can accurately differentiate single cells of different human thyroid nodules. Biomed. Opt. Express 2019, 10, 4411–4421. [Google Scholar] [CrossRef] [PubMed]
  24. Bevacqua, T.; Bellizzi, G.; Isernia, T.; Crocco, L. A Method for Effective Permittivity and Conductivity Mapping of Biological Scenarios via Segmented Contrast Source Inversion. Prog. Electromagn. Res. 2019, 164, 1–15. [Google Scholar] [CrossRef] [Green Version]
  25. Kho, E.; Dashtbozorg, B.; de Boer, L.L.; Van de Vijver, K.K.; Sterenborg, H.; Ruers, T.J.M. Broadband hyperspectral imaging for breast tumor detection using spectral and spatial information. Biomed. Opt. Express 2019, 10, 4496–4515. [Google Scholar] [CrossRef] [Green Version]
  26. Sigernes, F.; Syrjasuo, M.; Storvold, R.; Fortuna, J.; Grotte, M.E.; Johansen, T.A. Do it yourself hyperspectral imager for handheld to airborne operations. Opt. Express 2018, 26, 6021–6035. [Google Scholar] [CrossRef]
  27. Simon, J.C.; Lucas, S.A.; Staninec, M.; Tom, H.; Chan, K.H.; Darling, C.L.; Cozin, M.J.; Lee, R.C.; Fried, D. Near-IR transillumination and reflectance imaging at 1300 nm and 1500–1700 nm for in vivo caries detection. Lasers. Surg. Med. 2016, 48, 828–836. [Google Scholar] [CrossRef] [Green Version]
  28. Xu, Z.; Forsberg, E.; Guo, Y.; Cai, F.; He, S. Light-Sheet Microscopy for Surface Topography Measurements and Quantitative Analysis. Sensors 2020, 20, 2842. [Google Scholar] [CrossRef]
Figure 1. Schematic diagram of microscopic hyperspectral imager and the results of system calibration. (a) A photo of the prototype microscopic hyperspectral imager. (b) Schematic illustration of the optical elements: 1. Objective, 2. Imaging lens, 3. Slit, 4. Collimator lens, 5. Prism, 6. Grating, 7. Prism, 8. Tube lens, 9. CMOS (complementary metal oxide semiconductor). (c) Original spectral image of a calibration source. (d) Spectrum of the calibration source measured by our system. The spectral resolution is about 3 nm. (e) Calibration result between the wavelength and pixel index. (f) Spectrum of the calibration source measured by a commercial spectrometer. (g) Reconstructed hyperspectral image of the resolution test target. Resolvable lines in element 6 of group 6 (4.39 μm). (h) Prototype of the whole working system.
Applsci 10 04876 g001
Figure 2. (a) Schematic diagram of shadow generation under the lateral illumination condition. (b) Illustration of multi-mode detections. Reflection mode and fluorescence mode use epi-illumination, while transmission mode employs trans-illumination. Schematic diagram of each component: 1. Single mode fiber, 2. Fiber collimator, 3. Doublet lens, 4. Beam splitter, 5. Long pass filter, 6. Objective, 7. Sample and motion stage, 8. Infinity-corrected hyperspectral imaging system, consisting of the imaging module (including the imaging lens and slit), the diffraction module (including the doublet lens and PGP structure) and the detection module (including the tube lens and CMOS).
Applsci 10 04876 g002
Figure 3. Experimental results the hyperspectral detection of a zebrafish under the transmission mode. (a) Optical microscopic image of a zebrafish under a traditional microscopy with 40× objective. Scale bar: 100 μm. (b) Hyperspectral image of a zebrafish reconstructed from our system. Scale bar: 100 μm. (c) Partial enlarged image of the zebrafish and three points of interest, including the transparent fin (marked as red dot), speckle (marked as blue star) and yolk sac (marked as yellow triangle). (d) Corresponding transmittance spectrum at the three points of interest.
Applsci 10 04876 g003
Figure 4. Experimental results for the hyperspectral detection of a human fingerprint under the reflection mode. (a) The reflection spectrum of the fingerprint. (b) The reflection spectrum of the standard white plate. (c) The hyperspectral image of the tested fingerprint. Scale bar: 500 μm. (d) The reflectance spectrum calculated by Equation (2) and the data in (a) and (b).
Applsci 10 04876 g004
Figure 5. (a) Measured fluorescence spectra of five disaster-causing microalgae by the multi-mode microscopic hyperspectral imager (MMHI) system. (b) Normalized spectra of (a) through Equation (3). (c) Measured fluorescence spectra of five disaster-causing microalgae by a commercial spectrometer. (d) Normalized spectra of (c).
Applsci 10 04876 g005
Figure 6. Classification with the experimental data for five disaster-causing algae samples. (a) The relationship between principal component (PC)1 and PC2. (b) The relationship among PC1, PC2 and PC3.
Applsci 10 04876 g006

