Numerical Investigation on the Evolution of Mechanical Properties of Rock Affected by Micro-Parameters

 , , ,
, , ,
Abstract
:1. Introduction
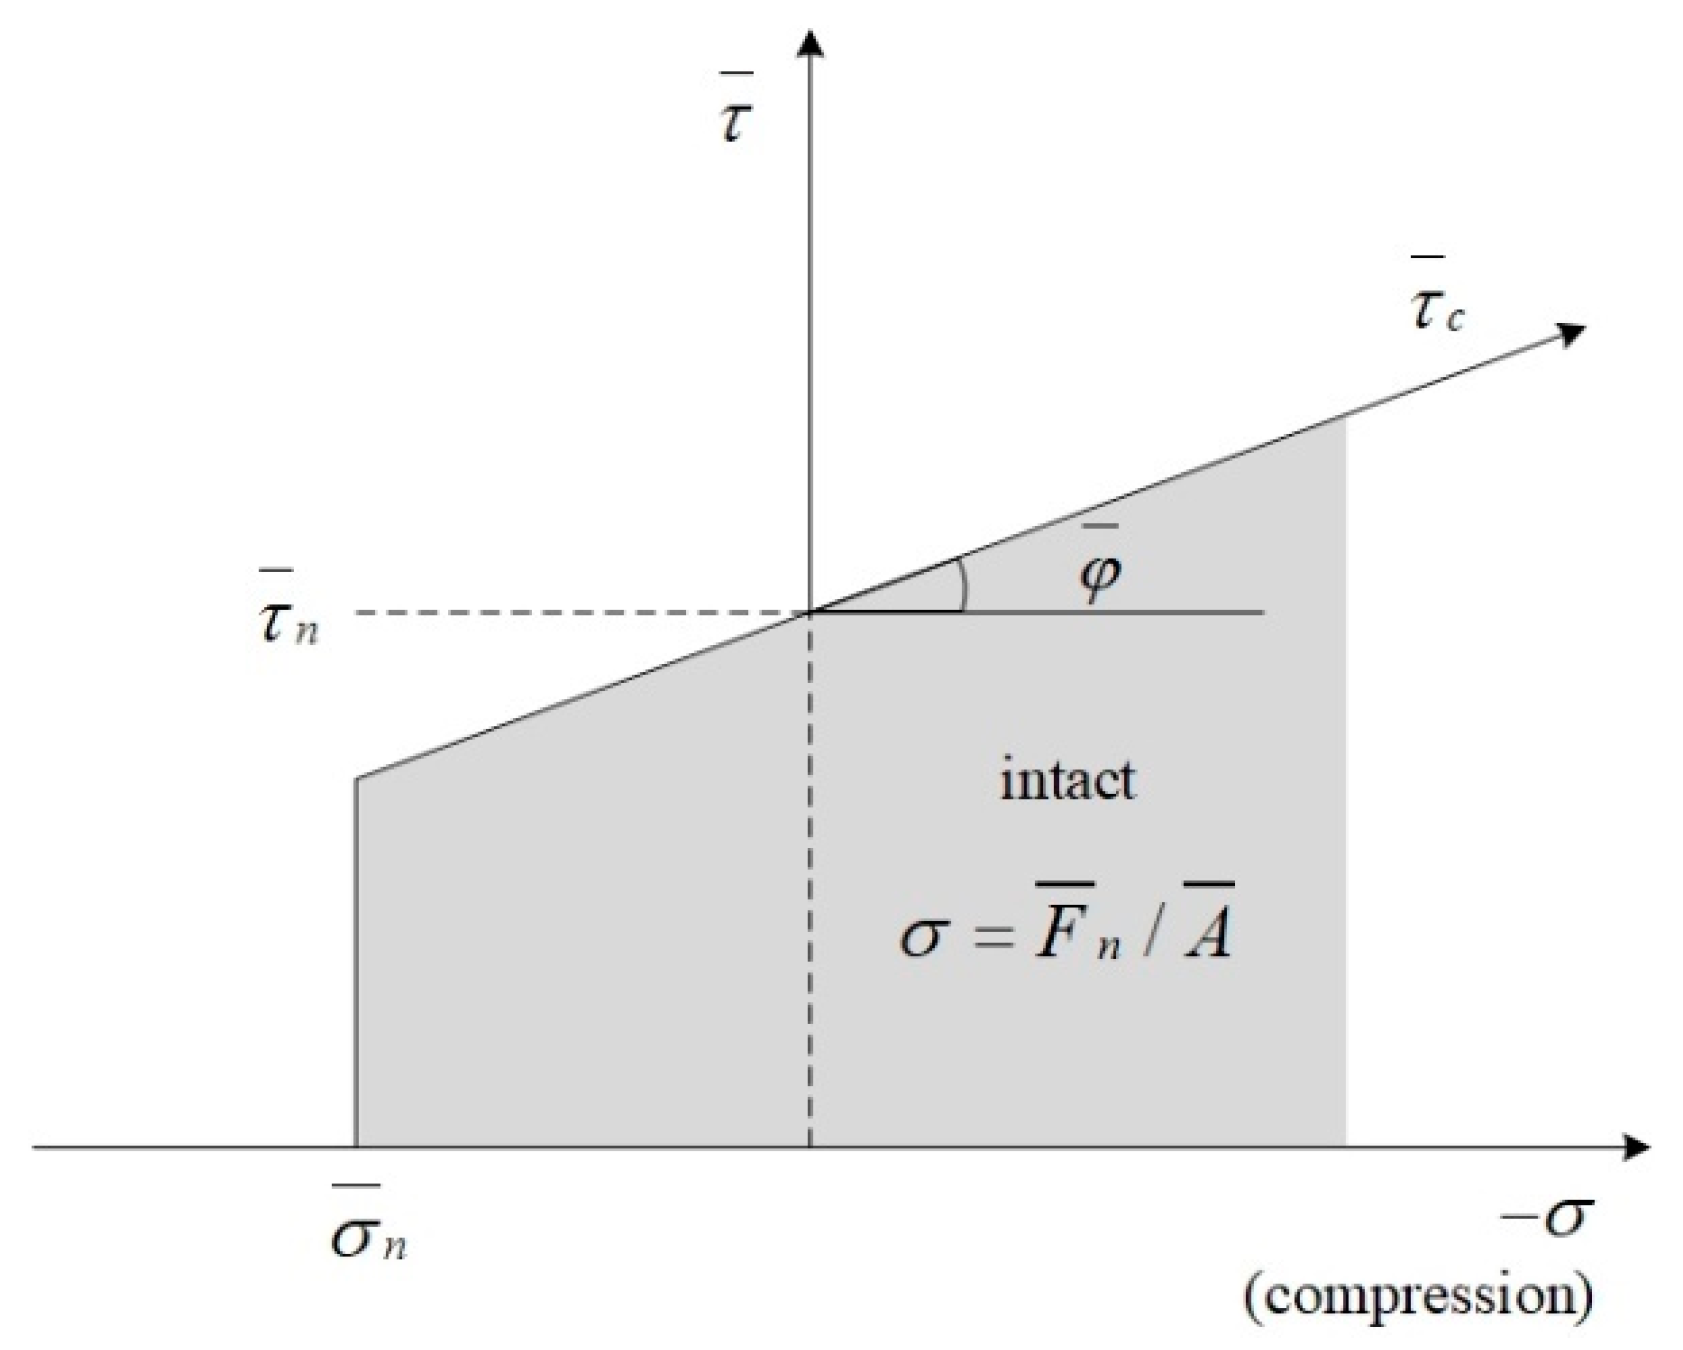
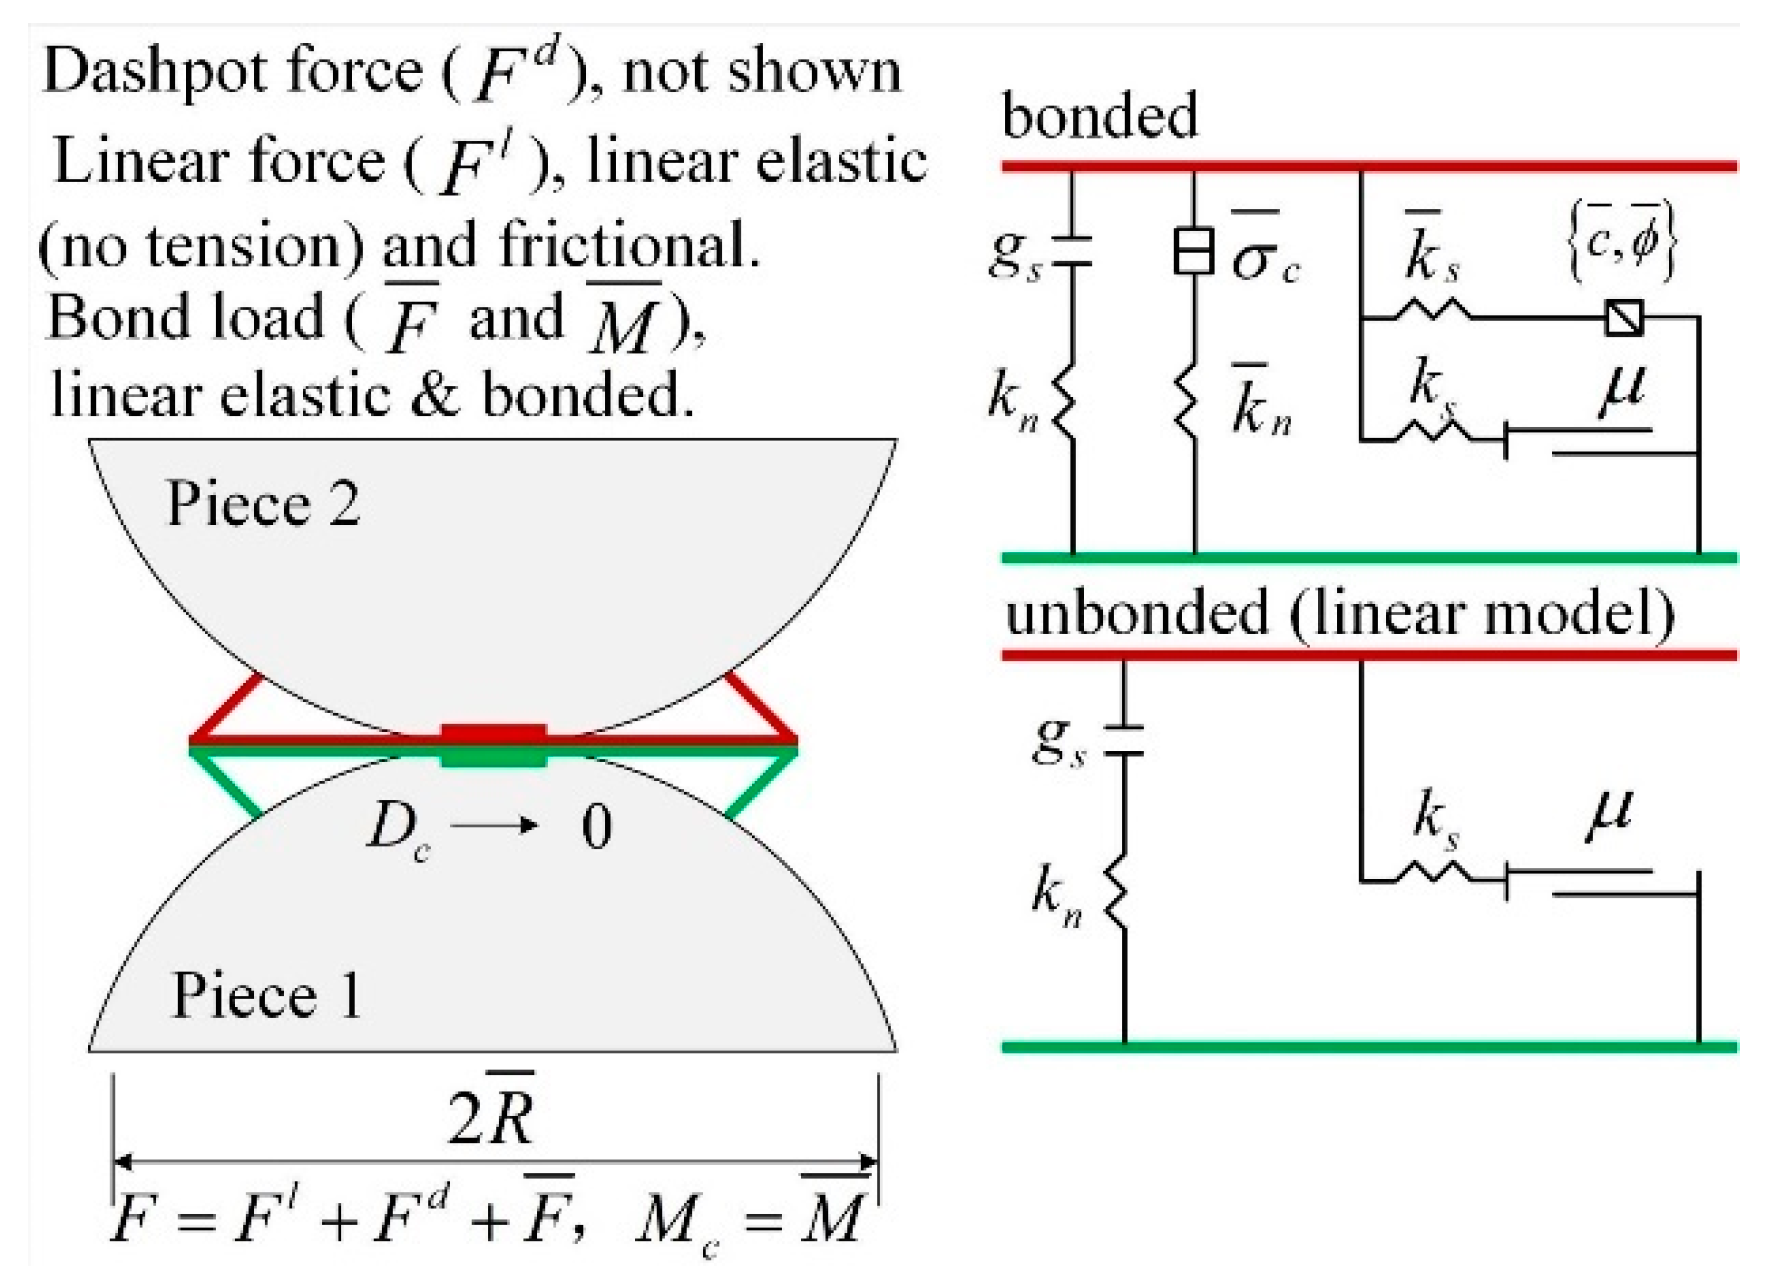
2. Parallel-Bond Model and Its Micro-Parameters
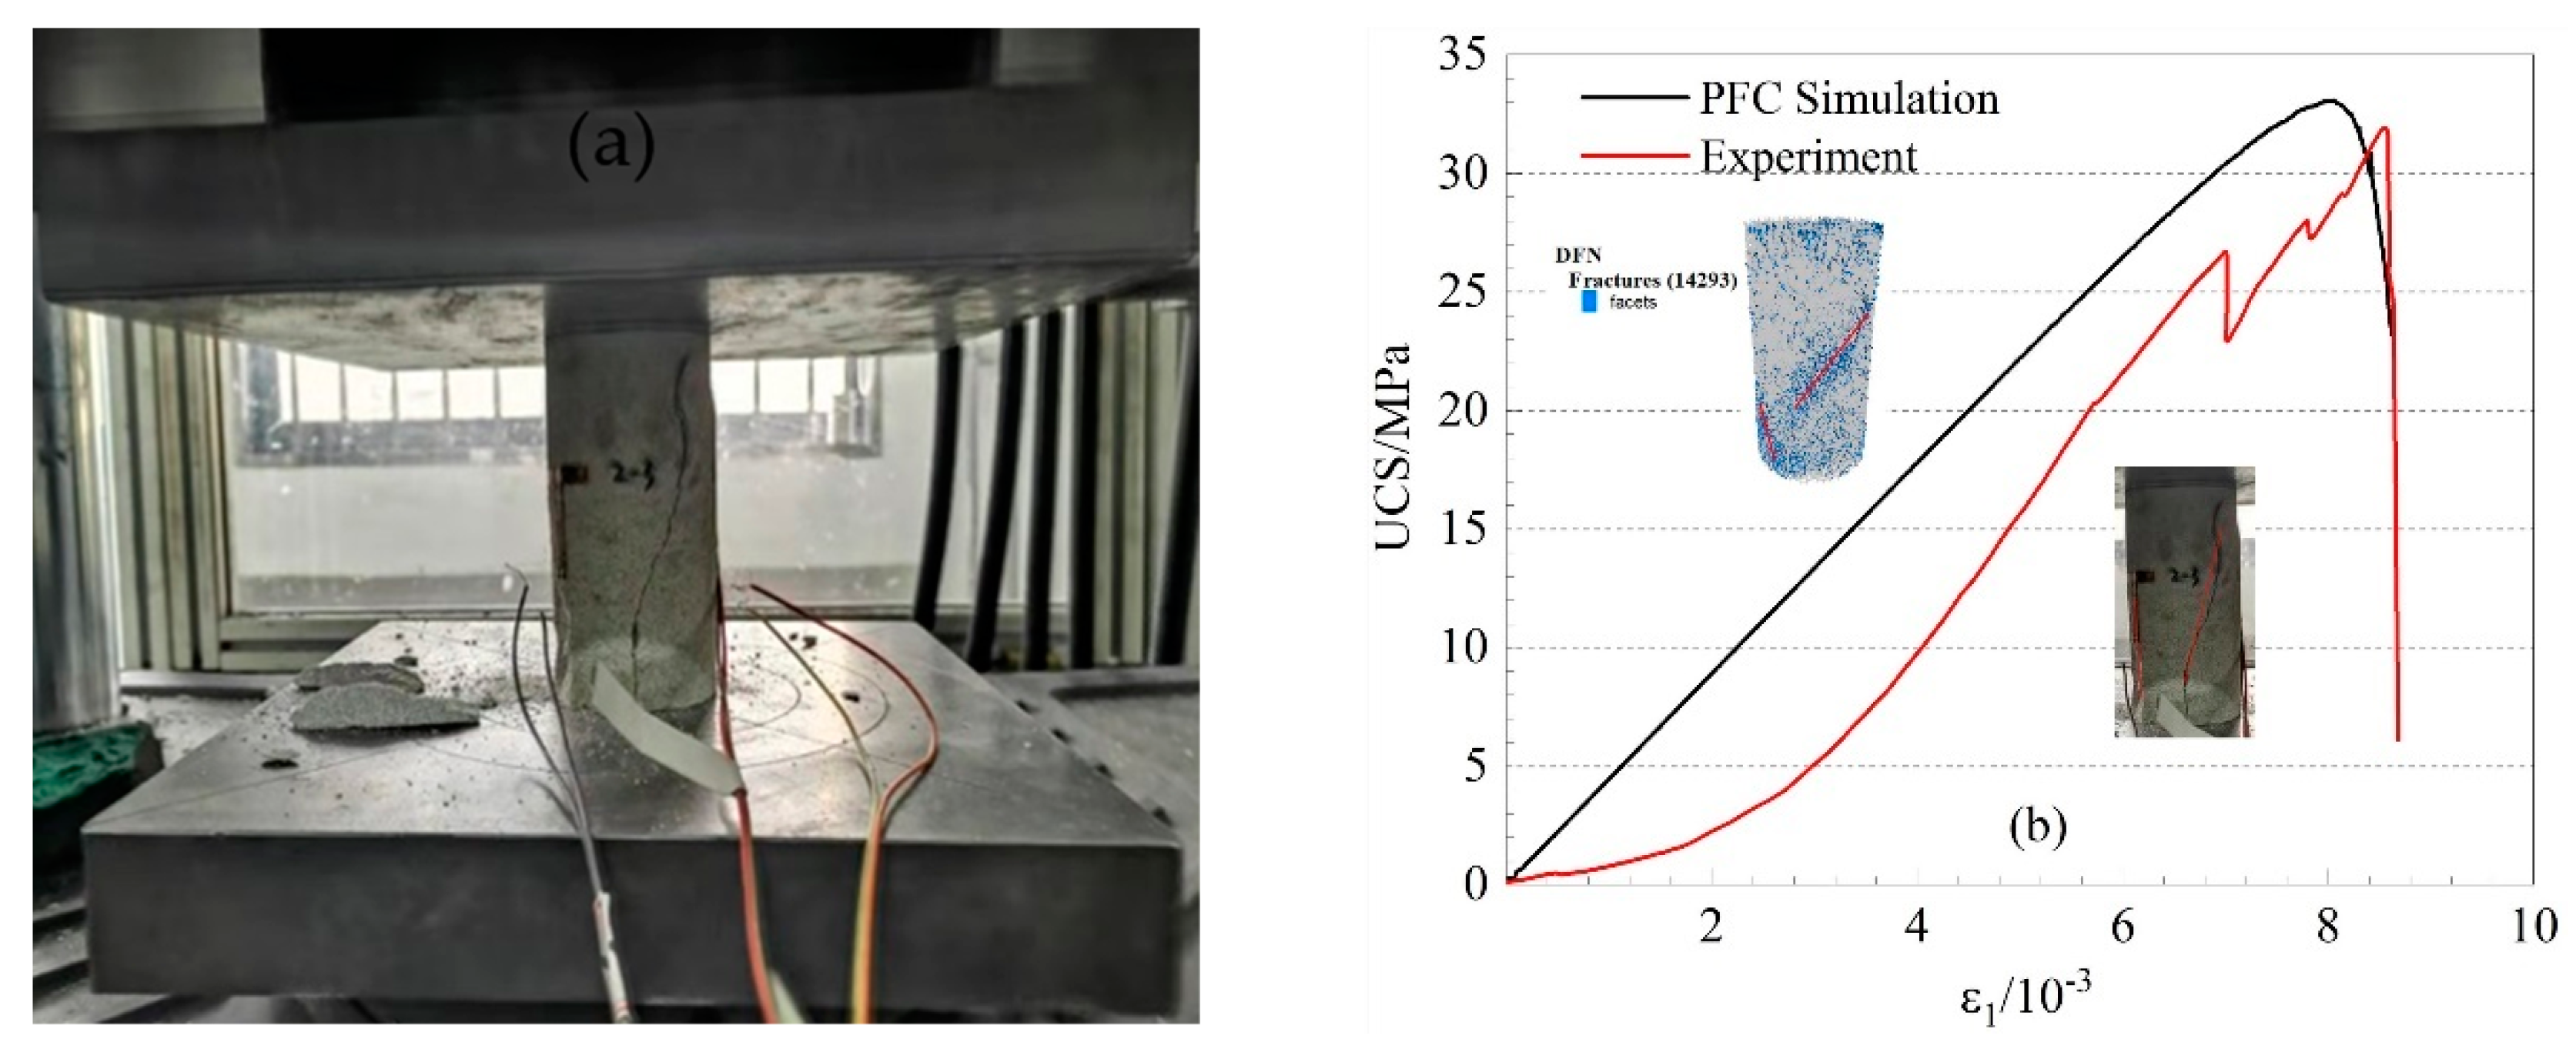
3. Experiment and Calibration
4. The Results of Micro-Parameters on Mechanical Properties of Rock
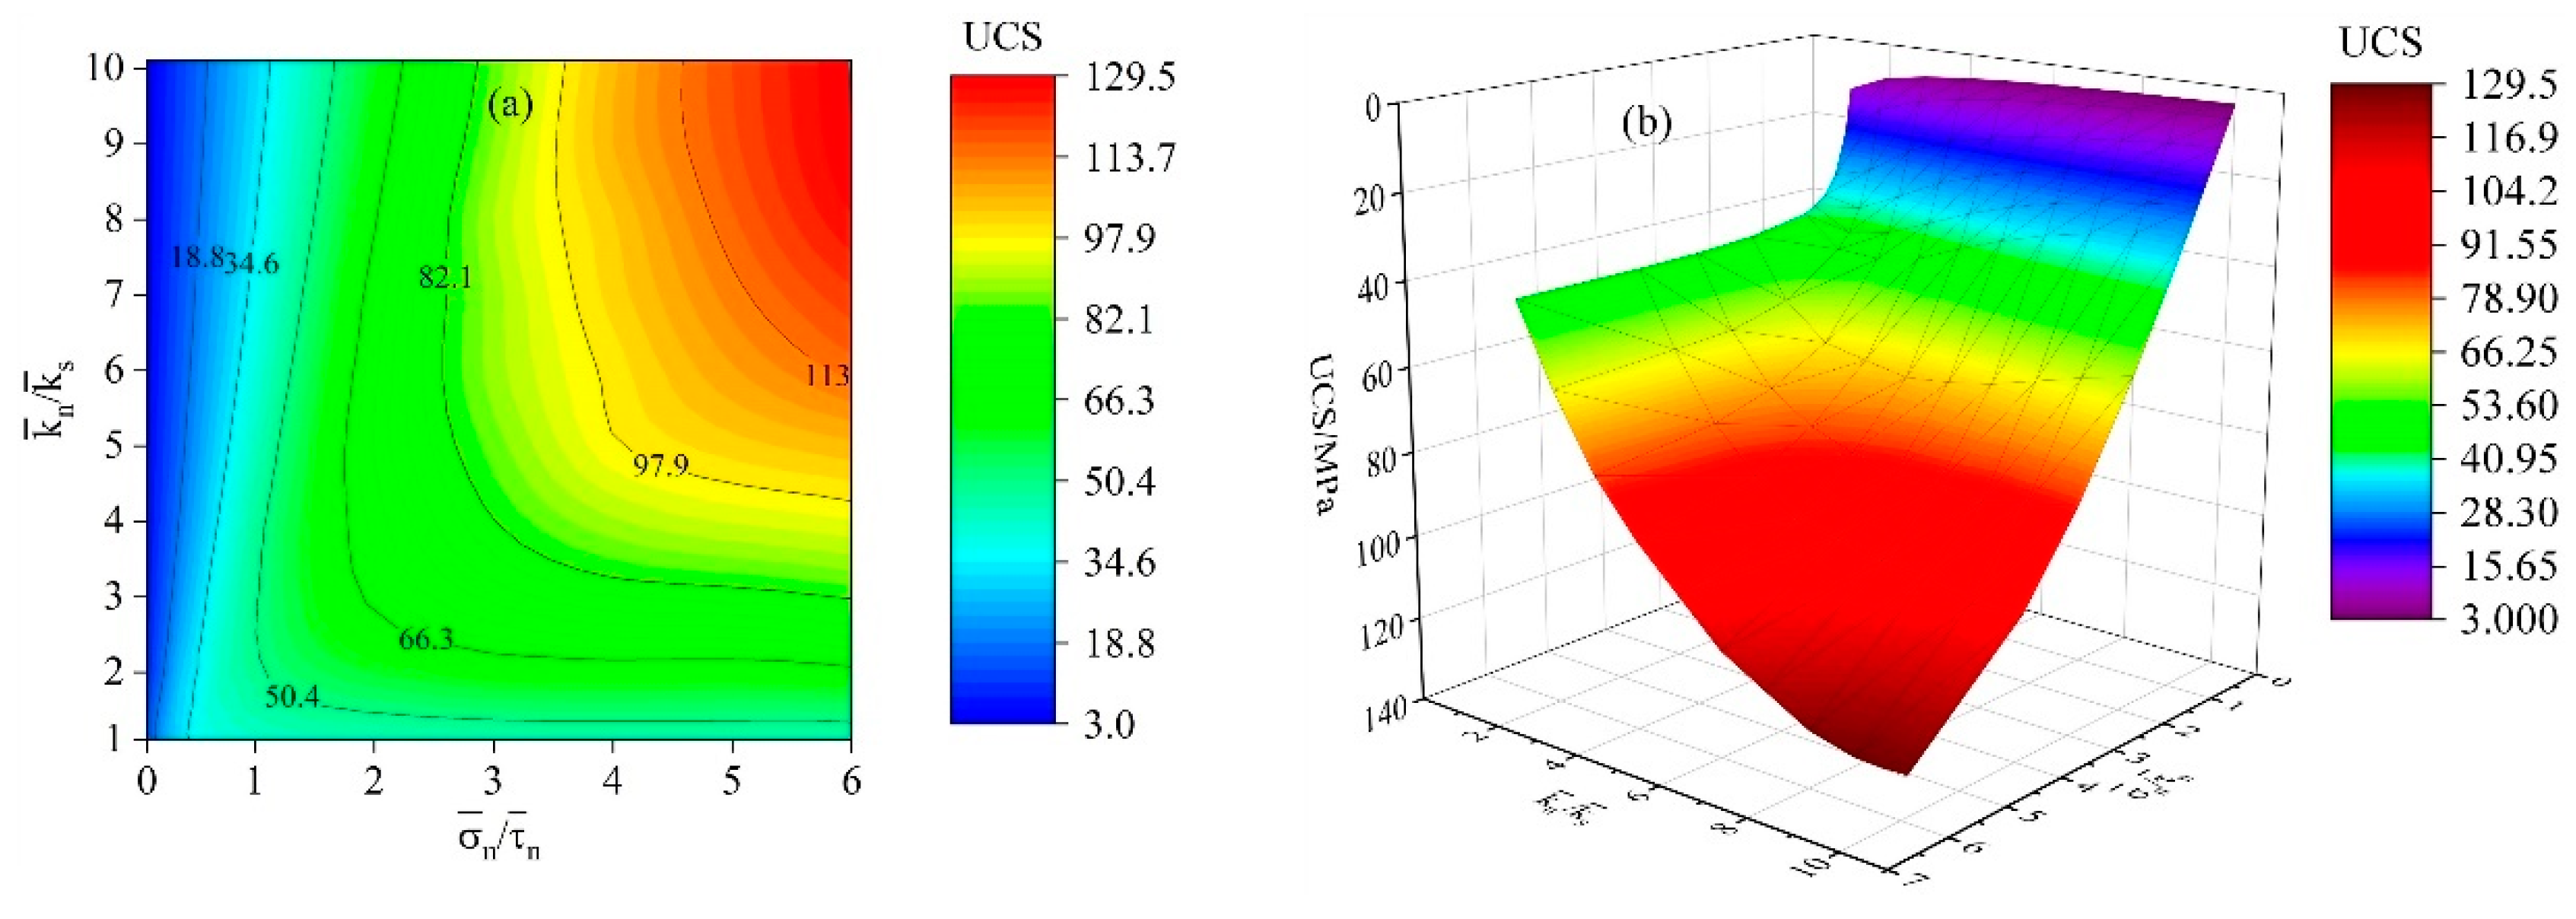
4.1. The Influence of Micro-Parameters on UCS
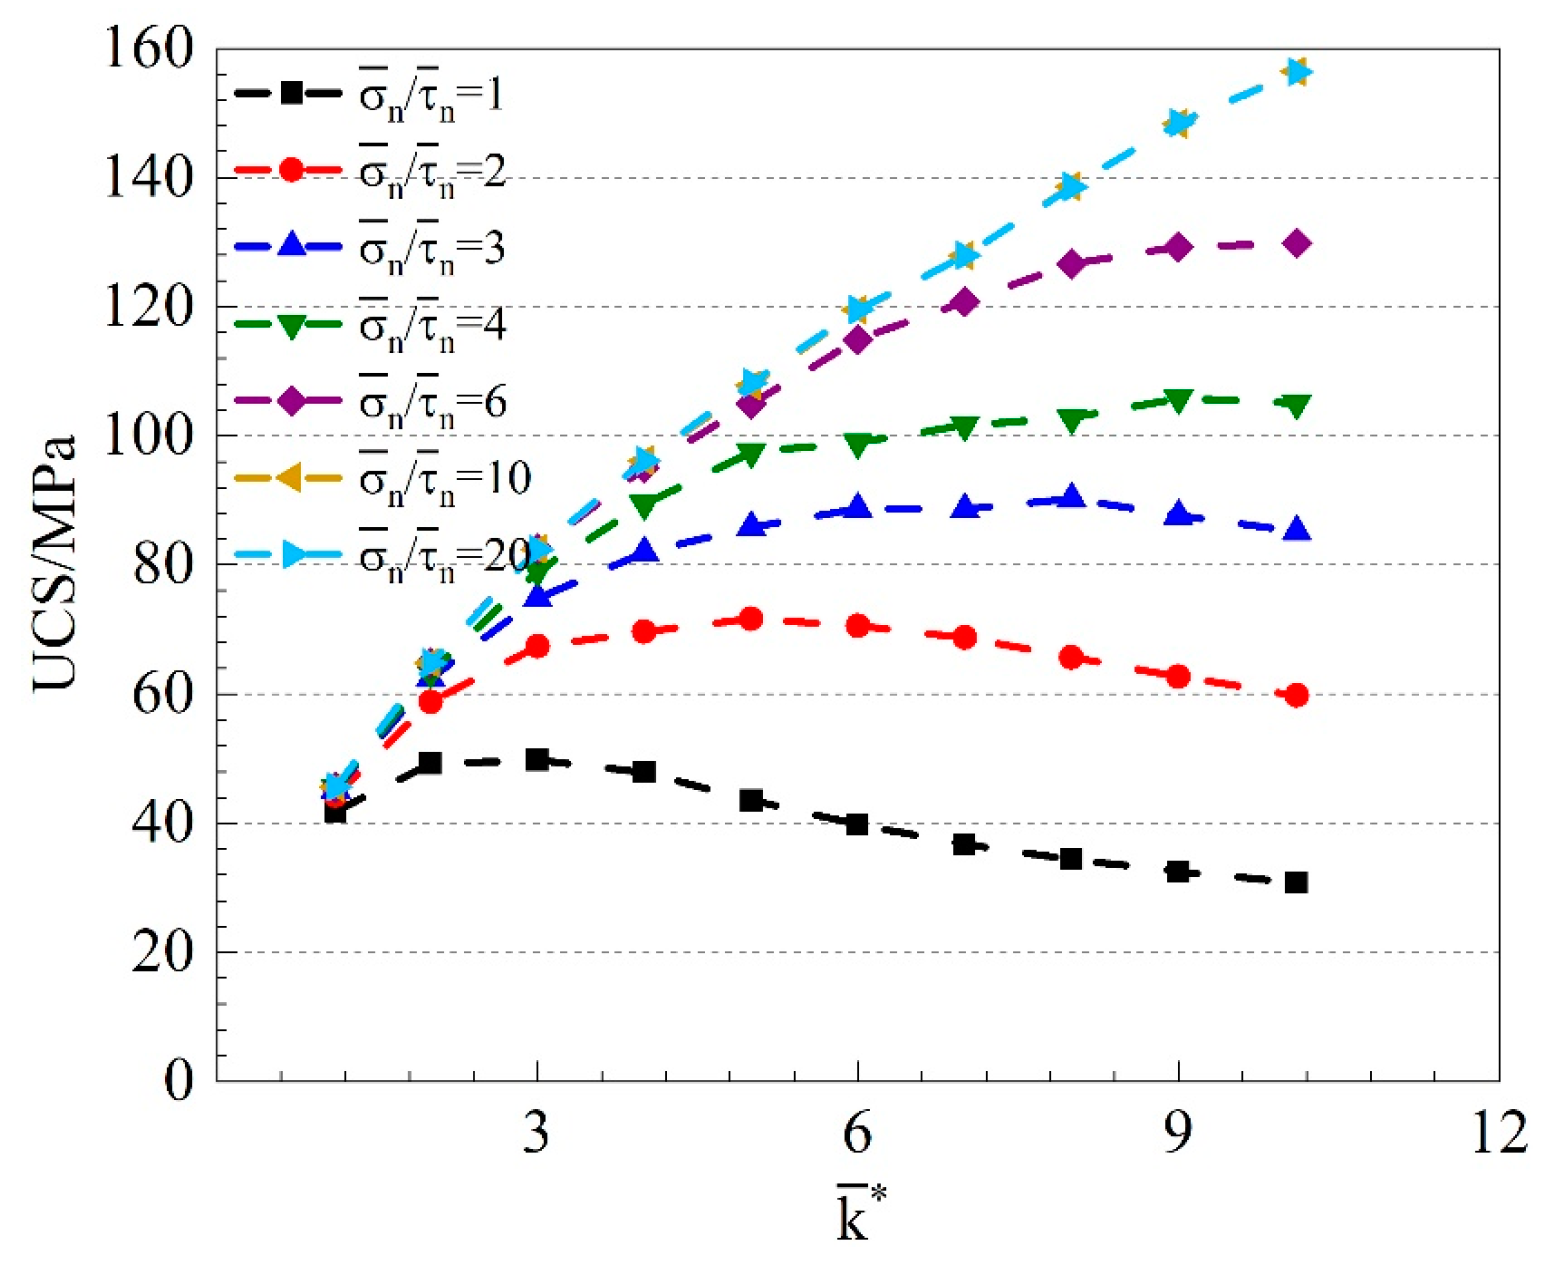
4.1.1. Combined Effects of and on UCS
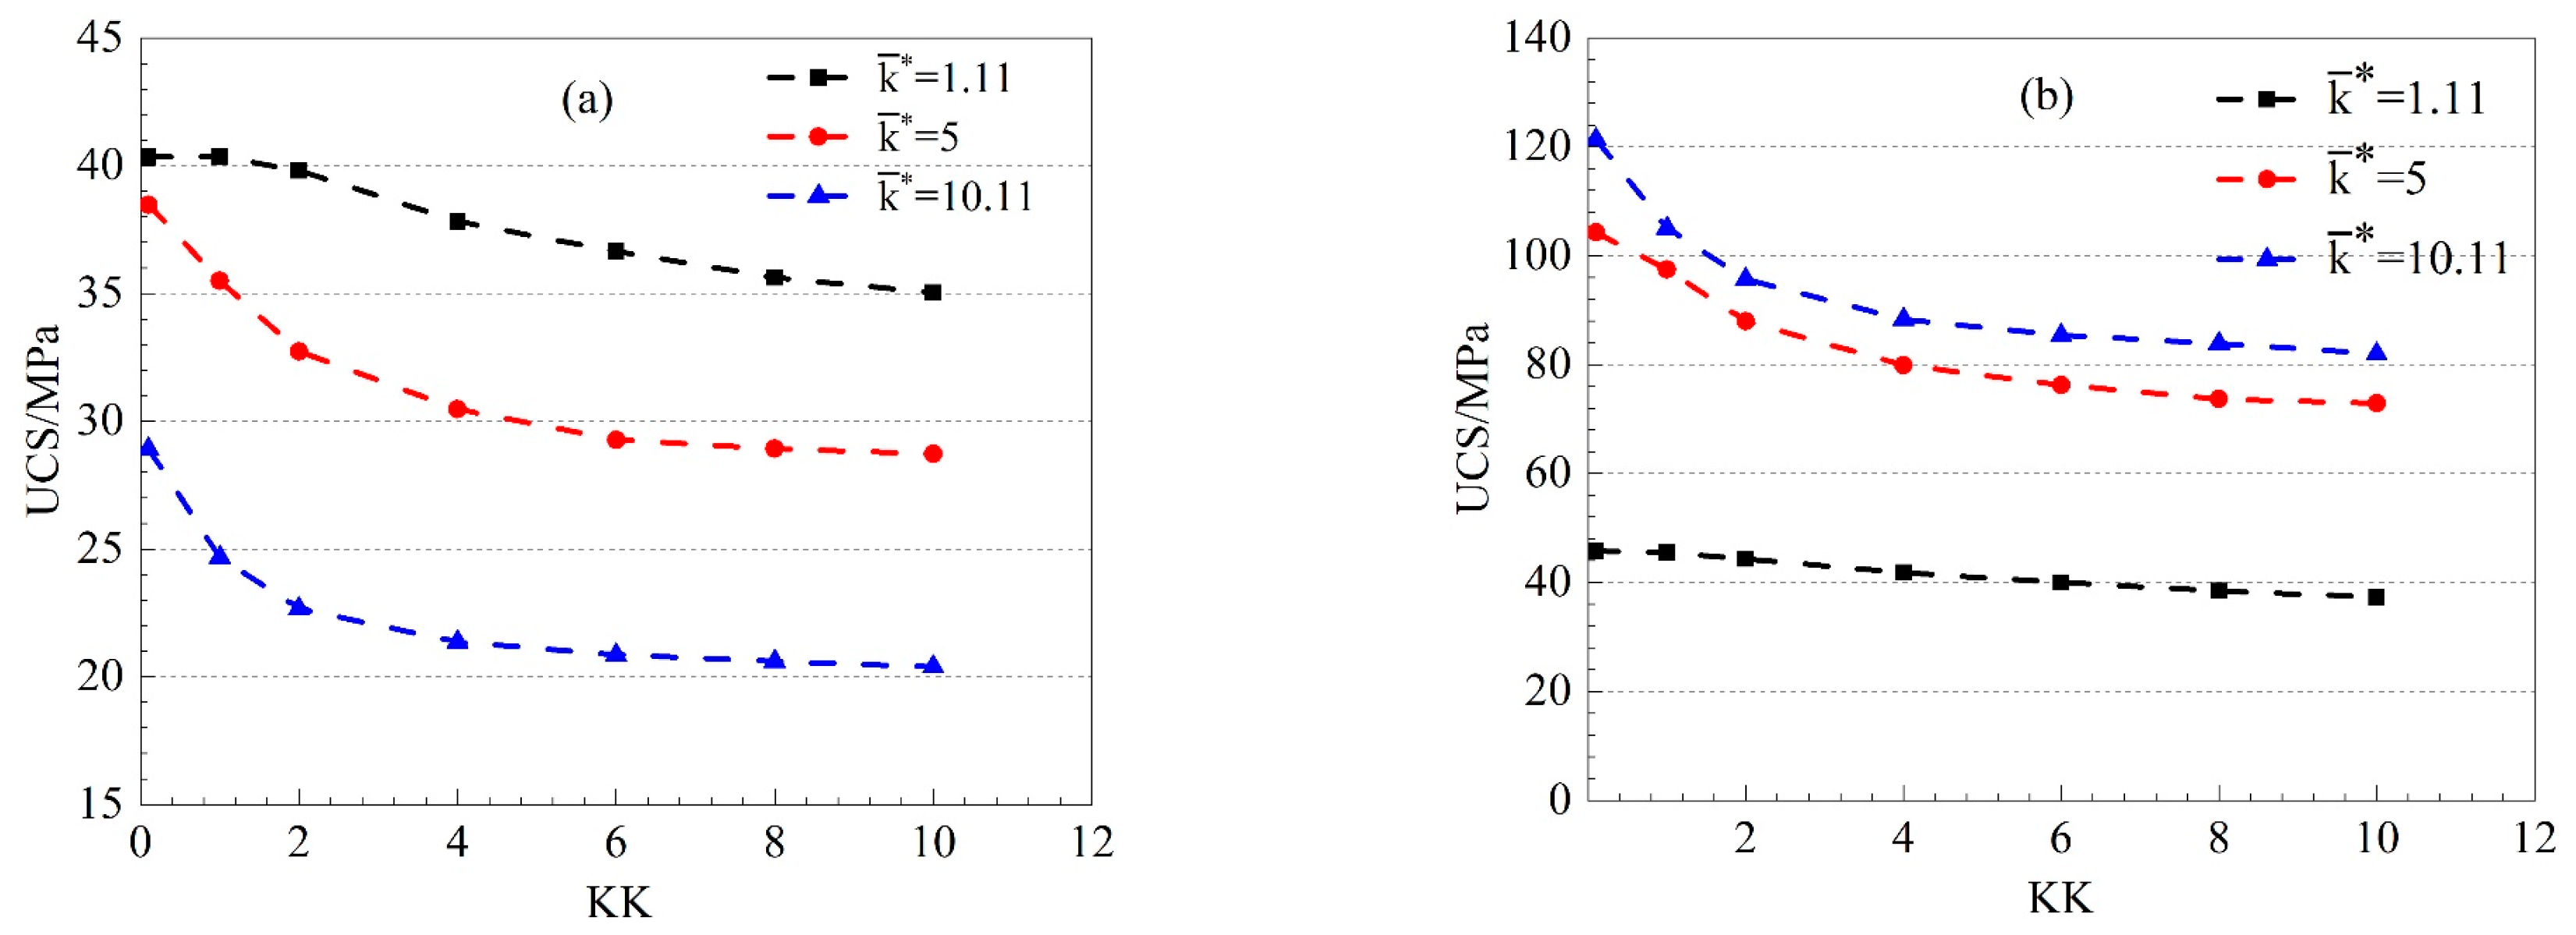
4.1.2. Combined Effects of KK and on UCS
4.1.3. Combined Effects of KK and on UCS
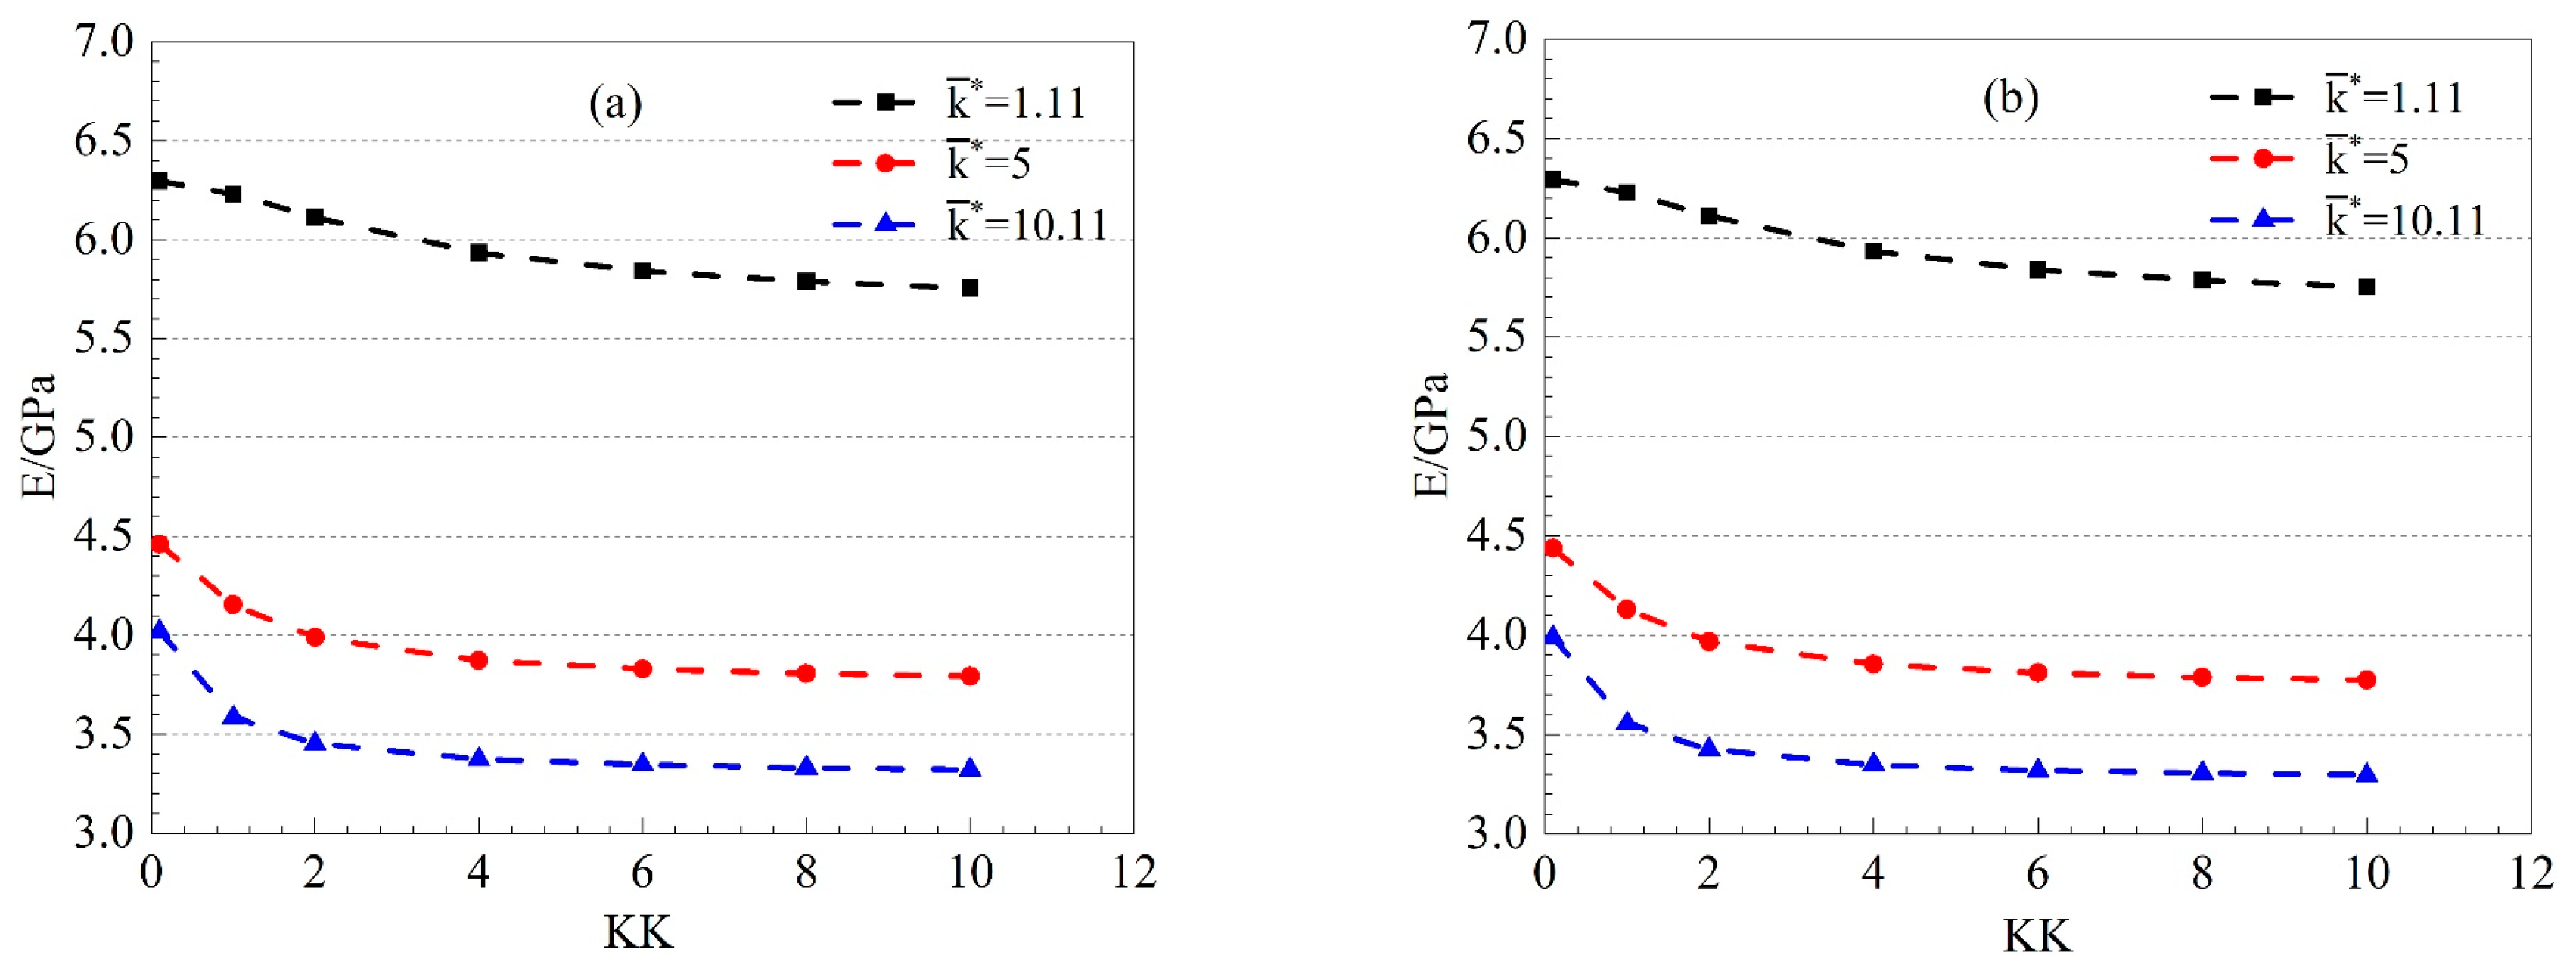
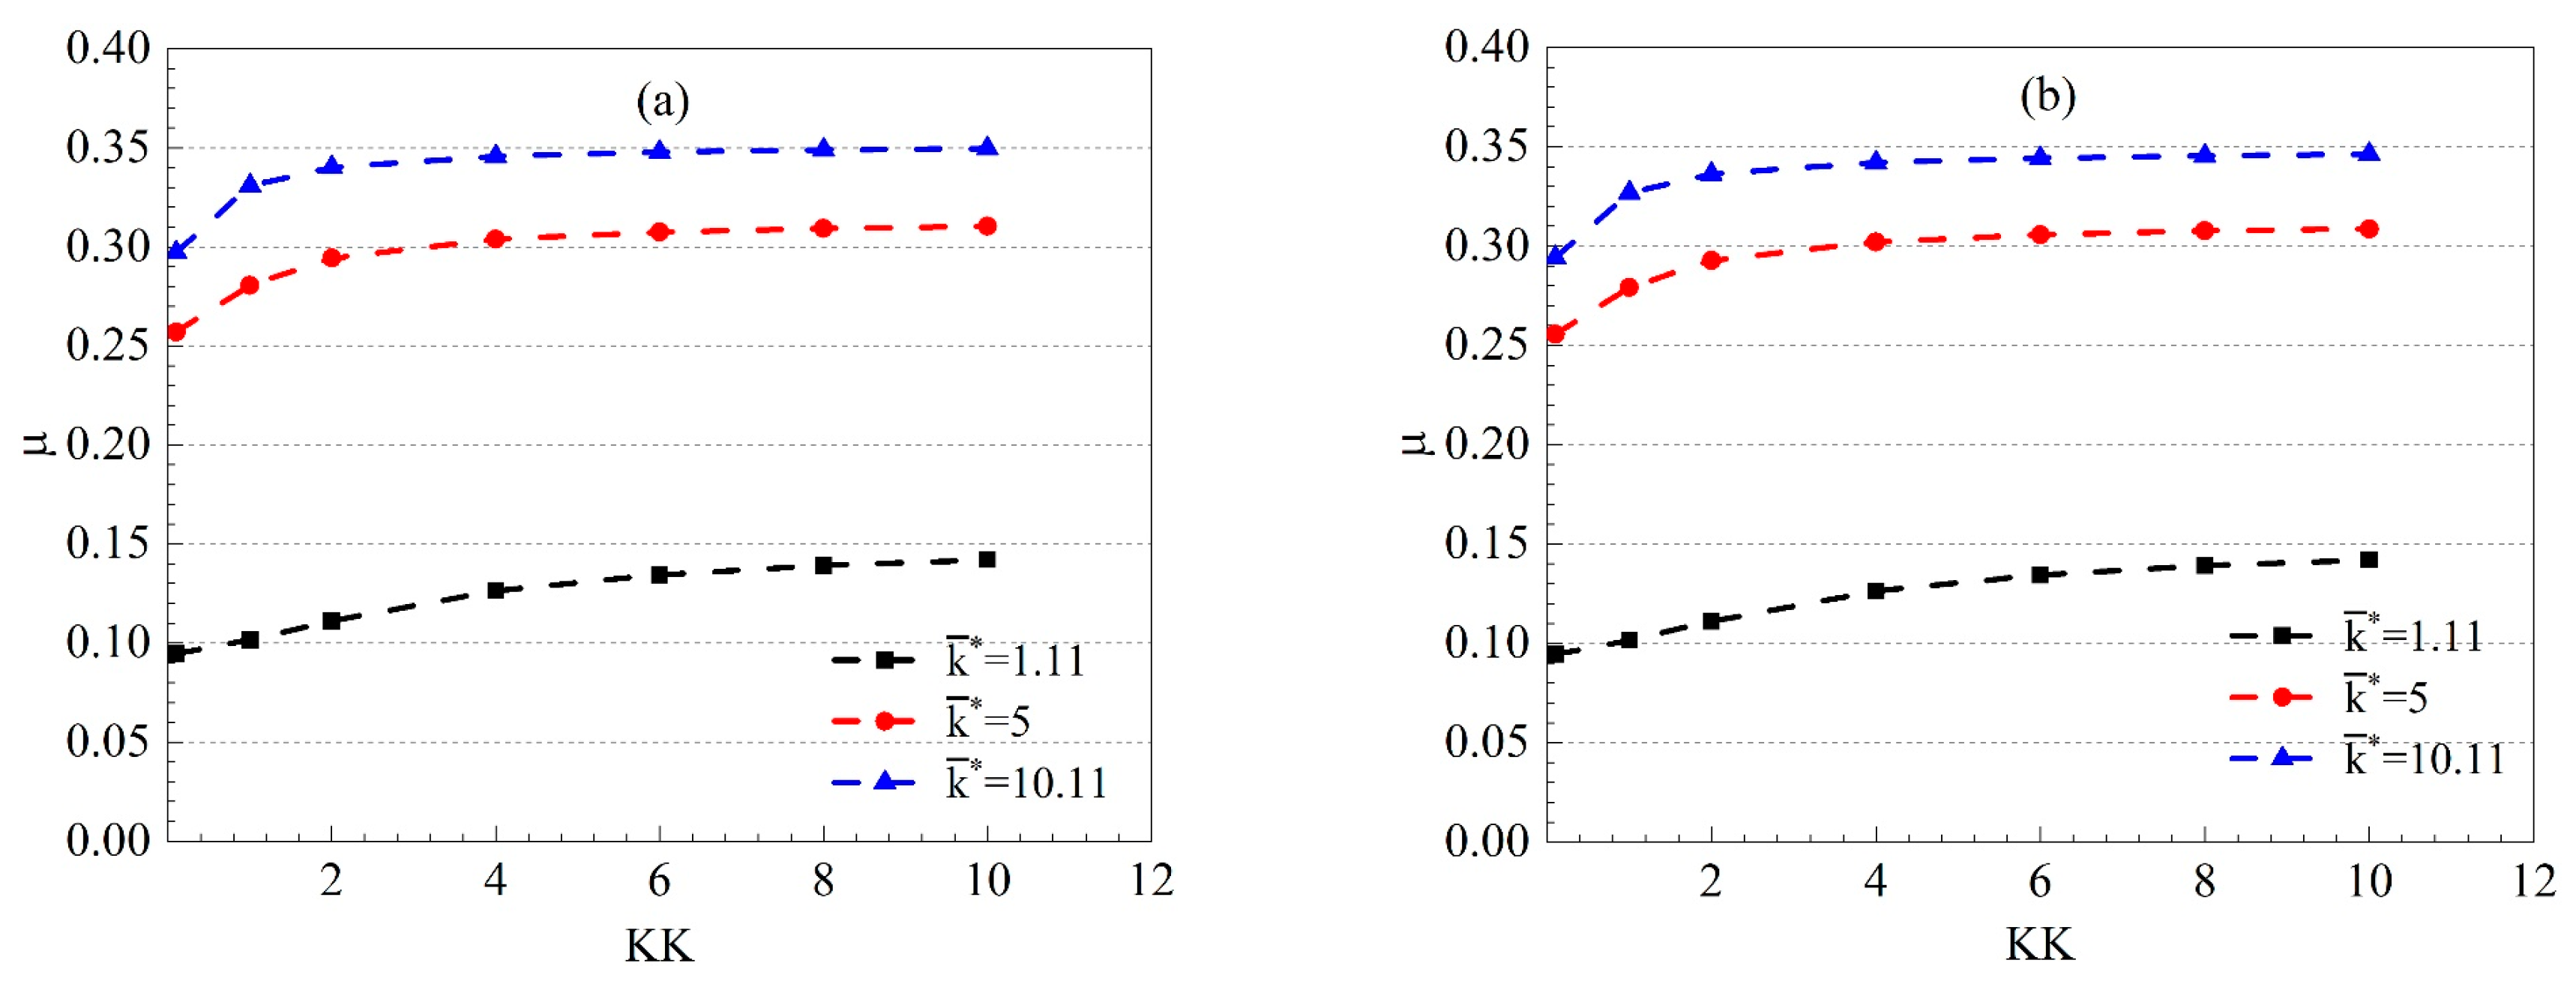
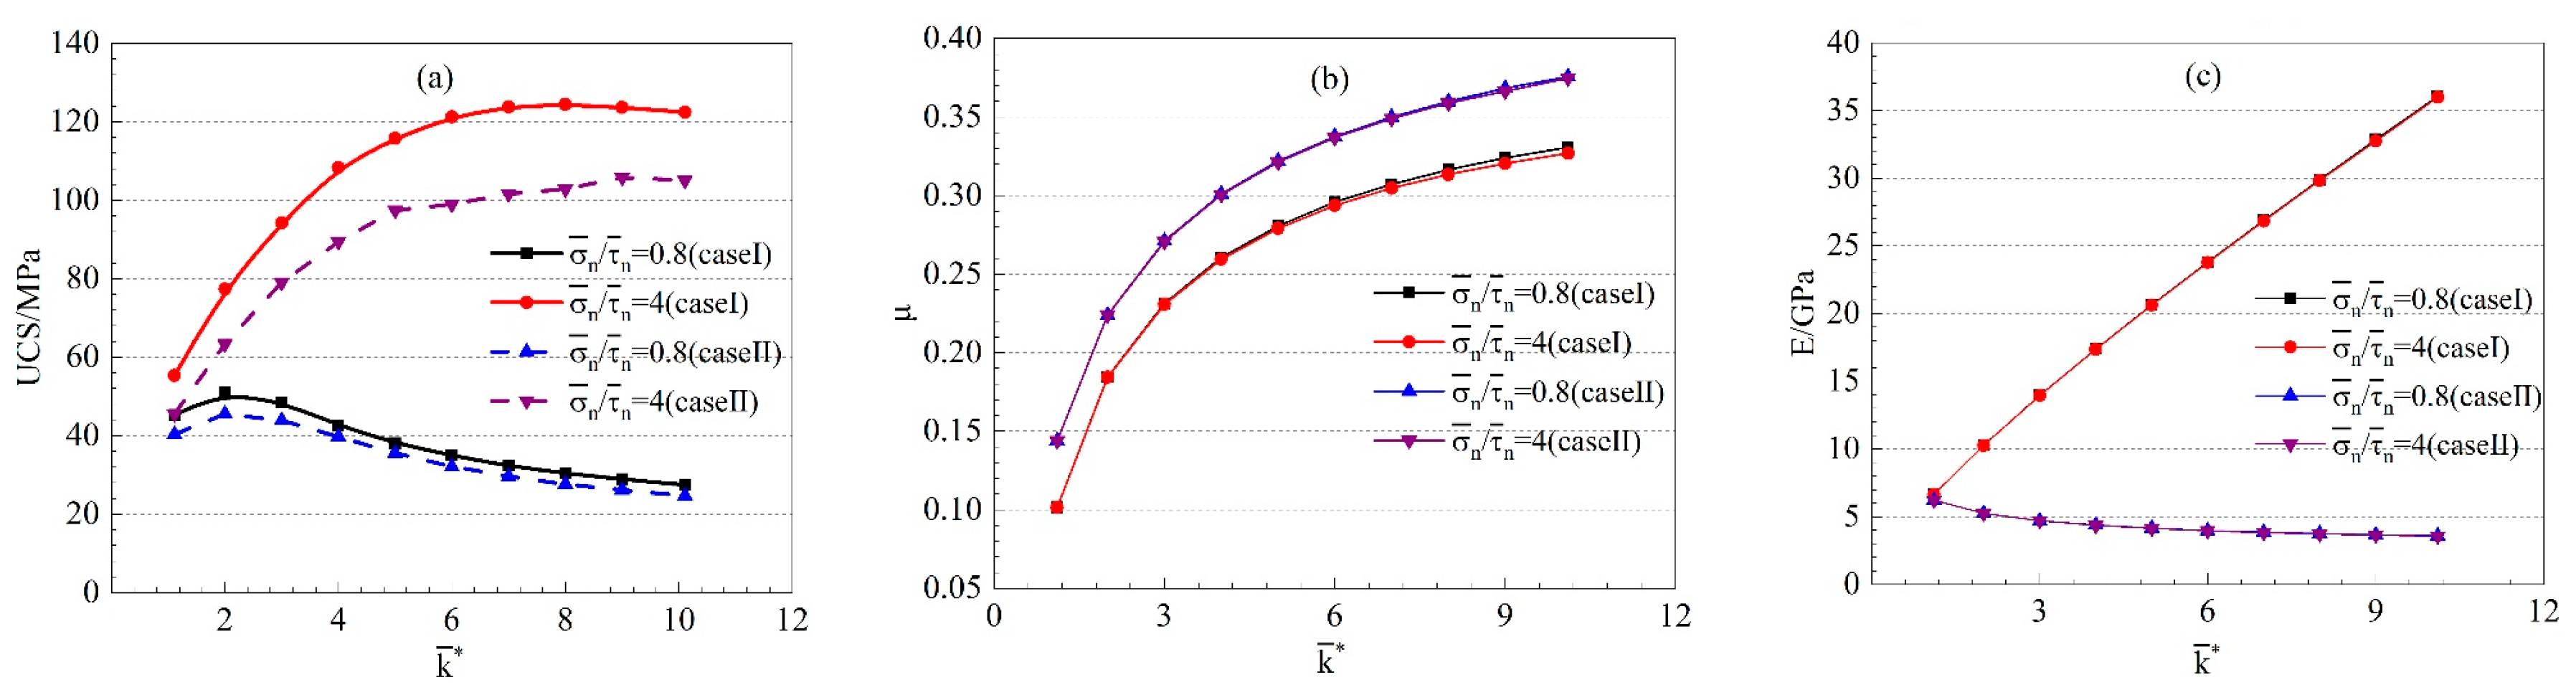
4.2. The Influence of KK and on Young’s Modulus and Poisson’s Ratio
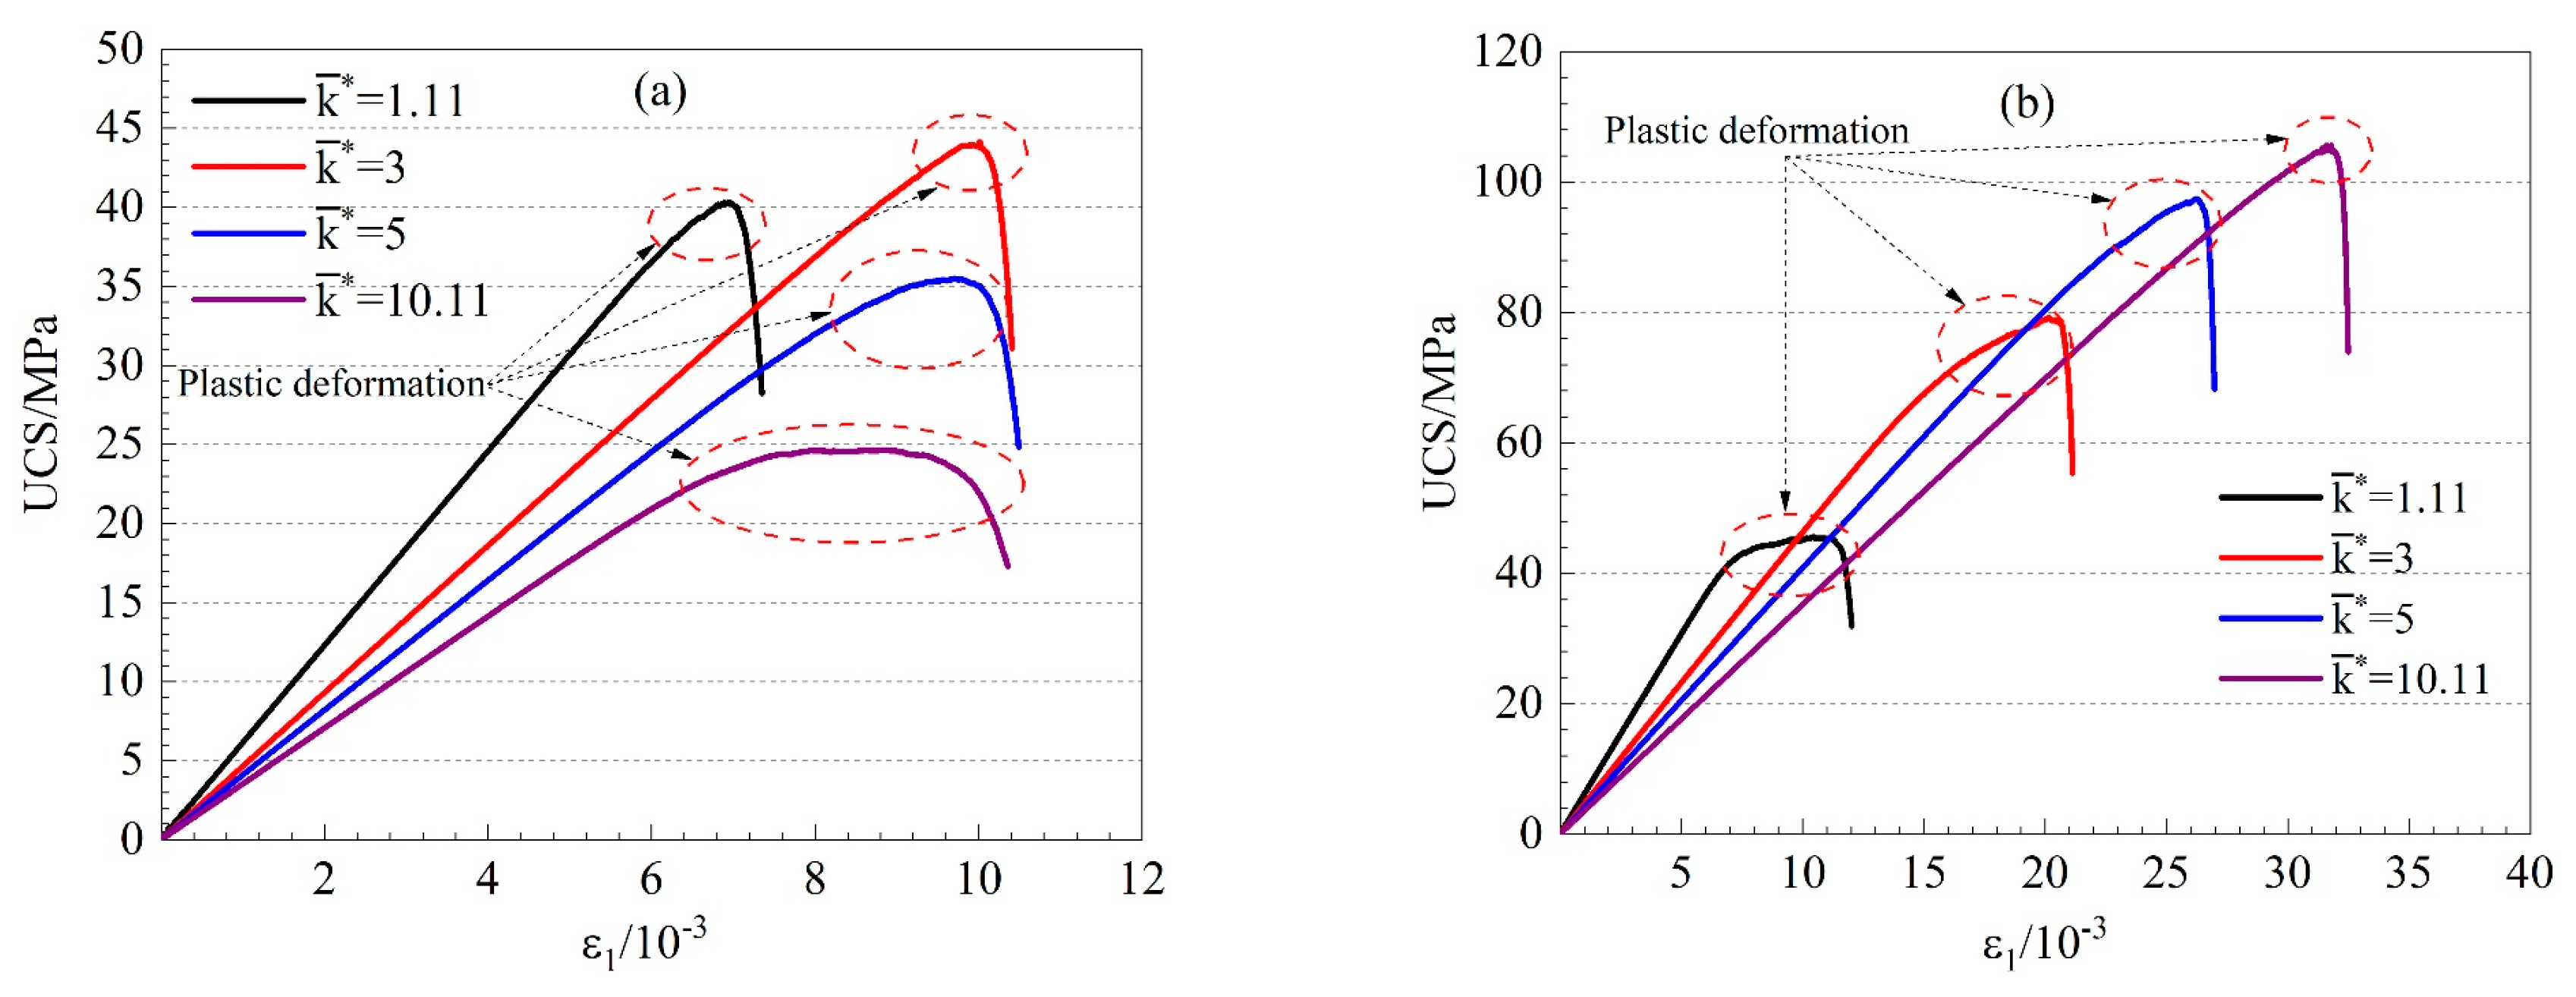
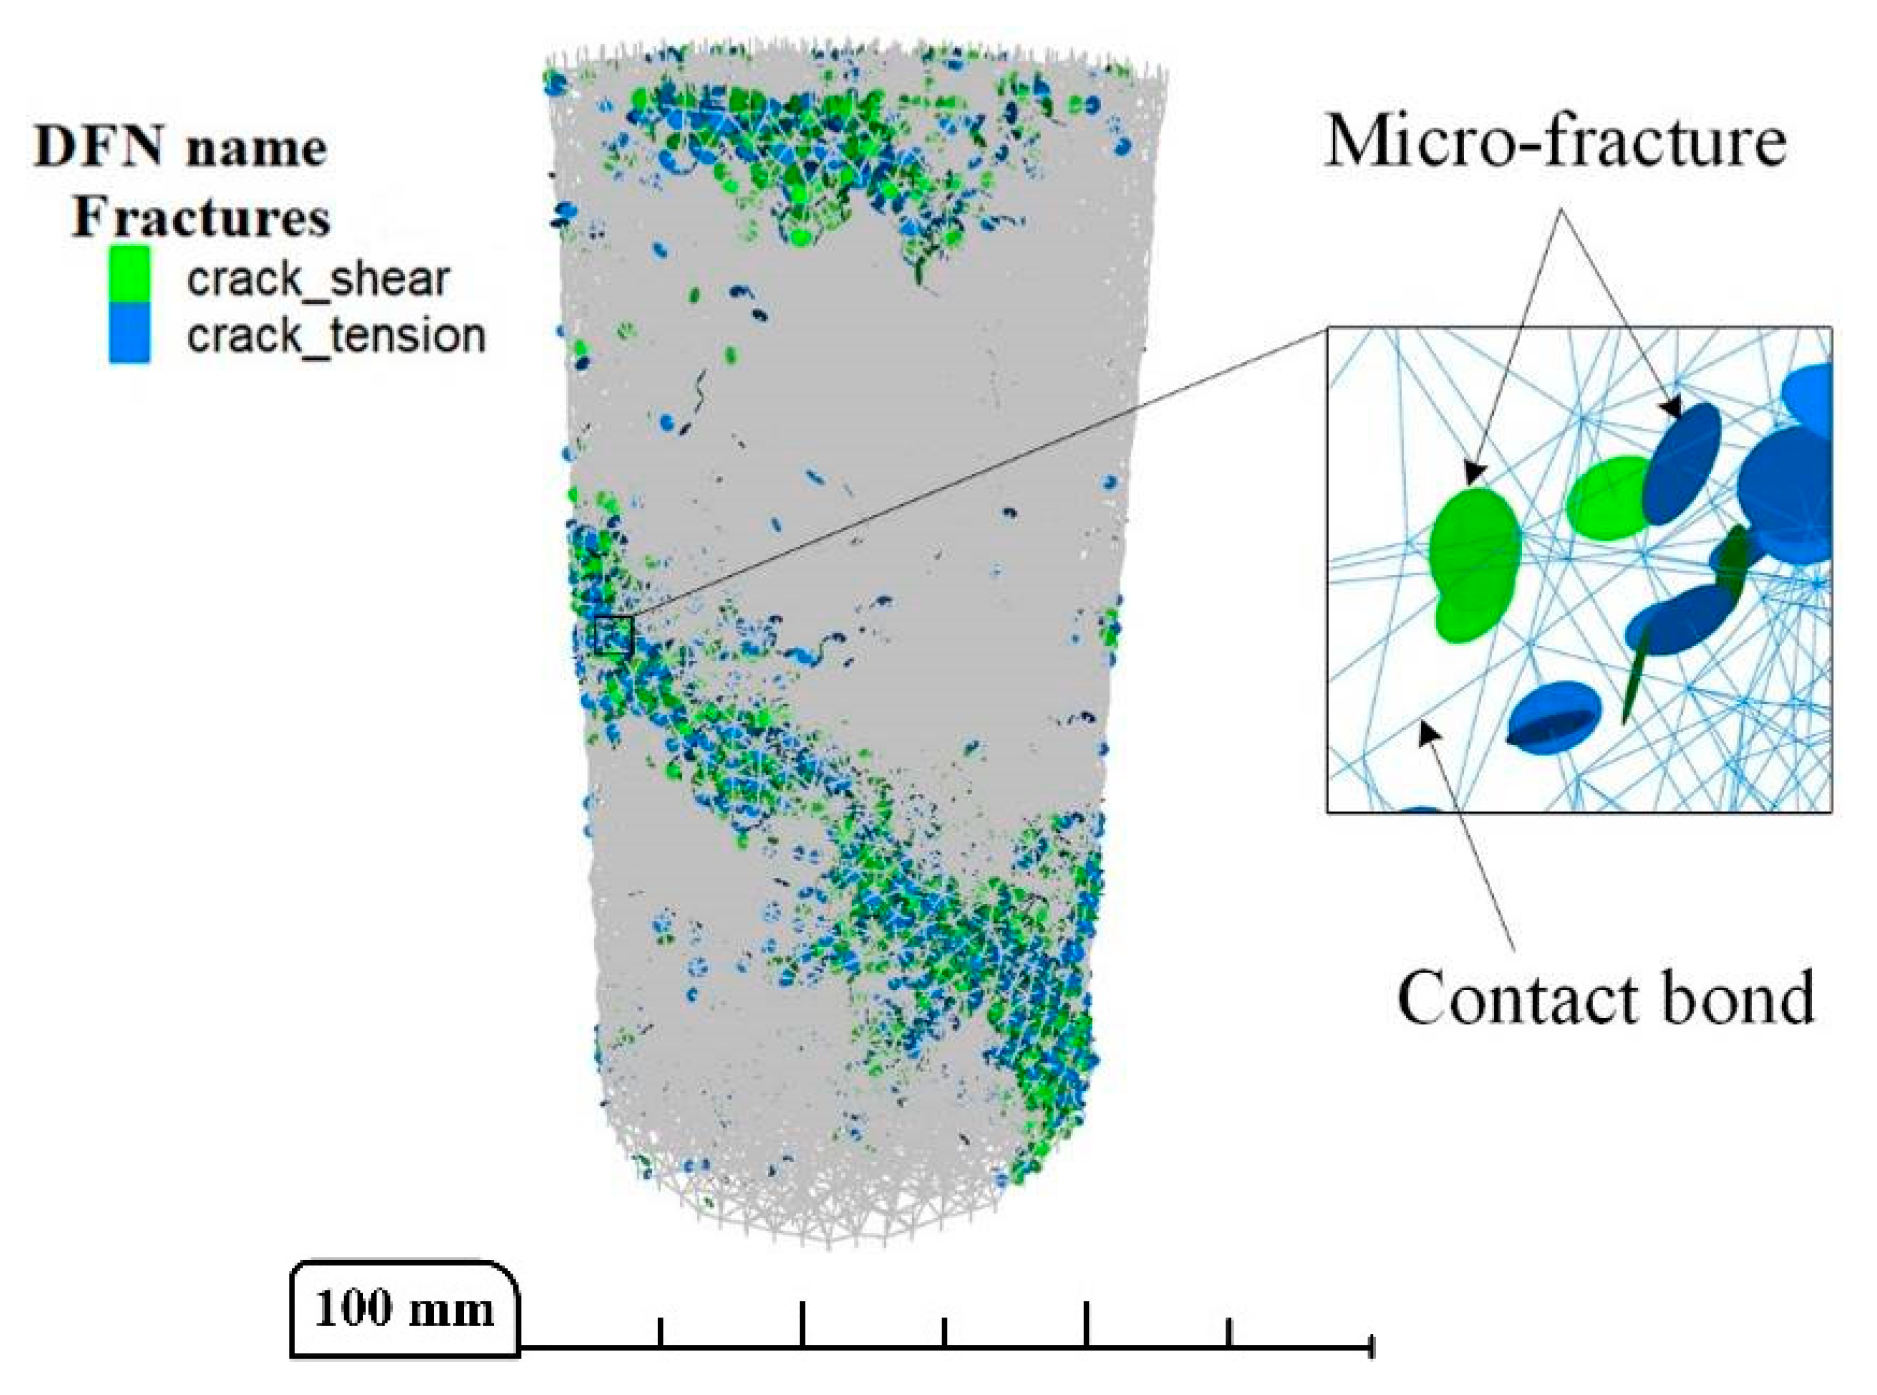
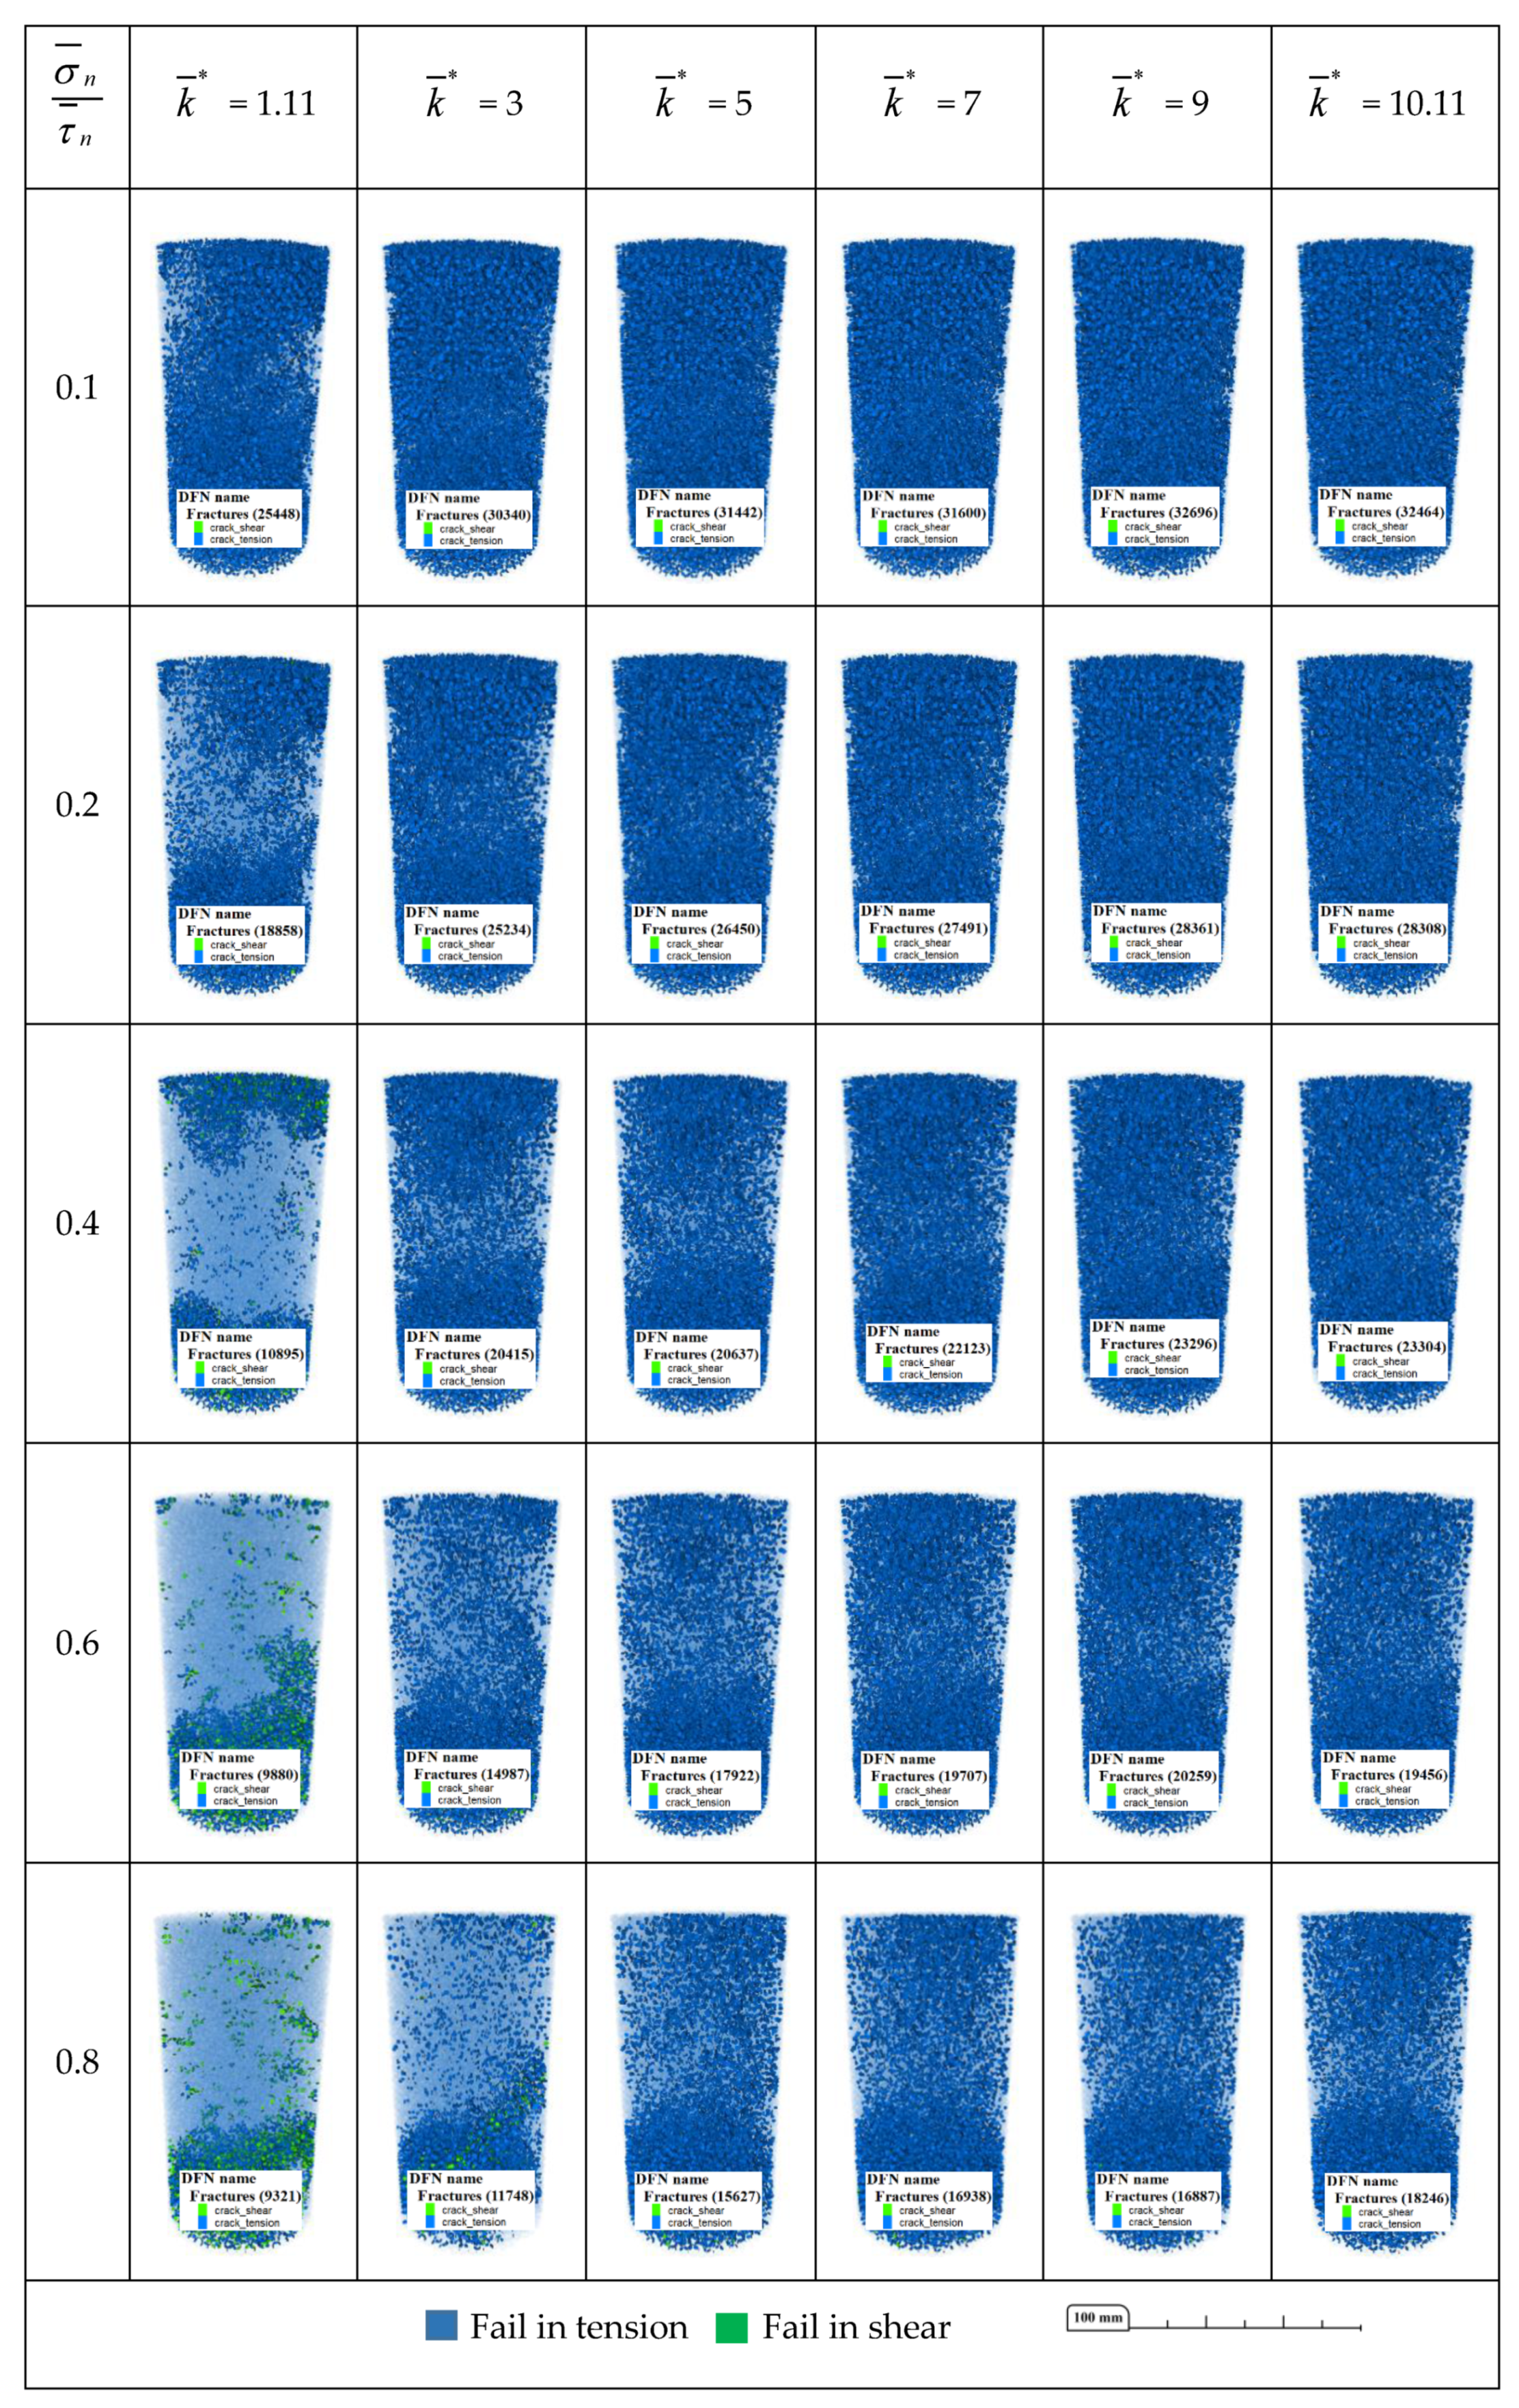
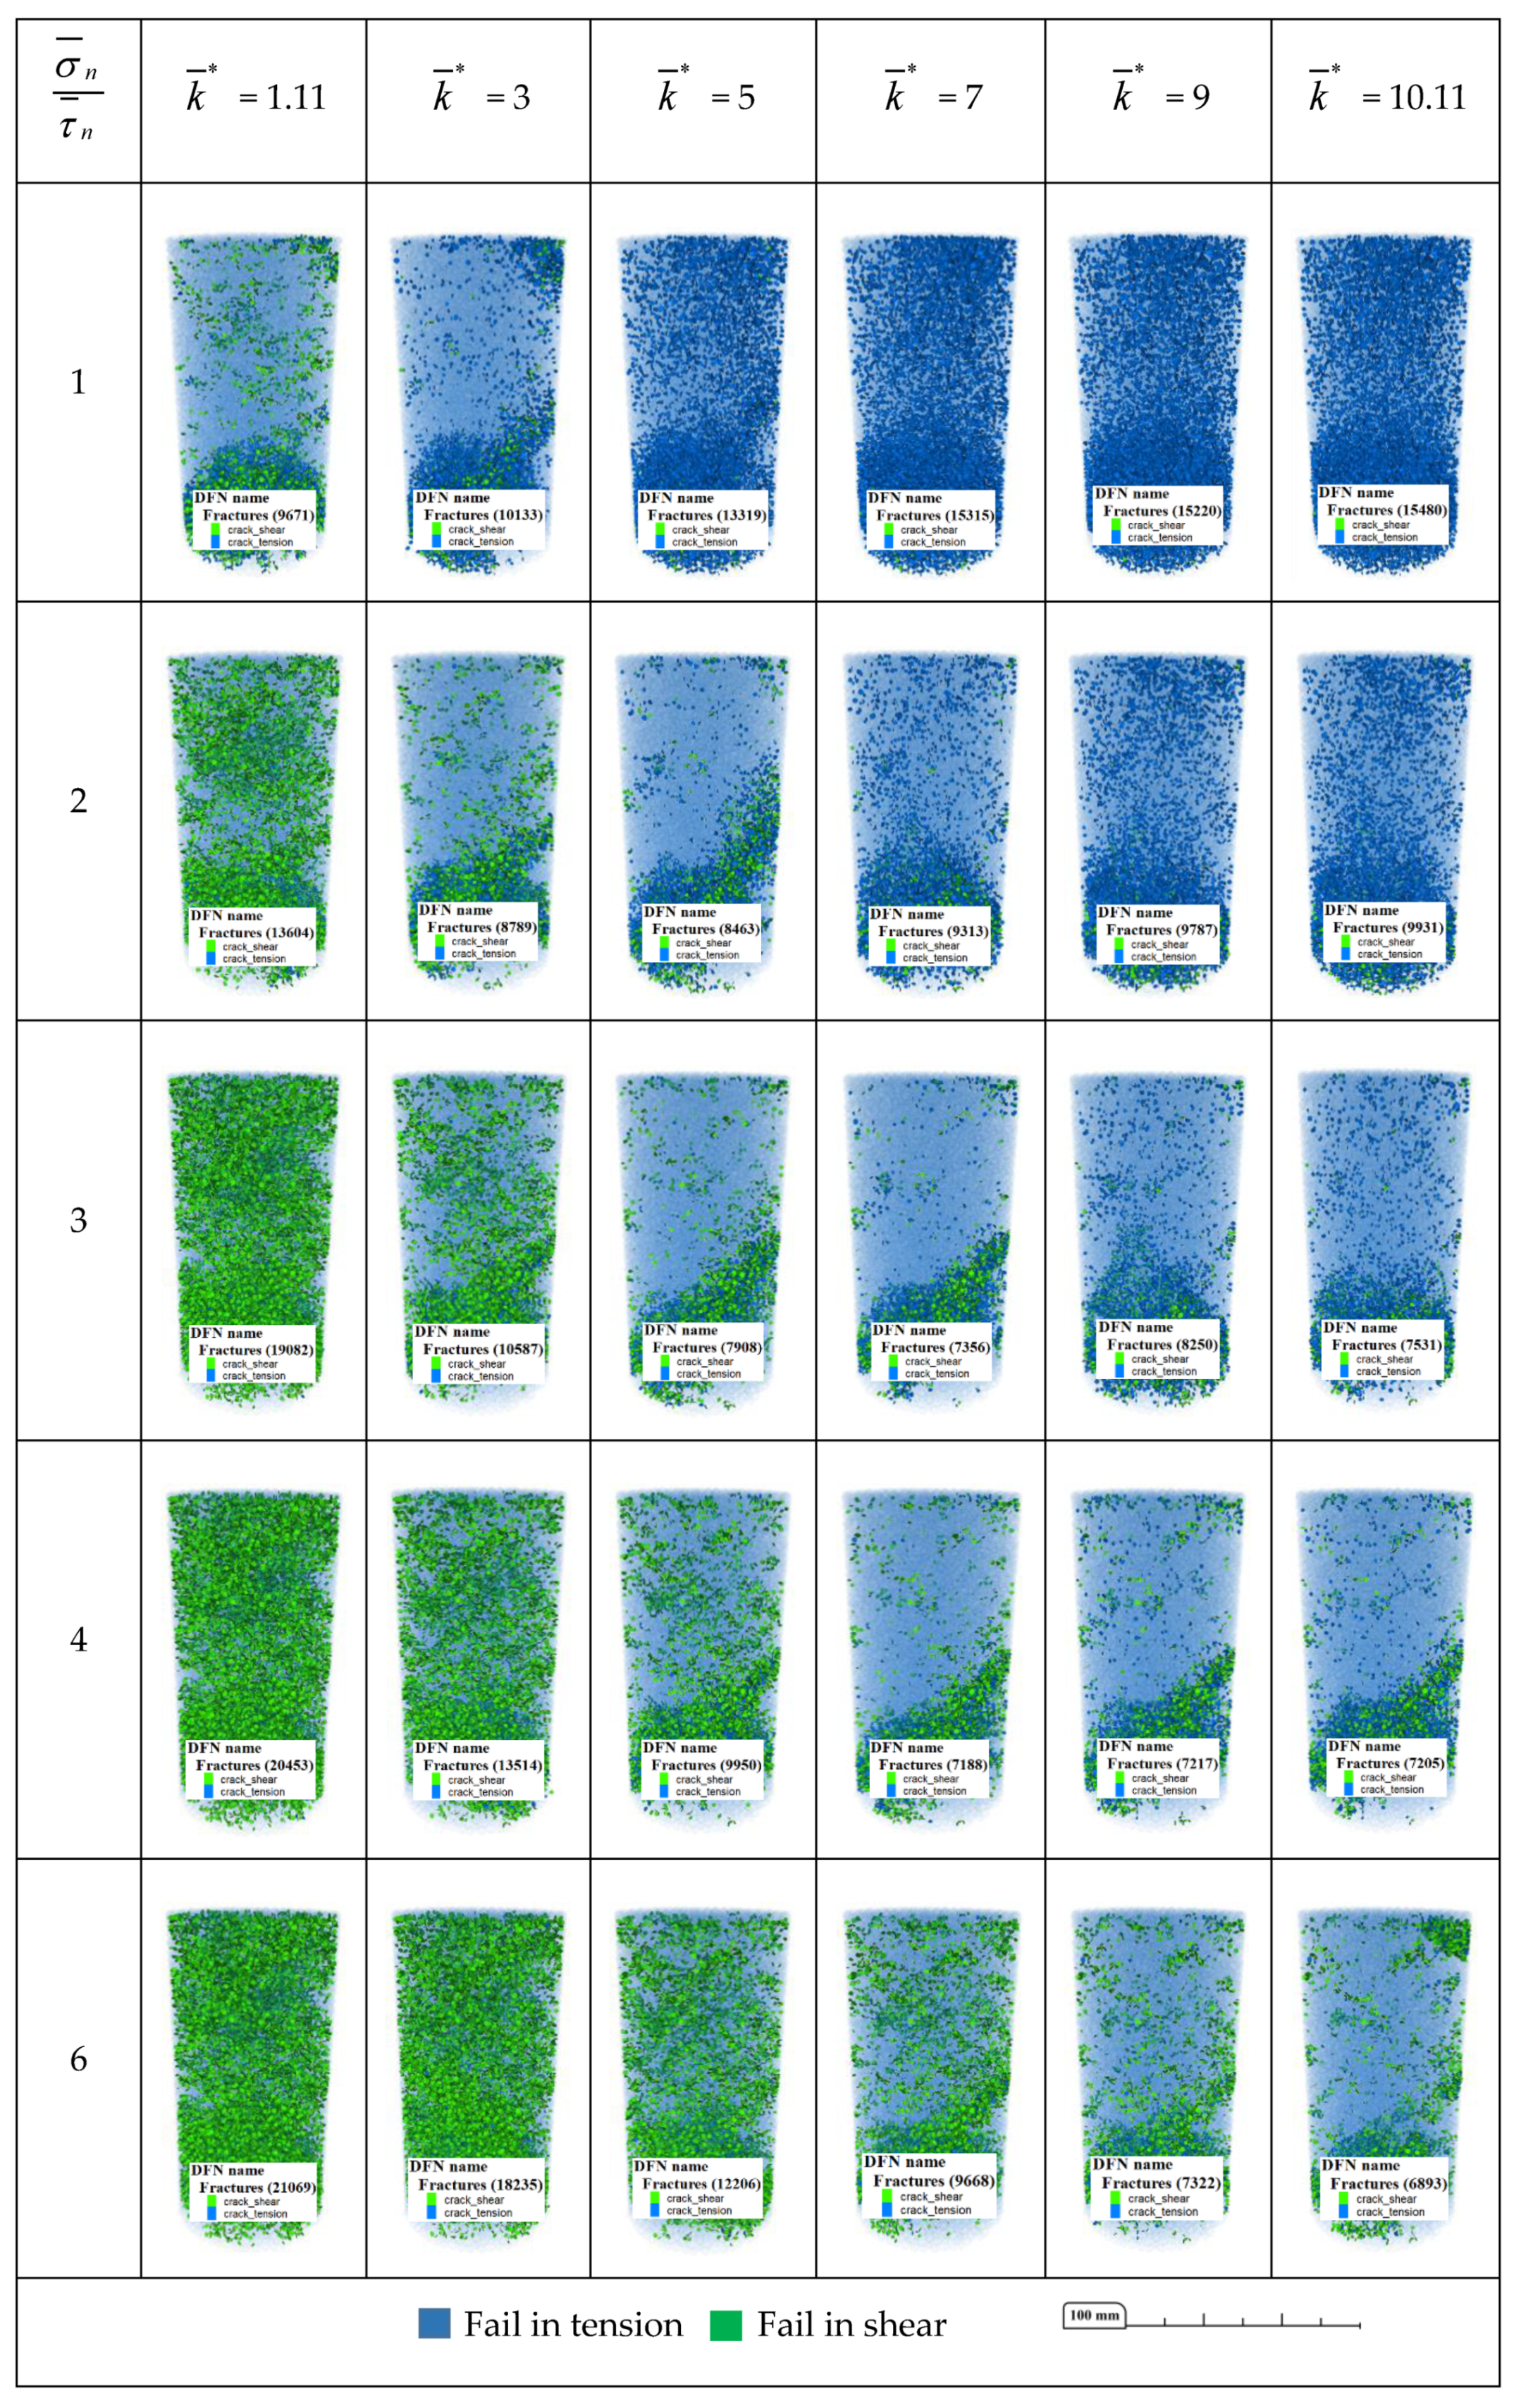
4.3. The Effects of and on Stress–Strain Relationships and Failure Characteristics
5. Discussion
5.1. Effects of Different Assignment Methods on the Macro-Properties
5.2. Mechanisms Underpinning the Effects of Micro-Parameters on Macro-Properties
6. Conclusions
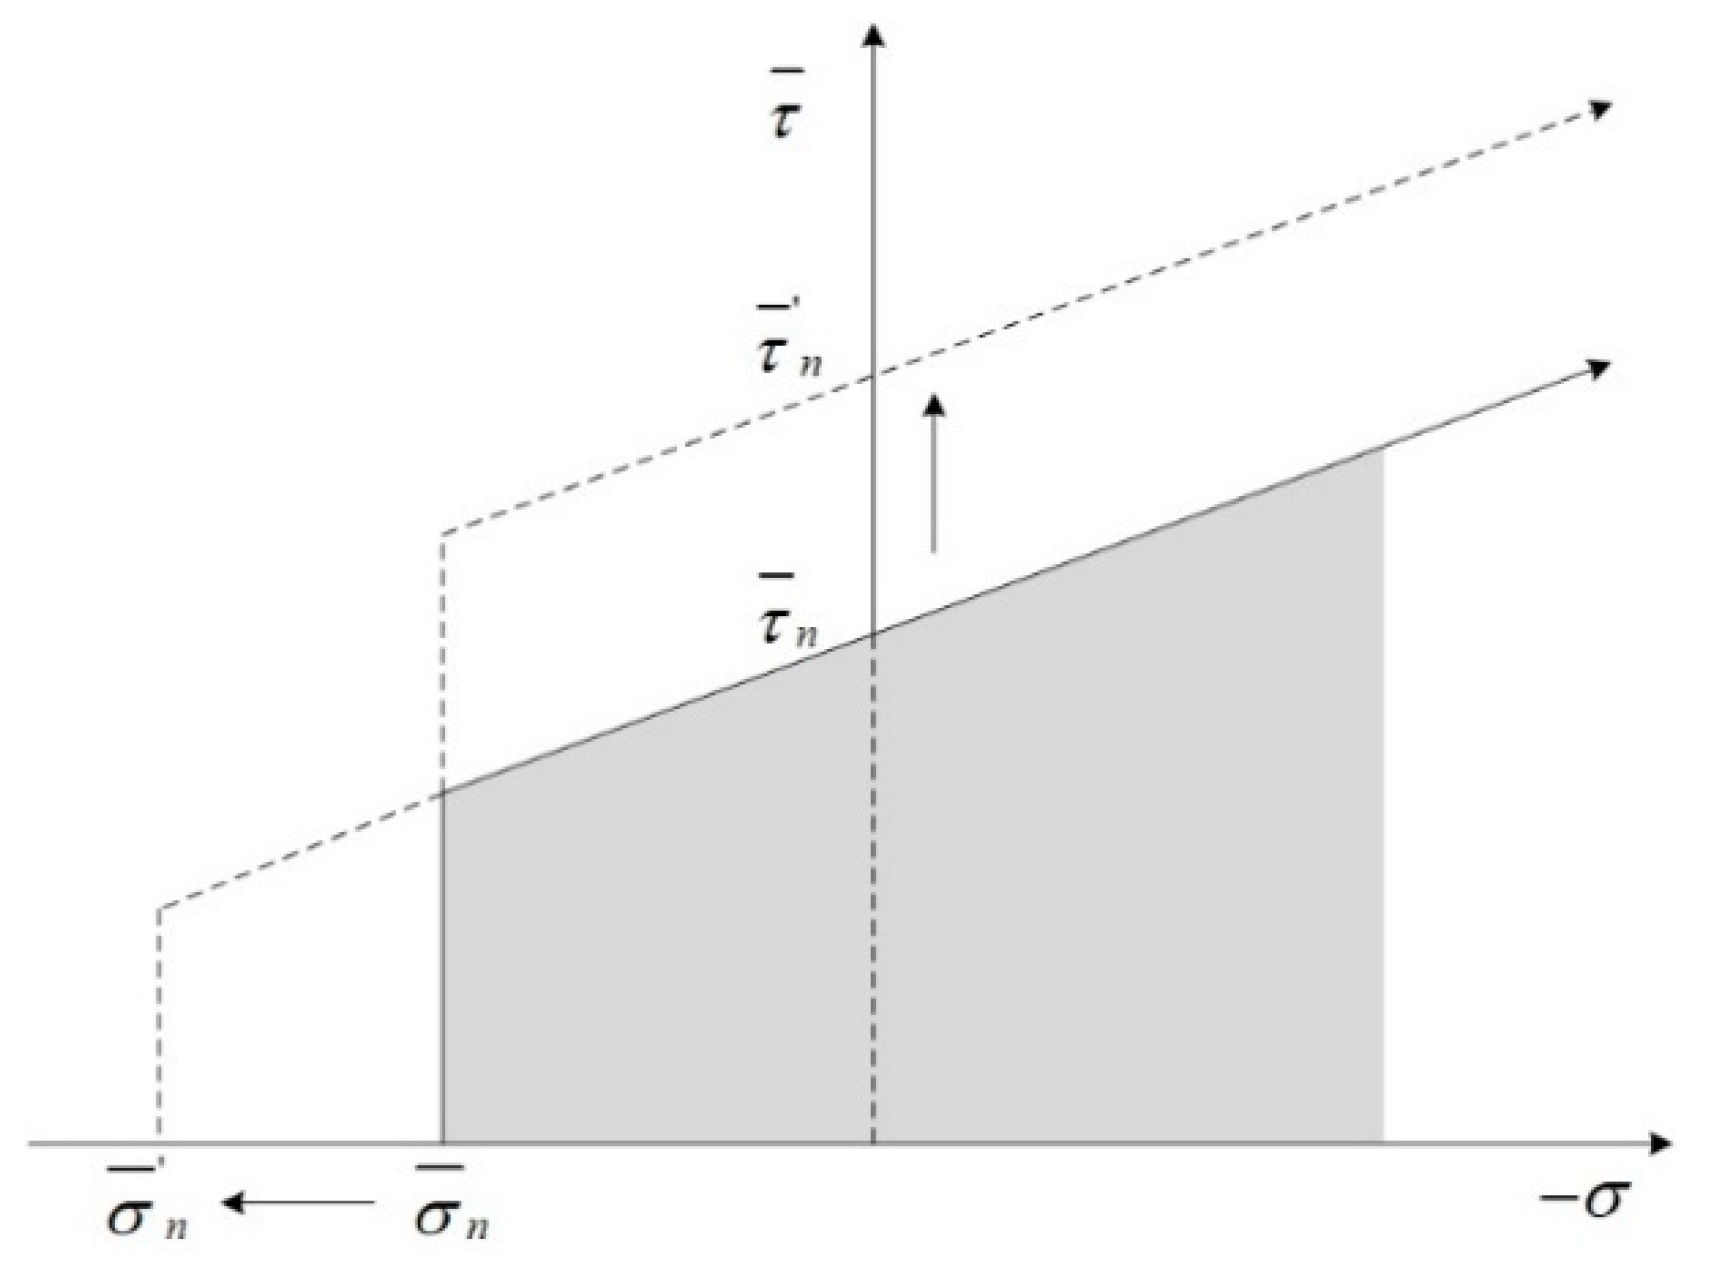
- Changes in altered the bond stress state within specimens and their overall stiffness, thereby affecting their strength and stress–strain characteristics. Changes in bond stress state with altered the extent of influence that exerted on sample strength. The change of assignment mode also had a significant effect on the deformation ability of the model.
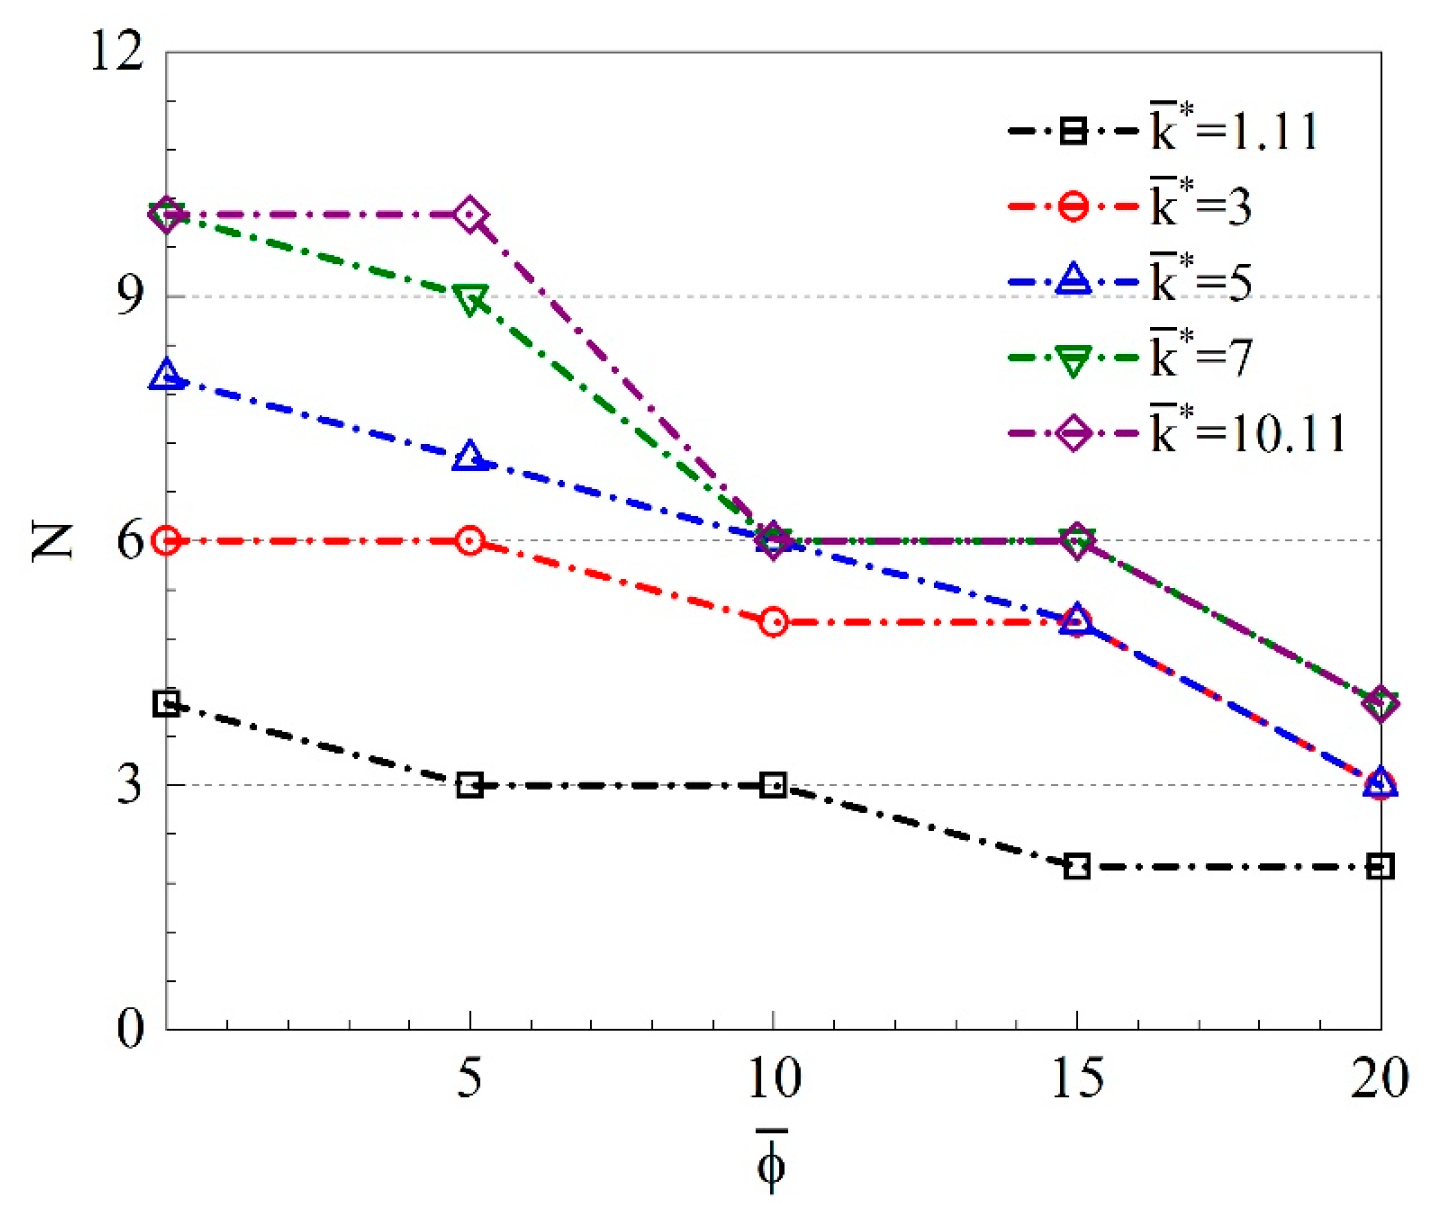
- altered the inter-particle bond strength. An increase in improved the effect level of on the sample strength. The sample strength increased with increasing . However, when exceeded a certain value N, the sample strength was restricted by and did not increase further. The N value was determined by a combination of and .
- An increase in KK resulted in a larger decrease in the overall stiffness of specimens after parallel-bond failure. The sample strength decreased as their deformability increased.
- Considerable changes in the sample brittleness and ductility were observed under the combined effects of and . When < 1, specimens changed from brittle to ductile with increasing , and when > 1, they exhibited a reverse trend.
- According to the research results, the appropriate adjustment of the micro-parameters of PFC could make the mechanical properties of the simulation model more consistent with the actual mechanical properties of the rock material, improve the accuracy of the simulation results, and provide some help for the research of the rock mechanical behavior. Considering the variation range of micro-parameters in this paper, the results of this paper could only be used to simulate the mechanical properties of rock materials.
Author Contributions
Funding
Acknowledgments
Conflicts of Interest
References
- Cundall, P.A. A Computer Model for Simulating Progressive Largescale Movements in Blocky Rock Systems. Proc. Symp. Int. Soc. Rock Mech. 1971, 2, 2–8. [Google Scholar]
- Zhang, X.P.; Zhang, Q.; Wu, S.C. Acoustic emission characteristics of the rock-like material containing a single flaw under different compressive loading rates. Comput. Geotech. 2017, 83, 83–97. [Google Scholar] [CrossRef]
- Han, Z.H.; Zhang, L.Q.; Zhou, J. Numerical Investigation of Mineral Grain Shape Effects on Strength and Fracture Behaviors of Rock Material. Appl. Sci. 2019, 9, 2855. [Google Scholar] [CrossRef] [Green Version]
- Schopfer, M.P.J.; Abe, S.; Childs, C.; Walsh, J.J. The impact of porosity and crack density on the elasticity, strength and friction of cohesive granular materials: Insights from DEM modelling. Int. J. Rock Mech. Min. Sci. 2009, 46, 250–261. [Google Scholar] [CrossRef] [Green Version]
- Wang, D.H.; Ding, X.H.; Ma, T.; Zhang, W.G.; Zhang, D.Y. Algorithm for Virtual Aggregates’ Reconstitution Based on Image Processing and Discrete-Element Modeling. Appl. Sci. 2018, 8, 738. [Google Scholar] [CrossRef] [Green Version]
- Zhang, Y.Z.; Wang, G.; Jiang, Y.J.; Wang, S.G.; Zhao, H.H.; Jing, W.J. Acoustic Emission Characteristics and Failure Mechanism of Fractured Rock under Different Loading Rates. Shock Vib. 2017, 2017, 13. [Google Scholar] [CrossRef] [Green Version]
- Zou, Q.L.; Lin, B.Q. Modeling the relationship between macro- and meso-parameters of coal using a combined optimization method. Environ. Earth Sci. 2017, 76, 20. [Google Scholar] [CrossRef]
- Huang, Y.H.; Yang, S.Q.; Tian, W.L. Crack coalescence behavior of sandstone specimen containing two pre-existing flaws under different confining pressures. Theor. Appl. Fract. Mech. 2019, 99, 118–130. [Google Scholar] [CrossRef]
- Sun, Y.T.; Zhang, J.F.; Li, G.C.; Ma, G.W.; Huang, Y.; Sun, J.B.; Wang, Y.H.; Nener, B. Determination of Young’s modulus of jet grouted coalcretes using an intelligent model. Eng. Geol. 2019, 252, 43–53. [Google Scholar] [CrossRef]
- Shi, C.; Zhang, Q.; Wang, S.N. Numerical Simulation Technology and Application with Particle Flow Code(PFC5.0). Rock Soil Mech. 2018, 39, 43. [Google Scholar]
- Duan, K.; Kwok, C.Y.; Tham, L.G. Micromechanical analysis of the failure process of brittle rock. Int. J. Numer. Anal. Methods Geomech. 2015, 39, 618–634. [Google Scholar] [CrossRef]
- Valdez, A.V.; Morel, S.; Marache, A.; Hinojosa, M.; Riss, J. Influence of fracture roughness and micro-fracturing on the mechanical response of rock joints: A discrete element approach. Int. J. Fract. 2018, 213, 87–105. [Google Scholar] [CrossRef]
- Yang, S.Q.; Tian, W.L.; Jing, H.W.; Huang, Y.H.; Yang, X.X.; Meng, B. Deformation and Damage Failure Behavior of Mudstone Specimens Under Single-Stage and Multi-stage Triaxial Compression. Rock Mech. Rock Eng. 2019, 52, 673–689. [Google Scholar] [CrossRef]
- Yin, P.F.; Yang, S.Q. Discrete Element Modeling of Strength and Failure Behavior of Transversely Isotropic Rock under Uniaxial Compression. J. Geol. Soc. India 2019, 93, 235–246. [Google Scholar] [CrossRef]
- Masson, S.; Martinez, J. Effect of particle mechanical properties on silo flow and stresses from distinct element simulations. Powder Technol. 2000, 109, 164–178. [Google Scholar] [CrossRef]
- Mishra, B.K.; Murty, C.V.R. On the determination of contact parameters for realistic DEM simulations of ball mills. Powder Technol. 2001, 115, 290–297. [Google Scholar] [CrossRef]
- Potyondy, D.O.; Cundall, P.A. A bonded-particle model for rock. Int. J. Rock Mech. Min. Sci. 2004, 41, 1329–1364. [Google Scholar] [CrossRef]
- Yoon, J. Application of experimental design and optimization to PFC model calibration in uniaxial compression simulation. Int. J. Rock Mech. Min. Sci. 2007, 44, 871–889. [Google Scholar] [CrossRef]
- Deng, S.X.; Zheng, Y.L.; Feng, L.P.; Zhu, P.Y.; Ni, Y. Application of Design of Experiments in Microscopic Parameter Calibration for Hard Rocks of PFC3D Model. Chin. J. Geotech. Eng. 2018, 41, 655–664. [Google Scholar]
- Yang, B.D.; Jiao, Y.; Lei, S.T. A study on the effects of microparameters on macroproperties for specimens created by bonded particles. Eng. Comput. 2006, 23, 607–631. [Google Scholar] [CrossRef]
- Zhao, G.Y.; Dai, B.; Ma, C. Study of effects of microparameters on macroproperties for parallel bonded mode. Chin. J. Rock Mech. Eng. 2012, 31, 1491–1498. [Google Scholar]
- Cong, Y.; Wang, Z.Q.; Zheng, Y.R.; Feng, X.T. Experimental study on microscopic parameters of brittle materials based on particle flow theory. Chin. J. Geotech. Eng. 2015, 37, 1031–1040. [Google Scholar]
- Shi, C.; Yang, W.K.; Yang, J.X.; Chen, X. Calibration of micro-scaled mechanical parameters of granite based on a bonded-particle model with 2D particle flow code. Granul. Matter 2019, 21, 38. [Google Scholar] [CrossRef]
- Cho, N.; Martin, C.D.; Sego, D.C. A clumped particle model for rock. Int. J. Rock Mech. Min. Sci. 2007, 44, 997–1010. [Google Scholar] [CrossRef]
- Xu, J.M.; Huang, D.Y.; Zhu, H.C. Relations between macro- and meso-scopic mechanical parameters of granite based on actual distributions of mesocompositions. Chin. J. Rock Mech. Eng. 2016, 35, 2635–2643. [Google Scholar]
- Ding, X.B.; Zhang, L.Y.; Zhu, H.H.; Zhang, Q. Effect of Model Scale and Particle Size Distribution on PFC3D Simulation Results. Rock Mech. Rock Eng. 2014, 47, 2139–2156. [Google Scholar] [CrossRef]
- Koyama, T.; Jing, L.R. Effects of model scale and particle size on micro-mechanical properties and failure processes of rocks—A particle mechanics approach. Eng. Anal. Bound. Elem. 2007, 31, 458–472. [Google Scholar] [CrossRef]
- Huang, H.Y. Discrete Element Modeling of Tool-Rock Interaction. Ph.D. Thesis, University of Minnesota, Minneapolis, Minnesota, 1999. [Google Scholar]
- Schopfer, M.P.J.; Childs, C.; Walsh, J.J. Two-dimensional distinct element modeling of the structure and growth of normal faults in multilayer sequences: 1. Model calibration, boundary conditions, and selected results. J. Geophys. Res. Solid Earth 2007, 112, 15. [Google Scholar] [CrossRef]
- Cao, R.H.; Cao, P.; Lin, H.; Fan, X.; Zhang, C.Y.; Liu, T.Y. Crack Initiation, Propagation, and Failure Characteristics of Jointed Rock or Rock-Like Specimens: A Review. Adv. Civ. Eng. 2019, 2019, 31. [Google Scholar] [CrossRef]
- Zhang, L.Y.; Mao, X.B.; Li, M.; Li, B.; Liu, R.X.; Lu, A.H. Brittle-Ductile Transition of Mudstone in Coal Measure Rock Strata under High Temperature. Int. J. Geomech. 2020, 20, 04019149. [Google Scholar] [CrossRef]
- Zhou, C.T.; Xu, C.S.; Karakus, M.; Shen, J.Y. A particle mechanics approach for the dynamic strength model of the jointed rock mass considering the joint orientation. Int. J. Numer. Anal. Methods Geomech. 2019, 43, 2797–2815. [Google Scholar] [CrossRef]
- Zhou, T.; Zhu, J.B.; Xie, H.P. Mechanical and Volumetric Fracturing Behaviour of Three-Dimensional Printing Rock-like Samples Under Dynamic Loading. Rock Mech. Rock Eng. 2020, 53, 2855–2864. [Google Scholar] [CrossRef]
- Basarir, H.; Sun, Y.Y.; Li, G.C. Gateway stability analysis by global-local modeling approach. Int. J. Rock Mech. Min. Sci. 2019, 113, 31–40. [Google Scholar] [CrossRef]
- Sun, Y.T.; Zhang, J.F.; Li, G.C.; Wang, Y.H.; Sun, J.B.; Jiang, C. Optimized neural network using beetle antennae search for predicting the unconfined compressive strength of jet grouting coalcretes. Int. J. Numer. Anal. Methods Geomech. 2019, 43, 801–813. [Google Scholar] [CrossRef]
- Wu, H.; Dai, B.; Zhao, G.Y.; Chen, Y.; Tian, Y.K. A Novel Method of Calibrating Micro-Scale Parameters of PFC Model and Experimental Validation. Appl. Sci. 2020, 10, 3221. [Google Scholar] [CrossRef]
- Itasca. PFC3D (Particle Flow Code in Three Dimensions) Version 5.0: Theory and Background; Itasca Consulting Group: Minneapolis, MN, USA, 2016. [Google Scholar]
- Wang, Y.N.; Tonon, F. Calibration of a discrete element model for intact rock up to its peak strength. Int. J. Numer. Anal. Methods Geomech. 2010, 34, 447–469. [Google Scholar] [CrossRef]
- Castro-Filgueira, U.; Alejano, L.R.; Arzua, J.; Ivars, D.M. Sensitivity Analysis of the Micro-Parameters Used in a PFC Analysis Towards the Mechanical Properties of Rocks. In Isrm European Rock Mechanics Symposium Eurock 2017; Konicek, P., Soucek, K., Konecny, P., Eds.; Elsevier Science BV: Amsterdam, The Netherlands, 2017; Volume 191, pp. 488–495. [Google Scholar]
- Peng, J.; Wong, L.N.Y.; Teh, C.I. Effects of grain size-to-particle size ratio on micro-cracking behavior using a bonded-particle grain-based model. Int. J. Rock Mech. Min. Sci. 2017, 100, 207–217. [Google Scholar] [CrossRef]
- Bahaaddini, M.; Sharrock, G.; Hebblewhite, B.K. Numerical investigation of the effect of joint geometrical parameters on the mechanical properties of a non-persistent jointed rock mass under uniaxial compression. Comput. Geotech. 2013, 49, 206–225. [Google Scholar] [CrossRef]
- Zhang, Q.; Zhu, H.H.; Zhang, L.Y.; Ding, X.B. Study of scale effect on intact rock strength using particle flow modeling. Int. J. Rock Mech. Min. Sci. 2011, 48, 1320–1328. [Google Scholar] [CrossRef]
- Xu, X.M.; Ling, D.S.; Chen, Y.M.; Huang, B. Correlation of microscopic and macroscopic elastic constants of granular materials based on linear contact model. Chin. J. Geotech. Eng. 2010, 32, 991–998. [Google Scholar]
- Zhang, X.P.; Wong, L.N.Y. Loading rate effects on cracking behavior of flaw-contained specimens under uniaxial compression. Int. J. Fract. 2013, 180, 93–110. [Google Scholar] [CrossRef]
- Wang, Y.J.; Xing, J.B. Discrete Element Method and Its Application in Geotechnical Mechanics; CHN: Shenyang, China, 1991. [Google Scholar]
- Xing, J.B.; Yu, L.Q.; Zhang, R.F. Determination of calculating parameters and solution methods of discrete element method. Chin. J. Comput. Mech. 1999, 16, 47–51. [Google Scholar]


| References | Value Range of Bond Normal-to-Shear Stiffness Ratio | Influence Degree of Bond Normal-to-Shear Stiffness Ratio on UCS | Note |
|---|---|---|---|
| Deng, S.X. et al. [19] | 0.6–3.6 | Not significant | PFC3D |
| Wang, Y.N. et al. [38] | 0–0.8 | Not considered | PFC3D |
| Zhao, G.Y. et al. [21] | 0.1–6 | Not considered | PFC2D |
| Yang, B.D. et al. [20] | 0.6–2 | Not significant | PFC2D |
| Cong, Y. et al. [22] | 1–5 | Not significant | PFC2D |
| Yoon, J. [18] | 0.5–10 | Not significant | PFC2D |
| Xu, X.M. et al. [43] | 1–100 | Not considered | PFC3D |
| Micro-Parameter | Description | Calibrated Value |
|---|---|---|
| /mm | Minimum particle radius | 1 |
| Particle radius ratio | 1.66 | |
| /GPa | Effective modulus | 3 |
| Normal-to-shear stiffness ratio | 3.3 | |
| μ | Particle friction coefficient | 0.5 |
| /MPa | Bond effective modulus | 3 |
| Bond normal-to-shear stiffness ratio | 3.3 | |
| /MPa | Normal bond strength (Mean ± standard deviation*) | 9 ± 3 |
| /MPa | Shear bond strength (Mean ± standard deviation) | 15 ± 3 |
| λ | Bond width multiplier | 1 |
| Test Method | Uniaxial Compression Strength (σc/MPa) | Young’s Modulus (E/GPa) | Poisson’s Ratio (ν) | Sample Size (R × H/mm) |
|---|---|---|---|---|
| Laboratory test | 31.91 | 4.61 | 0.241 | 25 × 100 |
| PFC simulation | 33.07 | 4.57 | 0.248 | 25 × 100 |
| Type | Law of UCS Change | Curve Characteristics | Main Failure Characteristics of Samples | |
|---|---|---|---|---|
| 1 | 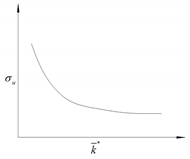 | < 0.8 | The UCS decreased with increasing | 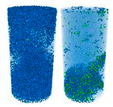 |
| 2 | 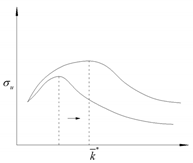 | 0.8≤ < 4 | The UCS initially increased and then decreased with increasing . The curve maximum continuously shifted toward the right |  |
| 3 | 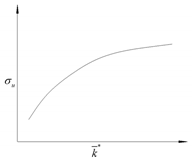 | ≥ 4 | The UCS initially increased with increasing and then leveled off. | 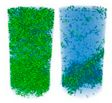 |
© 2020 by the authors. Licensee MDPI, Basel, Switzerland. This article is an open access article distributed under the terms and conditions of the Creative Commons Attribution (CC BY) license (http://creativecommons.org/licenses/by/4.0/).
Share and Cite
Rong, H.; Li, G.; Liang, D.; Sun, C.; Zhang, S.; Sun, Y. Numerical Investigation on the Evolution of Mechanical Properties of Rock Affected by Micro-Parameters. Appl. Sci. 2020, 10, 4957. https://doi.org/10.3390/app10144957
Rong H, Li G, Liang D, Sun C, Zhang S, Sun Y. Numerical Investigation on the Evolution of Mechanical Properties of Rock Affected by Micro-Parameters. Applied Sciences. 2020; 10(14):4957. https://doi.org/10.3390/app10144957
Chicago/Turabian StyleRong, Haoyu, Guichen Li, Dongxu Liang, Changlun Sun, Suhui Zhang, and Yuantian Sun. 2020. "Numerical Investigation on the Evolution of Mechanical Properties of Rock Affected by Micro-Parameters" Applied Sciences 10, no. 14: 4957. https://doi.org/10.3390/app10144957