Article

Rendering Strategy to Counter Mutual Masking Effect in Multiple Tactile Feedback

1
Intelligent Robotics Laboratory, Hallym University, Gangwon-do 24252, Korea
2
Applied Robot R&D Department, Research Institute of Convergence Technology, Korea Institute of Industrial Technology (KITECH), Gyeonggi-do 15588, Korea
3
Department of Mechanical, Robotics and Energy Engineering, Dongguk University, Seoul 04620, Korea
4
Mechanical Engineering Department, Korea Advanced Institute of Science and Technology (KAIST), Daejeon 34141, Korea
*
Authors to whom correspondence should be addressed.
These authors contributed equally to this work.
Appl. Sci. 2020, 10(14), 4990; https://doi.org/10.3390/app10144990
Submission received: 29 June 2020 / Revised: 16 July 2020 / Accepted: 17 July 2020 / Published: 20 July 2020
(This article belongs to the Special Issue Haptics: Technology and Applications)

Abstract

:
Recently, methods and devices that simultaneously utilize two or more tactile feedback types have been proposed for more immersive interaction with virtual objects. However, the masking effect, which makes us less sensitive to various stimuli presented at the same time, has scarcely been explored. In this study, we propose a novel tactile rendering algorithm that can eliminate the mutual masking effect at the user’s sensation level, when mechanical vibration and electrovibration are applied simultaneously. First, the masking functions of the two stimuli were investigated for various stimulus combinations. Based on these, a generalized form of the masking function was derived. We then tested and confirmed that the proposed algorithm, which calculates the required stimulus intensity to compensate for the mutual masking effect, could render the arbitrary stimulus intensity desired to be perceived by the users. The results of the user test revealed that the proposed rendering algorithm significantly improved the virtual object recognition rate by approximately 23% when geometry and texture were presented jointly. This finding suggests principal guidelines for the combined use of mechanical vibration and electrovibration, as well as for other combinations of different tactile feedback types.

1. Introduction

With the advancement of mobile devices and virtual reality systems, the demand for haptic technology is rapidly growing as it can drastically improve the user’s experience. Specifically, methods and devices that simultaneously utilize two or more tactile feedback types have been recently proposed for more immersive interaction with virtual objects. There are four types of highly sensitive mechanoreceptive units in the human hand. These units actively respond to different tactile feedback types, including pressure, shear stretch, and low- and high-frequency vibrations [1,2,3]. In this regard, researchers have proposed to simultaneously use two tactile feedback types, and the feasibility of presenting multiple tactile information, such as shape (geometry) and texture, has been demonstrated [4,5,6]. Furthermore, devices that simultaneously provide three or four tactile feedback types have also been proposed [7,8]. Nevertheless, so far, relatively little consideration was given to the possible masking effect when multiple tactile feedback types are mixed. By definition, a masking effect is when the perception of one stimulus is affected by another stimulus. The masking effect appears in various sensory modalities [9,10,11,12,13]. It can be examined by investigating changes in the absolute threshold (absolute limen (AL)) and the difference threshold (difference limen (DL)) of the target stimulus, in association with the masking stimulus (masker) intensity. The AL is particularly known to significantly change according to the masker’s intensity [12,13,14]. Thus, the masked AL should be investigated before designing multiple tactile feedback, as the users perceive the stimulus intensity at the sensation level (SL); SL refers to the number of decibels above the AL. If the masking effect exists, the perceived intensity should be considered based on the masked AL rather than the unmasked AL. Indeed, the masking effect has been a well-established concept in haptics since the 1980s. However, the interplay of two tactile stimuli, presented to the same site, has been scarcely studied.
In this paper, we show that a significant interplay appears when simultaneously applying two tactile stimuli, and suggest a method to overcome this mutual masking effect. In our previous report [14], we investigated the masking effect caused by mechanical vibration (MV) on the perception of electrovibration (EV). We found that MV significantly shifts the AL of EV. The main goals of the current study were to investigate the mutual masking effect further and propose a new rendering algorithm to overcome it. First, we derived a generalized form of masking function through a series of psychophysical experiments. Then, based on the masking functions, we proposed a rendering algorithm that eliminated the mutual masking effect. We proved the proposed concept mathematically, and then validated through a user test where the geometry and texture of the virtual object were presented jointly. Our primary contributions can be summarized as follows.
  • We investigated the mutual masking effect when two tactile feedback types were presented simultaneously.
  • We propose and have validated a novel rendering algorithm that compensates for the mutual masking effect.

2. The Masking Function

In this section, we examine the masking function of EV and MV when both stimuli are presented simultaneously. The masking function can be estimated by measuring the masked AL in the presence of several intensities of the masking stimulus. Two psychophysical experiments were conducted to find the masking functions of EV and MV. In experiment I, changes in AL of EV were investigated as a function of the intensity of masker (MV). In experiment II, we investigated changes in AL of MV as a function of a variety of masker (EV) intensities.

2.1. Participants

Ten participants (nine males and one female; aged 23–30 years old) participated in experiments I and II. All participants were right-handed, and none reported any cutaneous or kinesthetic sensing problems. They received explanations, were given instructions, and gave their informed consent before the experiments. All experiments were conducted following the guidelines approved by the Institutional Review Boards (IRB) of Hallym University and the Korea Advanced Institute of Science and Technology (KAIST).

2.2. Apparatus

Figure 1 shows the custom-built hardware set-up used to simultaneously apply EV and MV, and a schematic diagram detailing the apparatus control. The set-up mainly comprised of a touch panel (SCT3250, 3M Inc., St. Paul, MN, USA) to generate EV, piezoelectric actuators (PHA 379060, Mplus Inc., Suwon, Korea) to generate MV, and a visual display (STL-100T, StarTech Inc., Busan, Korea) to present the progress of the experiments visually.The touch panel was mounted on a visual display by four sponge spacers at corners. Four piezoelectric actuators were attached to the top of the touch panel around the periphery. The host PC generated respective digital signals to produce EV and MV. These signals were transmitted to two signal processors (NI 9264, National Instruments Inc., Austin, TX, USA) to be converted to analog signals. The analog signals were then amplified by an analog amplifier (SQV 3/500, US Eurotek Inc., Lake Forest, CA, USA) and a piezoelectric driver (DRV8662, Texas Instruments Inc., Dallas, TX, USA). Finally, the signals were applied to the touch panel and to piezoelectric actuators to generate EV and MV, respectively. The users could perceive both EV and MV on the touch panel, as the MV has propagated to the entire panel. Note that this set-up is the same as that used in our previous work. For detailed specifications and performance of the hardware set-up, see the work in [14] and the corresponding supplementary information.

2.3. Stimuli and Procedure

In both experiments, the participants were exposed to the test and reference stimuli when they slide their fingertip across the touch panel. The target stimulus (variable intensity) was presented only for the test stimulus, whereas the masking stimulus (or masker) had a constant frequency and intensity and was presented for both the test and reference stimuli. In experiment I, EV was the target stimulus and MV was the masker. The reverse was done in experiment II. Table 1 summarizes the test stimulus sets. For both experiments, a frequency of 270 Hz was selected for EV, and 120, 180, and 270 Hz for MV. The masker’s intensities varied between 5 and 25 dB SL (sensation level) in increments of 5 dB SL. These signal amplitudes for EV and MV in dB SL units were determined based on the results of our previous work [14]. Each stimulus lasted 1.8 s.
We measured the AL for each stimulus set to estimate the masking function. A well-known three-interval forced-choice (3IFC) paradigm with an one-up three-down adaptive procedure was employed in both experiments [14,15,16]. Figure 2 shows the stimulus sequence within a 3IFC paradigm, and the experimental procedure. The participants were instructed to slide their dominant fingertip from left to right along with the graphic object, which was programmed to move at a constant speed. The sliding speed was set to 51 mm/s based on the typical speed range at which users would normally move their fingertip to recognize objects [17]. All participants naturally performed the experiment, without restrictions in other parameters such as the contact force and the area. For each trial, we presented the participants with three consecutive stimuli. The test stimulus was applied randomly at one of these three intervals. The participants’ task was to indicate or speculate which was the odd interval, i.e., the one that presented the test stimulus. For each session (or set), the initial intensity of the target stimulus was set at a level higher than the expected masked AL. If a participant answered three consecutive correct answers, the intensity of the target stimulus was decreased in the subsequent trial. If a participant gave a wrong answer, the intensity of the target stimulus was increased in the following trial. A session was terminated after eleven reversals, and the AL was then estimated by averaging the intensities of the last eight reversals.
Each session lasted approximately 9–15 min, and the order of the sessions was random for each participant. The participants rested for at least 5 min between sessions. During the experiments, all participants wore a wristband (ECWS61M-1, 3M Inc.), which was used for electrical grounding. Headphones with pink noise of ~80 dB SPL (sound pressure level) were used to prevent possible auditory interference. As some participants reported sweaty fingertip, we allowed the use of a small amount of talcum powder.

2.4. Results

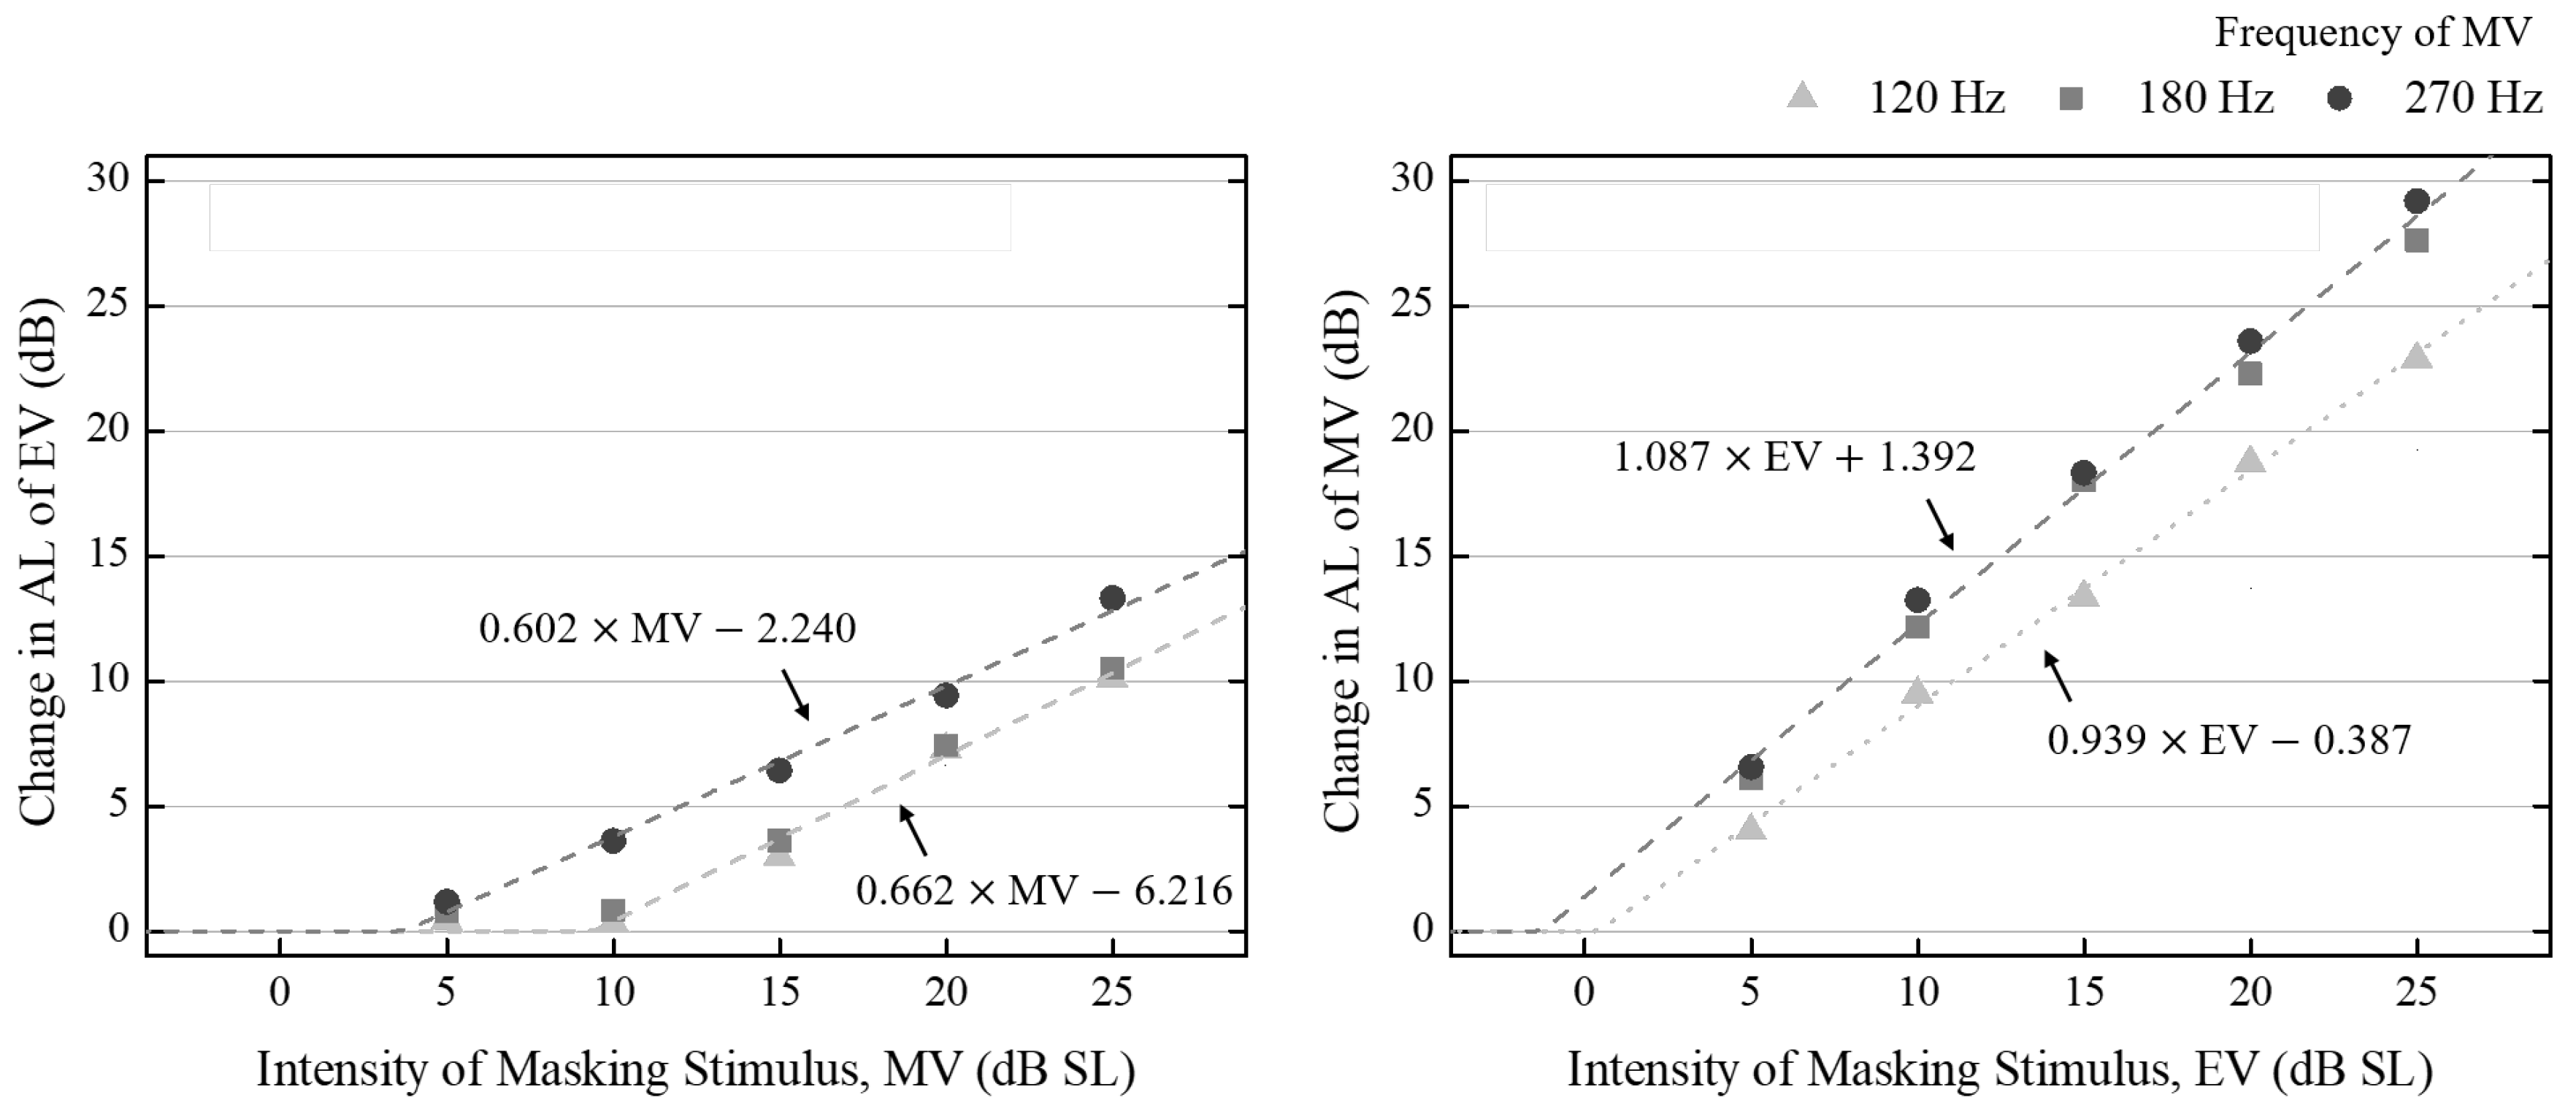
To calculate changes in the AL, the unmasked ALs (investigated in our previous work [14]) were subtracted from the corresponding masked ALs. The upper part of Table 2 shows the mean change in the AL of the EV in the presence of the masker, MV (Experiment I). A two-way repeated-measures analysis of variance (ANOVA) showed that the effect of both frequency and intensity of the masker (MV) on changes in the AL of the EV was significant ( p < 0.05 for frequency and p < 0.001 for intensity). However, the interaction term was not significant ( p = 0.328 ). A multiple paired-sample t-test with a Bonferroni correction found no difference between 120 Hz and 180 Hz ( p = 1.000 ). We also performed a two-tailed one-sample t-test on all data points to clarify whether the masking effect was present. When the masker frequency was 120 Hz or 180 Hz, a significant masking effect was noted at masker intensity of 15 dB SL or higher. When the masker frequency was 270 Hz, a significant masking effect appeared at a masker intensity of 10 dB SL or higher. To obtain the masking function of the EV, a linear fitting with the least square method was applied. The resulting curves are depicted in the left part of Figure 3. Data points that did not differ significantly from each other were fitted into a single line. We obtained two linear regression lines (one for 120 Hz and 180 Hz, and the other for 270 Hz). Both results show a strong linear relationship (adjusted R-squared > 0.99 ). The lower part of Table 2 shows the results of experiment II: the mean change in the AL of the MV in the presence of the masker, EV. For experiment II, the same statistical analysis was performed as for experiment I. The results indicate that the changes in the AL of the MV depend on the frequency of the MV and intensity of the EV ( p < 0.01 ), but a mixed trend was not observed ( p = 0.111 ). When evaluated for frequency, no difference was found between 180 Hz and 270 Hz ( p = 1.000 ). Unlike the results of experiment I, significant masking effects were observed at all masker intensities ( p < 0.001 for all data points). We obtained two linear regression lines (one for 120 Hz, and the other for 180 Hz and 270 Hz). As shown in the right part of Figure 3, both lines show a strong linear relationship (adjusted R-squared > 0.99 ).

3. The Proposed Rendering Algorithm

In this section, we first discuss the feasibility of simultaneously delivering two tactile information types at an intended perceived intensity, when a mutual masking effect exists. We then propose a generalized rendering algorithm that can compensate for the mutual masking effect. The effectiveness of the proposed algorithm is verified by a user test.

3.1. The Idea

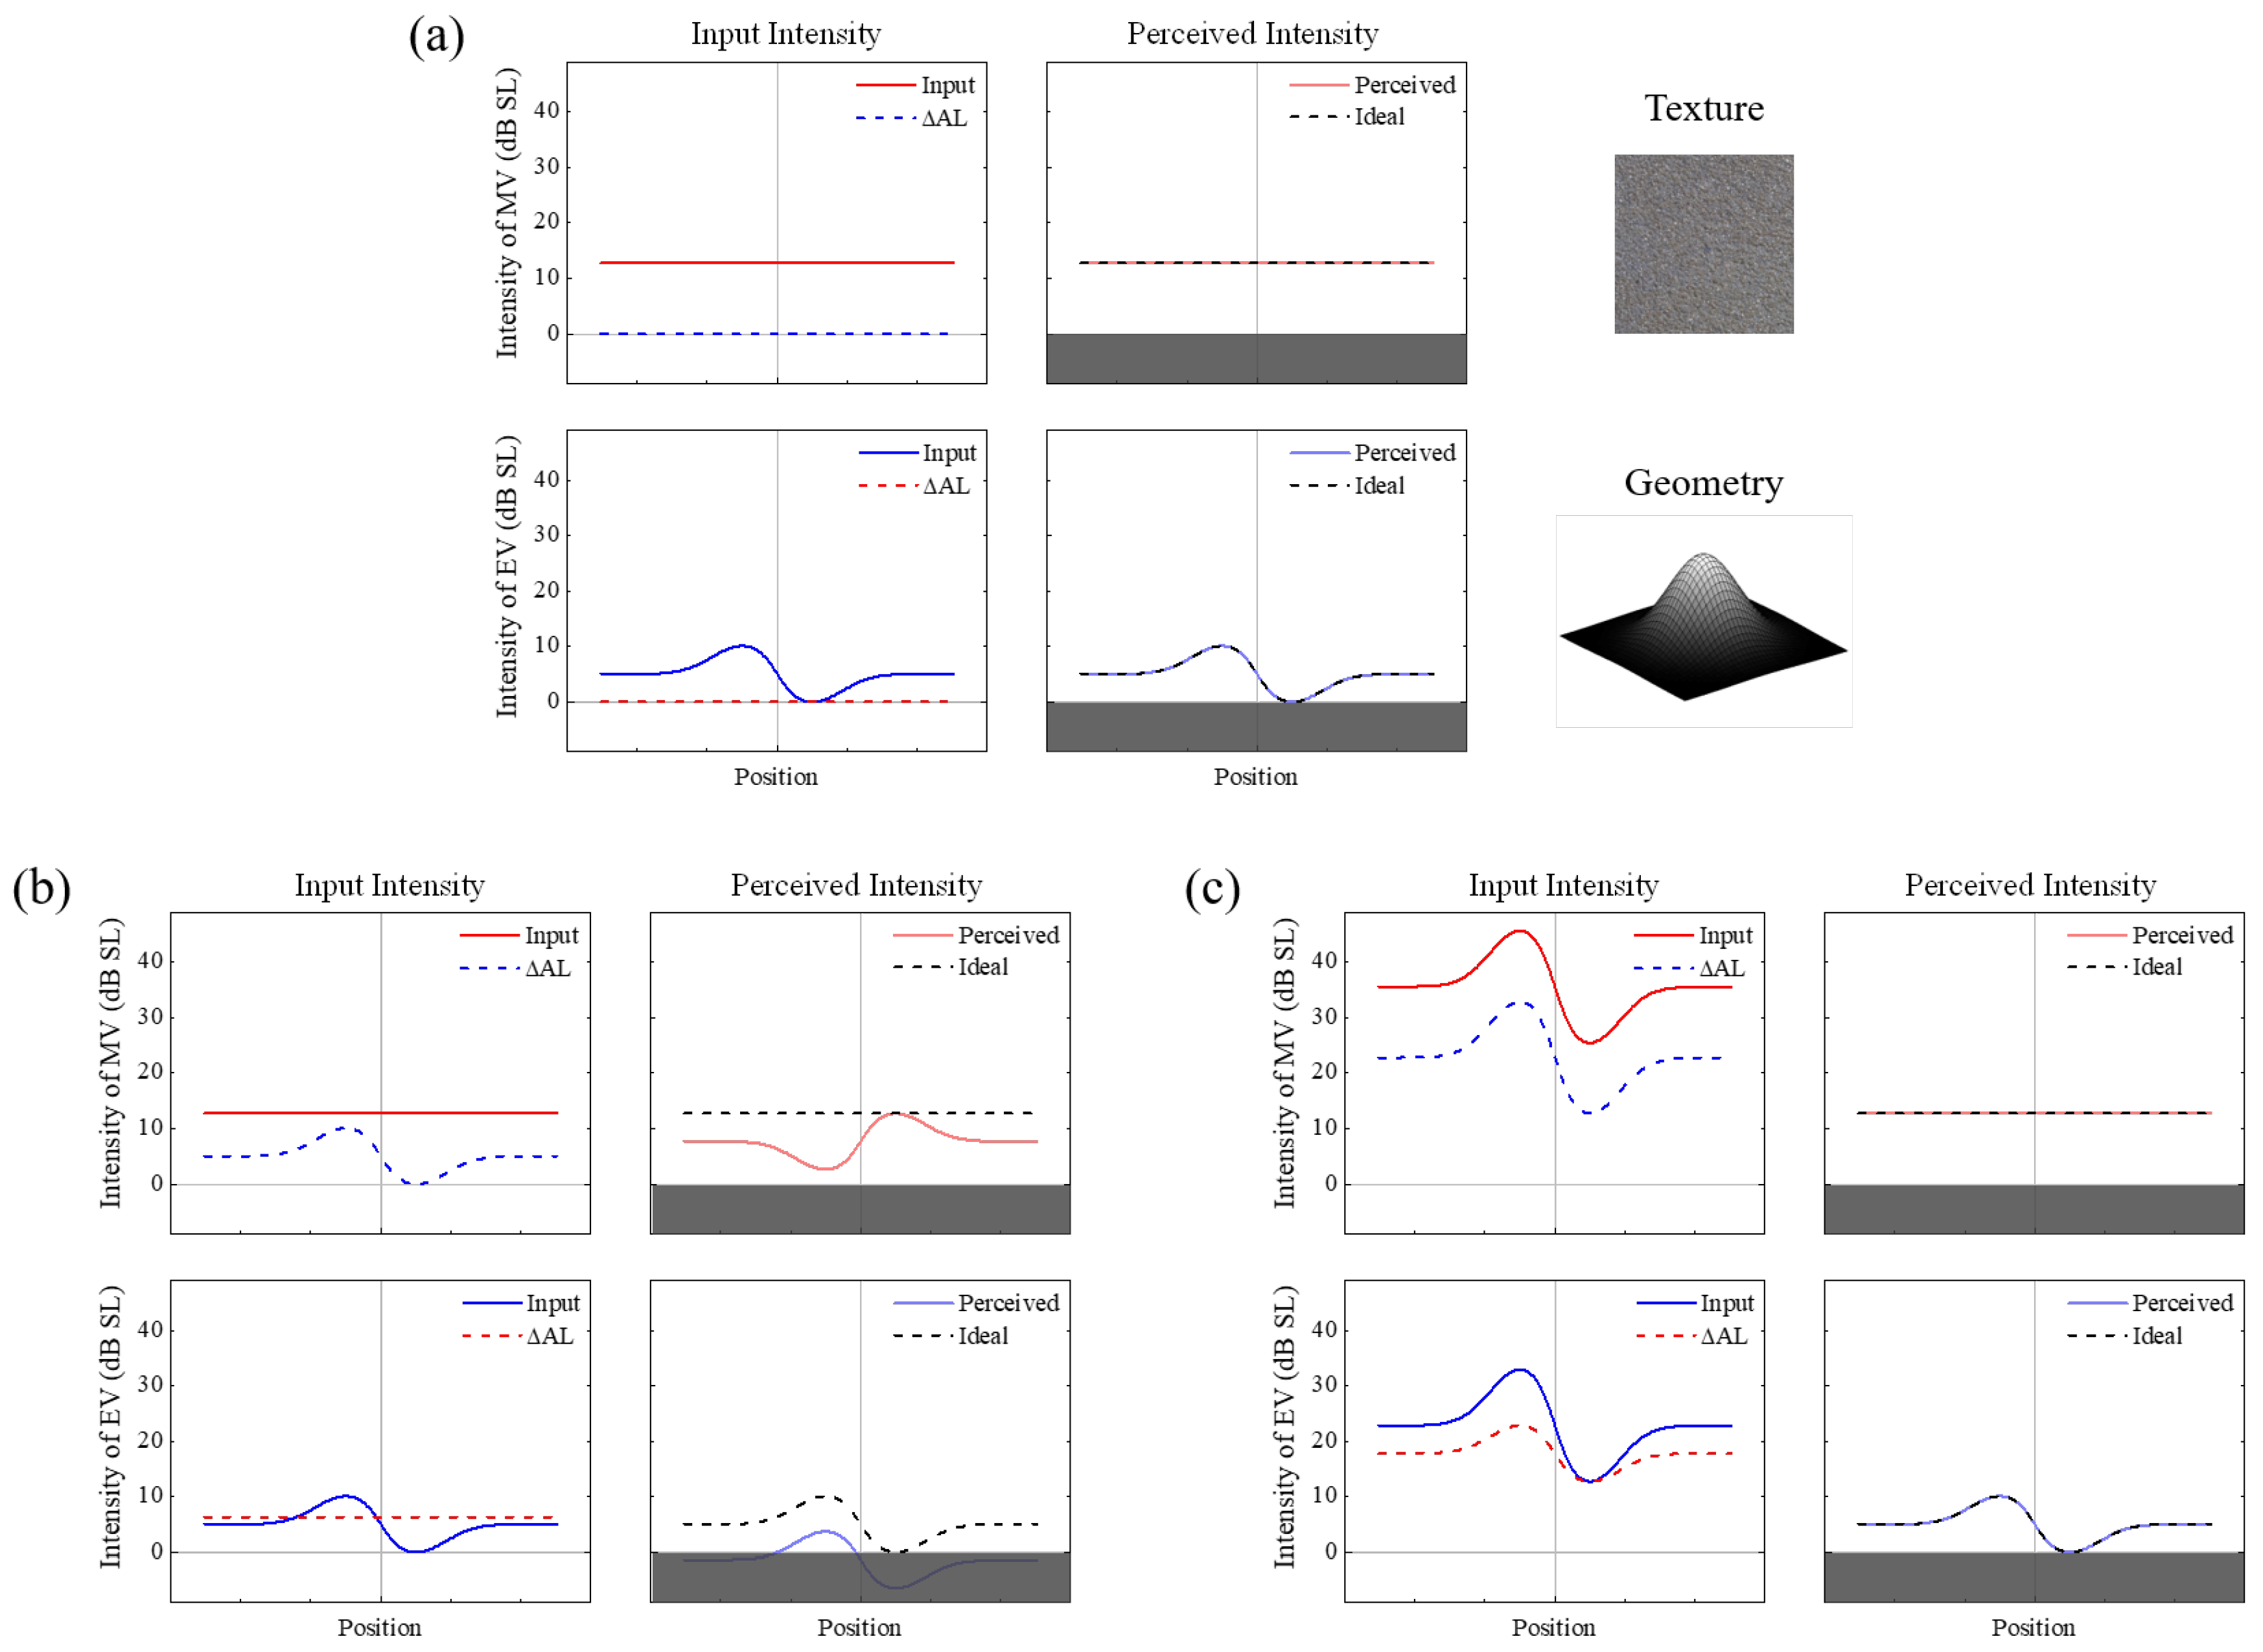
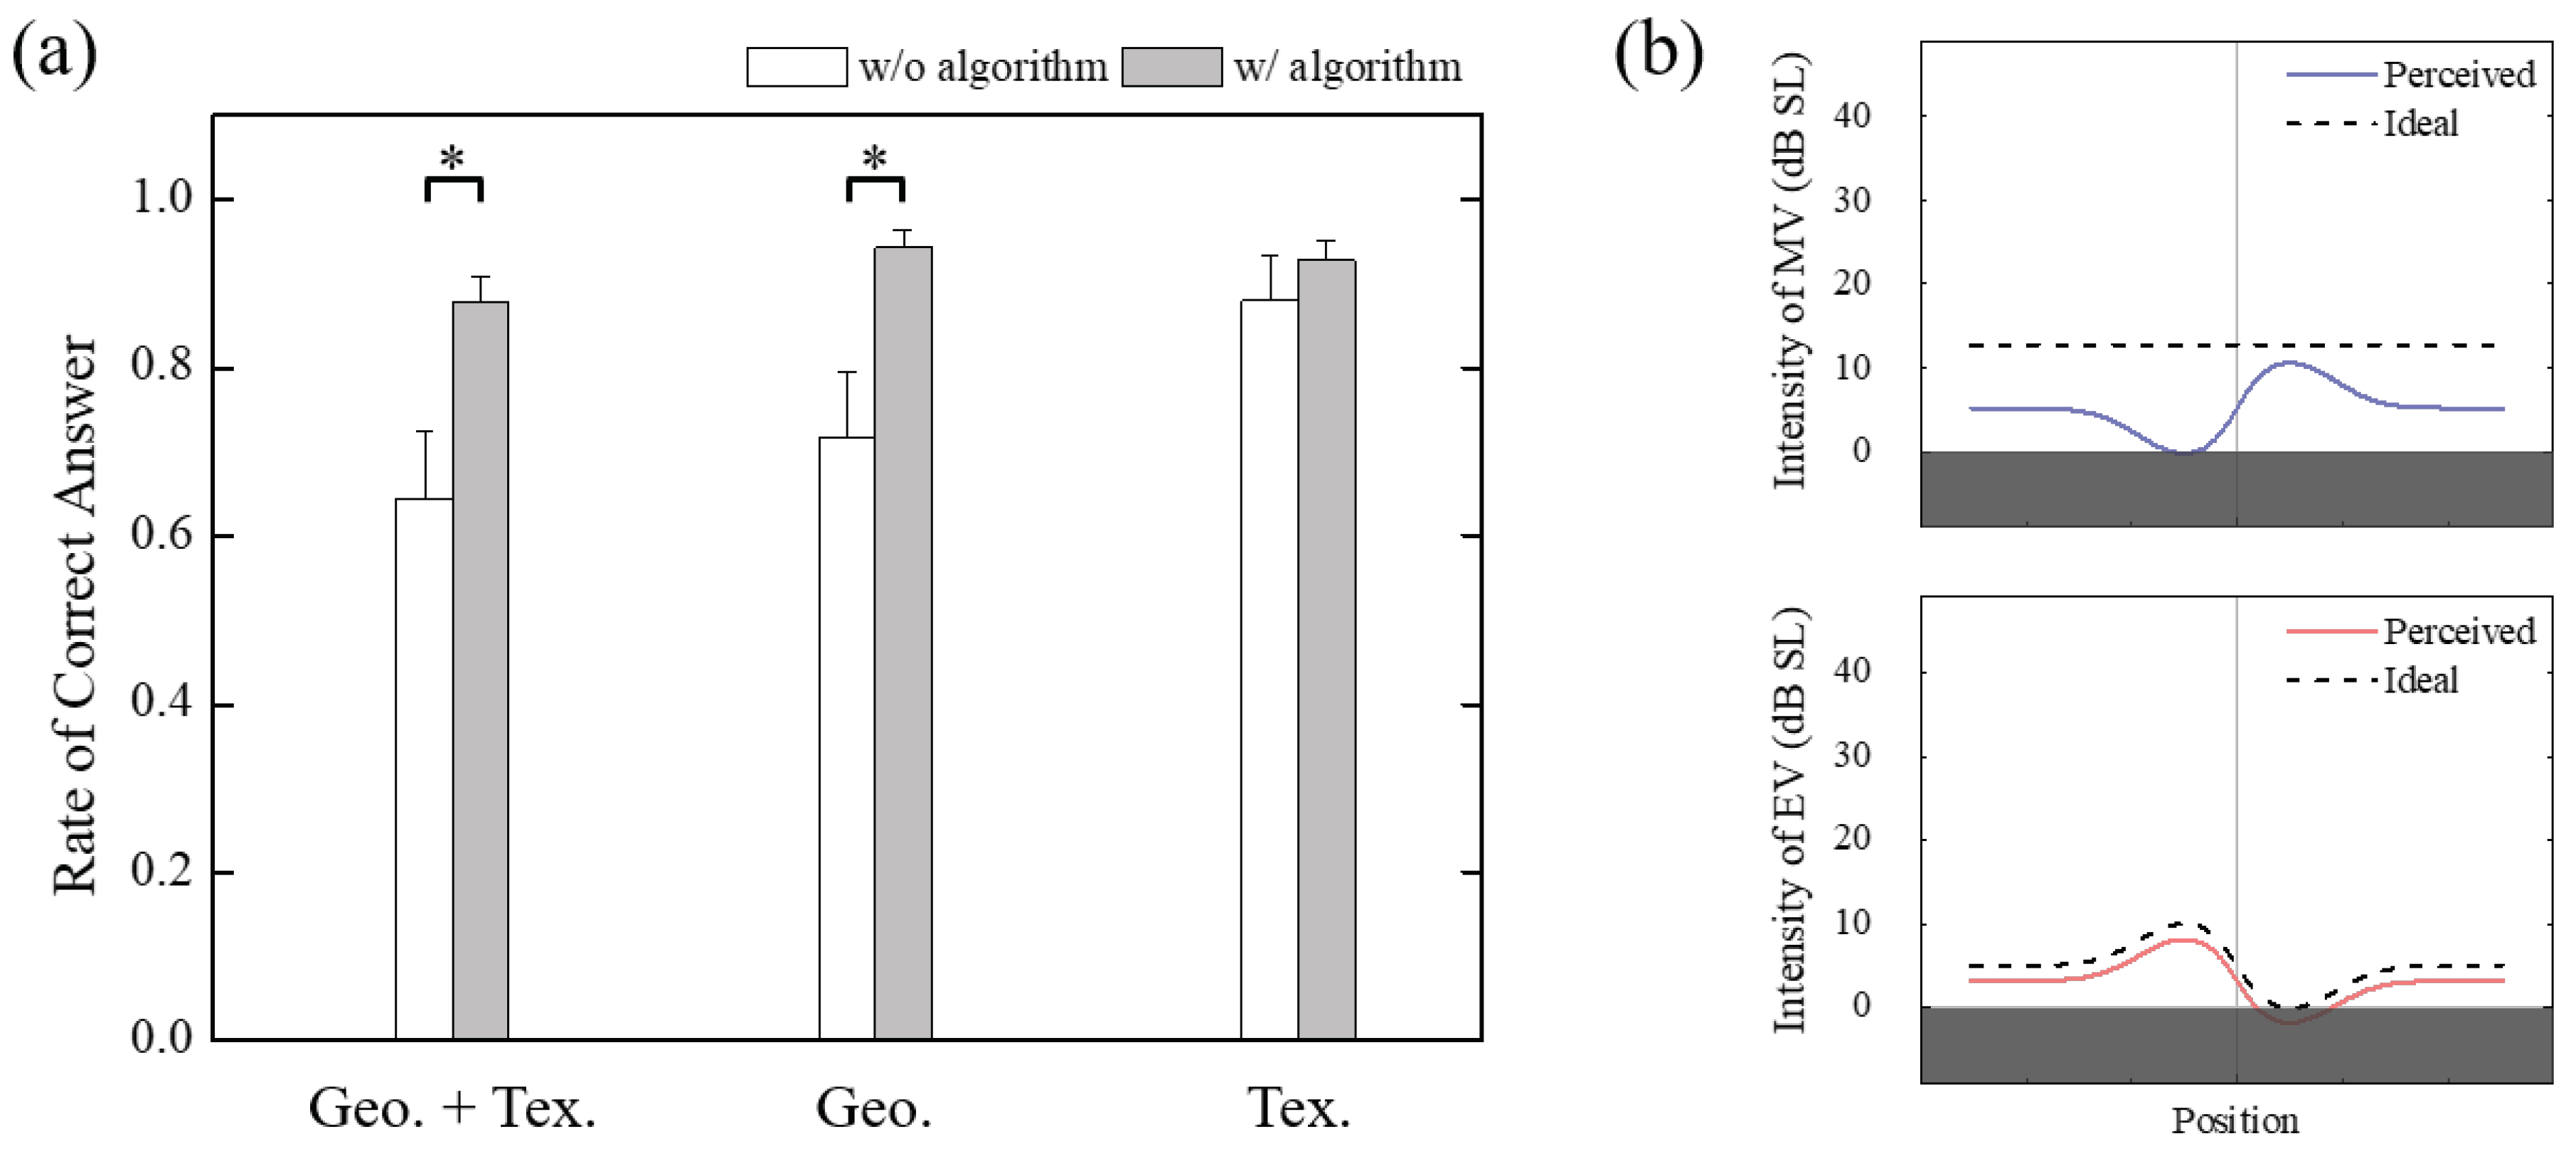
For example, let us suppose that we are planning to simultaneously render bumpy geometry by the EV and a uniform texture by the MV, as shown in Figure 4. The texture, which has constant intensity at all positions, can be rendered by the MV [18,19,20]. The geometry (bump), which has varying intensity depending on the position, can be rendered by modulating the intensity of the EV according to surface gradients [21,22]. The horizontal axis in all graphs in Figure 4 represents the haptic interaction point (HIP) on the touch surface. The vertical axis is in units of “dB SL” and represents the input intensity, generated by the device (left), or the users’ perceived intensity (right). In the left-side graphs, solid lines depict the input intensity of the MV (solid red) and EV (solid blue), whereas dashed lines depict the masked AL of the MV by the EV (dashed blue) and the masked AL of the EV by the MV (dashed red). In the right-side graphs, solid lines depict the users’ actual perceived intensity, and the dashed lines depict the intended (or designed) perceived intensity. The perceived intensity can be expected to be the difference between the input intensity and the masked AL. Ideally, if there is no masking effect, the input intensity and the perceived intensity would be the same, as shown in Figure 4a. In practice, however, the masking effect may cause a significant distortion in the perceived intensity. That is, the intended stimulus intensity might not be conveyed to the users due to the masking effect, as shown in Figure 4b. In this case, the perceived intensity of the MV, designed to provide a constant intensity at all positions, changes in unintended ways. Besides, the EV would be perceived at an intensity lower than the desired perceived one. Specifically, the user might not perceive a stimulus lower than 0 dB SL (i.e., when a stimulus intensity is lower than the masked AL), which is marked as gray shading in the figure. Thus, it is necessary to apply a rendering strategy from a different viewpoint when the masking effect is present. Herein, we propose to adjust the input intensity in a way that would produce the desired perceived intensity. As shown in Figure 4c, the desired perceived intensity could be achieved by modulating the input intensity of the MV and EV accordingly.

3.2. Generalized Algorithm

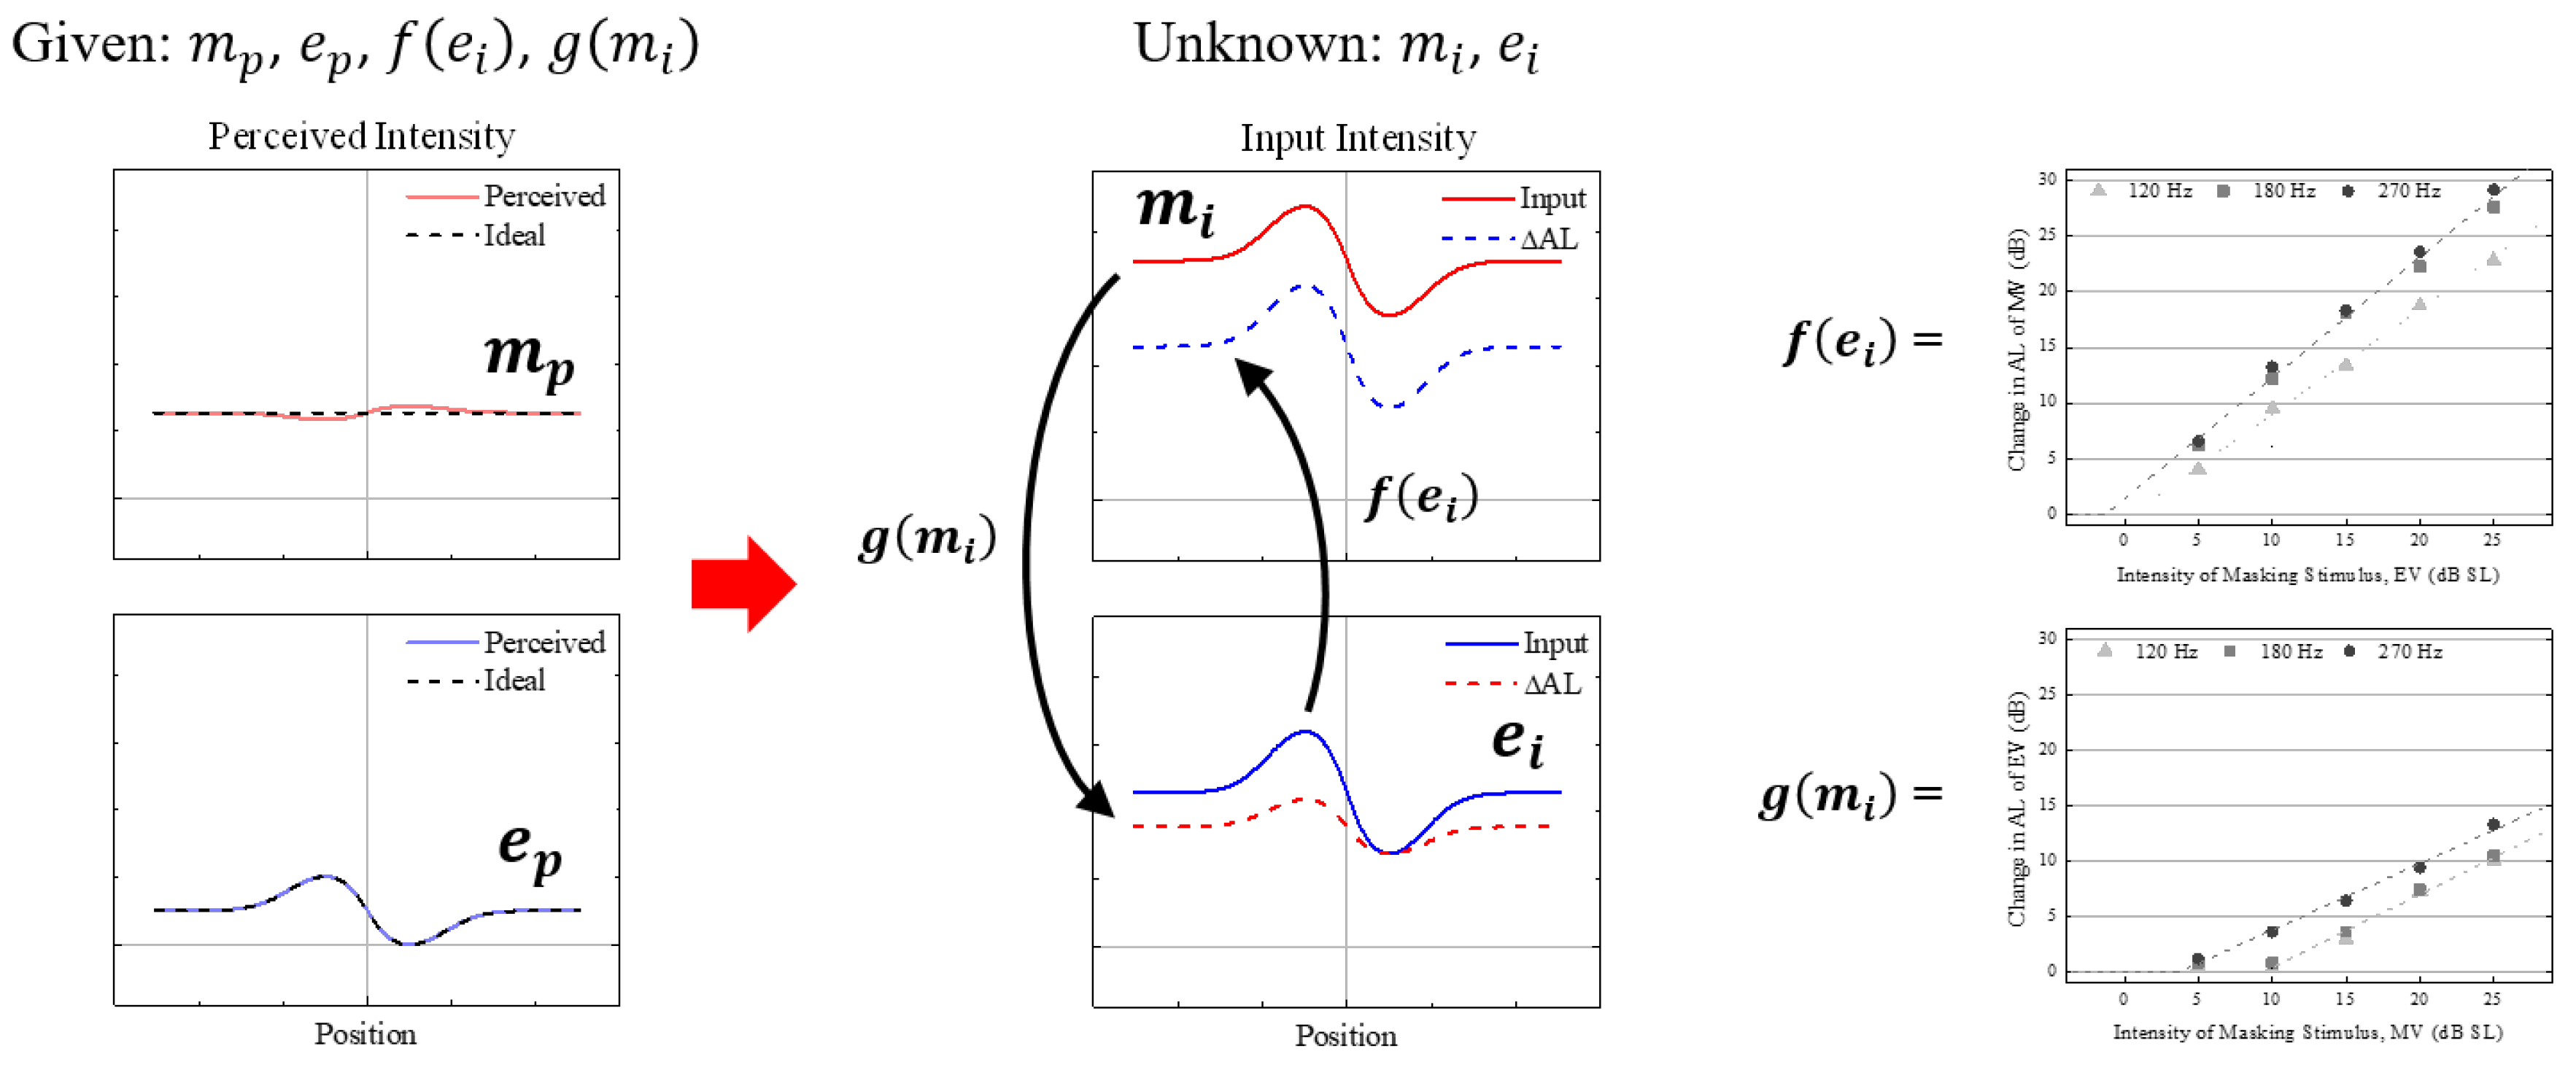
Table 3 lists the variables to be used in this section. The proposed algorithm can be summarized as searching for the values of m i and e i (i.e., the required input intensities) based on given values of the variables m p and e p (i.e., the desired/designed perceived intensities), as shown in Figure 5.
To generalize our approach, it should be possible to compute the required input intensity of both the MV and EV for any arbitrary perceived intensity desired. First, we need to derive a generalized form of the masking functions. The masking function investigated in Section 2 above tended to function linearly in a certain region but had a value of zero in other regions, i.e., the form of a ramp function. These results are consistent with the results of earlier studies [23,24]. Thus, the generalized masking function can be expressed in the form of conditional equations as follows,
f ( e i ) = 0 , i f e i < a / b a + b e i , o t h e r w i s e
g ( m i ) = 0 , i f m i < c / d c + d m i , o t h e r w i s e
where a and b denote the intercept and slope of the masking function of the MV, respectively, and c and d denote the same for the EV. The relationship between the input and perceived intensities of the MV and EV, using the generalized masking functions in (1) and (2), can be defined as follows.
m p = m i f ( e i )
e p = e i g ( m i )
Equations (3) and (4) show that the values of f ( e i ) and g ( m i ) change in two ways according to the interval in which the solution, e i and m i , is located. Therefore, the proposed algorithm is defined as solving one of the four linear systems, depending on the values of m i and e i to be found. If the four conditions are named 1–4, then the exact solution for each of the four conditions can be derived as listed in Table 4. As shown in the table, an exact solution exists for each of the four conditions. As, in our problem, the given variables are a perceived intensity pair, the third column in the table presents rearranged conditions as a function of m p and e p . It is important to note that condition #4 is subdivided into two cases based on the sign of b d , the multiplication of the two masking functions slope values.
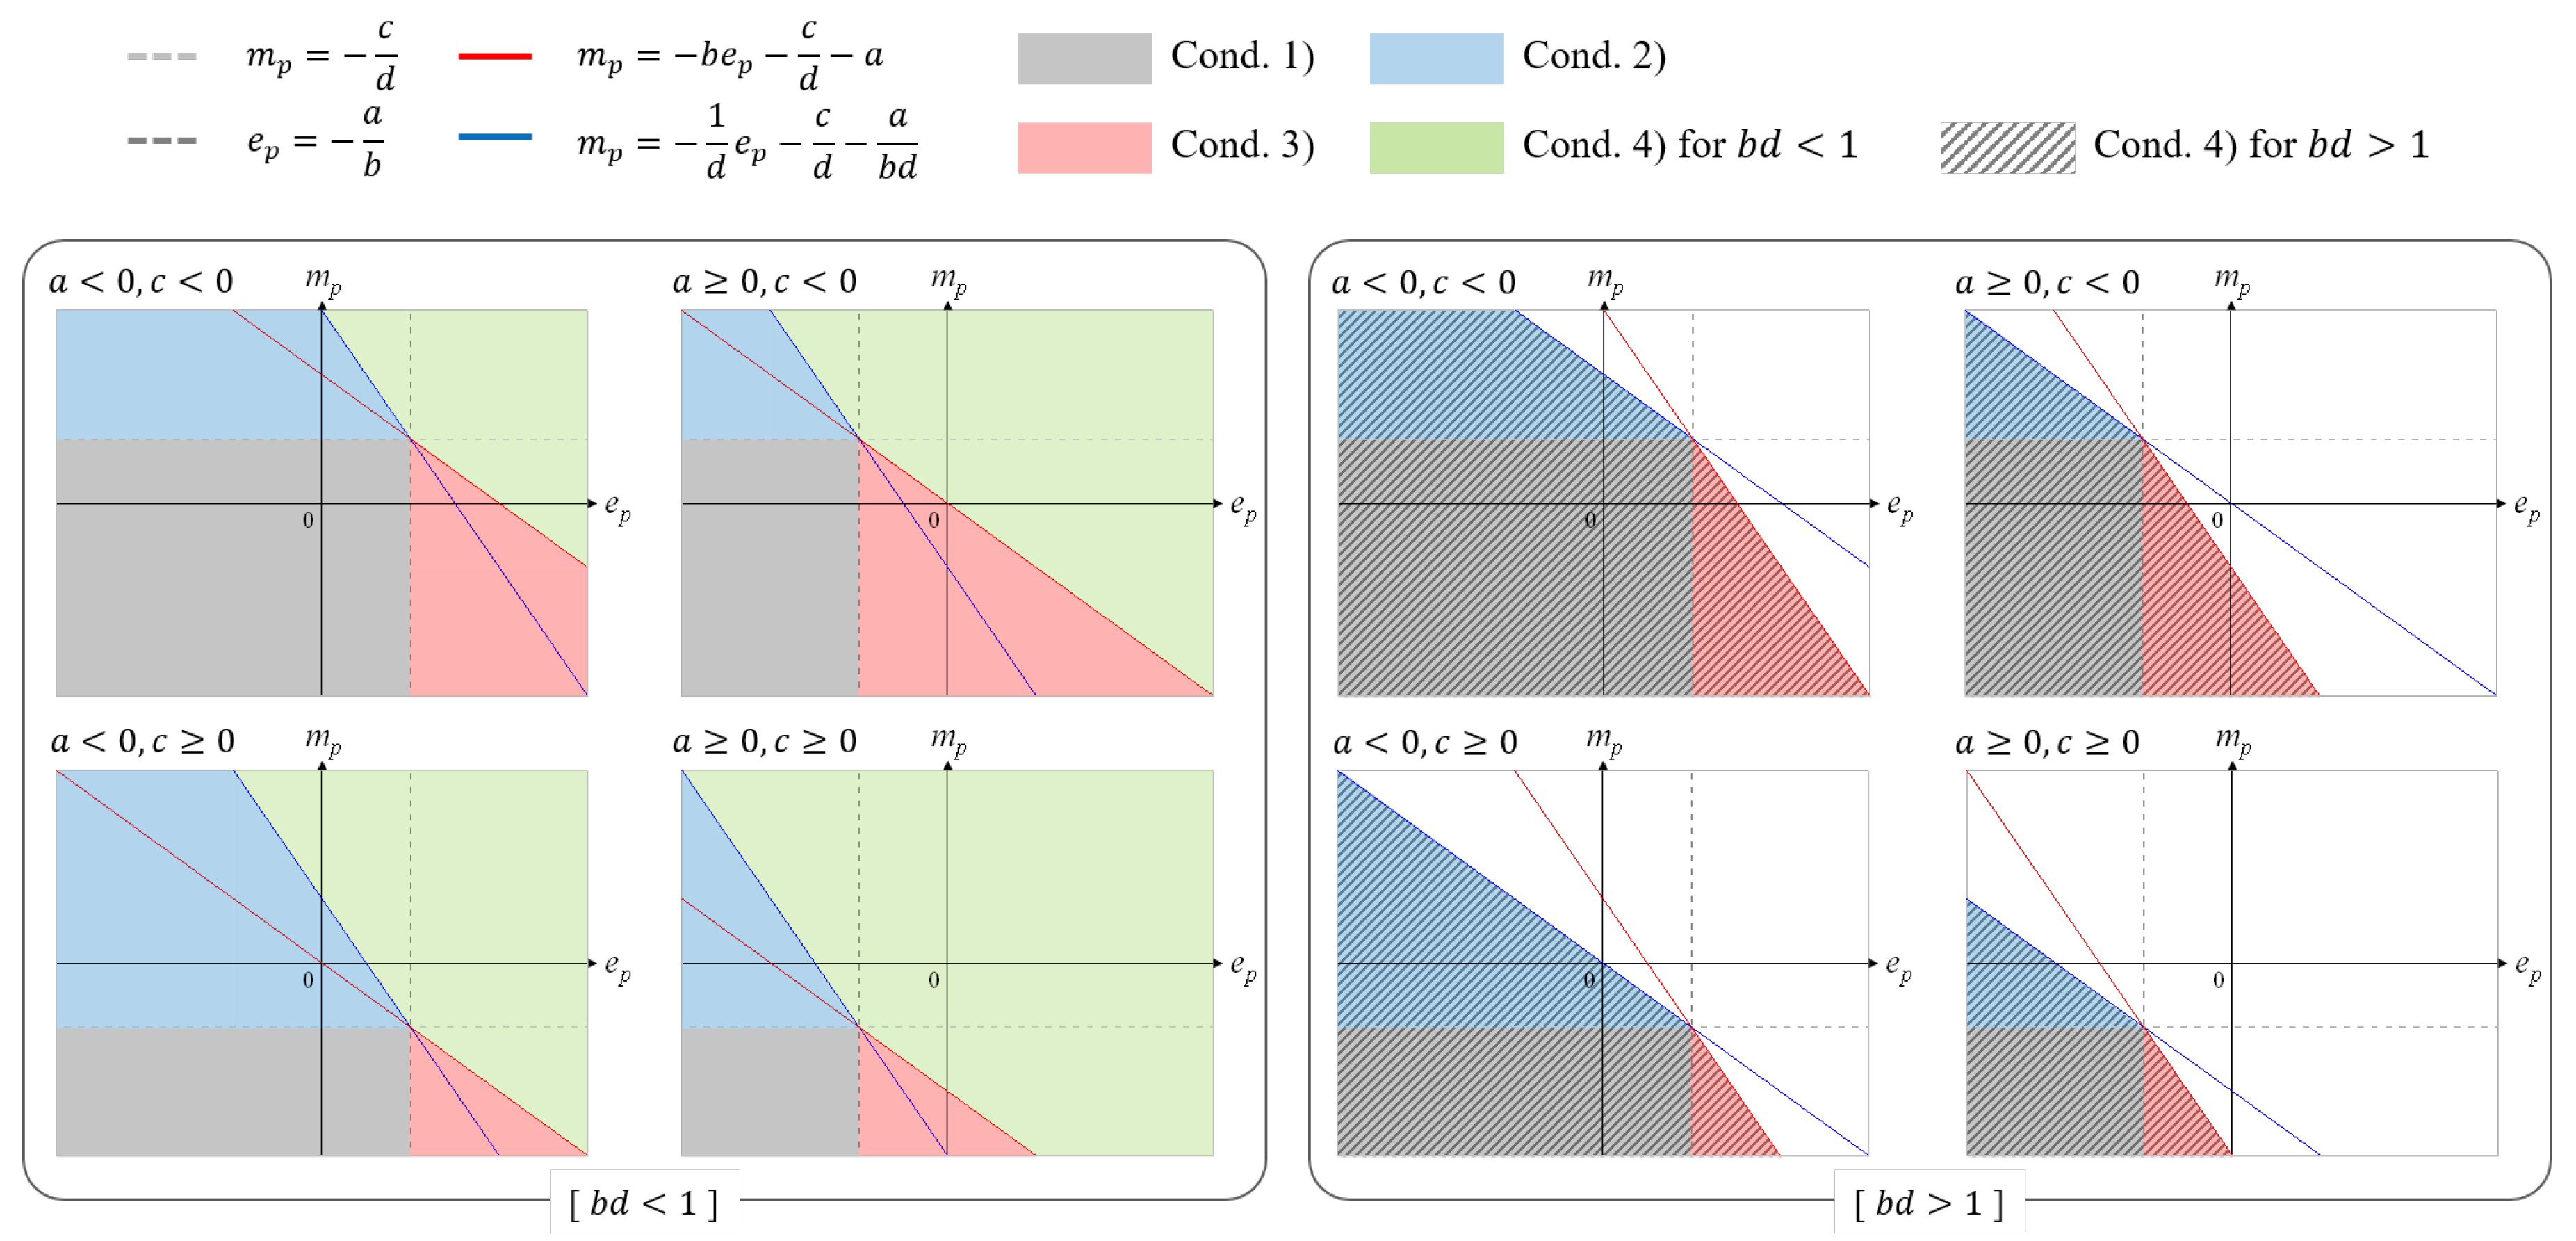
To determine the required input intensity to satisfy the desired perceived intensity, there should exist a unique solution pair, m i and e i for arbitrary m p and e p . To clarify this, we examined the region where a solution exists for all possible cases. Figure 6 shows the graphical representation of the region of m p and e p that satisfies each of the four conditions. The conditions (third column in Table 4) are represented by four lines. The intersection between them is always ( a / b , c / d ) . This intersection can be in different quadrants, depending on the sign of a and c (the respective intercepts of the two masking functions). As shown in Figure 6, when b d < 1 , the regions satisfying each condition are completely separated, and cover all real numbers of m p and e p . In other words, when b d < 1 , there always exists a unique solution, m i and e i , for arbitrary real numbers of m p and e p . However, when b d > 1 , the regions covered by condition 1 (gray), 2 (blue), and 3 (red) overlapped with the region covered by condition 4 (shaded). In short, if the desired perceived intensity pair, m p and e p , is located at the overlapped region, then the solution (input intensity pair: m i and e i ) is not unique. Furthermore, the solution does not exist if the desired perceived intensity pair is located at another region that is not covered by any of four conditions. Thus, given that the perceived intensity should be designed as a positive value, the proposed algorithm is not applicable when b d > 1 .

3.3. User Test

We conducted a user test to investigate how well the participants could discriminate the presented geometry and texture after applying the proposed rendering algorithm. The test was performed using the same apparatus as the one used in Section 2 above. The ten participants who participated in experiments I and II took part in the user test. The user test included cases when the proposed rendering algorithm was applied and cases when it was not. As shown in Figure 7, the participants were exposed to twelve combinations of four geometries and three textures.
The four geometries rendered by the EV were bump, hole, ascending slope, and descending slope. A Gaussian function was used to render the bump and hole, and an exponential function was used to render the ascending and descending slopes. The height and width of each geometry were set so that all four had the same height and inclination maximums. The target intensities were set to range between 0 and 10 dB SL. The intensity of the EV was determined based on surface gradient [21], and its frequency was set to 270 Hz. The three textures, named smooth, rough, and coarse, were rendered by varying the frequency and intensity of the MV. These were selected through an informal pilot test designed to identify the parameters for which the users could discriminate intuitively between the three. The target intensities for texture rendering were 6 dB SL for smooth and 12 dB SL for rough and coarse. For the coarse texture, we used a carrier frequency of 120 Hz and an envelope frequency of 40 Hz. As this stimulus was not tested in experiments I and II, we performed a pilot test to obtain the ALs and masking functions for this combination.
The experiment consisted of 120 trials (two test conditions, 12 objects, and five repeats), assigned at a random order to each participant. In each trial, one of the four types of geometries and one of the three types of textures were simultaneously presented to the participants. That is, a randomly chosen object out of the twelve was presented. During a 7.8 s trial, the object (stimulus) was presented three times for 1.8 s each, with an inter-stimulus interval of 0.6 s and a 1.2 s interval before the first stimulus. Participants were asked to respond to the presented object (geometry and texture) immediately after the end of each trial. Specifically, they responded to the presented geometry and texture sequentially by pressing numeric keys on a keyboard (1–4 and 1–3 for geometry and texture, respectively). They could not repeat a trial and were not allowed to return to the previous trial. All other instructions and experimental environments were controlled in the same manner as in the experiments described in Section 2 above. Note that the participants were not provided with visual information of the objects during the experiment. Prior to the main experiment, a training session was provided. Immediately after the training session, the main experiment ensued, lasting approximately 30 min.

3.4. Results

Figure 8a shows the average rate of correct answers for the presented objects when the proposed rendering algorithm was applied or when it was not.
The first column in the figure refers to the case when the answer to both geometry and texture was correct. The second or third columns refer to cases when the answer to geometry or texture was correct, respectively. Considering both geometry and texture (first column), the average rate of correct answers was significantly higher when the rendering algorithm was applied (0.644 ± 0.079 vs. 0.878 ± 0.031, p < 0.01 ). The result implies that two independent cues, i.e., geometry and texture, were successfully presented to the users at the intended perceived intensity by applying the proposed rendering algorithm. The mean rate of correct answers to the presented geometries regardless of the texture (second column) was also significantly higher when the rendering algorithm was used (0.719 ± 0.076 vs. 0.943 ± 0.022, p < 0.01 ). However, the mean rate of correct answers to the presented textures regardless of the geometries (third column) was not affect by the algorithm (0.880 ± 0.053 vs. 0.928 ± 0.022, p = 0.207 ). When the proposed algorithm was not applied, some distortion in both geometry and texture information could have happened, as was discussed in Section 3.1 above. Figure 8b shows an example of an expected perceived intensity when a bump with rough texture was rendered without the proposed algorithm. As expected, the perceived intensity of the MV was severely distorted due to the masking effect, unlike the reverse case, because the slope and intercept of the masking function of the MV (approximately 1.09 and 1.39, respectively) were larger than those of the EV (approximately 0.66 and −6.22, respectively). It is noteworthy that the distorted MV has the opposite profile to that of the intended perceived intensity of the EV. This might cause confusion, particularly when discriminating geometries, as it adjusts based on changes in the stimulus intensity. Texture information may not be perceived as uniformly as intended, but the participants could guess the correct answer because the intensity of the MV was high enough to allow recognition at certain positions (e.g., near the center of horizontal axis).

4. Discussion

4.1. Masking Function

In general, the masking function in tactile perception has been observed in the form of a ramp function, although the slope and intercept varied according to the conditions of the stimuli presented [25,26]. In addition, the masking effect on the AL was observed to be more prominent for in-channel masking (i.e., when the same sensory channel was stimulated) than for cross-channel masking (i.e., when different sensory channels were stimulated) [12,27]. The general tendency of the masking functions investigated in the current study was consistent with that mentioned above. The slopes of the masking functions were approximately 0.6–0.7 and 0.9–1.1 for the EV and MV, respectively. It is remarkable that, in the case of the EV, there was a region in which there was no masking effect, i.e., the changes in the AL of the EV did not significantly differ from zero. This phenomenon has been observed when the target and masking stimuli activated different sensory channels [12]. The MV used in the current study would mainly activate rapidly adapting (RA) afferent nerve fibers, especially RA type 2 (RA II), they are known to be most sensitive at a frequency range of 120 to 270 Hz for stimuli presented perpendicularly to the skin. Thus, it is evident, based on the results, that the EV contributes to the activation of at least one of the slow adapting (SA) afferent fibers. More specifically, we expect that the SA II afferent fibers are highly related to the EV as they are more sensitive to skin stretching than SA I afferent fibers [2,28]. In the case of the MV, the change in the AL was significantly different from zero for all positive intensities of the masker (EV). Furthermore, the slope of the masking function of the MV was steeper than that of the EV. These aspects are consistent with previously reported results for in-channel masking experiments [12,25,26]. That is, the EV contributes to the activation of both SA and RA (rapidly adapting) afferent fibers. Edin [28] reported that dynamic skin stretching contributes to the activation of RA and SA afferent fibers, which is supported by our findings. In summary, we have confirmed that the mutual masking effect clearly appears in combinations of different tactile feedback types; MV and EV in our study. As the masking effect causes significant changes in the AL level, we should give it in-depth consideration when designing multiple tactile feedback.

4.2. The Rendering Algorithm

As confirmed in Section 3.2 above, by applying the proposed rendering algorithm when b d < 1 , we could find a unique pair of required input intensities for the MV and EV to produce an arbitrary perceived intensity for them. That is, the mutual masking effect could be eliminated at the sensation level. The results from the user test revealed that the proposed method was effective at emulating virtual objects with multiple tactile information, such as geometry and texture (rate of correct answer increased by approximately 23%). It was confirmed that, for a combination of MV and EV, the term b d was smaller than 1. If b d > 1 , only a limited range of perceived intensities could be rendered, as shown in the right part of Figure 6. However, we believe the possibility of b d > 1 can be ignored. Typically, it has been observed that in tactile perception, the masking function slope does not significantly exceed 1, even in cases of in-channel masking [23,24,25]. Moreover, as shown in the current study, if a stimulus significantly influences the perception of another stimulus (i.e., the slope is approximately 1), the opposite would be relatively lower (i.e., the slope is less than 1). Thus, we expect that the proposed approach can be applied to various combinations of tactile stimuli.

4.3. Limitations and Future Work

The current study focused on proving a newly proposed concept by conducting a small set of essential experiments. Therefore, several aspects should still be further investigated. First, we need to find out the intensity range limits that can be rendered by the proposed algorithm as dictated by the maximum (or rated) output of the device. As shown in Figure 5, a much stronger input intensity is required to produce the desired perceived intensity, especially for the MV. Thus, depending on the rated output of the device, the possible range of perceived intensities could probably be significantly reduced. Using the device with high output intensity could be one possible solution; however, too high of an input (e.g., m i ) intensity might be uncomfortable or painful to the users, although they would perceive the presented stimulus intensity at the sensation level (e.g., m p = m i f ( e i ) ). To address this, intensive experiments are required to suggest an adequate range of input and perceived (or target) intensities.
Another drawback is related to the determined efforts to conduct a set of experiments aimed to find the masking functions. As described in the previous sections, the proposed algorithm requires a mutual masking function of a target stimulus set. That is, if we intend to use a stimulus set that was not investigated before (e.g., a combination of EV of 270 Hz and MV of 150 Hz), experiments I and II should be repeated for such a stimulus set. Performing experiments I and II for all candidate stimulus sets would be a huge burden and might not be an effective way in this context. Although several research groups have suggested a method to predict vibrotactile masking functions [23], predicting all possible stimulus combinations might be complex. These issues will be investigated in future studies.
In the current study, we decided to use EV to render geometry as many studies have verified that lateral force (or frictional force) plays an important role in the perception of object geometry [29,30,31]. However, the combination of EV and MV might not be the best way to present both geometry and texture information. For example, the role of EV and MV may have changed, or the texture and geometry could have been rendered by EV alone or by the combination of other tactile feedback methods. It is important to find the optimal combination of stimuli to represent both texture and geometry, and this should be further studied in the future. Note that, in the current study, we focused on investigating and overcoming the mutual masking effect when two types of tactile information are provided at the same time, rather than on showing that the combination of EV and MV is effective for texture and geometry representation. We believe our approach can be extended to a variety of applications and not limited to the representation of geometry and texture or the combination of EV and MV.

5. Conclusions

In this study, we proposed a rendering algorithm that can compensate for the mutual masking effect at the user’s sensation level, when MV and EV are presented simultaneously to the fingertip. First, the masked ALs for each of the stimuli were investigated for various frequency combinations and masker levels. Then, a generalized form of the masking function was derived as a ramp function. Based on the masking functions, we proposed a rendering algorithm that can compensate for the mutual masking effect by adequately modulating the input intensity to produce the desired perceived intensity. We then confirmed that, theoretically, the proposed algorithm always works if the multiplication of the mutual masking function slopes is smaller than 1. The user test showed that the proposed algorithm significantly improves the hidden virtual object recognition rate when geometry and texture information are presented simultaneously. We expect our approach to be expandable to numerous applications in which multiple tactile feedback types are used.

Author Contributions

S.R., D.P., S.-C.L., and D.-S.K. conceived the experiments; S.R. and D.P. conducted the experiments; S.R. and D.P. analyzed the results; all authors wrote, reviewed, and revised the manuscript. All authors have read and agreed to the published version of the manuscript.

Funding

This work was in part by the National Research Foundation of Korea (NRF) grant funded by the Korean government (MSIT) under Grant NRF-2018R1D1A3B07047864 and in part by the Hallym University Research Fund, 2018 (HRF-201803-001).

Conflicts of Interest

The authors declare no conflicts of interest.

Abbreviations

The following abbreviations are used in this manuscript.
ALAbsolute limen or Absolute threshold
DLDifference limen or difference threshold
EVElectrovibration
MVMechanical vibration

References

  1. Johansson, R.S.; Vallbo, A. Tactile sensibility in the human hand: Relative and absolute densities of four types of mechanoreceptive units in glabrous skin. J. Physiol. 1979, 286, 283–300. [Google Scholar] [CrossRef]
  2. Johnson, K.O.; Yoshioka, T.; Vega-Bermudez, F. Tactile functions of mechanoreceptive afferents innervating the hand. J. Clin. Neurophysiol. 2000, 17, 539–558. [Google Scholar] [CrossRef]
  3. Johansson, R.; Vallbo, A.B. Skin mechanoreceptors in the human hand: An inference of some population properties. In Sensory Functions of the Skin in Primates; Elsevier: Amsterdam, The Netherlands, 1976; pp. 171–184. [Google Scholar]
  4. Pyo, D.; Ryu, S.; Kim, S.C.; Kwon, D.S. A new surface display for 3D haptic rendering. In Proceedings of the International Conference on Human Haptic Sensing and Touch Enabled Computer Applications; Springer: Berlin/Heidelberg, Germany, 2014; pp. 487–495. [Google Scholar]
  5. Saga, S.; Raskar, R. Feel through window: Simultaneous geometry and texture display based on lateral force. In SIGGRAPH Asia 2012 Emerging Technologies; Association for Computing Machinery: New York, NY, USA, 2012; pp. 1–3. [Google Scholar]
  6. Dai, X.; Gu, J.; Cao, X.; Colgate, J.E.; Tan, H. SlickFeel: Sliding and clicking haptic feedback on a touchscreen. In Proceedings of the 25th Annual ACM Symposium on User Interface Software and Technology, Cambridge, MA, USA, 7–10 October 2012; pp. 21–22. [Google Scholar]
  7. Liu, G.; Zhang, C.; Sun, X. Tri-modal tactile display and its application into tactile perception of visualized surfaces. IEEE Trans. Haptics 2020. [Google Scholar] [CrossRef] [PubMed]
  8. Yem, V.; Okazaki, R.; Kajimoto, H. FinGAR: Combination of electrical and mechanical stimulation for high-fidelity tactile presentation. In ACM SIGGRAPH 2016 Emerging Technologies; Association for Computing Machinery: New York, NY, USA, 2016; pp. 1–2. [Google Scholar]
  9. Legge, G.E.; Foley, J.M. Contrast masking in human vision. Josa 1980, 70, 1458–1471. [Google Scholar] [CrossRef] [PubMed]
  10. Hellman, R.P.; Zwislocki, J. Loudness Function of a 1000-cps Tone in the Presence of a Masking Noise. J. Acoust. Soc. Am. 1964, 36, 1618–1627. [Google Scholar] [CrossRef]
  11. Carhart, R.; Tillman, T.W.; Greetis, E.S. Perceptual masking in multiple sound backgrounds. J. Acoust. Soc. Am. 1969, 45, 694–703. [Google Scholar] [CrossRef] [PubMed]
  12. Hamer, R.D.; Verrillo, R.T.; Zwislocki, J.J. Vibrotacile masking of Pacinian and non-Pacinian channels. J. Acoust. Soc. Am. 1983, 73, 1293–1303. [Google Scholar] [CrossRef] [PubMed]
  13. Craig, J.C. Difference threshold for intensity of tactile stimuli. Percept. Psychophys. 1972, 11, 150–152. [Google Scholar] [CrossRef] [Green Version]
  14. Ryu, S.; Pyo, D.; Lim, S.C.; Kwon, D.S. Mechanical vibration influences the perception of electrovibration. Sci. Rep. 2018, 8, 1–10. [Google Scholar] [CrossRef]
  15. Levitt, H. Transformed up-down methods in psychoacoustics. J. Acoust. Soc. Am. 1971, 49, 467–477. [Google Scholar] [CrossRef]
  16. Leek, M.R. Adaptive procedures in psychophysical research. Percept. Psychophys. 2001, 63, 1279–1292. [Google Scholar] [CrossRef] [PubMed] [Green Version]
  17. Vezzoli, E.; Messaoud, W.B.; Amberg, M.; Giraud, F.; Lemaire-Semail, B.; Bueno, M.A. Physical and perceptual independence of ultrasonic vibration and electrovibration for friction modulation. IEEE Trans. Haptics 2015, 8, 235–239. [Google Scholar] [CrossRef] [PubMed] [Green Version]
  18. Bensmaia, S.J.; Hollins, M. The vibrations of texture. Somatosens. Mot. Res. 2003, 20, 33–43. [Google Scholar] [CrossRef] [PubMed]
  19. Weber, A.I.; Saal, H.P.; Lieber, J.D.; Cheng, J.W.; Manfredi, L.R.; Dammann, J.F.; Bensmaia, S.J. Spatial and temporal codes mediate the tactile perception of natural textures. Proc. Natl. Acad. Sci. USA 2013, 110, 17107–17112. [Google Scholar] [CrossRef] [PubMed] [Green Version]
  20. Jones, L.A.; Sarter, N.B. Tactile displays: Guidance for their design and application. Hum. Factors 2008, 50, 90–111. [Google Scholar] [CrossRef] [PubMed]
  21. Kim, S.C.; Israr, A.; Poupyrev, I. Tactile rendering of 3D features on touch surfaces. In Proceedings of the 26th Annual ACM Symposium on User Interface Software and Technology, St. Andrews Scotland, UK, 8–11 October 2013; pp. 531–538. [Google Scholar]
  22. Osgouei, R.H.; Kim, J.R.; Choi, S. Improving 3D Shape recognition withelectrostatic friction display. IEEE Trans. Haptics 2017, 10, 533–544. [Google Scholar] [CrossRef] [PubMed]
  23. Gescheider, G.A.; Verrillo, R.T.; Van Doren, C.L. Prediction of vibrotactile masking functions. J. Acoust. Soc. Am. 1982, 72, 1421–1426. [Google Scholar] [CrossRef]
  24. Jesteadt, W.; Bacon, S.P.; Lehman, J.R. Forward masking as a function of frequency, masker level, and signal delay. J. Acoust. Soc. Am. 1982, 71, 950–962. [Google Scholar] [CrossRef]
  25. Verrillo, R.T.; Gescheider, G.A.; Calman, B.G.; Van Doren, C.L. Vibrotactile masking: Effects of oneand two-site stimulation. Percept. Psychophys. 1983, 33, 379–387. [Google Scholar] [CrossRef] [PubMed] [Green Version]
  26. Verrillo, R.T. Psychophysics of vibrotactile stimulation. J. Acoust. Soc. Am. 1985, 77, 225–232. [Google Scholar] [CrossRef]
  27. Gescheider, G.A.; O’Malley, M.J.; Verrillo, R.T. Vibrotactile forward masking: Evidence for channel independence. J. Acoust. Soc. Am. 1983, 74, 474–485. [Google Scholar] [CrossRef] [PubMed]
  28. Edin, B.B. Quantitative analysis of static strain sensitivity in human mechanoreceptors from hairy skin. J. Neurophysiol. 1992, 67, 1105–1113. [Google Scholar] [CrossRef] [PubMed]
  29. Robles-De-La-Torre, G.; Hayward, V. Force can overcome object geometry in the perception of shape through active touch. Nature 2001, 412, 445–448. [Google Scholar] [CrossRef] [PubMed]
  30. Robles-De-La-Torre, G.; Hayward, V. Virtual surfaces and haptic shape perception. In Proceedings of the ASME IMECE Symposium on Haptic Interfaces for Virtual Environments and Teleoperator Systems, Orlando, FL, USA, 5–10 November 2000; Volume 69, p. 2. [Google Scholar]
  31. Gordon, I.E.; Morison, V. The haptic perception of curvature. Percept. Psychophys. 1982, 31, 446–450. [Google Scholar] [CrossRef] [PubMed] [Green Version]
Figure 1. Custom-built hardware set-up for the experiments.
Applsci 10 04990 g001
Figure 2. Experimental procedure and stimulus sequence within a three-interval, forced-choice (3IFC) paradigm. The test stimulus was randomly applied at one of the three intervals.
Applsci 10 04990 g002
Figure 3. Masking functions of electrovibration (EV) and mechanical vibration (MV) fitted from the results in Table 2. AL, absolute threshold; SL, sensation level.
Applsci 10 04990 g003
Figure 4. Input and perceived intensity when both geometry and texture information are provided: (a) ideal case, (b) without the algorithm, and (c) with the algorithm.
Applsci 10 04990 g004
Figure 5. Schematic illustration of the proposed rendering algorithm.
Applsci 10 04990 g005
Figure 6. Graphical representation of the region where the solution exists in each case.
Applsci 10 04990 g006
Figure 7. User test: experimental procedure and stimulus presentation.
Applsci 10 04990 g007
Figure 8. Result of the user test: (a) mean rate of correct answers in the geometry and texture discerning test. Error bars represent the standard deviation. Asterisks denote a significant difference between the groups ( p < 0.01 ); (b) example of the expected perceived intensity without the proposed algorithm (a case of combined bump and rough).
Applsci 10 04990 g008
Table 1. Stimulus sets presented in Experiment I and II.
Set 1–5Set 6–10Set 11–15
Experiment IFrequency of EV (Hz)270270270
Frequency of masker, MV (Hz)120180270
Intensity of masker, MV (dB SL)5, 10, 15, 20, 255, 10, 15, 20, 255, 10, 15, 20, 25
Experiment IIFrequency of MV (Hz)120180270
Frequency of masker, EV (Hz)270270270
Intensity of masker, EV (dB SL)5, 10, 15, 20, 255, 10, 15, 20, 255, 10, 15, 20, 25
Table 2. Mean changes in the absolute threshold (AL) of electrovibration (EV) and mechanical vibration (MV) (in dB) at different frequency pairs, and under varying masker intensities. The frequency of EV was 270 Hz. The asterisks denote data that were not significantly different from 0 (i.e., no masking effect appeared).
Target
Stimulus
Masking
Stimulus
Frequency
of MV (Hz)
Masker Intensity (dB SL)
510152525
120* 0.433* 0.3222.9927.26510.107
Experiment IEVMV180* 0.771* 0.8083.6117.42710.502
270* 1.1713.6086.4119.42813.301
1204.0179.50613.37618.72722.891
Experiment IIMVEV1806.11812.15818.01522.27827.612
2706.54613.23518.30623.58029.195
Table 3. Variables used in the proposed algorithm.
TermDescription
m p perceived intensity of MV
m i input intensity of MV required to produce m p
e p perceived intensity of EV
e i input intensity of EV required to produce e p
f ( e i ) masking function of MV
g ( m i ) masking function of EV
Table 4. Exact solutions for four conditions. Note that Condition 4 is subdivided into two cases: b d < 1 and b d > 1 .
Condition ( e i , m i ) Solution Condition ( e p , m p )
(1) e i < a b m i < c d m i = m p e i = e p e p < a b m p < c d
(2) e i < a b m i c d m i = m p e i = d m p + e p + c m p < 1 d e p c d a b d m p c d
(3) e i a b m i < c d m i = m p + b e p + a e i = e p e i a b m p < b e p a c d
(4) e i a b m i c d b d < 1 m i = m p + b e p + a + b c 1 b d e i = d m p + e p + c + a d 1 b d m p 1 d e p c d a b d m p b e p a c d
(4) e i a b m i c d b d > 1 m i = m p + b e p + a + b c 1 b d e i = d m p + e p + c + a d 1 b d m p 1 d e p c d a b d m p b e p a c d