Article

Study on Reverse Logistics Focused on Developing the Collection Signal Algorithm Based on the Sensor Data and the Concept of Industry 4.0

Department of Industrial and Management Engineering, Kyonggi University, Gyeonggi-do 154-42, Korea
*
Author to whom correspondence should be addressed.
Appl. Sci. 2020, 10(14), 5016; https://doi.org/10.3390/app10145016
Submission received: 5 July 2020 / Revised: 17 July 2020 / Accepted: 20 July 2020 / Published: 21 July 2020
(This article belongs to the Special Issue Big Data and AI for Process Innovation in the Industry 4.0 Era)

Abstract

:
Reverse logistics include all operations related to the reuse of products and materials. In this study, we focus on collection, which is the first operation of reverse logistics, and on the strength of using the sensor data and the concept of Industry 4.0. Previously, the collection activities of electronic wastes (e-wastes) was conducted by a fixed schedule without consideration of the fulfillment level of the collection boxes. However, due to the progress of IoT(internet of things) technology and sensor technology, it is possible to consider the fulfillment level of the collection boxes in order to make the collection schedule. To utilize the sensor data and IoT technology in reverse logistics, a collection signal algorithm is required to treat the rate of fulfilment of collection boxes. However, the collection signal algorithm for the disposal of small and medium (S&M)-sized e-wastes have not yet been developed in South Korea. This study uses a collection box to develop the collection algorithm based on an experimental design method with multiple sensors. The proposed algorithm can be utilized to solve the current collection problems and to save logistics costs. Furthermore, proper collection of e-wastes will lead to more recycling activities, which can further create and sustain a safer environment on Earth.

1. Introduction

1.1. Background

Recently, sensor technology is exponentially growing and the price of many kinds of sensors decreased dramatically. Therefore, it is possible to embed sensors in the collection boxes of reusable products and materials. Furthermore, based on IoT technology, it is possible to use real-time data of the current status of the fulfillment rate of the boxes. This development can lead to the reduction of not only resources such as labor and financial costs but also illegal disposal of waste electrical and electronic equipment (WEEE). Under this circumstance, the quantity of WEEE is globally about 20~50 million tons every year and steadily increased by three to five percent per year (Dias and Pablo [1] and Aguirre and Angel [2]). Because a significantly large amount of the abovementioned waste is illegally disposed, the WEEE directive was appointed as European Law (2003) to block illegal waste disposal in the environment (Ongondo [3]).
In the European inclusive legislation connecting to e-waste in particular, both the WEEE directive 2002 and the restriction of hazardous substances directive 2002 entered into force by the mid-2005 (Salhofer and Stefan [4]). Although the policies were gradually revised, WEEE is still collected and recycled at informal facilities and methods (Yoshida and Aya [5]). The Republic of Korea has implemented a deposit system since 1992, which is a policy related to WEEE (Min [6]). The Korean government also enforced a similar EPR (extended producer responsibility) in 2003 and assigned the responsibility of environment-friendly collection and recycling of e-wastes to Korean manufacturers and importers (Samsung Global Environment Research Center [7]). The EPR policy is known as the responsibility for the collection and treatment of equipment when they reach their end-of-life status (Sousa and Rita [8]). The EPR policy is also environmentally friendly in that manufacturers must consider the post process of WEEE as well as product design processes (Jeong [9]). Under the EPR regulation, Korea had limited recycling performances on a total of only 10 mandatory products (refrigerator, air conditioner, TV, washer, computer, audio, mobile phone, copier, fax machine, and printer). In comparison with the EU’s 2008 recycling capacity result (6.3 kg/person), Korea’s recycle duty rate was significantly lower, even in 2012 (3.2 kg/person). Therefore, the Korean government has strengthened the EPR regulation by including another mandatory 17 S&M wastes (water purifier, vacuum cleaner, dish washer, etc.), which were the main target items renowned for illegal dismantling since 2014. In response, national target volumes for recycling were presented under the “enforcement decree of the act on resource circulation of electrical and electronic equipment and vehicles” (Ministry of environment, Korea [10]).
Additionally, the free visit and pickup (FVP) service was introduced in 2012 to help relieve consumers’ burden of the disposal of heavy e-wastes to the outside of their residential quarters and to prevent the chance of unauthorized acts of collecting disposed e-wastes, which are eventually dismantled and recycled improperly (Kim and Lee [11]). FVP is a free collection business in which a collection vehicle driver visits a customer’s home and collects disposed e-wastes. (Kim and Kim [12]). The customer only makes a reservation for collecting wastes via a phone call or the internet; FVP will go to the customer house and pick up the waste. As a result, the domestic target levels for large-sized recycling e-wastes has been reached throughout the last three years (see Figure 1). However, the Domestic target levels for S&M e-wastes has not yet been satisfied, as shown in Figure 1. Therefore, stronger regulations and advanced management techniques should be applied to the collection of S&M e-wastes. (Kim and Park [13]).
In this paper, the collection signal algorithm for a sensor-embedded collection box is presented in order to improve the efficiency of collection for S&M e-wastes disposed at the collection box based on sensor technology. The proposed collection signal algorithm could be utilized for more efficient recycling activities, which could further create and sustain a safer environment. This paper is organized as follows. Section 1.2 introduces the purpose of this study, and Section 2 presents the description of the sensor-embedded collection box and the role of the sensors. Section 3.1 provides the description of the experiment procedure, and the experiment results are presented in Section 3.2. Section 3.3 shows the hypothesis test, and the collection signal algorithm is designed by using the results from Section 3.3. In Section 3.5, the validation experiment is carried out. Finally, Section 4 summarizes the empirical experiment results, proposes the benefits of the results, and suggests future research topics.

1.2. Domestic e-Waste Collection and Purpose of This Study

S&M e-wastes are primarily focused in this study because they are the main items that require attention in efforts to meet the national recycling target. In addition, S&M e-waste is created as a new resource of urban mining, but social loss is easily caused by volume problems. Therefore, today global companies are supporting free recycling services about them (Zoeteman, Bastian, Harold and Jan [14]). Three collection channels are simultaneously operated for proper collection and environment-friendly recycling of S&M e-wastes under the national EPR regulation, as shown in Figure 2 (Korea Electronics Recycling Cooperative [15]). S&M e-wastes are collected in three ways: local government, retailer channel, and FVP service. Local government and retailer channels are performed by consumers directly releasing S&M e-wastes into the collection box, and FVP service is provided upon a collecting request of more than five S&M e-wastes in a household.
As shown in Figure 3, the number of single person households in South Korea has sharply increased with each year (Statistics Korea [16]). In response, the total size and weight of large wastes, such as refrigerators and TVs, are also continuing to increase. These recent characteristics has been changed in Korean society, and wastes are becoming serious issues to consumers who dispose of e-wastes outside of their homes.
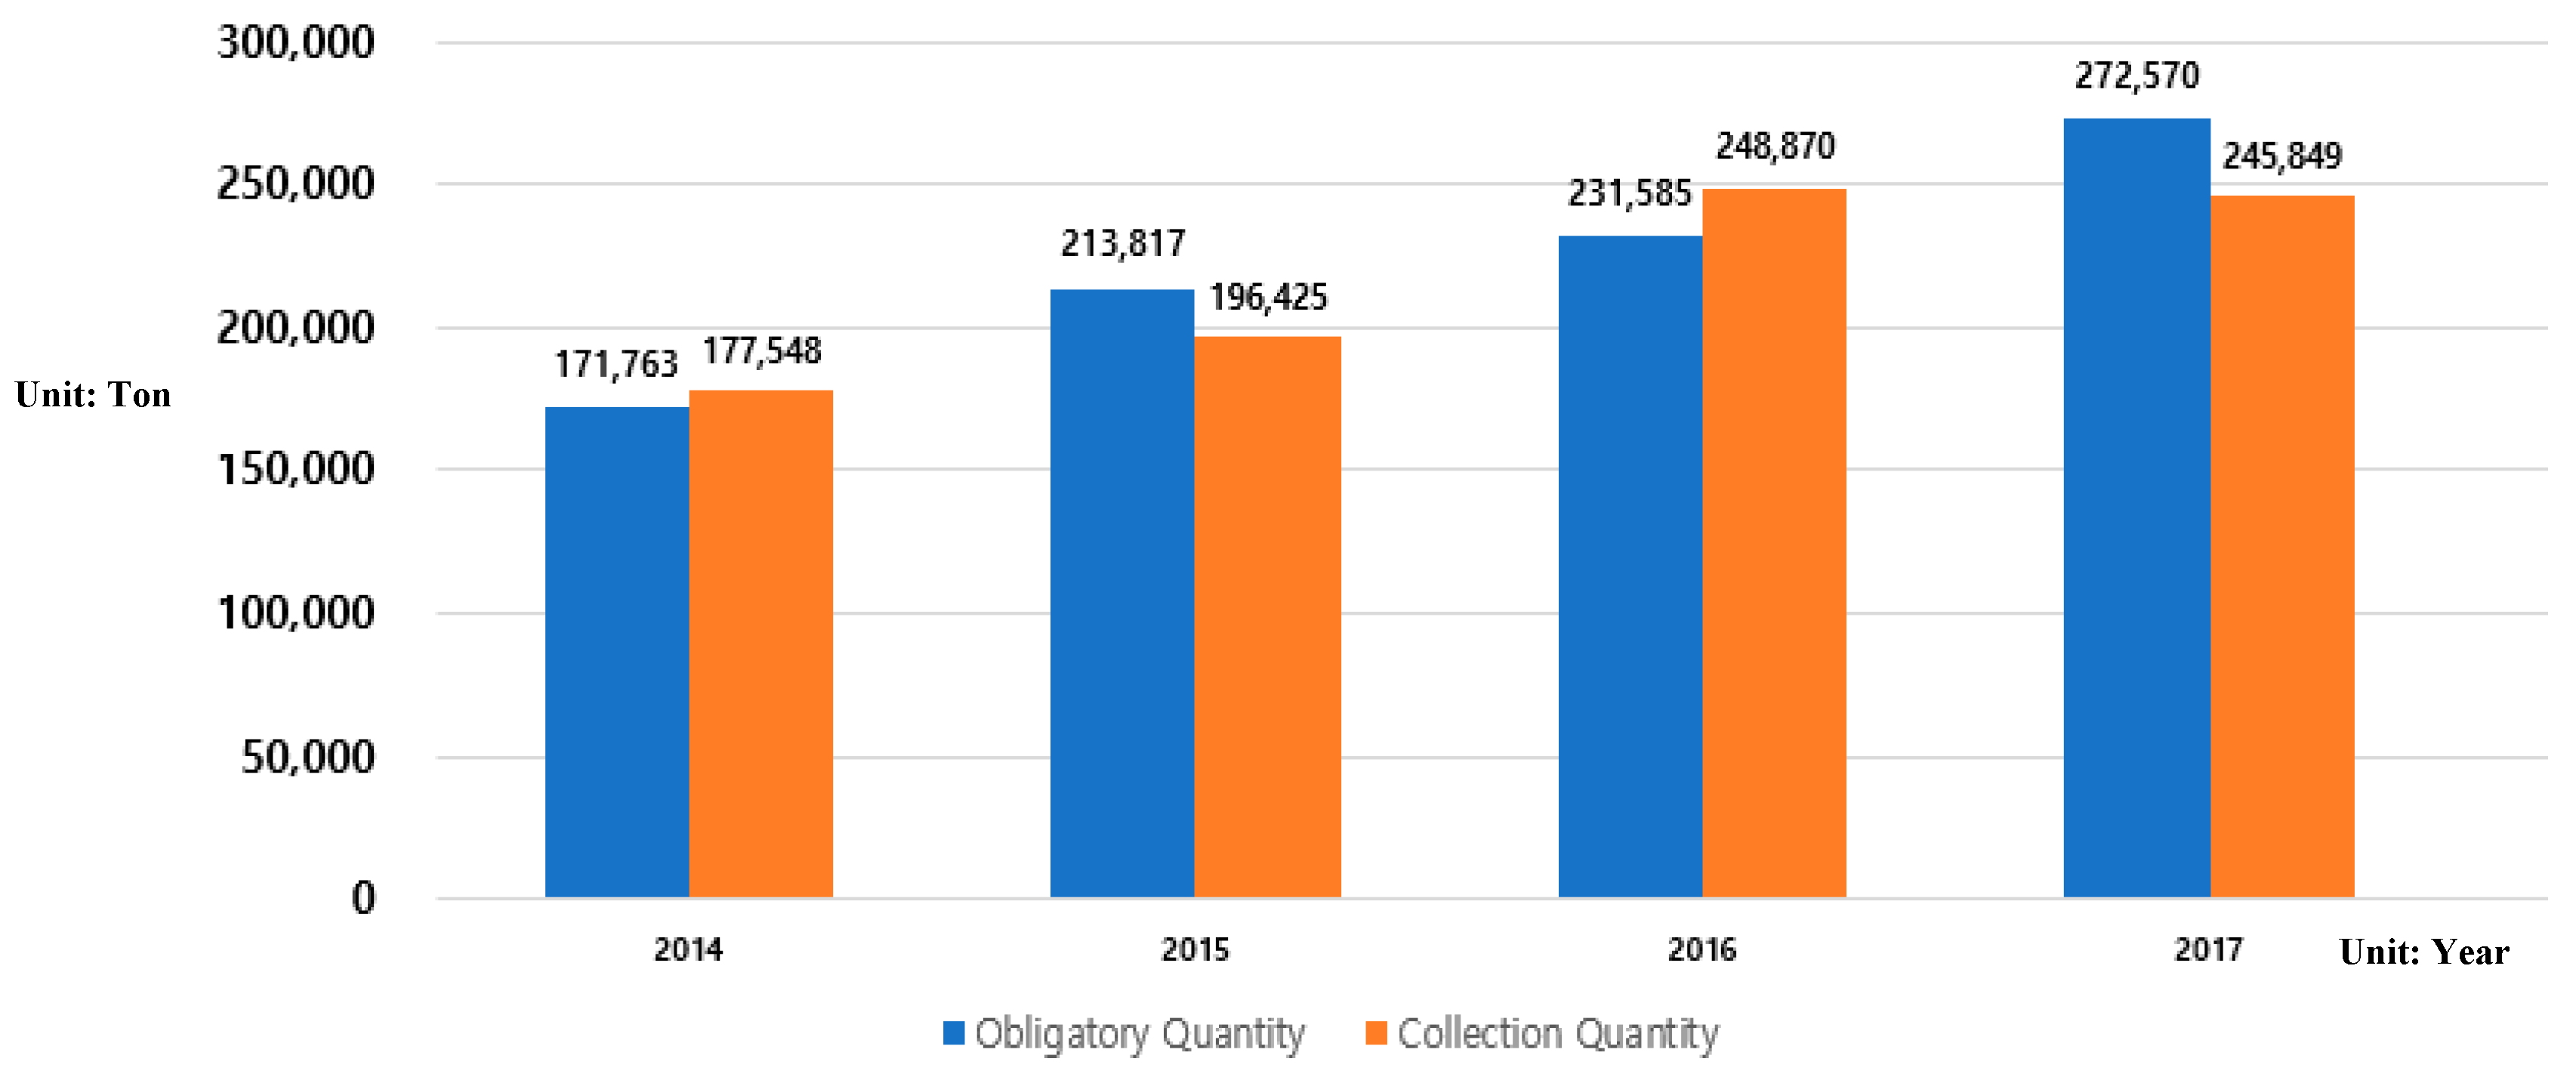
E-wastes disposed of outside of residential quarters are providing chances for unauthorized personnel to illegally obtain them. Furthermore, improper dismantling and recycling of e-wastes are causing several environmental problems. In efforts to solve the problems, the FVP service which is managed by the Korea electronics recycling cooperative (KERC) was introduced to all EPR-regulated manufacturers, importers, and retailers in 2012. Consumers can use the FVP service by making pickup reservations via the Internet or by phone. A designated collection truck will be dispatched to the consumer’s home or office accordingly to collect the disposed e-wastes free of charge. There is no charge from the consumer; therefore, FVP companies generate profits through reprocessing of collected e-wastes (Korea wastes Recycling logistics [17]). The service also receives continued positive consumer responses, and inquiry numbers have therefore increased every year. Although it was originally designed for collecting large-size e-wastes, such as refrigerators, TVs, and washing machines, consumers are now requesting that the FVP service collect S&M e-wastes as well. Shown in Figure 4 is the comparison of the amount of WEEE collection compared to the Korean obligation. Therefore, as the WEEE collection amount exceeds the obligation amount in 2016, the need for collection boxes becomes more important (Kim and Park [18]).
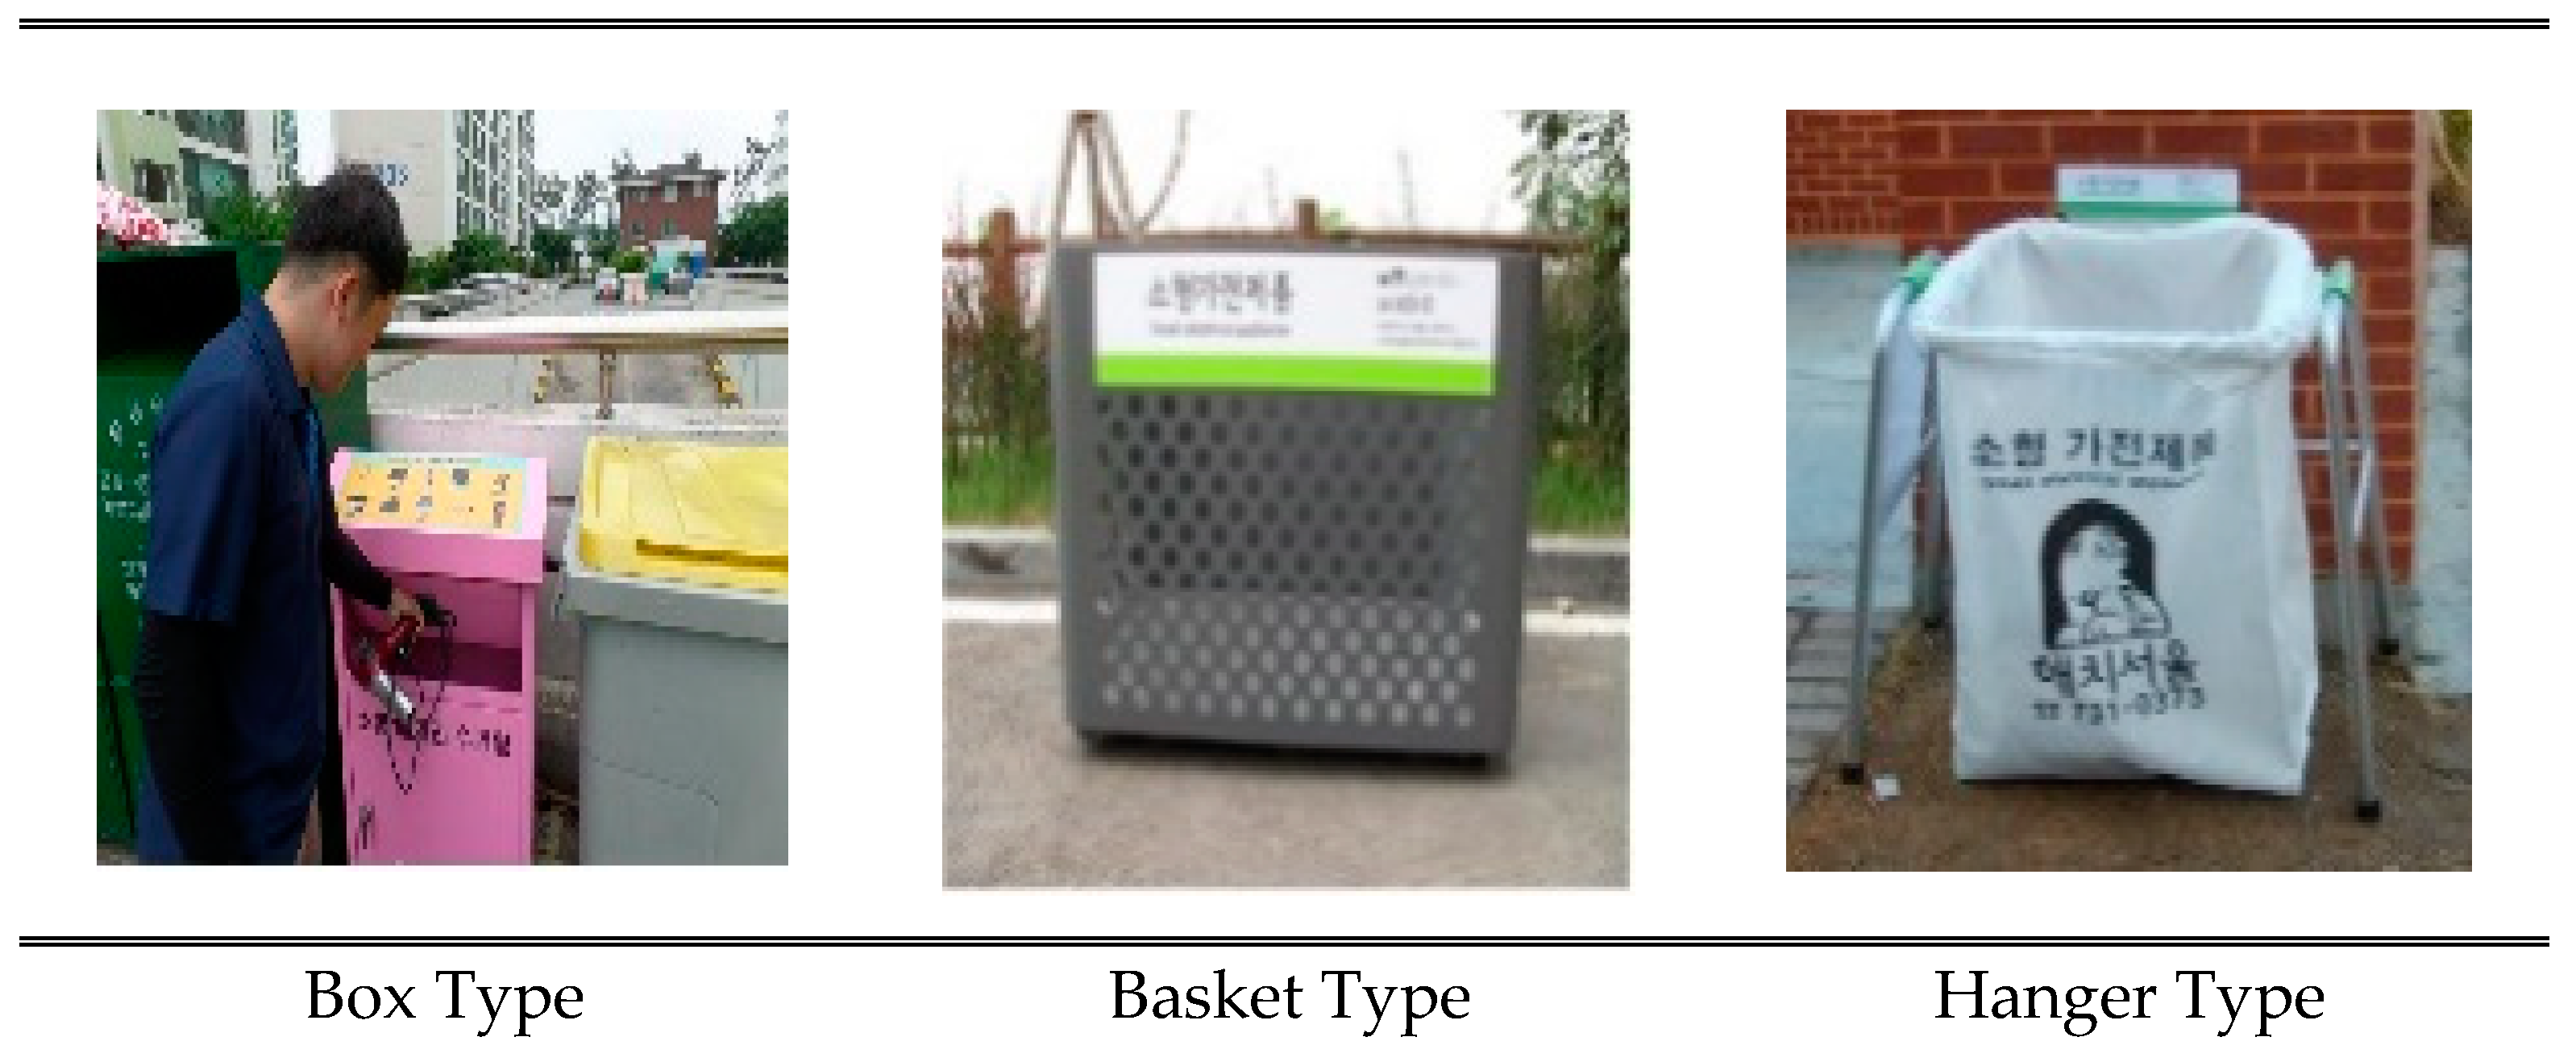
The collection of S&M e-wastes through local government and retailer channels can be initiated by consumers directly visiting proper sites. Figure 5 shows a variety of current collection boxes for S&M e-wastes in South Korea.
However, difficulty in observing the contents inside collection boxes has become an issue for the disposal of S&M e-wastes. Firstly, collections are scheduled only at a fixed time interval. Therefore, it is possible to visit a certain collection box for collection activity, even though there is not a single disposed e-waste inside the container. This act is an inefficient expenditure in the logistics cost. Secondly, reverse logistics activities are not provided when a certain collection box has had more than enough e-wastes disposed. This prevents the lid from closing completely and will lead to e-wastes being found disposed of outside and/or around the collection boxes. Subsequently, it provides a chance for unauthorized personnel to pick up items outside collection areas and to improperly dismantle and dispose of products.
This study identifies the importance of the visibility and quantity of collection box content, which is the primary solution for solving the existing problems. Therefore, sensors were applied inside collection boxes to identify the content situation. Embedded sensors will provide automatic signals when the contents of collection box are in optimal volume for collection activity. The overall purpose of this study is to analyze the operating patterns of collection box sensors and whether they can provide optimal collection signal. Ultimately, embedded sensors can help solve existing collection box problems and can further provide more environment-friendly options when collecting and recycling S&M e-wastes. As a result, algorithms for the number and increasing patterns of sensors at the point of collection could be constructed. The collection box used in this paper is a prototype and only used in the laboratory environment.

2. Sensors Embedded in Collection Box

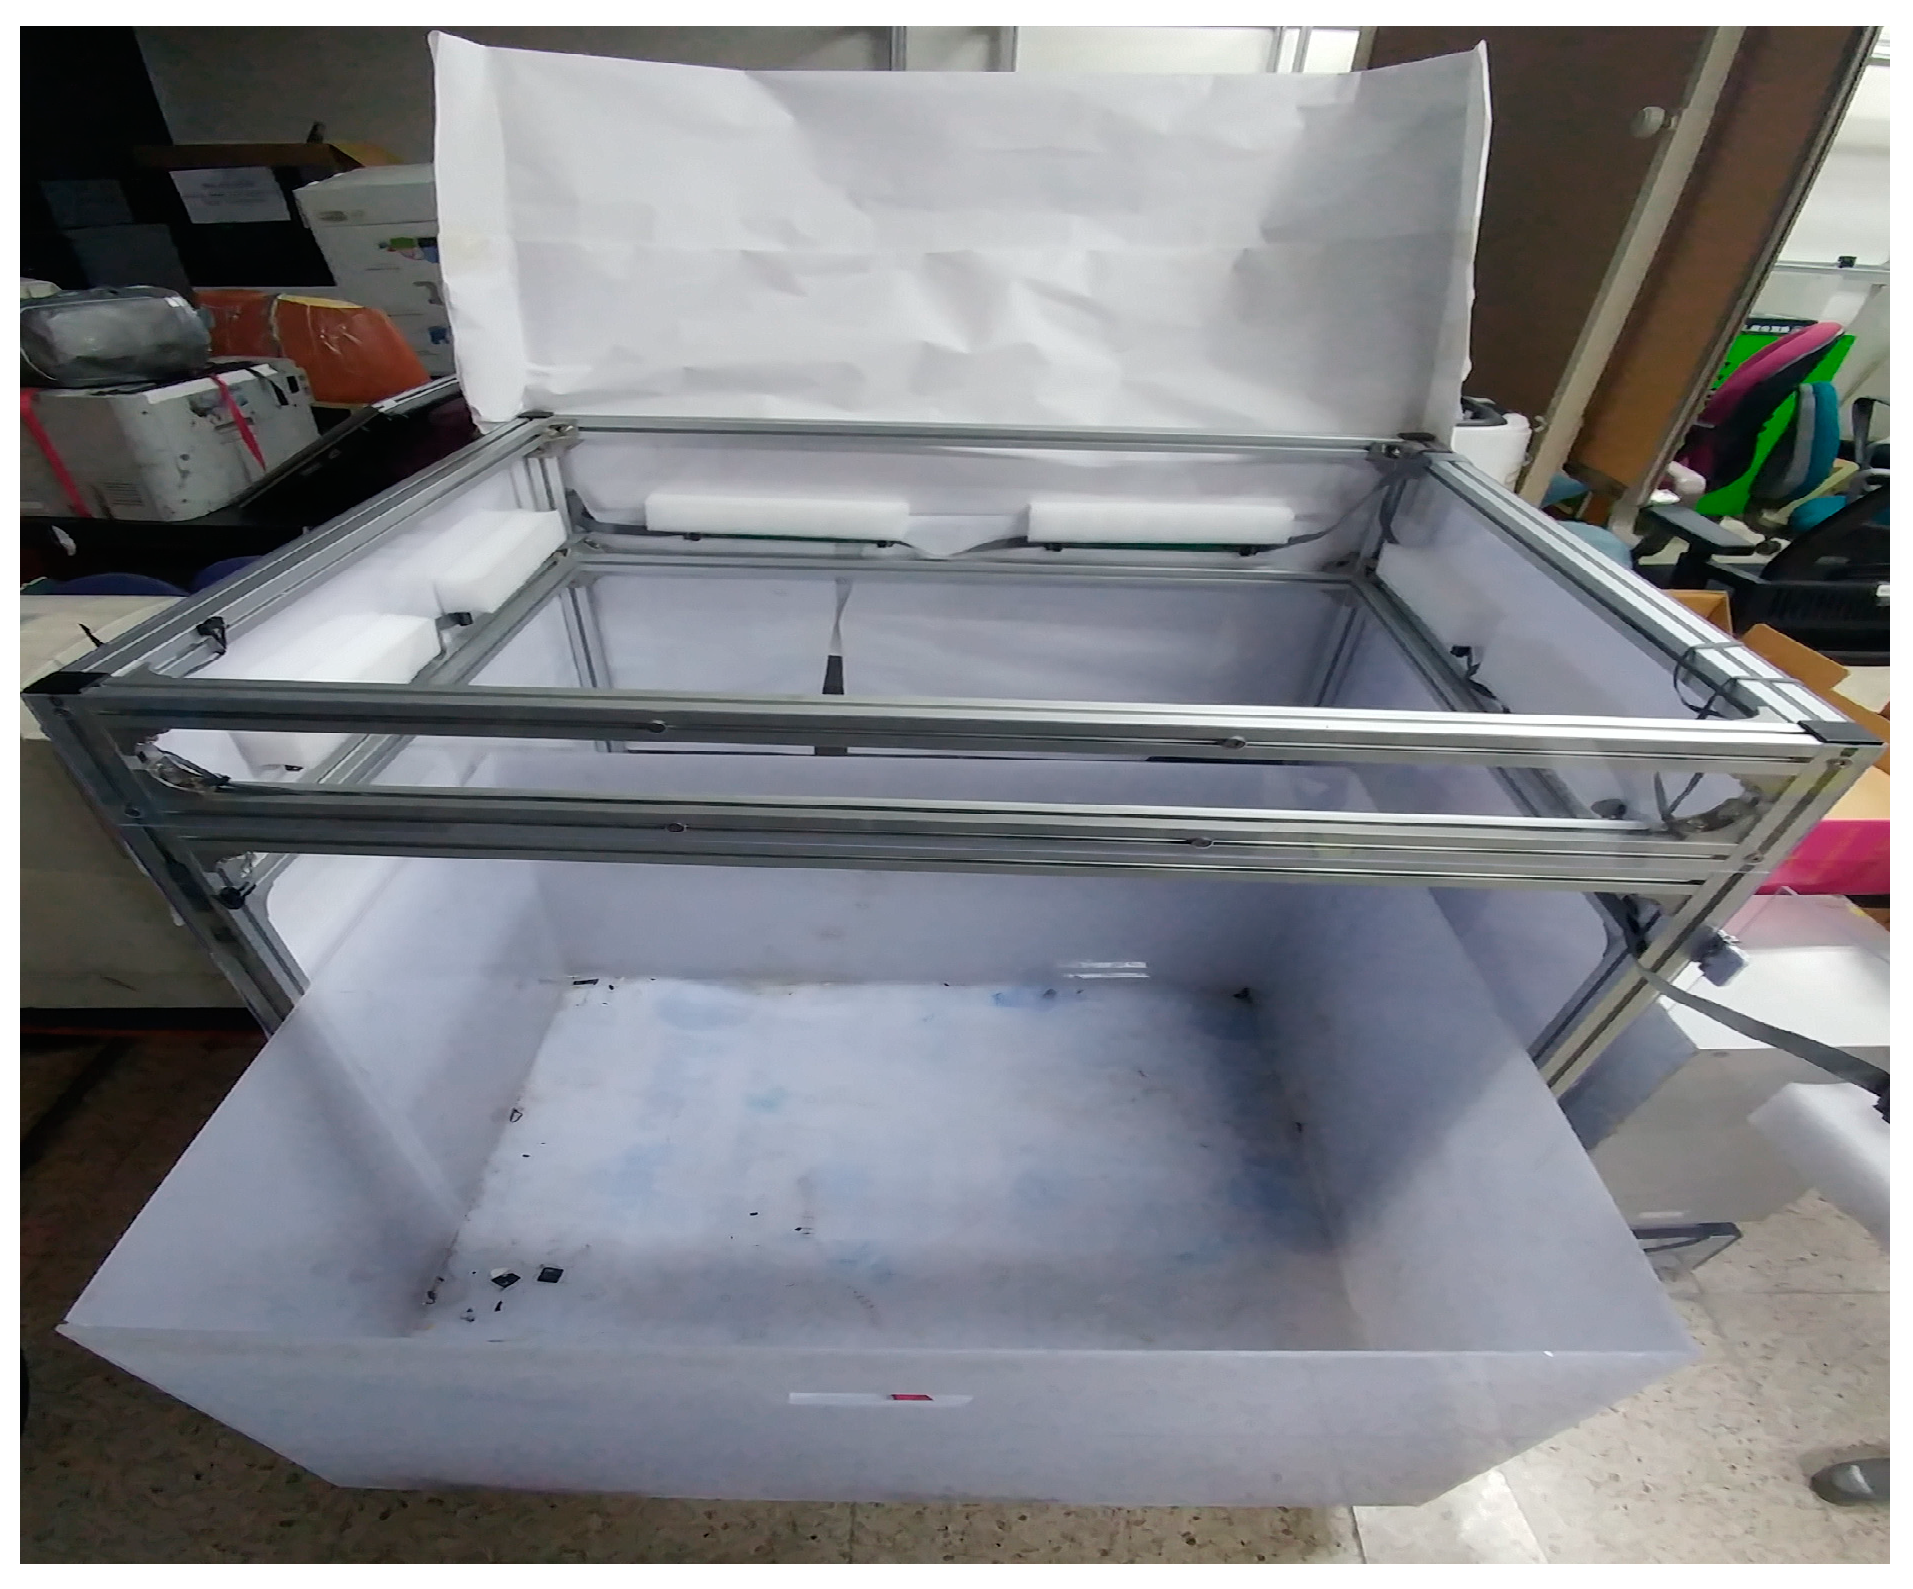
For this study, a collection box was designed to provide the proper collection signal algorithm based on the experiment results. Figure 6 shows a sensor-attached collection box used for experiments. Each sensor is attached to the front, back, and both sides. collection box is made of reinforced plastic because they are used in a variety of applications. It is light and strong in moisture or salt, making them suitable for outdoor installation (Lee and Yoon [19]). We assume that the appropriate volume for collecting disposed e-wastes is when the collection box is approximately 60% full. There are three reasons for this assumption. When the collection box is below 60% full, there is still adequate space for additional disposals. Therefore, it is not logistically cost efficient to collect disposed e-wastes at this time. If the collection box is more than 60% full, there are two chances for problems. The first one is additional disposals of e-wastes causing the lid to not properly close. In that case, e-wastes will usually be disposed of outside or around the collection box. Unfortunately, this will provide the chance for unauthorized personnel to collect and improperly dismantle the disposed items. The second reason is the convenience of collection, when the inside box is withdrawn without blockage from the collection box (see Figure 6).
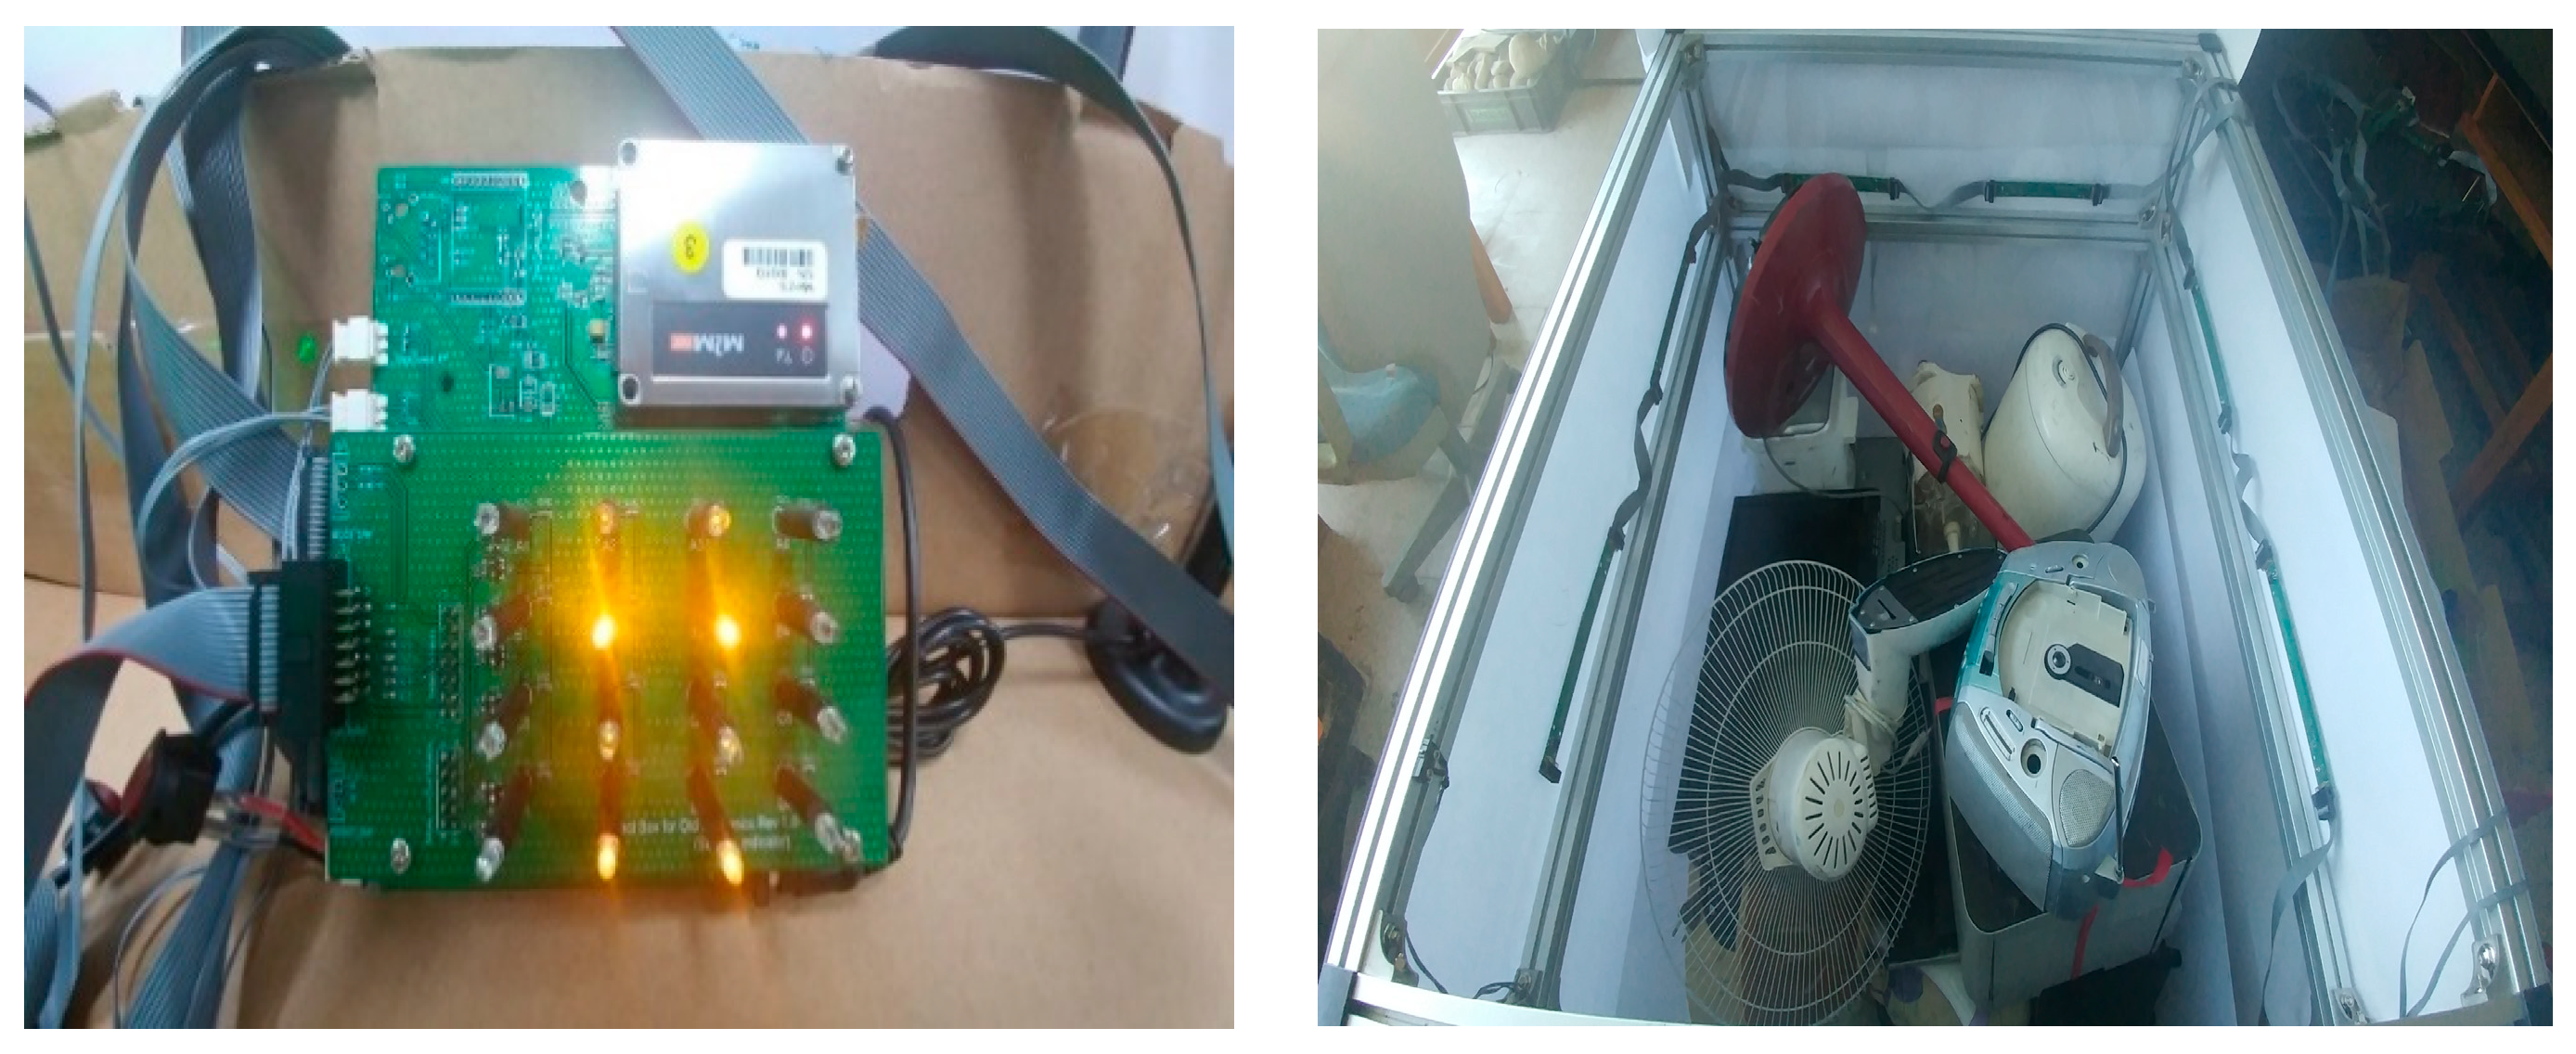
In an effort to have visibility into the collection box, transparent plastics were used for building the experimental collection box. A total of 16 sensors, four each on the four sides, were attached at the same height inside the collection box. The reason for 16 sensors is so that all four sides of the area of the collection box could have the same number of sensors. In addition, sensor technology can be transmitted wirelessly, making it easier to manage (Heo, Lee, and Kim [20]). The location of the sensors specifically determines the 60% full line of the collection box. Each of the 16 sensors operates separately, in that each sensor lights up when it senses an object blocking its immediate surrounding. Figure 7 illustrates how the sensor board displays which sensors are operating according to the contents and their locations within the collection box.

3. Empirical Studies

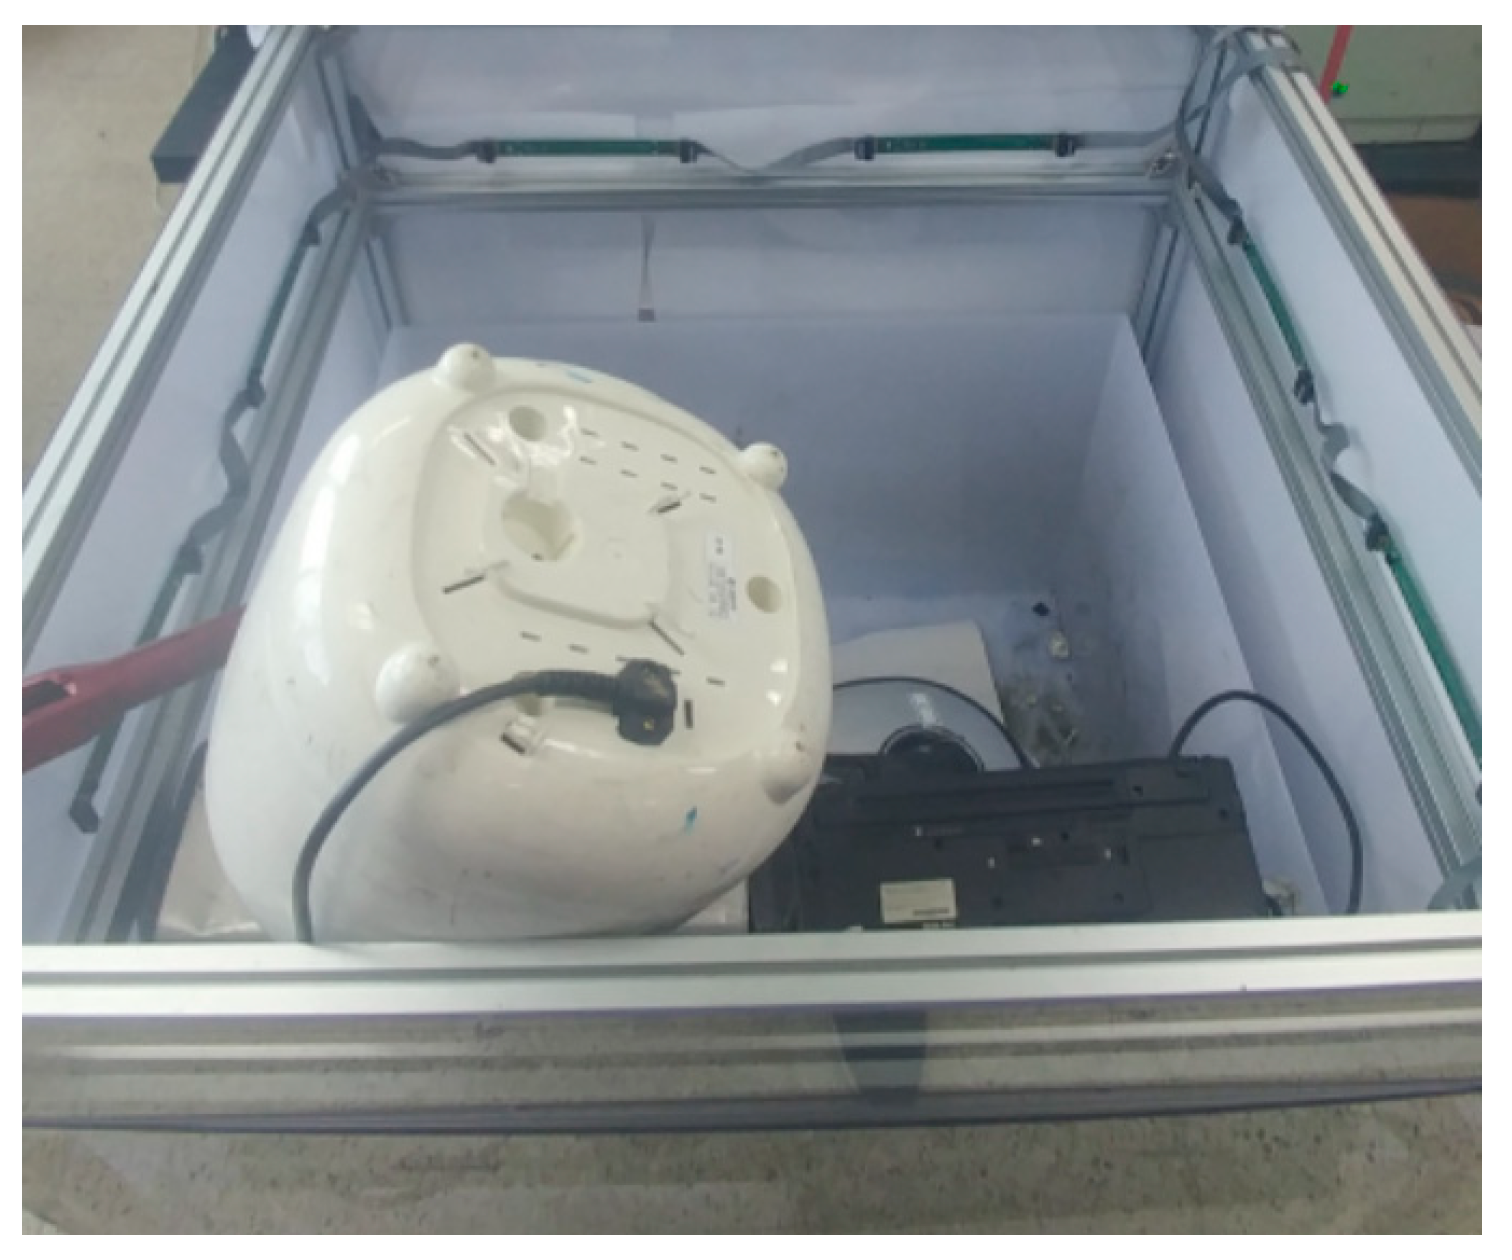
To determine a proper collection schedule for the collection box, the proper threshold volume of the disposed e-wastes in the collection box must be decided. Based on the Delphi method [21] and the focused-group interview [22] applied, the recommended threshold volume to pick up the disposed e-wastes is derived to be approximately 60% of the collection box. In practice, the disposal orders of the e-wastes are completely randomized and make it hard to anticipate the real disposed of quantities in the collection box. Figure 8 shows that it is possible to find a situation in which the sensors are activated, even though the space of the collection box is not full. In Figure 8, the electric rice cooker is piled at the top of other e-waste, the embedded sensor activates to signal that the collection box is full enough. Therefore, activation of some or all of the sensors does not mean the right time for collection. Therefore, it is essential to decide the proper collection signal algorithm based on the number of activating sensors or patterns of activations.

3.1. Experimental Procedure

The sequences of disposal of e-wastes into the collection box are not predictable, so the disposal order is regarded as an uncontrollable variable. In addition, the number of activated sensors and the signal of the unclosed lid are observable, while the actual accumulated volume of disposals in the collection box is not observable and is regarded as the latent variable. Therefore, it is required to analyze the sensor information, such as the total number of and the incremental number of activated signals. To conduct this investigation, first, the stratified sampling method is adopted for selecting the test units according to the ratio of S&M e-wastes disposed of annually. Table 1 shows the annual disposal quantities of S&M e-wastes from the annual report of the KERC.
Due to practical limitations, only 32 test units are selected and actually applied in this study. Table 2 illustrates each volume of test unit.
Next, to reflect the actual situation of disposal by considering the uncontrollable variables, such as the disposed product type and the disposal sequence, completely randomized disposal orders of S&M e-wastes were generated [23,24]. The generated number of groups composed of the randomized disposal order of S&M e-wastes was 20, and each group was tested with 5 trials repeatedly. Each trial with different sequences of disposals was terminated right before the accumulated volume of disposals reached over 70% of the collection box because each disposal has its own discrete and distinguished volume. The event is defined as two cases. The first case is the situation in which the number of activated sensors is changed according to the increment of accumulated volume, and the second is the situation in which the accumulated volume is changed without changing or decreasing the number of activated sensors.

3.2. Experiment Results

Table 3 summarizes the experimental results, such as the number of activated sensors and the accumulated volumes of disposals. The experiment was conducted by the randomly generated orders shown in Table A1 in the Appendix. For example, see trial 1 in group 1. Here, 3 (47%) means 3 sensors were activated at 47% full collection box. The results were recorded as soon as the sensor was first activated and continued until the accumulated volume of disposals was increased to 70% full for experimental reassurance. It was twice observed that the number of activated sensors decreased because the empty space between the disposed of e-wastes at the collection box was reduced. Also, the number of activated sensors was not changed, even though new disposal of e-wastes into the collection box occurred, due to the existence of sufficient empty space in the box. It was also observed that the number of activated sensors of each trial in the same group could be different. The reasons are identified as the empty space between the disposed of e-wastes and the disposal locations in the collection box. It was observed 21 times that the lid of the collection box was not closed properly. Also, the first activation of the sensor was observed at different accumulated volumes of disposals at the collection box in the range (38 to 59%).
A total of 409 events of sensor’s activation with 100 trials (20 groups) were observed through the experiments while new e-wastes were disposed of into the collection box. In other words, each scenario was repeated 5 times due to the randomness of the empty space between e-wastes. Also, a total of 94 trials were observed when more than 2 events occurred in each trial. In addition, the first event with less than 6 activated sensors was counted in 73 trials. With another 6 trials, only one event was observed within a trial. Table 4 summarizes the experimental results with the number of activated sensors and accumulated volume. For example, in the first trial of group 2, three events were recorded with different numbers of activated sensors (accumulated volume of e-waste): 6 (54%), 10 (58%), and 16 (64%). On the other hand, in the first trial of group 3, five events were recorded with results of 1 (38%), 3 (41%), 6 (47%), 8 (54%), and 12 (60%).
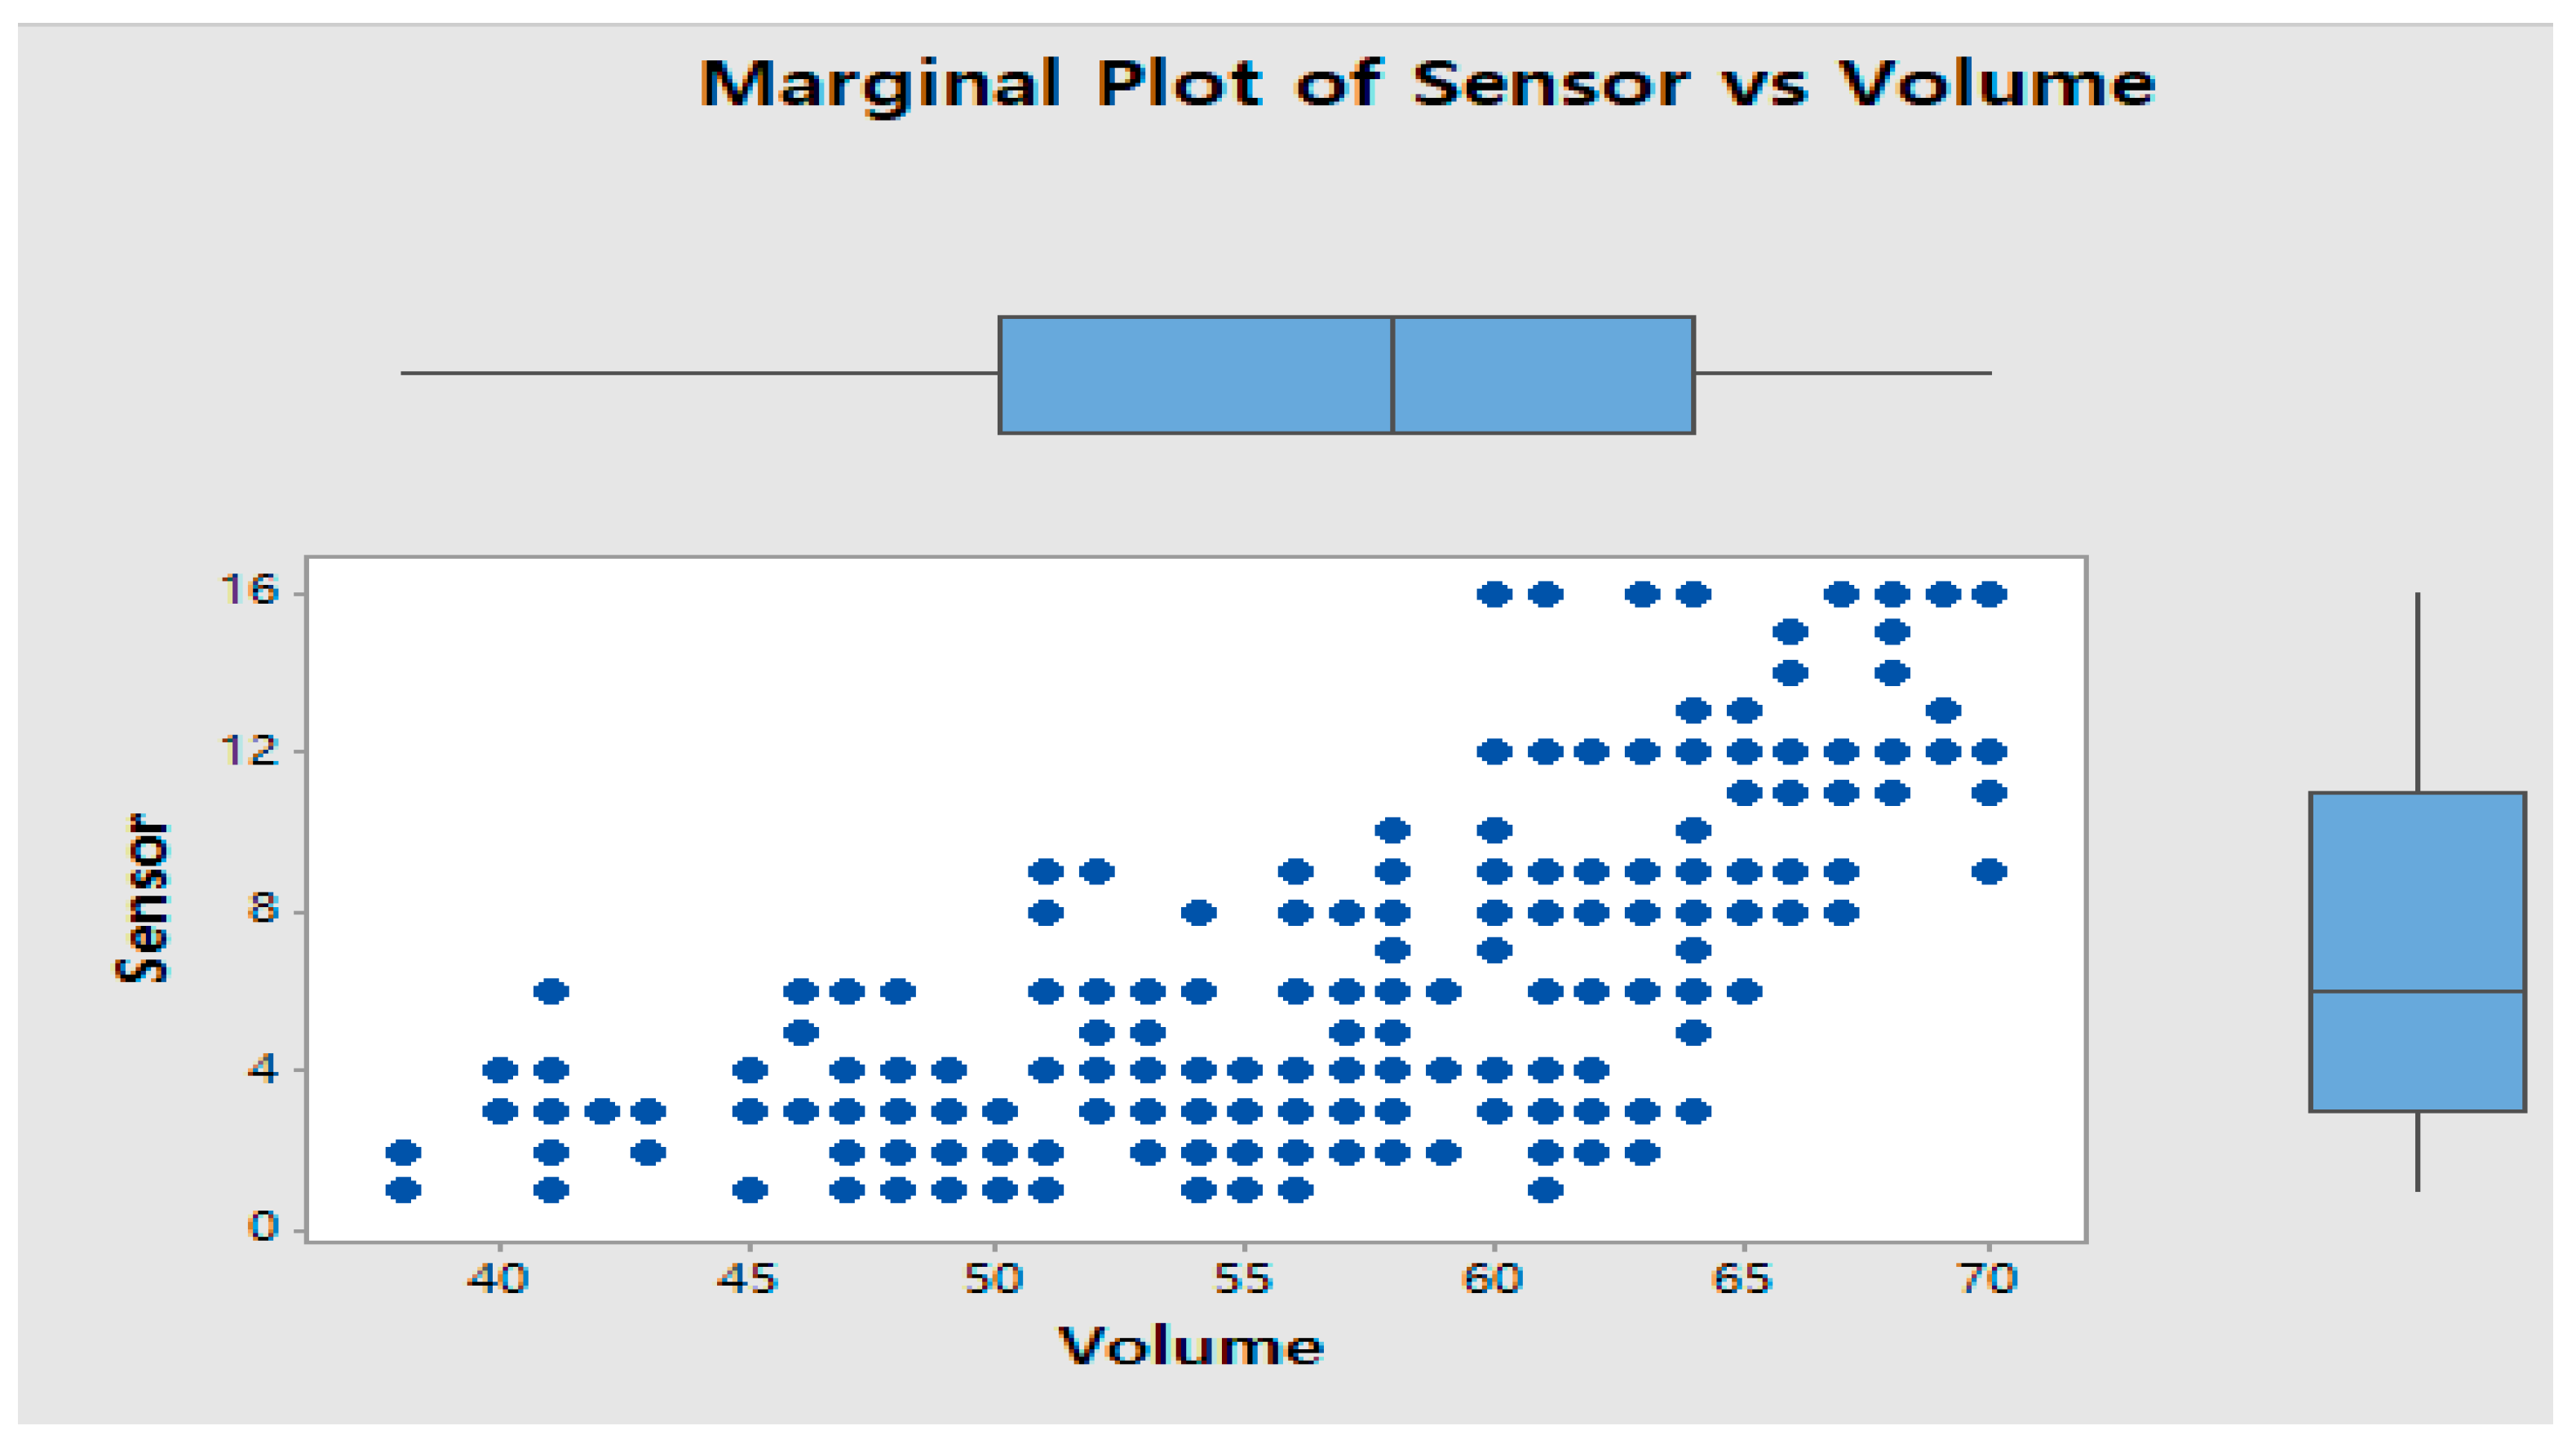
As can be seen from Table 3, for all the 18 events of an unclosed lid of the collection box, it was observed that the accumulated volume of disposals was over 60% full. Therefore, it is statistically identified that collecting the disposed e-wastes from the collection box is efficient whenever an unclosed lid occurs. Next, Figure 9 shows the marginal plot of the number of activated sensors according to the accumulated volume of the disposed e-wastes in order to identify the proper collection algorithm. In the case when the number of activated sensors is more than 11, all other events happened when the accumulated volume was greater than or equal to 60% full.
Among the 164 events when the number of activated sensors was less than 6, a total of 73 events were observed when the accumulated volume was less than 58%. That means that well-balanced disposals into the collection box happened 85.98% (=141/164) of the time. By considering that the disposals of e-wastes into the collection box follow the latent process, the increment of activated number of sensors is very important for developing the collection algorithm.

3.3. Hypothesis Test with ANOVA

For this, we suggest the following hypothesis: In the case where the number of activated sensors is less than 6, the incremental amount of activated number of sensors is greater when the already accumulated volume of the disposed e-wastes was greater than the other case. In order to test this hypothesis, we conducted a one-way analysis of variance (ANOVA) with the two divided cases (more or less than 58% accumulated volume). In this study, ANOVA is adopted to find the proper collection algorithm because the empty space between e-wastes is stochastically generated. As can be seen from Figure 10, the indicator variable 0 means the case where the accumulated volume is less than 58%, while 1 means more than or equal to 58% accumulated volume. It is identified that the incremental amount of the number of activated sensors is strongly different between the above two cases (p-value: 0.000).
By analyzing the results of the above ANOVA, we can argue that our hypothesis is appropriate with p-value 0.000 because extremely small p-values means that the alternative hypothesis is more adequate to explain the experiment results (Kim, Choi and Lee [25]). Table 4 shows the probabilities of type A and B errors with the hypothesis.
Type A error is defined as the situation of disposal collection when the accumulated volume of disposals is less than 60% full. Type B error is defined as the situation of no collection when the accumulated volume of disposals is already over 60% full. Therefore, it can be summarized that incremental amounts of activated sensors more than 4 can minimize type A and B errors simultaneously.

3.4. Collection Signal Algorithm

According to the results of the experiments, we can summarize the proper collection times of disposed e-wastes from the collection box, which are the following situations: when the lid of the collection box is not closed properly, when 11 sensors of the collection box are operated, and when more than 4 sensors are operated additionally after previous sensors are operating. The collection signal algorithm can be summarized as the following Figure 11.
The reason why such algorithms were designed is that, in general, if the covers were not closed, the collection box was often more than 60 percent full in experiments. In most cases, more than 11 sensors were also 60 percent full. Finally, collecting when sensors increased by more than four was a suitable collection point from a statistical point of view.

3.5. Validation Experiment

The experiment was repeated five times with five different groups in order to check the reproducibility of the proposed algorithm. The experimental orders of the five different groups (# 21–#25) are shown in Table 5, while Table 6 summarizes the results that followed. In Table 5, for example, the experiment of group 21 is conducted by the order that the e-waste of ID 11 (for details, see Table 2) is firstly stacked in the collection boxes and then the e-waste of ID 19 is sequentially stacked and so on. In particular, the validation experiment continued all testing even when the cumulative volume of the collection box for disposed S&M e-wastes had reached greater than 70% full. The experiment looked into the ratio between type A and B errors when calculating the collection time signal under the proposed algorithm. Based on a total of 25 experimental results, three cases (group 21, 3rd trial; group 22, 3rd trial; and group 23, 5th trial) were observed as type B error; the total accumulated volume of disposed S&M e-wastes exceeded 70%. Meanwhile, only one case (group 23, 4th trial) was identified as type A error, which is when the total accumulated volume had collected 60% or less.

4. Conclusions

This study treats the reverse logistics focused on the collection signal algorithm development to automatically determine the proper collection time for disposed S&M e-wastes from collection boxes. Currently, disposed S&M e-wastes are regularly collected once a week and collection boxes are usually filled by midweek. As a result, newly disposed e-wastes are found lying outside and around the collection box and become an easy target for illegal recyclers to collect and dismantle them, resulting in several toxic effects on Earth’s environment. A simple two-week visit may solve this problem; however, it can lead to an increase in the company’s logistics and labor costs. In contrast, IoT and sensor technology bring a chance to increase the efficiency of collection and to save the environment. An algorithm which uses the sensor data from the collection box provides quite accurate information for the fulfillment rate of the boxes. The results from the algorithm could be utilized to make a real-time collection schedule or plans. Therefore, a collection signal algorithm is an essential part of using the concept of Industry 4.0.
This study introduces a collection box with sensory technology to help solve the current problems with the way in which S&M e-wastes are being disposed. Sensors are embedded inside the collection box and generate signals whenever a predetermined level of the collection box has been reached with the disposed e-wastes. An experimental approach was applied to develop the collection signal algorithm, which provides analysis results to make a collection schedule. The proposed algorithm would be embedded in the collection boxes with IoT technology. The present study may be extended in the following direction: It is required to develop the collection signal algorithm based on the different data types of sensors. In this paper, the light-emitting sensors were applied due to the total experiment budget. However, there are many different types of sensors such as weight sensors and image sensors. Combining these different types of sensor data could increase the accuracy and the efficiency of the collection activity.

Author Contributions

All of the authors discussed and proposed the statistical method and designed the test plan. S.-I.S. and Y.-S.K. accomplished the computation and wrote the paper; H.-S.K. established the model and performed the validation of the analysis. All authors have read and agreed to the published version of the manuscript.

Funding

This work was supported by the GRRC program of Gyeonggi province. (GRRC KGU 2020-B01, Research on Intelligent Industrial Data Analytics).

Conflicts of Interest

The authors declare no conflict of interest.

Appendix A

Table A1. Experimental order.
GroupAccumulated OrderGroupAccumulated Order
124→21→4→16→15→14→8→22→27→32→31→2→6→29→261131→10→25→19→13→28→6→5→23→22→26→2→29→16→15
213→17→3→23→8→2→28→18→6→1→26→41219→1→17→7→24→18→21→12→29→9→30→25→20→31→14→2→26
324→20→28→4→7→22→25→15→30→29→12→23→3→26→181322→18→8→27→10→15→20→29→ 31→9→23→28→24→26→3→12
410→2→1→31→11→19→20→32→22→21→4→30→8→27→26→16→14→6→121412→1→7→8→17→31→9→28→25→5→30→21→14→19→22→24→26→20→23→32
519→31→8→11→13→29→21→26→ 12→5→17→16→1→28→4→25→15→10→271526→24→21→13→7→29→4→20→9→16→28→12→2→6→3
628→22→25→32→11→3→20→18→ 17→10→5→16→12→24→13→15→8→231613→27→29→9→2→31→30→21→18→4→17→1→14→15→10→5
716→13→28→20→19→26→18→22→1→21→25→5→24→7→2→9→141711→15→7→3→28→6→17→4→29→9→20→19→32→27→5→30→31
821→32→5→6→23→30→18→8→22→25→2→20→12→41815→1→18→23→7→24→3→17→25→22→26→4→10→8
932→25→6→5→12→26→20→28→22→30→15→1→7→18191→12→31→14→11→28→27→17→ 16→4→26→19→8→9→29→5→25→20→18
101→26→14→9→23→15→28→7→5→13→32→27→30→12→82012→31→7→20→11→22→8→4→1→30→15→24→2→3→5→27→32→29

References

  1. Dias, P.; Machado, A.; Huda, N.; Bernardes, A.M. Waste electric and electronic equipment (WEEE) management: A study on the Brazilian recycling routes. J. Clean. Prod. 2018, 174, 7–16. [Google Scholar] [CrossRef]
  2. Aguirre M, Á.; Hidalgo, M.; Canals, A.; Nóbrega, J.A.; Pereira-Filho, E.R. Analysis of waste electrical and electronic equipment (WEEE) using laser induced breakdown spectroscopy (LIBS) and multivariate analysis. Talanta 2013, 117, 419–424. [Google Scholar] [CrossRef] [PubMed] [Green Version]
  3. Ongondo, F.O.; Williams, I.D.; Cherrett, T.J. How are WEEE doing? A global review of the management of electrical and electronic wastes. Waste Manag. 2011, 31, 2553–2558. [Google Scholar] [CrossRef] [PubMed]
  4. Salhofer, S.; Steuer, B.; Ramusch, R.; Beigl, P. WEEE management in Europe and China–a comparison. Waste Manag. 2016, 57, 27–35. [Google Scholar] [CrossRef] [PubMed]
  5. Yoshida, A.; Terazono, A.; Ballesteros, F.C., Jr.; Nguyen, D.Q.; Sukandar, S.; Kojima, M.; Sakata, S. E-waste recycling processes in Indonesia, the Philippines, and Vietnam: A case study of cathode ray tube TVs and monitors. Resour. Conserv. Recycl. 2016, 106, 48–58. [Google Scholar] [CrossRef]
  6. Min, D.K. A Study on the Evaluation and Improvement of EPR (Extended Producer Responsibility) System. Korea Soc. Environ. Adm. 2006, 12, 11–17. [Google Scholar]
  7. Samsung Global Environment Research Center. Improvement of Extended Producer Responsibility; Samsung Global Environment Research Center: Hwaseong, Korea, 2004; pp. 53–70. [Google Scholar]
  8. Sousa, R.; Agante, E.; Cerejeira, J.; Portela, M. EEE fees and the WEEE system–A model of efficiency and income in European countries. Waste Manag. 2018, 79, 770–780. [Google Scholar] [CrossRef] [PubMed] [Green Version]
  9. Jeong, H. A Study on facilitating the EPR (Extended Producer Responsibility) in the EU Plastic Packaging Waste. J. Contemp. Eur. Stud. 2018, 36, 225–252. [Google Scholar]
  10. Korea Ministry of Environment. Enforcement Decree of the Act on Resource Circulation of Electrical and Electronic Equipment and Vehicles; Korea Ministry of Environment: Sejong, Korea, 2014; Available online: http://www.me.go.kr (accessed on 10 November 2019).
  11. Kim, H.; Lee, H.J. Quality improvement of FVP (free visit and pick-up) Services for Reverse Logistics of End-of-Life Consumer Electronics. Inf. Int. Interdiscip. J. 2012, 15, 6287–6296. [Google Scholar]
  12. Kim, Y.; Kim, H. The Study on the Efficiency of FVP (Free-Visit-Pickup) Service by changing Conditions. Korea Logist. Soc. 2018, 26, 77–90. [Google Scholar]
  13. Kim, H.; Park, K. Greenhouse Gas Emission Reduction on Collection Logistics of End-of-life Consumer Electronics Considering Environmental Information. Icic Express Lett. Part. B Appl. 2018, 9, 599–605. [Google Scholar]
  14. Zoeteman, B.C.; Krikke, H.R.; Venselaar, J. Handling WEEE waste flows: On the effectiveness of producer responsibility in a globalizing world. Int. J. Adv. Manuf. Technol. 2010, 47, 415–436. [Google Scholar] [CrossRef] [Green Version]
  15. Korea Electronics Recycling Cooperative. 2017. Available online: http://www.k-erc.or.kr/ (accessed on 10 November 2019).
  16. Statistics Korea. 2015. Available online: http://kostat.go.kr/portal/eng/index.action (accessed on 10 November 2019).
  17. Korea CEs Recycling Logistics. 2017. Available online: http://www.rcl.kr/ (accessed on 10 November 2019).
  18. Kim, H.; Park, K. Estimation of Disposal Trend of End-of-Life Consumer Electronics Considering Environmental Factors. In Proceedings of the 13th International Conference on Innovative Computing, Information and Control, Lianyungang, China, 20–23 August 2018; p. 10. [Google Scholar]
  19. Lee, J.; Yoon, J. A study on the Affordance factor for improvement of usability in recycling waste bin. Arch. Des. Res. 2008, 8, 219–228. [Google Scholar]
  20. Heo, G.; Lee, W.; Kim, M. Structural Health Monitoring System Employing Smart Sensor Technology Part 1: Development and Performance Test of Smart Sensor. J. Korea Inst. Struct. Maint. Insp. 2007, 11, 134–144. [Google Scholar]
  21. Dalkey, N.; Helmer, O. An experimental application of the Delphi method to the use of experts. Manag. Sci. 1963, 9, 458–467. [Google Scholar] [CrossRef]
  22. Frey, J.H.; Fontana, A. The group interview in social research. Soc. Sci. J. 1991, 28, 175–187. [Google Scholar] [CrossRef]
  23. Hogg, R.V.; Craig, A.T. Introduction to Mathematical Statistics; Pearson: Englewood Hills, NJ, USA, 1995. [Google Scholar]
  24. Montgomery, D.C. Design and Analysis of Experiments; John Wiley & Sons: Hoboken, NJ, USA, 2017. [Google Scholar]
  25. Kim, T.; Choi, M.; Lee, H. P-value and Reduction to Absurdity. Quant. Bio-Sci. 2017, 36, 1–6. [Google Scholar]
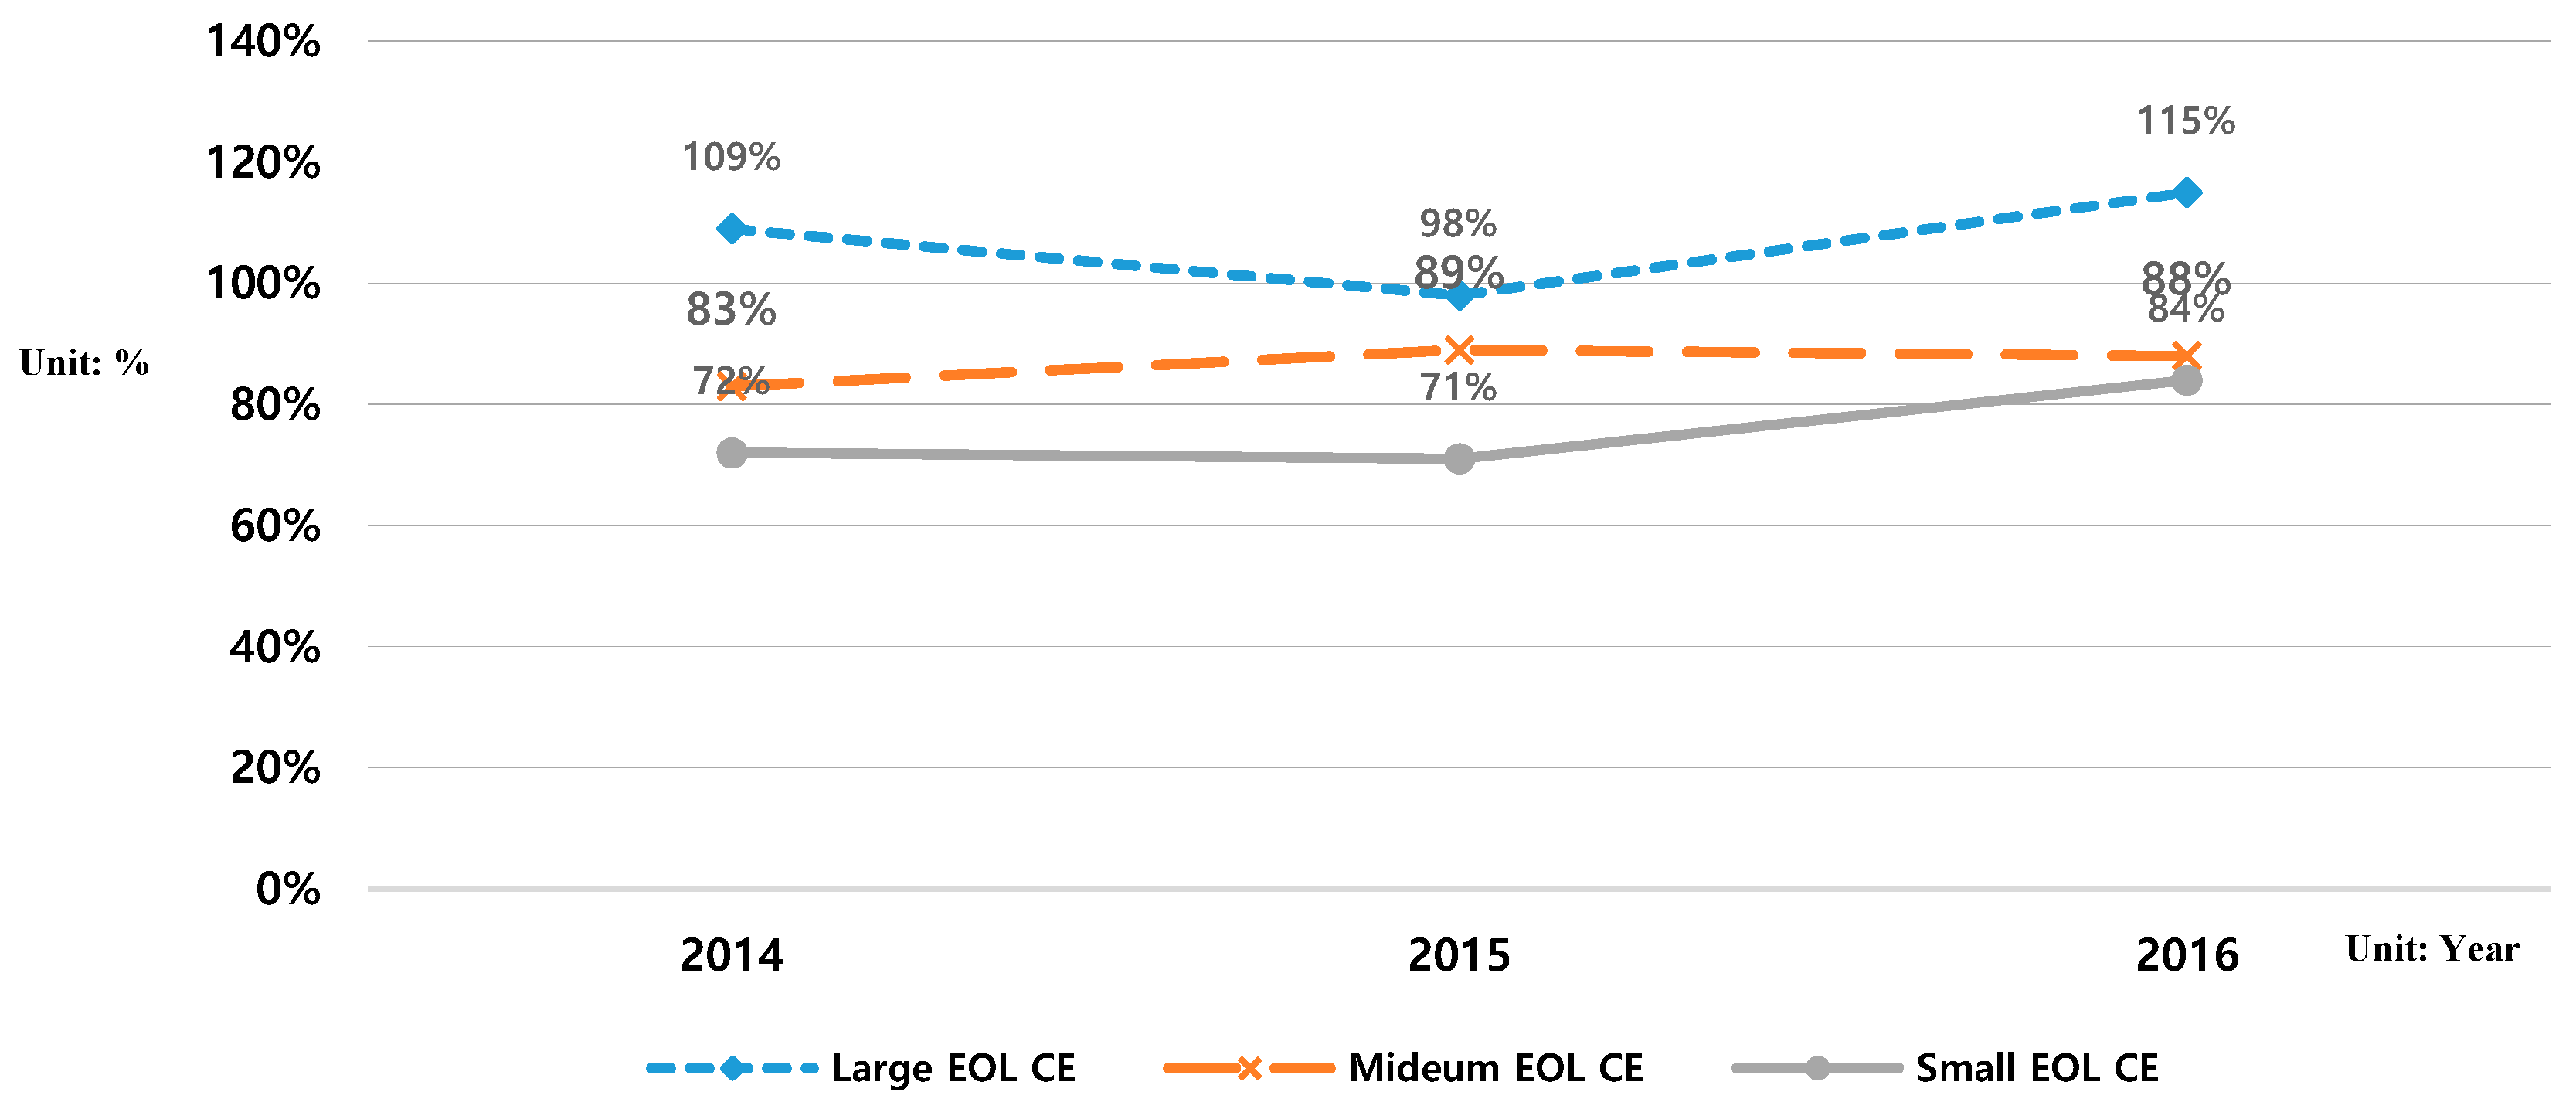
Figure 1. Ratio of domestic recycling levels against domestic targets levels.
Applsci 10 05016 g001
Figure 2. Domestic collection channels.
Applsci 10 05016 g002
Figure 3. Trend of single-person households in South Korea.
Applsci 10 05016 g003
Figure 4. Collection volume by the free visit and pickup (FVP).
Applsci 10 05016 g004
Figure 5. Collection boxes in South Korea.
Applsci 10 05016 g005
Figure 6. Structure of experimental collection box.
Applsci 10 05016 g006
Figure 7. Sensor board figure according to the inside contents of the collection box.
Applsci 10 05016 g007
Figure 8. Biased stacking case.
Applsci 10 05016 g008
Figure 9. Marginal plot of the activated number of sensors vs. cumulative volume.
Applsci 10 05016 g009
Figure 10. ANOVA results.
Applsci 10 05016 g010
Figure 11. Collection signal algorithm.
Applsci 10 05016 g011
Table 1. Annual disposed quantities of small and medium (S&M) e-wastes.
Year14151617TotalRatio (%)
Computer (including Video player and Cassette)7,448,292.16,116,630.38,673,632.96,956,572.529,195,12832.2
Electric fan (including Humidifier)2,826,085.46,567,948.48,016,177.55,619,750.423,029,96225.2
Printer2,020,621.42,398,688.12,785,188.92,424,168.49,628,666.710.4
Copy machine1,249,540.62,401,901.83,614,162.32,164,052.79,429,657.310.2
Vacuum cleaner 1,413,397.71,674,767.61,929,575.51,136,867.66,154,608.56.7
Electric rice cooker317,669.731,188,752.61,286,596.5726,585.753,519,604.63.8
Audio656,131.17,333,13.55897,869.5277,829.492,565,143.62.8
Microwave500,852.5490,693.06666,786.36226,604.691,884,936.62.1
Dish dryer170,489.68225,619.66353,334.38391,020.61,140,464.31.2
Electric bidet117,841.21245,677.76323,774.6337,259.511,024,553.11.1
Electric oven180,893.39229,145.88275,871.51206,647892,557.781.0
Air purifier132,998.57156,827.96227,499.27294,756.42812,082.220.9
Mobile phone384,208.84234,663.670,060.5211,223.4700,156.360.8
Electric purifier145,651.64143,979187,227.4261,235.74538,093.80.6
Facsimile90,205.8365,780.4898,828.6943,214.24298,029.240.3
Blender69,112.1180,017.7483,965.4453,019.2286,114.490.3
Food waste disposals33,038.4631,648.439,889.0329,836.35134,412.240.2
Water softener16,410.7111,950.1224,350.4850,385.86103,097.170.1
Electric iron16,760.424,144.4825,871.8428,710.9695,487.680.1
Table 2. Selected test units for completely randomized experiment.
IDProduct TypeVolume (m3)IDProduct TypeVolume (m3)
1Electric fan0.02917Mini Cassette0.012
2Vacuum cleaner (1)0.06718Vacuum cleaner (2)0.064
3Electric heater0.04419Steam iron0.013
4Monitor (LCD)0.02920Electric oven0.016
5Electric rice cooker (1)0.02521Video player0.019
6Monitor (CRT)0.07022Laptop0.004
7Microwave0.03523Dishwasher0.040
8Electric rice cooker (2)0.02424Keyboard0.003
9Mini refrigerator0.03025Speaker0.041
10Toast machine0.00726Wall fan0.041
11Electric iron0.00427Humidifier (1)0.018
12Cassette0.02228Juice extractor0.021
13Desktop computer0.01529Frying machine0.024
14Printer0.02630Mini frying machine (1)0.007
15Fax Printer (HP)0.07031Mini frying machine (2)0.014
16Blender0.01632Humidifier (2)0.024
Table 3. Experimental results: number of activated sensors (accumulated volume).
GroupTrialResultGroupTrialResult
113 (47%), 3 (58%), 12 (61%), 12 (67%)1111 (54%), 4 (57%), 4 (60%), 9 (70%)
23 (47%), 5 (58%), 9 (61%), 16 (67%)23 (54%), 3 (57%), 10 (60%), 9 (70%)
36 (61%), 12 (67%)33 (54%), 6 (57%), 9 (60%), 16 (70%)
43 (47%), 6 (58%), 9 (61%), 16 (67%)412 (70%)
52 (47%), 2 (58%), 6 (61%), 12 (67%)519 (70%)
216 (54%), 10 (58%), 16 (64%)1211 (47%), 3 (49%), 6 (53%), 9 (60%), 12 (70%)
23 (43%), 3 (54%), 9 (58%), 9 (64%), 12 (68%)22 (47%), 3 (49%), 3 (53%), 10 (60%), 16 (70%)
38 (58%), 16 (64%)31 (47%), 4 (49%), 6 (53%), 16 (60%)
43 (43%), 3 (54%), 8 (58%), 12 (64%), 16 (68%)41 (47%), 3 (49%), 6 (53%), 12 (60%), 12 (70%)
52 (43%), 2 (54%), 6 (58%), 12 (64%), 16 (68%)53 (47%), 3 (49%), 6 (53%), 12 (60%), 12 (70%)
311 (38%), 3 (41%), 6 (47%), 8 (54%), 12 (60%)1311 (50%), 2 (56%), 6 (64%), 12 (66%)
22 (38%), 4 (41%), 4 (47%), 4 (54%), 8 (60%), 12 (69%)21 (56%), 5 (64%), 9 (66%)
31 (38%), 4 (41%), 4 (47%), 6 (54%), 12 (60%), 12 (69%)31 (50%), 2 (56%), 6 (64%), 15 (66%)
42 (38%), 4 (41%), 4 (47%), 6 (54%), 8 (60%), 16 (69%)41 (56%), 6 (64%), 12 (66%)
51 (38%), 3 (41%), 6 (47%), 8 (54%), 12 (60%), 12 (69%)51 (56%), 6 (64%), 12 (66%)
413 (48%), 3 (50%), 6 (54%), 8 (64%), 11 (67%)1416 (63%), 12 (67%)
23 (48%), 3 (50%), 6 (54%), 8 (64%), 12 (67%)21 (49%), 2 (55%), 4 (57%), 8 (63%), 16 (67%)
39 (64%), 12 (67%)36 (63%), 12 (67%)
42 (48%), 2 (50%), 6 (54%), 8 (64%), 12 (67%)41 (49%), 2 (55%), 2 (57%), 6 (63%), 8 (67%)
53 (48%), 3 (50%), 3 (54%), 16 (64%, uncovered)51 (49%), 3 (55%), 5 (57%), 9 (63%), 16 (67%)
513 (42%), 6 (46%), 9 (52%), 12 (63%, uncovered)1512 (41%), 4 (51%), 9 (61%, uncovered)
23 (42%), 6 (46%), 9 (52%), 12 (63%, uncovered)22 (41%), 4 (51%), 9 (61%, uncovered)
33 (42%), 6 (46%), 9 (52%), 12 (63%, uncovered)31 (41%), 2 (51%), 6 (61%, uncovered)
43 (42%), 3 (46%), 6 (52%), 12 (63%, uncovered)41 (41%), 2 (51%), 6 (61%, uncovered)
53 (42%), 6 (46%), 9 (52%), 12 (63%, uncovered)51 (41%), 1 (51%), 6 (61%, uncovered)
613 (45%), 6 (48%), 9 (58%), 9 (62%), 16 (68%)16112 (64%, uncovered)
23 (45%), 3 (48%), 6 (58%), 12 (62%), 16 (68%)29 (64%, uncovered)
31 (45%), 3 (48%), 6 (58%), 12 (62%), 12 (68%)31 (47%), 3 (49%), 4 (53%), 8 (64%, uncovered)
44 (45%), 6 (48%), 4 (58%), 12 (62%), 12 (68%)413 (64%, uncovered)
54 (45%), 6 (48%), 9 (58%), 9 (62%), 12 (68%)59 (64%, uncovered)
713 (45%), 6 (46%), 9 (51%), 12 (61%), 12 (66%)1712 (61%), 6 (65%), 12 (66%), 14 (68%)
23 (45%), 3 (46%), 6 (51%), 8 (61%), 11 (66%), 16 (70%)22 (61%), 6 (65%), 8 (66%), 12 (68%)
34 (45%), 5 (46%), 8 (51%), 8 (61%), 15 (66%)32 (59%), 4 (61%), 9 (65%), 9 (66%), 12 (68%)
48 (61%), 12 (66%), 16 (70%)41 (61%), 6 (65%), 14 (66%), 15 (68%)
53 (45%), 3 (46%), 6 (51%), 8 (61%), 12 (66%), 16 (70%)52 (59%), 3 (61%), 8 (65%), 12 (66%), 16 (68%)
819 (64%), 16 (68%)1813 (62%), 6 (63%), 12 (67%)
27 (64%), 11 (68%)21 (51%), 2 (57%), 6 (62%), 6 (63%), 9 (67%)
38 (64%), 12 (68%)33 (63%), 12 (67%)
46 (64%), 12 (68%)42 (62%), 2 (63%), 9 (67%)
53 (60%), 3 (64%), 12 (68%)53 (62%), 6 (63%), 12 (67%)
913 (40%), 3 (41%), 6 (51%), 9 (56%), 12 (61%)1913 (48%), 5 (52%), 8 (58%), 9 (61%), 12 (70%)
24 (40%), 6 (41%), 9 (51%), 9 (56%), 12 (61%)23 (48%), 3 (52%), 6 (58%), 9 (61%), 16 (70%)
34 (40%), 6 (41%), 9 (51%), 9 (56%), 9 (61%)32 (48%), 4 (52%), 6 (58%), 8 (61%), 12 (70%)
43 (40%), 3 (41%), 6 (51%), 9 (56%), 9 (61%)42 (48%), 4 (52%), 7 (58%), 12 (61%), 16 (70%)
54 (40%), 6 (41%), 9 (51%), 9 (56%), 16 (61%)56 (61%), 11 (70%)
1011 (48%), 2 (50%), 5 (53%), 8 (56%), 8 (57%), 16 (60%)2011 (55%), 2 (59%), 4 (62%), 9 (65%), 12 (69%)
21 (48%), 1 (50%), 2 (53%), 2 (56%), 6 (57%), 7 (60%), 10 (64%)23 (49%), 1 (55%), 2 (59%), 4 (62%), 9 (65%), 12 (69%)
31 (48%), 1 (50%), 2 (53%), 3 (56%), 6 (57%), 12 (6%), 12 (64%)38 (62%), 11 (65%), 16 (69%)
41 (48%), 1 (50%), 2 (53%), 6 (56%), 8 (57%), 12 (60%, uncovered)43 (49%), 4 (55%), 4 (59%), 8 (62%), 13 (65%), 13 (69%)
51 (50%), 2 (53%), 4 (56%), 4 (57%), 9 (60%, uncovered) 52 (49%), 3 (55%), 6 (59%), 9 (62%), 12 (65%), 12 (69%)
Table 4. Probabilities of type A and B errors.
Increment (i)Type A ErrorType B Error
110.000.53
100.000.53
90.000.52
80.000.51
70.000.49
60.020.45
50.030.41
40.060.29
30.280.21
Table 5. Reproduction experimental order.
GroupAccumulated OrderGroupAccumulated Order
2111→19→24→28→26→16→18→6→13→21→9→32→15→2→142430→20→15→24→17→31→12→3→23→32→1→8→19→21→6→26→16
229→28→13→1→16→18→25→19→11→2→30→12→17→5→10→3→42530→2→27→21→20→15→28→23→9→12→7→18→26→16→24→10
2329→28→7→1→17→21→26→3→25→16→9→4→5→32→23→22→15
Table 6. Experimental results: number of activated sensors (accumulated volume).
GroupTrialResultGroupTrialResult
2113 (48%), 6 (58%), 12 (68%), 12 (72%) 2416 (51%), 12 (61%), 12 (67%), 16 (71%)
28 (58%), 16 (68%), 16 (72%) 28 (51%), 12 (61%), 16 (67%), 16 (71%)
36 (48%), 9 (58%), 12 (68%), 16 (72%) 36 (51%), 12 (61%), 16 (67%), 16 (71%, uncovered)
44 (48%), 6 (58%), 12 (68%), 12 (72%) 46 (51%), 10 (61%), 12 (67%), 16 (71%, uncovered)
56 (58%), 12 (68%), 12 (72%) 55 (51%), 12 (61%), 12 (67%), 16 (71%, uncovered)
2216 (55%), 6 (56%), 12 (63%), 12 (67%), 16 (71%) 2512 (52%), 8 (61%), 10 (67%), 12 (70%), 12 (70%), 16 (71%)
23 (55%), 6 (56%),10 (63%), 12 (67%), 16 (71%) 24 (61%), 8 (67%), 12 (70%), 12 (70%), 12 (71%)
36 (55%), 8 (56%),9 (63%), 12 (67%), 13 (7%) 36 (61%), 8 (67%), 12 (70%), 12 (70%), 16 (71%)
44 (56%), 12 (63%), 12 (67%), 16 (71%) 43 (52%), 7 (61%), 8 (67%), 12 (70%), 16 (70%), 16 (71%)
56 (56%), 9 (63%), 12 (67%), 16 (71%) 52 (52%), 8 (61%), 10 (67%), 12 (70%), 12 (70%), 12 (71%)
2313 (55%), 6 (59%), 11 (65%), 12 (65%), 16 (76%)
22 (55%), 5 (59%), 9 (65%), 9 (65%), 12 (76%)
38 (59%), 12 (65%), 12 (65%), 16 (76%)
42 (55%), 6 (59%), 12 (65%), 12 (65%), 16 (76%)
54 (59%), 6 (65%), 8 (65%), 12 (76%)