Article

Prediction Capability of Cartesian Cut-Cell Method with a Wall-Stress Model Applied to High Reynolds Number Flows

1
Faculty of Science and Engineering Iwate University, 4-3-5 Ueda, Morioka, Iwate 020-8551, Japan
2
Graduate School of Science and Engineering Iwate University, 4-3-5 Ueda, Morioka, Iwate 020-8551, Japan
*
Authors to whom correspondence should be addressed.
Appl. Sci. 2020, 10(15), 5050; https://doi.org/10.3390/app10155050
Submission received: 4 June 2020 / Revised: 17 July 2020 / Accepted: 20 July 2020 / Published: 22 July 2020
(This article belongs to the Section Aerospace Science and Engineering)

Abstract

:
The Cartesian cut-cell method is one of the most promising methods for computational fluid dynamics due to its sharp interface treatment. However, the Cartesian cut-cell method and other Cartesian mesh solvers have difficulty with concentrating grid to boundary layers. The wall-modelling of shear stress is one of the most effective methods to reduce computational grids in boundary layers. This study investigated the applicability of a wall-stress model to the Cartesian cut-cell method. In the numerical simulations of the flow around a triangular column, Cartesian cut-cell simulation with the wall-stress model adequately predicted the drag coefficient. In the numerical simulations of the flow around a 30P30N high-lift airfoil configuration, the Cartesian cut-cell simulation with the wall-stress model adequately predicts the lift coefficient. The intermittent vortex structure of the outer layer of the turbulent boundary layer was observed on the suction side of the main element and the flap. The Cartesian cut-cell method with a wall-stress model is useful for predicting high Reynolds number flows at R e 10 6 .

1. Introduction

High Reynolds number flows R e 10 6 frequently appear in the aerodynamic design of aircrafts and spacecrafts. In the computational fluid dynamics (CFD), Reynolds-averaged Navier–Stokes (RANS) simulation achieves remarkable success in steady flows. However, RANS simulation is difficult to apply to unknown unsteady flows. Large eddy simulations (LES) are rather reliable in simulations of unknown unsteady flows.
In the turbulent boundary layer of R e 10 6 flows, LES struggles to satisfy the sufficient grid resolution requirement due to the vortex scale decreasing in the inner layer of the turbulent boundary layer, which is about 10 % of the turbulent boundary layer thickness. Choi and Moin [1] estimated that the total number of the computational grid required in a wall-resolved LES is proportional to R e 13 / 7 .
The near-wall treatment such as RANS–LES hybrid simulation [2]; detached eddy simulation (DES) [3]; and wall-stress model [4,5,6,7,8] have success with the prediction of the unsteady high Reynolds number flows. The wall-stress model using one-dimensional equations in wall-normal coordinates for turbulence boundary layer was introduced by Kawai and Larson [5,7,8]. This model yields accurate wall shear stress and heat flux using instantaneous values from the LES. Shear stress and heat flux are provided to the LES in the form of flux across the wall in this model.
The Cartesian cut-cell method [9,10,11,12,13] subdivides the object surface into small flat planes inside the cubical computational cells. In other words, these cells are divided by small cut planes into the fluid side and the object side. The interaction between the object and the fluid is given by wall flux vectors across the cut plane. Due to this sharp interface treatment and the robust grid generation of the Cartesian mesh, the Cartesian cut-cell method is one of the most promising methods in CFD. However, the Cartesian cut-cell method and other Cartesian mesh solvers [14,15,16] struggle to satisfy the required grid resolution for boundary layers because rectangular cells with an extremely large aspect ratio used in boundary fitted mesh are not available with these methods. To overcome this difficulty, an appropriate near-wall treatment is required. The wall-stress model by Kawai and Larson is expected to be one of the most compatible wall treatment techniques with the Cartesian cut-cell method.
The present study performed numerical simulations of the flow past a triangular column and 30P30N high-lift airfoil configuration using the Cartesian cut-cell method with the wall-stress model. The numerical results of the present study revealed the prediction capability of the wall-stress model to the Cartesian cut-cell simulation of unsteady flows.

2. Governing Equation and Simulation Method

2.1. Governing Equation

The governing equation is the compressible Navier–Stokes equation. Conservation laws over a cuboid control volume ( x 1 x x 2 , y 1 y y 2 , z 1 z z 2 ) in the fluid can be written in the following integral form:
d d t z 1 z 2 y 1 y 2 x 1 x 2 Q d x d y d z + z 1 z 2 y 1 y 2 ( E a E d ) d y d z x 1 x 2 + z 1 z 2 x 1 x 2 ( F a F d ) d x d z y 1 y 2 + y 1 y 2 x 1 x 2 ( G a G d ) d x d y z 1 z 2 = 0 ,
where f ( x ) x 1 x 2 denotes f ( x 2 ) f ( x 1 ) .
The conserved quantities Q ; the advection fluxes E a , F a , and G a ; and the viscous and conductive fluxes E d , F d , and G d in Equation (1) are defined as follows:
Q = ρ ρ u x ρ u y ρ u z e , E a = ρ u x ρ u x 2 + p ρ u y u x ρ u z u x e u x + p u x , F a = ρ u y ρ u x u y ρ u y 2 + p ρ u z u y e u y + p u y , G a = ρ u z ρ u x u z ρ u y u z ρ u z 2 + p e u z + p u z , E d = 0 τ x x τ y x τ z x u x τ x x + u y τ y x + u z τ z x q x , F d = 0 τ x y τ y y τ z y u x τ x y + u y τ y y + u z τ z y q y , G d = 0 τ x z τ y z τ z z u x τ z x + u y τ y z + u z τ z z q z ,
where ρ is the density; u x , u y , and u z are the components of the velocity; p is the pressure; and e is the total energy per unit volume. The variables τ and q are the stress tensor and heat flux, respectively:
τ x x = 2 3 μ 2 u x x u y y u z z , τ y y = 2 3 μ 2 u y y u z z u x x , τ z z = 2 3 μ 2 u z z u x x u y y , τ x y = τ y x = μ u x y + u y x , τ y z = τ z y = μ u y z + u z y , τ z x = τ x z = μ u z x + u x z .
q x = 1 γ 1 μ P r a 2 x , q y = 1 γ 1 μ P r a 2 y , q z = 1 γ 1 μ P r a 2 z ,
where a is the speed of sound; μ is the viscosity obtained by Sutherland’s law; and the Prandtl number P r is 0.72 .
The conservation equation in integral form over a cuboid control volume that extends over the two regions of the air and the object is written in the following form using the Heaviside function H ( x , y , z ) :
d d t z 1 z 2 y 1 y 2 x 1 x 2 H Q d x d y d z + z 1 z 2 y 1 y 2 H ( E a E d ) d y d z x 1 x 2 + z 1 z 2 x 1 x 2 H ( F a F d ) d x d z y 1 y 2 + y 1 y 2 x 1 x 2 H ( G a G d ) d x d y z 1 z 2 cut - plane ( E a E d ) n x + ( F a F d ) n y + ( G a G d ) n z d S = 0 ,
where the Heaviside function H ( x , y , z ) gives H = 1 in the air and H = 0 in the object; and the vector n represents the unit normal vector directed outward form the object into the air. Considering the boundary condition u · n = 0 at the object surface, Equation (5) is reduced to the following form:
d d t z 1 z 2 y 1 y 2 x 1 x 2 H Q d x d y d z + z 1 z 2 y 1 y 2 H ( E a E d ) d y d z x 1 x 2 + z 1 z 2 x 1 x 2 H ( F a F d ) d x d z y 1 y 2 + y 1 y 2 x 1 x 2 H ( G a G d ) d x d y z 1 z 2 = cut - plane σ d S ,
where the variable σ on the right-hand side of Equation (6) represents the wall flux vector (the interaction between the object and the air), which is directed from the object into the air:
σ = 0 p n x τ x x n x τ x y n y τ x z n z p n y τ y x n x τ y y n y τ y z n z p n z τ z x n x τ z y n y τ z z n z 0 0 p n x τ w b x p n y τ w b y p n z τ w b z 0 .
The vector b is the stream-wise unit vector parallel to the wall. The scalar value τ w of the wall shear stress is obtained by the wall-stress model. Wall flux of mentum through the pressure and the shear stress are included, while wall flux of mass and energy do not exist in the problems considered here.
The governing Equation (6) is solved using a cell-centered finite volume method. Cell-averaged quantities of the finite volume method are defined as follows:
Q ¯ = 1 α V z 1 z 2 y 1 y 2 x 1 x 2 H Q d x d y d z , α = 1 V z 1 z 2 y 1 y 2 x 1 x 2 H d x d y d z , V = ( x 2 x 1 ) ( y 2 y 1 ) ( z 2 z 1 ) , E ¯ a E ¯ d = 1 β x S x z 1 z 2 y 1 y 2 H ( E a E d ) d y d z , β x = 1 S x z 1 z 2 y 1 y 2 H d y d z , S x = ( y 2 y 1 ) ( z 2 z 1 ) , F ¯ a F ¯ d = 1 β y S y z 1 z 2 x 1 x 2 H ( F a F d ) d x d z , β y = 1 S y z 1 z 2 x 1 x 2 H d x d z , S y = ( x 2 x 1 ) ( z 2 z 1 ) , G ¯ a G ¯ d = 1 β z S z y 1 y 2 x 1 x 2 H ( G a G d ) d x d y , β z = 1 S z y 1 y 2 x 1 x 2 H d x d y , S z = ( x 2 x 1 ) ( y 2 y 1 ) , σ ¯ = 1 S cut - plane = cut - plane σ d S , S cut - plane = cut - plane d S ,
where α is the volume fraction of the air in the cell; β x , β y , β z are the area fractions of the air in each cell interface; V is the volume of the cell; and S x , S y , and S z are the area of each cell interfaces. Using these cell-averaged values, governing Equation (6) is reduced to the following form:
d α Q ¯ d t + β x ( E ¯ a E ¯ d ) x 1 x 2 x 2 x 1 + β y ( F ¯ a F ¯ d ) y 1 y 2 y 2 y 1 + β z ( G ¯ a G ¯ d ) z 1 z 2 z 2 z 1 = S cut - plane V σ ¯ .
The projection of the cut plane to each cell interface is approximated in the following form:
S cut - plane n x β x x 1 x 2 S x , S cut - plane n y β y y 1 y 2 S y , S cut - plane n z β z z 1 z 2 S z .
These approximation tend to be exact equations at the limit of small curvature of the cut plane. Thus in the case of the sufficiently small control volume, S cut - plane and n are evaluated as follows:
S cut - plane = β x x 1 x 2 S x 2 + β y y 1 y 2 S y 2 + β z z 1 z 2 S z 2 1 / 2 ,
n x = V β x x 1 x 2 S cut - plane ( x 2 x 1 ) , n y = V β y y 1 y 2 S cut - plane ( y 2 y 1 ) , n z = V β z z 1 z 2 S cut - plane ( z 2 z 1 ) .
The advection flux at the cell interface is calculated using the Simple Low-dissipation AUSM (SLAU) scheme [17]. The primitive variables on the cell interface are reconstructed using Monotonic Upstream-centered Scheme for Conservation Laws (MUSCL) of the fifth-order accuracy [18]. The velocity components are obtained using the modification of the MUSCL scheme proposed by Thornber [19]. The time integration to second-order accuracy is calculated using the Total Variation Diminishing (TVD) Runge–Kutta method [20].

2.2. Wall-Stress Model

The wall-stress model by Kawai and Larson [5,7,8] for the turbulent boundary layer was used in the present study. Stream-wise momentum and the total energy conservation equation of the wall-stress model are written in the following ordinary differential equations in the local wall-normal coordinate η :
d d η ( μ + μ t , wm ) d U d η = 0 ,
d d η ( μ + μ t , wm ) U d U d η + c p μ P r + μ t , wm P r t , wm d T d η = 0 ,
where U is the wall-parallel velocity component. Constants P r = 0.72 and P r t , wm = 0.90 are the Prandtl number and turbulent Prandtl number, respectively. The solution of the wall-stress model equations shows the averaged velocity and the averaged temperature distributions in the inner-layer part of the turbulent boundary layer. The turbulent eddy viscosity in the wall-stress model μ t , wm is obtained using the following formula:
μ t , wm = κ ρ η τ w ρ D ,
D = 1 exp ( y + / A + ) 2 .
The von Kármán constant is κ = 0.41 , and A + is a constant that equals 17. The velocity scale u τ = τ w / ρ is estimated by the instantaneous wall shear stress and density. The dimensionless wall distance y + in Equation (16) is defined as:
y + = ρ η u τ μ .
The boundary value problem of the wall-stress model Equations (13) and (14) are discretized using the one-dimensional finite volume method and solved by the Thomas algorithm. Boundary values at η = η max = d wm are determined from the instantaneous value of the CFD analysis (Figure 1a).
A schematic of the application of the wall-stress model to the Cartesian cut-cell method is shown in Figure 1. An overview of the implementation is provided as follows:
  • The upper bound of the wall-stress model mesh is set on the wall-normal line passing through a CFD cell center ( x c , y c , z c ) that includes the cut-plane by the object. The upper bound is placed at distance d wm from the wall. The distance d wm corresponds to y + 300 . The location of the upper bound ( x ub , y ub , z ub ) of the wall-stress model in the CFD domain is decided as follows:
    x ub = x c + ( d wm φ c ) n x , y ub = y c + ( d wm φ c ) n y , z ub = z c + ( d wm φ c ) n z ,
    where φ c denotes the distance from the wall to the CFD cell center ( x c , y c , z c ) .
  • The one-dimensional non-uniform mesh for the wall-stress model is generated from the wall to the upper bound. The wall-stress model mesh is generated using the following formula:
    η = exp r wm 1 j wm + c 1 + c 2 ,
    where j wm denotes the cell number from the wall; r wm = 1.1 denotes the rate of the increment of the grid distancing between neighboring grid points. The grid distancing increases by 10 % between neighboring grid points. Constants c 1 and c 2 is decided to satisfy the following conditions:
    η = 0 : at the wall ( j wm = 0 ) , η = d wm : at the upper bound ( j wm = 80 ) .
  • The upper boundary values U and T are decided by inverse distance weighted interpolation using instantaneous values of the neighbor cell-center of the Cartesian cut-cell simulation as follows:
    Q = i = 1 n w i Q i i = 1 n w i ,
    w i = 1 ( x i x ub ) 2 + ( y i y ub ) 2 + ( z i z ub ) 2 .
    The wall boundary condition of the wall-stress model equations is the non-slip and adiabatic wall in the present study.
  • Wall-stress model Equations (13) and (14) are solved using the finite volume method using the one-dimensional wall-model mesh.
  • The obtained wall-stress τ w is provided to the CFD cell at ( x c , y c , z c ) , which includes the cut-plane by the object.

3. Flow around a Triangular Column

The flow around a triangular column that contains only sharp-edge separation and hardly depends on the Reynolds number is calculated. The results of the wall-modeled Navier–Stokes simulation is compared using a experiment and an inviscid simulation by the Euler equation.

3.1. Simulation Conditions

The flow condition is shown in Table 1.
The stream-wise length of the triangular column is 37.5 mm and the length of the one side D of the triangular column is 25 3 43.3 mm . The grid system consists of a uniform grid domain and a non-uniform grid domain in the x y direction. The range of the uniform grid domain that consists of cubic cells with constant grid width Δ x is 0.2 m x 0.2 m , 0.2 m y 0.2 m , and 0 m z 0.16 m . Outside the uniform grid domain, the width of the cuboid cells stretches by 10 % between neighbors in the x and y directions. Inflow and outflow boundary condition is decided by Riemann invariants [21]. Boundary values at y min and y max are fixed to the free-stream condition. The grid system in the z-direction consists of only a uniform grid, and the periodic boundary condition is applied.

3.2. Simulation Results

Isosurfaces of the second invariant of the velocity gradient tensor (Q-criterion) of the fine grid simulations are shown in Figure 2. The left figure shows the result of the Euler simulation and the right figure shows the wall-modeled Navier–Stokes simulation.
In both figures, flow separation occurs at the downstream-side sharp edges, and a complex vortex structure that contains longitudinal vortices is formed in the wake. The outline of the flow structure by the wall-modelled Navier–Stokes simulation is the same as that of the Euler simulation.
Instantaneous distribution of pressure and velocity in an x y -plane of the fine grid simulation is shown in Figure 3.
Free shear layers form in the wake of the sharp edges, and the vortices form by the rollup of the free shear layers. Pressure in the wake of the wall-modelled Navier–Stokes simulation is similar to that of the Euler simulation.
Time-averaged distribution of pressure and velocity in an x y -plane of the fine grid simulation is shown in Figure 4.
The length of the wake of the wall-modelled Navier–Stokes simulation is almost equal to that of the Euler simulation. Pressure distribution in the wake of the wall-modelled Navier–Stokes simulation is slightly different from that of the Euler simulation. However, the surface pressure distributions of the triangular column in both cases do not have noticeable differences. This suggests that the flow field hardly depends on the Reynolds number, and the boundary layer on the triangular column does not play an important role.
The drag coefficient is shown in Table 2.
The drag coefficient of the fine grid of the Euler simulation is 1.282 and the difference from the experimental value [22] is 3.2 % . The difference decreases with grid resolution. The pressure drag coefficients of the fine grid simulation of the wall-modelled Navier–Stokes simulation is 1.284 . This value is extremely close to that of the Euler simulation. The difference in the drag coefficient of the wall-modelled Navier–Stokes simulation from the experiment is slightly less than that of the Euler simulation. This improvement is mainly provided by the additional surface friction of the wall-modelled Navier–Stokes simulation. Considering effect of viscosity of the fluid in the wall-modelled Navier–Stokes simulation, this relationship is reasonable.
The computational cost of the wall-modelled Navier–Stokes simulation is 3/2 or more of that of the Euler simulation. Both the wall-modelled Navier–Stokes simulation and the Euler simulation are valid when the separation lines are fixed to the sharp edges of the object. Consequently, it is possible to select one of these simulation methods according to accuracy and computational cost requirements when the separation lines are fixed to the sharp edges and the flow field hardly depends on the Reynolds number.

4. Flow around the 30P30N Three-Element High-Lift Airfoil Configuration

Numerical Euler and wall-modelled Navier–Stokes simulations of the flow around a 30P30N high-lift airfoil configuration were performed. This airfoil is a model of the high-lift device of an aircraft that consists of a slat, main element, and flap. The simulation results were compared with experiments and CFD results using the boundary-fitted mesh method. Based on these comparisons, the prediction capability of the Cartesian cut-cell method with the wall-stress model by Kawai and Larson [5] was discussed.

4.1. Simulation Conditions

The flow conditions are provided in Table 3.
The chord length c of the 30P30N high-lift airfoil configuration is 0.457 m following the experiment by Murayama et al. [23]. The grid system consists of a uniform grid domain and a non-uniform grid domain in the x y direction. The range of the uniform grid domain that consists of cubic cells with constant grid width Δ x is 0.1 m x 0.6 m , 0.1 m y 0.1 m , and 0 z 0.052 m . Outside the uniform grid domain, the width of the cuboid cells stretches by 10 % between neighbors in the x and y directions. The boundary condition at the outer edges of the x y -plane is determined by Riemann invariants [21]. The computational grid in x y -plane is shown in Figure 5.
The grid system in the z direction only consists of a uniform grid, and the periodic boundary condition is applied.

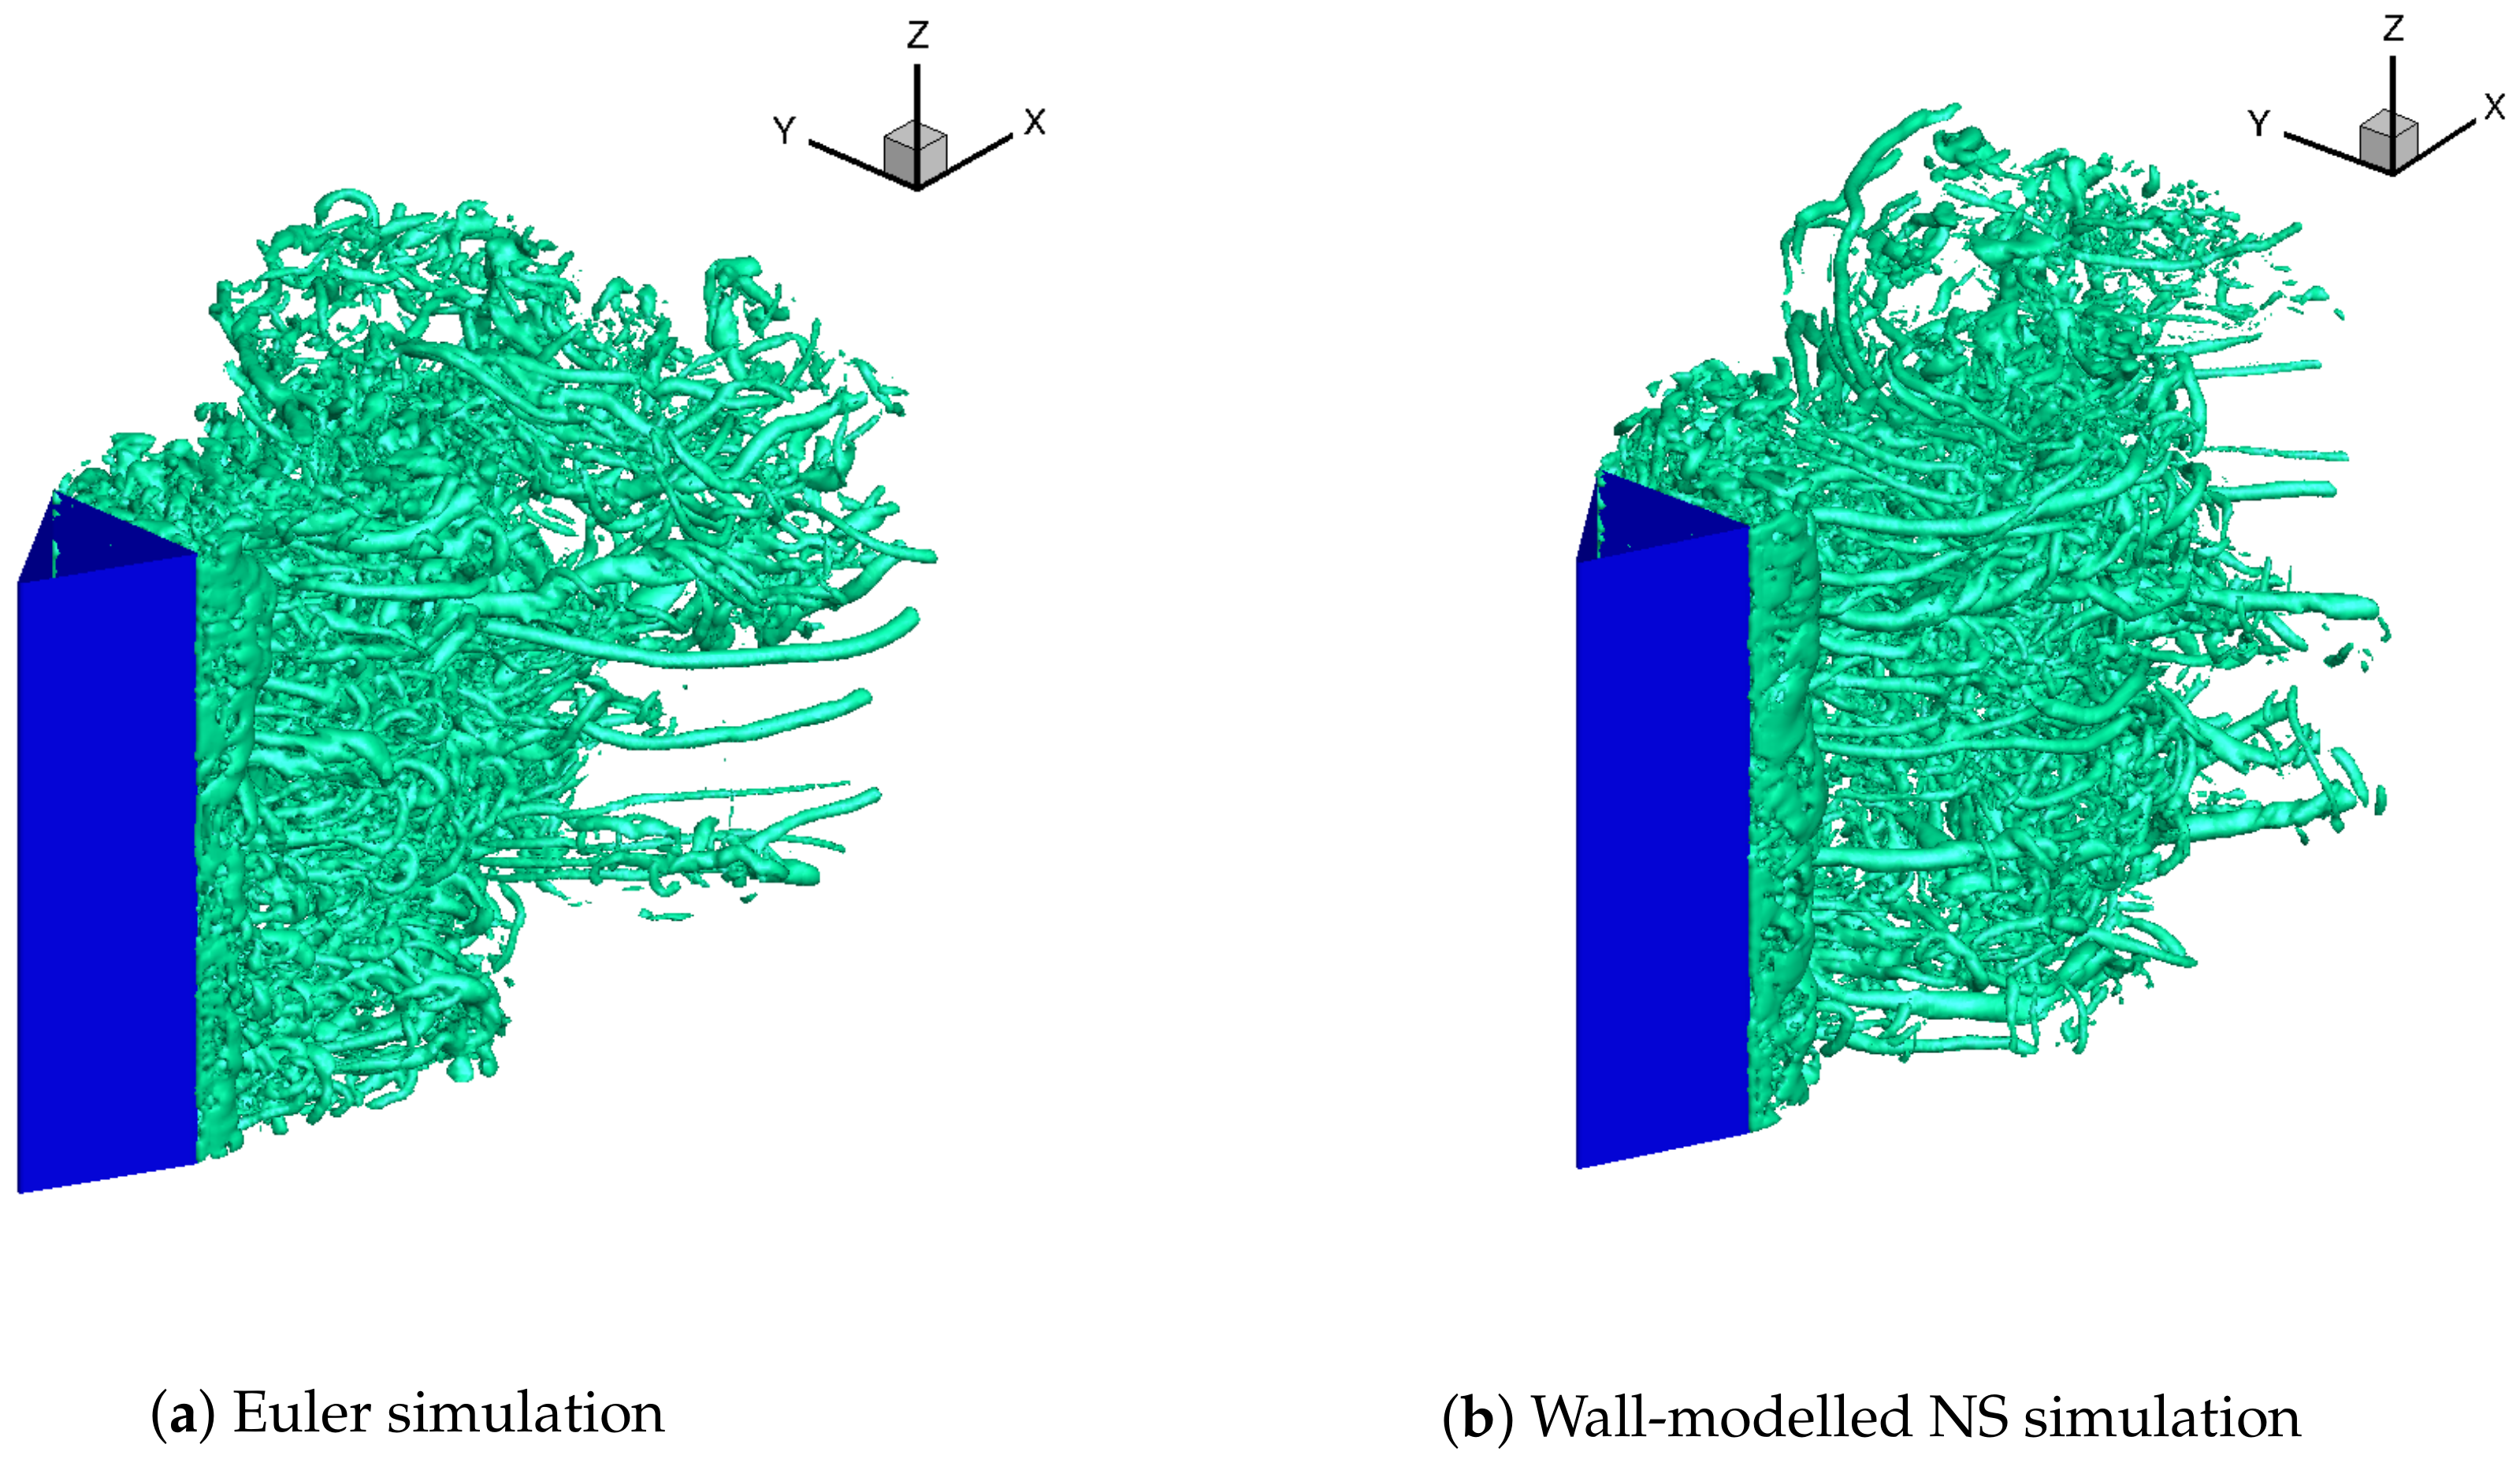
4.2. Simulation Result by Wall-Modelled Navier–Stokes Simulation

The isosurface of the second invariant of the velocity gradient tensor (Q-criterion) around the 30P30N high-lift airfoil configuration at the angle of attack θ = 5.5 ° is shown in Figure 6.
Vortices are shed from the trailing edge of the slat (Figure 6a), the main element, and the flap. The intermittent vortices of the outer layer of the turbulent boundary layer are generated on the suction side of the main element (Figure 6b) and flap.
Figure 7 shows the distribution of the velocity component u x at the nearest cell from the airfoil surface and an x y -plane cross-section of the fine grid simulation, providing a close-up view at x / c 0.15 . The dark blue area in Figure 7 shows the negative value of the velocity component, which indicates that the leading-edge separation bubble forms at x / c 0.15 . The location of the separation bubble is consistent with the experiment [24]. This separation bubble formed in the fine grid simulation but not in the medium and coarse grid simulations.
Figure 8a and Figure 9 show the instantaneous and time-averaged distribution of the velocity component u x , respectively, around the flap when θ = 5.5 ° .
Flow separation occurs on the suction side of the upstream side of the trailing edge of the flap in the instantaneous flow field as shown in Figure 8a. It does not reattach before the trailing edge of the flap. In contrast with Figure 8b, the flow does not separate in the time-averaged flow field (Figure 9). This indicates that the separation near the trailing edge of the flap occurs intermittently.
The lift coefficients in this study and the θ -sweep of that in the experiment in Reference [23] are shown in Figure 10.
The Cartesian cut-cell simulation with the wall-stress model accurately predicts the lift coefficient.
The lift coefficient of the Cartesian cut-cell simulation with the wall-stress model, the boundary-fitted mesh simulation [25], the hybrid mesh simulation [26], and the experiment [23] are shown in Table 4. The hybrid mesh in Reference [26] is composed of the boundary fit mesh in the near-field region and the quadtree-based Cartesian mesh in the far-field region.
Compared with the experiment, the Cartesian cut-cell simulation with the wall-stress model underestimates the lift coefficient. The difference from the experiment decreases monotonically with increasing grid resolution. However, the difference decreases slower than expected accuracy in the formulation.
The pressure coefficient in the case of θ = 5.5 ° is shown in Figure 11.
The surface pressure distribution at the pressure side of this study coincides with the experiment and referenced simulations. It indicates that the surface pressure distribution at the pressure side is independent of the grid type and the near-wall treatment.
The Cartesian cut-cell simulation of the present study well estimates the surface pressure distribution as well as the boundary-fitted mesh simulation [25] and hybrid mesh simulation [26], except for the suction side of the slat and the main element suction side of x / c 0.15 . The curvature of the pressure distribution changes around x / c = 0.15 , and this x-coordinate coincides with the location from which the vortices of the outer layer of the turbulent boundary layer develop on the suction side of the main element.
The underestimation of the lift coefficient of the present study in Table 4 is consistent with the surface pressure distribution in Figure 11. The positive error of the surface pressure on the suction side of the main element at x / c 0.15 and the suction side of the slat results in the underestimation of the lift. This error is caused by the mismatched estimation of the wall shear stress of the laminar parts of the boundary layers in these areas. The Cartesian cut-cell method experiences difficulty with resolving the laminar boundary layer due to its incompatibility with the grid concentration in the wall-normal direction. This problem is expected to be solved by the future development of the wall-stress model for laminar boundary layers.
The results of the present simulations showed that Cartesian cut-cell simulation with the wall-stress model by Kawai and Larson [5] is one of the most useful schemes for the external flows of R e 10 6 . The difference in the lift coefficient in the experiment in the medium grid simulation in Table 4 is the same as the hybrid mesh simulation [26]. Considering the total number of computational cells, the prediction capability of the present Cartesian cut-cell simulation with the wall-stress model is the same as the hybrid simulation [26]. Future improvements in the wall-stress model for the laminar part of boundary layer is expected to produce more accurate prediction within the same degree of accuracy as the boundary-fitted mesh simulation by Sakai [25].

4.3. Simulation Result with the Euler Equation

Figure 8b shows the instantaneous distribution of the velocity component u x of the Euler simulation around the flap when θ = 5.5 ° . In contrast to the result produced with the wall-modeled Navier–Stokes simulation in Figure 8a, flow separation does not occur on the suction side of the flap in Figure 8b. This suggests that the Euler simulation does not properly reproduce the flow separation from a smooth surface.
The lift coefficient of the Euler simulation in the medium grid at θ = 5.5 ° is 3.25 and the difference from the experimental result is 13.2 % . The Euler simulation overestimates the lift coefficient, and the difference in the lift coefficient in the edium grid of the Euler simulation is obviously larger than that of the coarse grid of the wall-modelled Navier–Stokes simulation. The Euler simulation is valid only if separation lines are fixed at the sharp edges of the body as shown in Figure 2a.

5. Conclusions

The prediction capability of the Cartesian cut-cell method with a wall-stress model was discussed in this paper.
In the numerical analysis of the flow around a triangular column, the wall-modelled Navier–Stokes simulation adequately predicted the drag coefficient. In this case of sharp-edge separation flow, the drag coefficients of both the wall-modelled Navier–Stokes simulation and the Euler simulation agreed with the experimental value within a small error. The value of the drag coefficient of the wall-modelled Navier–Stokes simulation was closer to the experimental value compared to that of the Euler simulation.
The difference of the lift coefficient between the Cartesian cut-cell simulation and the experiment monotonically decreases with increasing grid resolution, in the numerical analysis of the flow around the 30P30N three-element high-lift airfoil configuration. The intermittent vortex structure of the outer layer of the turbulent boundary layer was observed on the suction side of the main element and the flap. The intermittent flow separation from the suction side of the airfoil surface of the flap was predicted.
The prediction result of the flows at R e 10 6 by the Cartesian cut-cell method with the wall-stress model were equivalent to that by the boundary-fitted mesh methods, except for the laminar parts of the boundary layers. The Cartesian cut-cell method with the wall-stress model is one of the useful methods for high-Reynolds-number flows at R e 10 6 .

Author Contributions

Conceptualization, Y.T. (Yuki Takeda) and K.U.; methodology, Y.T. (Yuki Takeda), K.U. and T.I.; software, Y.T. (Yuki Takeda) and T.I.; validation, Y.T. (Yuki Takeda), T.I., and Y.T. (Yuta Takahashi); investigation, Y.T. (Yuki Takeda), T.I., and Y.T. (Yuta Takahashi); resources, K.U.; data curation, Y.T. (Yuki Takeda); writing—original draft preparation, Y.T. (Yuki Takeda); writing—review and editing, K.U.; visualization, Y.T. (Yuki Takeda), T.I., and Y.T. (Yuta Takahashi); supervision, Y.T. (Yuki Takeda) and K.U.; project administration, K.U.; funding acquisition, K.U. All authors have read and agreed to the published version of the manuscript.

Funding

This research received no external funding.

Acknowledgments

Part of the experimental results in this research were obtained using supercomputing resources at the Cyberscience Center, Tohoku University.

Conflicts of Interest

The authors declare no conflict of interest.

References

  1. Choi, H.; Moin, P. Grid-point requirements for large eddy simulation: Chapman’s estimates revisited. Phys. Fluids 2012, 24, 1–6. [Google Scholar] [CrossRef]
  2. Baurle, R.A.; Tam, C.J.; Edwards, J.R.; Hassan, H.A. Erratum: Hybrid Simulation Approach for Cavity Flows: Blending, Algorithm, and Boundary Treatment Issues. AIAA J. 2003, 41, 1463–1480. [Google Scholar] [CrossRef]
  3. Nikitin, N.V.; Nicoud, F.; Wasistho, B.; Squires, K.D.; Spalart, P.R. An approach to wall modeling in large-eddy simulations. Phys. Fluids 2000, 12, 1629–1632. [Google Scholar] [CrossRef]
  4. Nicoud, F.; Baggett, J.S.; Moin, P.; Cabot, W. Large eddy simulation wall-modelling based on suboptimal control theory and linear stochastic estimation. Phys. Fluids 2001, 13, 2968–2984. [Google Scholar] [CrossRef]
  5. Kawai, S.; Larsson, J. Wall-modeling in large eddy simulation: Length scales, grid resolution, and accuracy. Phys. Fluids 2012, 24, 1–10. [Google Scholar] [CrossRef]
  6. Bose, S.T.; Moin, P. A dynamic slip boundary condition for wall-modeled large-eddy simulation. Phys. Fluids 2014, 26. [Google Scholar] [CrossRef]
  7. Larsson, J.; Kawai, S.; Bodart, J.; Bermejo-Moreno, I. Large eddy simulation with modeled wall-stress: Recent progress and future directions. Mech. Eng. Rev. 2016, 3, 15-00418. [Google Scholar] [CrossRef] [Green Version]
  8. Fukushima, Y.; Kawai, S. Wall-modeled large-eddy simulation of transonic airfoil buffet at high reynolds number. AIAA J. 2018, 56, 2372–2388. [Google Scholar] [CrossRef]
  9. Clarke, D.K.; Salas, M.D.; Hassan, H.A. Euler calculations for multielement airfoils using Cartesian grids. AIAA J. 1986, 24, 353–358. [Google Scholar] [CrossRef]
  10. Yang, G.; Causon, D.M.; Ingram, D.M. Calculation of compressible flows about complex moving geometries using a three-dimensional Cartesian cut cell method. Int. J. Numer. Methods Fluids 2000, 33, 1121–1151. [Google Scholar] [CrossRef]
  11. Harada, M.; Imamura, T. Comparison of Immersed Boundary Method and Cut-Cell Method on Cartesian Grids—Validation of Pressure and Shear Stress Distributions on Near-Wall Region. J. Jpn. Soc. Aeronaut. S. 2016, 64, 200–207. (In Japanese) [Google Scholar] [CrossRef]
  12. Ueno, K.; Natsume, Y.; Shimasaki, S.I.; Iwai, K.; Ohsasa, K. Numerical Study of Oscillating Melt Flows and Its Solute Transport Driven by Electromagnetic Force around Dendrite. Tetsu-to-Hagane 2016, 102, 141–150. (In Japanese) [Google Scholar] [CrossRef]
  13. Takeda, Y.; Ueno, K.; Matsuyama, S.; Tanno, H. Coupled Numerical Analysis of Three-Dimensional Unsteady Flow with Pitching Motion of Reentry Capsule. Trans. Jpn. Soc. Aeronaut. Space Sci. 2020, in press. [Google Scholar]
  14. Peskin, C.S. Numerical analysis of blood flow in the heart. J. Comput. Phys. 1977, 25, 220–252. [Google Scholar] [CrossRef]
  15. Iaccarino, G.; Verzicco, R. Immersed boundary technique for turbulent flow simulations. Appl. Mech. Rev. 2003, 56, 331. [Google Scholar] [CrossRef]
  16. Mittal, R.; Iaccarino, G. Immersed Boundary Methods. Annu. Rev. Fluid Mech. 2005, 37, 239–261. [Google Scholar] [CrossRef] [Green Version]
  17. Shima, E.; Kitamura, K. On New Simple Low-Dissipation Scheme of AUSM-Family for All Speeds. In Proceedings of the 47th AIAA Aerospace Science Meeting Including New Horizons Forum Aerospace Exposition, Reston, VA, USA, 5–8 January 2009; pp. 1272–2010. [Google Scholar] [CrossRef]
  18. Kim, K.H.; Kim, C. Accurate, efficient and monotonic numerical methods for multi-dimensional compressible flows. Part II: Multi-dimensional limiting process. J. Comput. Phys. 2005, 208, 570–615. [Google Scholar] [CrossRef]
  19. Thornber, B.; Mosedale, A.; Drikakis, D.; Youngs, D.; Williams, R.J. An improved reconstruction method for compressible flows with low Mach number features. J. Comput. Phys. 2008, 227, 4873–4894. [Google Scholar] [CrossRef]
  20. Shu, C.W.; Osher, S. Efficient implementation of essentially non-oscillatory shock-capturing schemes. J. Comput. Phys. 1988, 77, 439–471. [Google Scholar] [CrossRef] [Green Version]
  21. Jameson, A.; Baker, T. Solution of the Euler equations for complex configurations. In Proceedings of the 6th Computational Fluid Dynamics Conference Danvers, Danvers, MA, USA, 13–15 July 1983. [Google Scholar] [CrossRef]
  22. Lindsey, W.F. Drag of Cylinders of Simple Shapes; NACA Report 619; NACA Langley Aeronautical Lab.: Langley Field, VA, USA, 1937. [Google Scholar]
  23. Murayama, M.; Yokokawa, Y.; Ura, H.; Nakakita, K.; Yamamoto, K.; Ito, Y.; Takaishi, T.; Sakai, R.; Shimoda, K.; Kato, T.; et al. Experimental Study of Slat Noise from 30P30N Three-Element High-Lift Airfoil in JAXA Kevlar-Wall Low-Speed Wind Tunnel. In Proceedings of the 2018 AIAA/CEAS Aeroacoustics Conference, Reston, VA, USA, 25–29 June 2018. [Google Scholar] [CrossRef]
  24. Pascioni, K.; Cattafesta, L.N.; Choudhari, M.M. An Experimental Investigation of the 30P30N Multi-Element High-Lift Airfoil. In Proceedings of the 20th AIAA/CEAS Aeroacoustics Conference, Reston, VA, USA, 16–20 June 2014. [Google Scholar] [CrossRef] [Green Version]
  25. Sakai, R.; Ihida, T.; Murayama, M.; Ito, Y.; Yamamoto, K. Aerodynamic Simulation of 30P30N Airfoil using Second-Order Low-Dissipation Scheme on Cartesian Hybrid Grid. In Proceedings of the Fifth Aerodynamics Prediction Challenge, Tokyo, Japan, 1 July 2019; pp. 83–89. [Google Scholar]
  26. Ueno, Y. Validation of Aerodynamic Noise from 3-Element High-Lift Airfoil Configulation using Cflow. In Proceedings of the Fifth Aerodynamics Prediction Challenge, Tokyo, Japan, 1 July 2019; pp. 103–116. [Google Scholar]
Figure 1. Overview of the application of the wall-stress model to the Cartesian cut-cell method. (a) Define the upper bound of the wall-stress model mesh using the wall distance d wm ; (b) Generate the one-dimensional mesh for the wall-stress model that is independent of the Cartesian cut-cell mesh; (c) Interpolate U and T to the upper boundary value of the wall-stress model using inverse distance weighting.
Applsci 10 05050 g001
Figure 2. Isosurfaces of the second invariant of the velocity gradient tensor (Q-criterion).
Applsci 10 05050 g002
Figure 3. Pressure contour and velocity vectors at the z = const . plane of the fine grid simulation.
Applsci 10 05050 g003
Figure 4. Time-averaged pressure contour and velocity vectors at the z = const . plane of the fine grid simulation.
Applsci 10 05050 g004
Figure 5. Computational grid around a 30P30N high-lift airfoil configuration. (a) Grid in all the computational domain; (b) Computational grid around the trailing edge of the slat and the leading edge of the main element.
Applsci 10 05050 g005
Figure 6. Q-criterion around a 30P30N high-lift airfoil configuration when θ = 5.5 ° . (a) Wake of the slat; (b) Vortices of the outer layer of the turbulent boundary layer on the suction side of the main element.
Applsci 10 05050 g006
Figure 7. The leading edge separation bubble around x / c = 0.15 in the fine grid simulation; color shows velocity component u x at the nearest cell from the airfoil surface and an x , y cross-section.
Applsci 10 05050 g007
Figure 8. Instantaneous distribution of velocity component u x around the flap when θ = 5.5 ° .
Applsci 10 05050 g008
Figure 9. Time-averaged distribution of velocity component u x by the wall-modelled Navier–Stokes simulation around the flap when θ = 5.5 ° .
Applsci 10 05050 g009
Figure 10. Lift coefficient of the 30P30N high-lift airfoil configuration.
Applsci 10 05050 g010
Figure 11. Surface pressure distribution of the 30P30N high-lift airfoil configuration when θ = 5.5 ° ; SA DDES, detached eddy simulation with Spalart–Allmaras turbulence model.
Applsci 10 05050 g011
Table 1. Simulation conditions for the flow around a triangular column.
Ma Re (Wall-Modeled NS) Δ x / D
0.3 2.9 × 10 5 0.092 , 0.046
Table 2. Drag coefficient and its difference from the experiment (%).
CoarseFine
Euler 1.268 ( 4.3 % ) 1.282 ( 3.2 % )
Wall-Modelled NS 1.283 ( 3.1 % ) 1.291 ( 2.6 % )
Experiment [22] 1.325
Table 3. Simulation conditions for the flow around a 30P30N high-lift airfoil configuration.
Ma Re (Wall-Modeled NS) θ Δ x / c
CoarseMediumFine
0.17 1.71 × 10 6 5.5 ° 2.2 × 10 3 1.1 × 10 3 0.55 × 10 3
9.5 ° 2.2 × 10 3 1.1 × 10 3
Table 4. Lift coefficient ( θ = 5.5 ° ) and its difference from the experiment (%); SA DDES, detached eddy simulation with Spalart–Allmaras turbulence model.
Total Number of CellsLift Coefficient
Present Wall-Modelled NSCoarse15,972,528 2.60 ( 7.8 % )
Medium93,515,136 2.69 ( 4.6 % )
Fine612,392,768 2.71 ( 3.9 % )
Boundary-fitted mesh (SA DDES) [25]70,445,430 2.77 ( 1.8 % )
Hybrid mesh (SA DDES) [26]242,000,000 2.95 ( 4.6 % )
Experiment [23] 2.82

