Article

A Maturity Estimation of Bell Pepper (Capsicum annuum L.) by Artificial Vision System for Quality Control

by
Marcos-Jesús Villaseñor-Aguilar
1,2,
Micael-Gerardo Bravo-Sánchez
1,
José-Alfredo Padilla-Medina
1,
Jorge Luis Vázquez-Vera
1,
Ramón-Gerardo Guevara-González
3,
Francisco-Javier García-Rodríguez
1 and
Alejandro-Israel Barranco-Gutiérrez
1,4,*
1
Doctorado en Ciencias de la Ingeniería, Tecnológico Nacional de México en Celaya, Celaya 38010, Mexico
2
Departamento de Ingenieria Mecatrónica, Tecnológico Nacional de México en Salvatierra, Salvatierra 38933, Mexico
3
Grupo de Bioingeniería Básica y Aplicada, Facultad de Ingeniería, Faculta de Ingeniería, Universidad Autónoma de Querétaro, El Marques 76265, Mexico
4
Cátedras-CONACyT, García Cubas esq. Av. Tecnológico, Celaya 38010, Mexico
*
Author to whom correspondence should be addressed.
Appl. Sci. 2020, 10(15), 5097; https://doi.org/10.3390/app10155097
Submission received: 4 June 2020 / Revised: 16 July 2020 / Accepted: 21 July 2020 / Published: 24 July 2020

Abstract

:
Sweet bell peppers are a Solanaceous fruit belonging to the Capsicum annuum L. species whose consumption is popular in world gastronomy due to its wide variety of colors (ranging green, yellow, orange, red, and purple), shapes, and sizes and the absence of spicy flavor. In addition, these fruits have a characteristic flavor and nutritional attributes that include ascorbic acid, polyphenols, and carotenoids. A quality criterion for the harvest of this fruit is maturity; this attribute is visually determined by the consumer when verifying the color of the fruit’s pericarp. The present work proposes an artificial vision system that automatically describes ripeness levels of the bell pepper and compares the Fuzzy logic (FL) and Neuronal Networks for the classification stage. In this investigation, maturity stages of bell peppers were referenced by measuring total soluble solids (TSS), ° Brix, using refractometry. The proposed method was integrated in four stages. The first one consists in the image acquisition of five views using the Raspberry Pi 5 Megapixel camera. The second one is the segmentation of acquired image samples, where background and noise are removed from each image. The third phase is the segmentation of the regions of interest (green, yellow, orange and red) using the connect components algorithm to select areas. The last phase is the classification, which outputs the maturity stage. The classificatory was designed using Matlab’s Fuzzy Logic Toolbox and Deep Learning Toolbox. Its implementation was carried out onto Raspberry Pi platform. It tested the maturity classifier models using neural networks (RBF-ANN) and fuzzy logic models (ANFIS) with an accuracy of 100% and 88%, respectively. Finally, it was constructed with a content of ° Brix prediction model with small improvements regarding the state of art.

1. Introduction

Native to the Americas, sweet bell peppers are a Solanaceous fruit belonging to the Capsicum annuum L. species. It is a non-pungent fruit that is valued for its color, flavor, and nutritional attributes including ascorbic acid, polyphenolics, and various carotenoids. It comes in a wide variety of colors (ranging green, yellow, orange, red, and purple), shapes, and sizes, as well as because it has a high content of ascorbic acid, polyphenols, and other antioxidants. Nowadays, bell peppers are widely consumed in various ways, dehydrated, preserved, frozen, or raw for packaged salads. Generally, the harvest of bell peppers is determined by the size, color, and texture of the fruit. Traditionally, the harvest of this fruit is done by reaching physiological mute when the pericarp becomes thick and the fruit reaches the typical size. However, estimating pepper maturity at the green stage can be difficult even for fruit with similar physical attributes [1]. Under certain conditions, bell peppers can begin to ripen during shipping. Partially ripened fruit, classified as chocolate or suntan, have lower market values than at the solid color stage.
The bell peppers reach their optimum state of maturity for use in the kitchen when they are in solid color. Consumers prefer this fruit in its best stage of maturity more so than its physical appearance and nutritional content [2]. Dutch researchers specializing in the sensory area, reported that study groups have considered that more ripeness of bell peppers is sweeter and has a red pepper aroma, while those in the green stage were rated for bitterness and aroma of herbs and cucumber [3]. On the other hand, ripe peppers are more expensive to produce, due to the longer time required for ripening and the greater likelihood of damage from insects or disease. Furthermore, ripe peppers are more susceptible to physical damage during transport. In addition, they have a shorter shelf life due to the stage of maturity at which they are harvested. These fruits are non-climacteric regarding postharvest respiratory patterns. At the mentioned stage, bell peppers will progress through the normal ripening process to degrade chlorophyll while simultaneously synthesizing a variety of red and yellow carotenoids. The red and yellow varieties are the peppers most on demand by consumers, followed by the orange and purple varieties [4].
Bell pepper contains provitamin A, carotenoids, and xanthophylls. Many studies have focused on improving retention of these compounds during processing and storage [5,6,7,8,9,10] that increase their concentration as the fruit reaches a major state of maturity. Bell peppers also contain high concentrations of ascorbic acid (0.15–2.0 mg·g−1 fresh weight) compared to other fruits and vegetables [11,12,13,14,15,16,17,18,19,20,21,22,23,24,25,26,27,28,29,30]. The production of ascorbic acid in peppers and other fruits are related to glucose metabolism and light exposure, and concentrations of both ascorbic acid and sugar reduction typically increases with the stage of maturity [14]. Polyphenolics are also an important chemical component in bell peppers and impart functional properties to the plant such as disease resistance and potential health benefits to consumers. Some studies found that total phenolics, including the flavonoid quercetin, decrease with increased maturity for yellow bell peppers, but increased for other pepper varieties [6]. Estrada et al. [31] also demonstrated a decrease in free phenolic concentrations in peppers over five stages of maturity. Pepper growers could reduce field production costs by hastening the fruit ripening rate on the plant or by harvesting the fruit before attaining full color and completing the ripening process during storage without appreciable loss in quality or phytochemical attributes. An important criterion for consumers of sweet pepper is its sweetness, commonly estimated with the content of soluble solids (SSC) [22]. This parameter is associated with the different stages of fruit maturity [24,25,26,27,28]. The measurement of SSCs is traditionally a destructive test, to perform it, the most used instrument is the refractometer. This is an optical instrument that measures the refractive index of the juice from the sample [29,30].
At present, the food industry has demanded the use of non-invasive high precision measuring equipment that determines the external and internal quality parameters of the fruits [32]. In this respect, one of the disciplines that has had a great impact on fruit quality control is computational vision (VC). This has the characteristic that emulates the functionality of human vision and allows spatial and optical information from the captured image of the sample. Different investigations have been reported with VC focused on determining the degrees of ripeness of various fruits such as persimmon, strawberries, pomegranate, and tomato [33,34,35]. The present work aims to implement an artificial vision system that automatically describes the ripeness levels of the bell pepper.
More recently, total soluble solids (TSS) or Brix grades are a classical tool to determine the maturity of the fruits in the food industry even though it is a destructive technique. The content of TSS consists of 80–95% sugars and the measure of TSS is associated with the dissolved sugars in cell juice [36]. These authors affirmed that the quantity of sugars in the fruit depends mainly on the variety, the assimilatory yield of the leaves, the leaf/fruit ratio, the climatic conditions during the development of the fruit, the state of development, and the maturity. The accumulation of sugars is associated with the development of optimum quality for consumption. Although the sugars can be transported to the fruit by the sap, they are also contributed by the splitting of the starch reserves of the fruits [36]. When the fruits in general have their highest sugar content, they have reached their physiological maturity, which coincides with what was investigated in relation to the bell peppers and their greater ripeness [37]. The TSS content showed a constant increase as the fruit maturity status increased, which could be seen with an increase in color fastness in the sample bell peppers. The ascending behavior of TSS content is consistent with that reported in the literature [37]. Kays [38] explained that, when the fruit is ripening in the plant, the sugars increase their concentration by the translocation of sucrose from the leaves, which occurs in most species. However, there is also the recycling of the respiratory substrate from the carbon stored in the fruit. Overall, highly significant positive correlations of soluble solids content were found with this research. The measurement of the TSS was done in triplicate with two different refractometers, an ATAGO Refractometer (MASTER-M model, Tokyo, Japan), Brix measurement scale of 0.0–33.0%, with a minimum of 0.2%, an accuracy of ±0.2%, and repeatability of ±0.1%; and a HANNA brand refractometer, model HI 96802 (Woonsocket, RI, USA), Brix measurement scale of 0.0–85.0%, with a temperature range of 0–80 °C, an accuracy of ±0.2%, and repeatability of ±0.1%.
Figure 1 shows the distribution of Brix grades of soluble solids content in the four stages of maturity of the fruit. This allowed us to establish that the grouping of the samples contemplates different stages of maturity of the bell pepper. This describes an increase in sugars from maturity Stage 1 to Stage 3 and the maximum sugar content is in State 4.

2. Related Work

Currently, the high demand in the food industry has created the need for a fast and effective way to control the quality of products, which has led to the application of intelligent systems such as artificial vision that helps determine the internal and external properties of the fruits resulting in the stage of maturity. Different authors have focused on determining the maturity of various fruits such as apricot, nightshade, citrus, coffee, and mango. It is worth mentioning several studies that have focused on determining the maturity of bell peppers and estimating total soluble solids [39].
Harel et al. [40] classified their maturity using the random forest algorithm, which identified four classes: fully green, partially colored immature, mature partially colored, and colored.
Elhariri et al. [41] used an algorithm based on a support vector machine (SVM) for classification. This identified five maturity classes associated with green and red shades.
Shamili et al. [42] proposed a polynomial regression model that estimated the soluble solids content of mango. The descriptor that he proposed was the normal values of * a of the images captured from five types of mangoes; the samples he used had different percentages of skin coloration of 0%, 20%, 25%, 50%, and more than 50%.
Li et al. [43] used hyperspectral imaging in the visible and near-infrared (VNIR) and short-wave near-infrared (SWIR) regions focused on measuring maturity, firmness, and suspended sediment concentration (SSC). This research showed that there is a strong correlation between the SSC and the average spectra obtained from one or two opposite sides of the fruit in the SWIR region.
Another similar work was carried out by Teerachaichayut et al. [44], who proposed several models for limes to determine total soluble solids (TSS) and titratable acidity (TA) using partial least square regression.

3. Materials and Methods
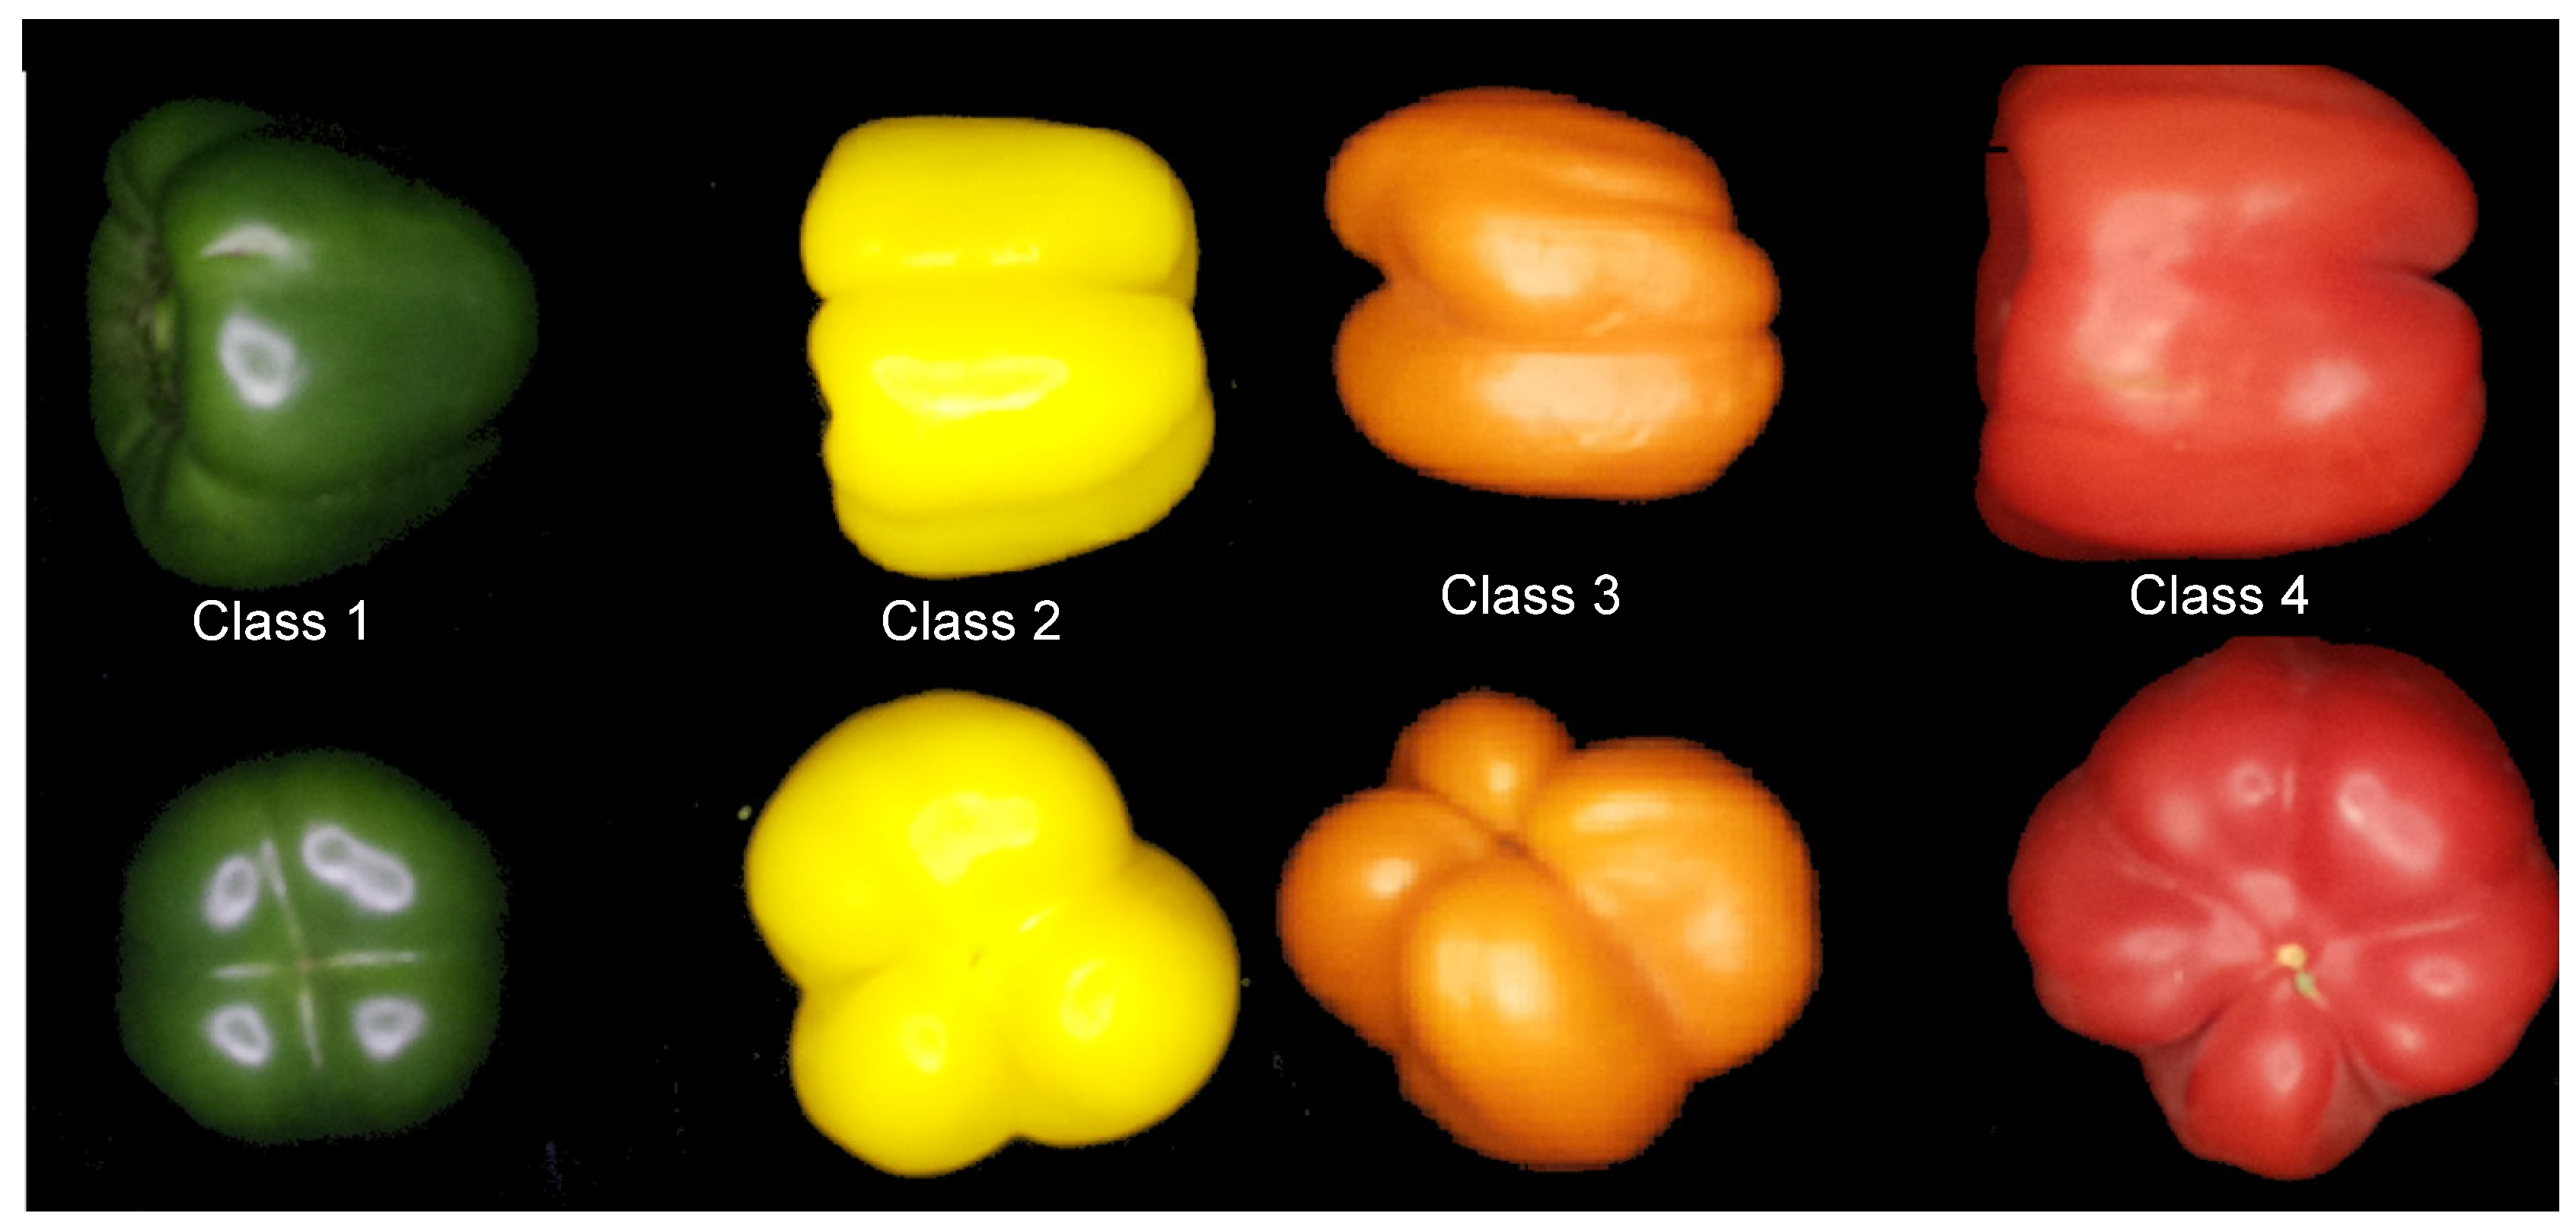
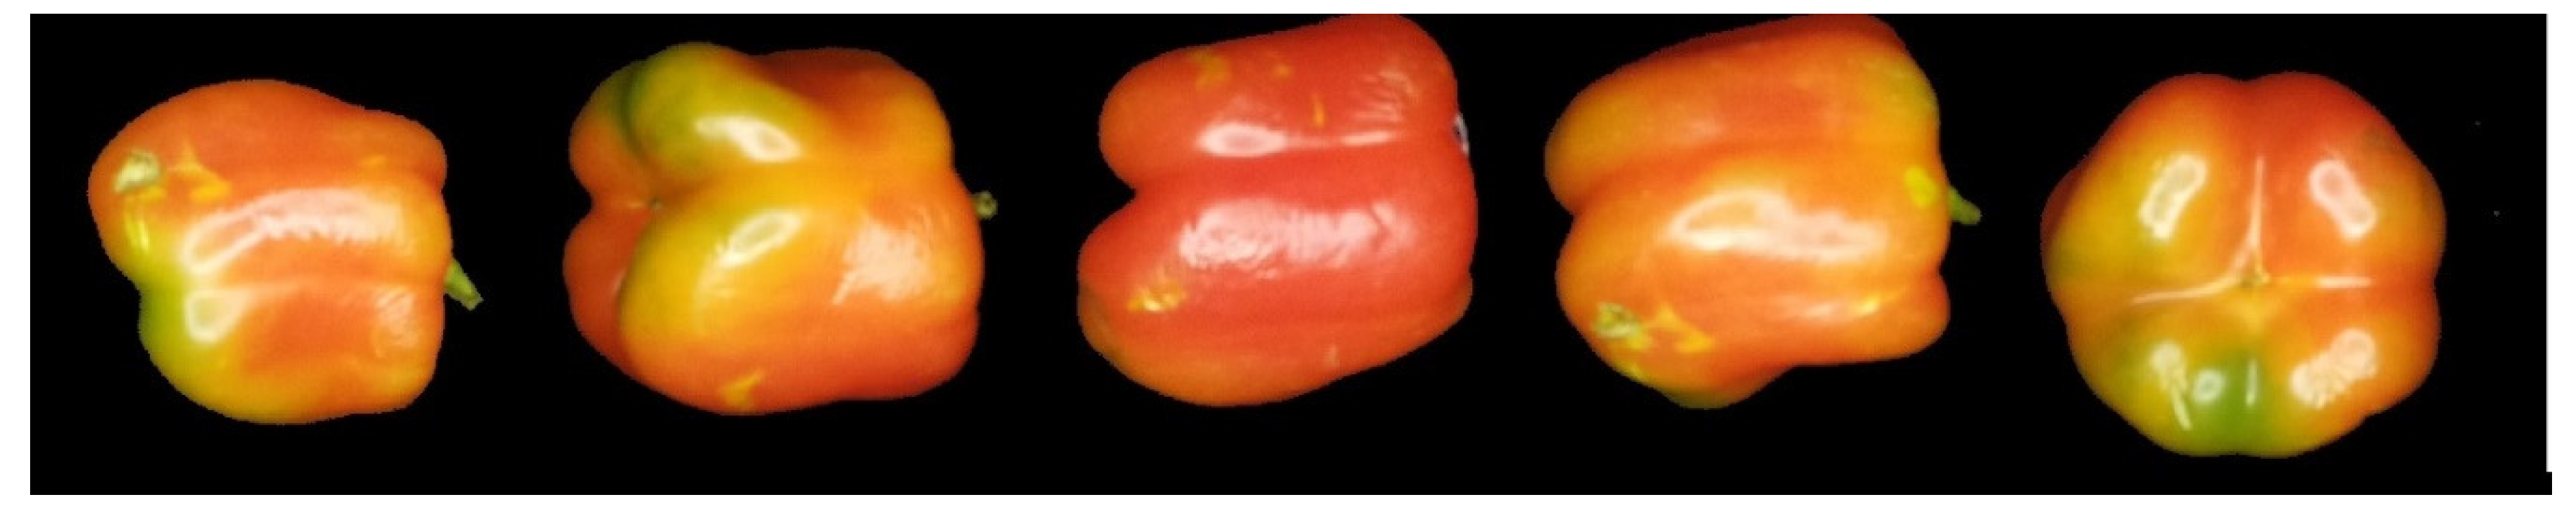
3.1. Samples

A sample set of 50 bell peppers produced in the Laja-Bajió region, Guanajuato, Mexico was analyzed. The selected sample attributes consider different maturity degrees and homogeneous size [45]. For the training of the vision system, fruits with homogeneous and defined colors were chosen. Therefore, samples showing heterogeneous colors with various spots in the pericarp were excluded for this stage but were included for general testing. The bell peppers were classified into four classes, as shown in Figure 2. Class 1 grouped ten green samples. Class 2 was made up of seven yellow fruits. Class 3 was fourteen orange pigmented fruits. In Class 4, nineteen samples with a red hue were grouped.

3.2. General Structure of Artificial Vision System

Figure 3 shows the proposed method for predicting the sugar content of bell pepper. The first step of the proposed method was the acquisition of the image samples using computer vision system (VCS). The second step was the segmentation of the fruit in the image, where the background and the supersaturated pixels were removed. The third step was the masking step to identify the regions of interest with green (GPOI), yellow (YPOI), orange (OPOI), and red (RPOI) pixels. These were obtained by means of four masks that use the red, green, blue (RGB) components of the segmented images. The fourth step was to obtain the areas of each region of interest (GAROI, YAROI, OAROI and RAROI). The fifth step was the classification of the fruit with the areas from the filters. The last step was the prediction of ° Brix, which was done with the class and the areas determined by the masks.

3.3. Image Acquisition

Five images per fruit were captured, as shown in Figure 4. The image format was JPG with a resolution of 768 × 1366 × 3. The acquisition was made with a computational vision system (VSC) that operates with OpenCV-Python language. This was integrated by the isolation, lighting, image capture, and image processing subsystems. The insulation subsystem consisted of a black cabinet of dimensions 38 cm × 38 cm × 43 cm, which allowed the reduction of variations in lighting. The architecture used by the lighting subsystem was a 5.4 W led ring configuration placed 30 cm above sample. The image capture was performed with Raspberry camera module (8 megapixels), and the processing platform was Raspberry Pi 3 card [33].

3.4. Automatic Sample Classification

In the second phase, the degrees and averages of the RGB channels of the segmented images of each fruit were mapped, as shown in Figure 5. G (green) corresponds to samples belonging to Class 1, Y (yellow) label to samples of Class 2, O (orange) label to samples of Class 3, and R (red) label to the samples of Class 4. In the last phase, the regions of interest corresponding to the green, yellow, orange, and red tones were carried out.

3.5. Obtaining Regions of Interest

Obtaining regions of interest used the methodology proposed by Goel et al [32], as shown in Figure 6. (i) The first step required the binarization of the captured images, which was done using the Hue, Saturation, Value (HSV) color space model. This change in the color space model allowed obtaining the frequency of each color in the visible spectrum with component H, the purity of color with component S, and the proximity of the pixel to black and white with component V. The thresholds used to segment the background of the samples were 122 ≤ H ≤ 255, 127 ≤ S ≤ 255, and −0 ≤ V ≤ 255 using a range from 0 to 255. (ii) The second step was segmentation of images of each view of bell pepper using a component connection algorithm, and later all the small regions smaller than 400 pixels that did not correspond to the binarized image of the sample were discriminated. (iii) The last step was to use respective masks to obtain regions of interest due to its color. Table 1 shows the four ranges of the Hue parameters to identify the pixel areas with green (47 ≤ H ≤ 118), yellow (32 ≤ H ≤ 46), orange (15 ≤ H ≤ 32), and red (155 ≤ H ≤ 241) hue of the images. Most of the masks except the red mask one used the range from 0 to 255 for the S and V components to identify the different color regions. The red mask used a smaller range of the S component that allowed the areas with orange and red pixels to be correctly identified. These thresholds were obtained using the 50 samples where each of its segmented images was analyzed. These masks identify the pixels corresponding to the green, yellow, orange, and red shades.

3.6. Maturity Status Estimator

3.6.1. Artificial Neural Network (ANN)

Artificial neural networks (ANN) are mathematical models that emulate the functioning of biological neural networks. This was used in this study for its structural simplicity, learning skills, and its application for the approach, classification, and pattern recognition. Figure 7 presents the ANN architecture that was used to estimate the ° Brix content of the fifty samples presented in Figure 1. Its architecture consisted of an input layer, three hidden layers, and an output layer. The input layer is used to present the training and test patterns that correspond to the GAROI, YAROI, OAROI, and RAROI regions of interest. The hidden first layer used radial base-type activation functions, each of its neurons calculating the similarity between the input and its training set. The second hidden layer adds the values of each neuron from the first hidden layer that are multiplied by their weight associated with each neuron to obtain the class that the sample belongs to. The third layer of neurons employs neurons with sigmoidal-type firing functions where the sample classification information and the four regions of interest were weighted. The output layer is of the linear type, allowing the Brix content to be estimated using the weights associated with the neurons of the third hidden layer.
One of the ANNs most used in classification tasks is radial basis function ANN (RBF-ANN), as shown in Figure 8. Its architecture uses an input layer, hidden layers, and output layer. The input layer is used to present the training and test patterns. The hidden layer is made up of radial (Gaussian) functions that are completely interconnected between all its nodes with the input layer, which are activated by this function. The output layer is activated by the linear functions that determine the classification and is interconnected with all the nodes of the hidden layer.
The proposed RBFNN classification models were developed with Matlab’s Deep Learning Toolbox. The main difference between them is the number of neurons that the hidden layer contains, as shown in Table 2. The inputs used by each classifier are the interest regions with shades of green, yellow, orange, and red and the outputs are the four classes. The model design used 70% of the data for training, 20% for validation, and the rest for the testing stage.
Together, three models of two-layer feed-forward network with sigmoid hidden neurons and linear output neurons (Fitnet) are proposed. Figure 9 presents the architecture of the implemented model to predict the ° Brix content of bell peppers. Three models were proposed where their main difference is the number of neurons in the hidden layer, as shown in Table 3; the precision of each model to predict the ° Brix was different.

3.6.2. Fuzzy Logic

Fuzzy Logic (FL) is a discipline of Artificial Intelligence that analyzes real-world information on a scale between true and false. This is integrated by three stages: fuzzification, the inference that uses a series of linguistic rules, and defuzzification. Figure 10 shows a structure of the fuzzy classification system proposed to classify bell peppers. It has four inputs and one output.
The regions of interest of each shade correspond to the input and are used to identify the degree of maturity associated with the output fuzzy system. It is used to identify segments or regions of interest with shades of green, yellow, orange, and red. The output has different ranges for each class.
Fuzzification of the input variables was carried out with membership functions of triangular type, which are characterized by their easy implementation in hardware. The linguistic variables used were low, medium, and high, as shown in Figure 11, Figure 12, Figure 13 and Figure 14. The mathematical functions of each membership function are described in Equations (1)–(12). Together, the different pixel areas were used to increase the sensitivity of the fuzzy system to infer maturity changes.
L o w G A R O = { 50 G A R O I 50 0 < G A R O I 50   050 < G A R O I 100  
M e d i u m G A R O I { G A R O I 50 0 < G A R O I 50   100 G A R O I 50 50 < G A R O I 100  
H i g h G A R O I = { 00 < G A R O I 50   G A R O I 50 50 50 < G A R O I 100  
L o w Y A R O I = { 29.09 Y A R O I 29.09 0 < Y A R O I 16.48   016.48 < Y A R O I 34.73  
M e d i u m Y A R O I = { Y A R O I 29.09 0 < Y A R O I 29.09   58.17 Y A R O I 29.08 V < Y A R O I 58.17  
H i g h Y A R O I = 00 < Y A R O I 29.09   Y A R O I 29.09 29.09 29.09 < Y A R O I 58.17  
L o w O A R O I = { 16.48 O A R O I 16.48 0 < O A R O I 16.48   O A R O I 34.73 18.25 16.48 < O A R O I 34.37  
M e d i u m O A R O I = { 16.48 O A R O I 16.48 0 < O A R O I 16.48   O A R O I 34.73 18.25 16.48 < O A R O I 34.37  
H i g h O A R O I = { 16.48 O A R O I 16.48 0 < O A R O I 16.48   O A R O I 34.73 18.25 16.48 < O A R O I 34.37  
L o w   R R O I = { 16.48 R R O I 16.48                     0 < R R O I 16.48 R R O I 34.73 18.25         16.48 < R R O I 34.37                
M e d i u m     R R O I = { 16.48 R R O I 16.48                     0 < R R O I 16.48 R R O I 34.73 18.25           16.48 < R R O I 34.37                
H i g h     R R O I = { 16.48 R R O I 16.48                     0 < R R O I 16.48 R R O I 34.73 18.25           16.48 < R R O I 34.37                
Figure 15 shows the fuzzy Takagi–Sugeno model used for the development of the classifier; this was selected for its low computational cost unlike the Mandami model. It uses 81 inference rules obtained from using fuzzy values of interest regions. The transforming fuzzy values of classification output was carried out using Equation (13). The final output is determined by rules using Zi levels of output and weight w i of the rule.
F i n a l   O u t p u t = i = 1 N w i Z i i = 1 18 w i
Five fuzzy classification models were designed using the Matlab R2014a Fuzzy Logic Toolbox. Its training used a set of 50 vectors consisting of areas the interest regions in shades of green, yellow, orange, and red and their label corresponding to their maturity. The training used 10 epochs. The main difference between the models is the number of membership functions. Table 4 shows the number of membership functions used by each model and their training error.
Three models were proposed where their main difference is the number of neurons in the hidden layer, as shown in Table 5; the precision of each model to predict the Brix degrees was different.

4. Results

Figure 16 shows the accuracy of the 10 maturity classifier models using ANN and FL. The first five models are type ANN (blue circles) and the next five models are type FL (red squares). It can be seen that the proposed models which used ANN achieved greater than 90% accuracy, unlike those that used FL. Together, the models that had good precision are Models 13–15. Finally, the worst models were Models 11 and 12 with an accuracy of less than 70%. In Figure 17, the prediction error of the model is presented, where it can be highlighted that the models which use ANN have lower least squared medium error. Five ANN models (blue circles) and three FL models (red squares) are shown.

5. Discussion

The main contribution of this work is the development of a ° Brix content prediction system for bell pepper maturity. According to the results, the models with FL achieved a maximum precision of 88% in identifying the four stages of maturity corresponding to the shades of green, yellow, orange, and red. The models with ANN have 100% precision to identify samples of green and red color similar to the results reported by Elhariri et al. [41]. Of the results obtained, Model 8 was the one that presented a correlation of R = 0.79543 between the green, yellow, orange, and red regions of interest and ° Brix. This result is similar to that reported by Shamili [42] and is slightly superior to those reported by Leiva-Valenzuela et al. [46] (R = 0.788) and Rahman et al. [47] (R = 0.74). The advantage is that our proposal uses a visible RGB camera and they used a high-cost multispectral camera. Figure 18 shows the estimation.

6. Conclusions

In this work, a new classification system is proposed to evaluate the bell peppers maturity using an artificial vision system. According to the results obtained, it can be concluded that the proposed architecture improves the ° Brix prediction using the regions of interest associated with the color of the pericarp. The correlation obtained was R = 0.7929 with the use of the NETFIT-ANN, surpassing the model designed with FL with a correlation of R = 0.696. Together, it was possible to classify 100% of the classes of the samples with the use of a model that uses the RBF-ANN architecture. This architecture presented a better result than the FL models that obtained a maximum accuracy of 88%. The present work demonstrated that it is possible to identify the degrees of maturity of the peppers using an artificial vision system that is sensitive to the total soluble solids content of the fruit. It has the advantage of using a low-cost RGB camera instead of a multispectral one, and it is a non-destructive technique to estimate ° Brix. This vision system model is applicable to real scenarios in the industrial sector such as online processes. Furthermore, it is a system that can be used to predict the ° Brix content in real time. As further research, the development of a prediction system for ascorbic acid, polyphenolics, and various carotenoids has been completed.

Author Contributions

Conceptualization, M.-J.V.-A., M.-G.B.-S. and A.-I.B.-G.; methodology, J.-A.P.-M.; software, M.-J.V.-A.; validation, M.-G.B.-S.; formal analysis, J.L.V.-V.; investigation, R.-G.G.-G.; data curation, F.-J.G.-R.; writing—original draft preparation, M.-G.B.-S. and M.-J.V.-A.; writing—review and editing, A.-I.B.-G.; and supervision, A.-I.B.-G. All authors have read and agreed to the published version of the manuscript.

Funding

This research was funded by CONACyT and Tecnológico Nacional de Mexico.

Conflicts of Interest

The authors declare no conflict of interest.

Link to Images Database

References

  1. Tadesse, T.; Hewett, E.W.; Nichols, M.A.; Fisher, K.J. Changes in physicochemical attributes of sweet pepper cv. Domino during fruit growth and development. Sci. Hortic. 2002, 93, 91–103. [Google Scholar] [CrossRef]
  2. Frank, C.A.; Nelson, R.G.; Simonne, E.H.; Behe, B.K.; Simonne, A.H. Consumer preferences for color, price, and vitamin C content of bell peppers. HortScience 2001, 36, 795–800. [Google Scholar] [CrossRef] [Green Version]
  3. Luning, P.A.; van der Vuurst, D.V.R.; Yuksel, D.; Ebenhorst-Seller, T.; Wichers, H.J.; Roozen, J.P. Combined instrumental and sensory evalu- ation of flavor of fresh bell peppers (Capsicum annuum) harvested at three maturation stages. J. Agric. Food Chem. 1994, 42, 2855–2861. [Google Scholar] [CrossRef]
  4. Saltveit, M.E., Jr. Carbon dioxide, ethylene, and color development in ripening mature green bell peppers. J. Am. Soc. Hortic. Sci. 1977, 102, 523–525. [Google Scholar]
  5. Howard, L.R.; Hernandez-Brenes, C. An-tioxidant content and market quality of jalapeno pepper rings as affected by minimal processing and modified atmosphere packaging. J. Food Qual. 1998, 21, 317–327. [Google Scholar] [CrossRef]
  6. Howard, L.R.; Talcott, S.T.; Brenes, C.H.; Villalon, B. Changes in phytochemical and antioxidant activity of selected pepper cultivars (Capsicum species) as influenced by maturity. J. Agric. Food Chem. 2000, 48, 1713–1720. [Google Scholar] [CrossRef]
  7. Hornero-Mendez, D.; Minguez-Mosquera, M.I. Xanthophyll esterification accompanying carotenoid overaccumulation in chromoplast of Capsicumannuum ripening fruits is a constitutive process and useful for ripeness index. J. Agric. Food Chem. 2000, 48, 1617–1622. [Google Scholar] [CrossRef]
  8. Hornero-Mendez, D.; Minguez-Mosquera, M.I. Rapid spectrophotometric determination of red and yellow isochromic carotenoid fractions in paprika and red pepper oleoresins. J. Agric. Food Chem. 2001, 49, 3584–3588. [Google Scholar] [CrossRef]
  9. Markus, F.; Daood, H.G.; Kapitany, J.; Biacs, P.A. Change in the carotenoid and antioxidant content of spice red pepper (paprika) as a function of ripening and some technological factors. J. Agric. Food Chem. 1999, 47, 100–107. [Google Scholar] [CrossRef]
  10. Minguez-Mosquera, M.; Hornero-Mendez, D. Comparative study of the effect of paprika processing on the carotenoids in peppers (Capsi- cum annuum) of the Bola andAgridulce varieties. J. Agric. Food Chem. 1994, 42, 1555–1560. [Google Scholar] [CrossRef]
  11. Curl, A.L. The carotenoids of red bell peppers. J. Agric. Food Chem. 1962, 10, 504–509. [Google Scholar] [CrossRef]
  12. Molinari, A.F.; De Castro, L.R.; Antoniali, S.; Pornchaloempong, P.; Fox, A.J.; Sargent, S.A.; Lamb, E.M. The potential for bell pepper harvest before full color development. Proc. Fla. State Hort. Soc. 2000, 112, 143–146. [Google Scholar]
  13. Osuna-Garcia, J.A.; Wall, M.M.; Waddell, C.A. Endogenous levels of tocopherols and ascorbic acid during fruit ripening of new Mexi-can-type chile (Capsicum nnuum L.) cultivars. J. Agric. Food Chem. 1998, 46, 5093–5096. [Google Scholar] [CrossRef]
  14. Russo, V.M.; Howard, L.R. Carotenoids in pungent and nonpungent peppers at various developmental stages grown in the field and glasshouse. J. Sci. Food Agric. 2002, 82, 615–624. [Google Scholar] [CrossRef]
  15. Ryall, A.L.; Lipton, W.J. Handling transportation and storage of fruits and vegetables. In Vegetables and Melons, 2nd ed.; AVI Publ. Co.: Westport, CT, USA, 1979; p. 587. [Google Scholar]
  16. Yahia, E.M.; Contreras-Padilla, M.; Gonzalez-Aguilar, G. Ascorbic acid content in relation to ascorbic acid oxidase activity and polyamine content in tomato and bell pepper fruits during development, maturation and senescence. LWT 2001, 34, 452–457. [Google Scholar] [CrossRef] [Green Version]
  17. Matsufuji, H.; Nakamura, H.; Chino, M.; Takeda, M. Antioxidant activity of capsanthin and the fatty acid esters in paprika (Capsicum annuum). J. Agric. Food Chem. 1998, 46, 3468–3472. [Google Scholar] [CrossRef]
  18. Cantliffe, D.J.; Goodwin, P. Red color enhancement of pepper fruits by multiple applications of ethephon. J. Am. Soc. Hortic. Sci. 1975, 100, 157–161. [Google Scholar]
  19. Simonne, A.H.; Simonne, E.H.; Eitenmiller, R.R.; Mills, H.A.; Green, N.R. Ascorbic Acid and Provitamin A Contents in Unusually Colored Bell Peppers (Capsicum annuum L.). J. Food Compos. Anal. 1997, 10, 299–311. [Google Scholar] [CrossRef]
  20. Garcia-Mier, L.; Jimenez-Garcia, S.N.; Guevara-González, R.G.; Feregrino-Perez, A.A.; Contreras-medina, L.M.; Torres-Pacheco, I. Elicitor Mixtures Significantly Increase Bioactive Compounds, Antioxidant Activity, and Quality Parameters in Sweet Bell Pepper. J. Chem. 2015, 2015, 269296. [Google Scholar] [CrossRef] [Green Version]
  21. Chávez-Mendoza, C.; Sanchez, E.; Muñoz-Marquez, E.; Sida-Arreola, J.P.; Flores-Cordova, M.A. Bioactive Compounds and Antioxidant Activity in Different Grafted Varieties of Bell Pepper. Antioxidants 2015, 4, 427–446. [Google Scholar] [CrossRef] [Green Version]
  22. Chen, H.Z.; Zhang, M.; Bhandari, B.; Guo, Z. Evaluation of the freshness of fresh-cut green bell pepper (Capsicum annuum var. grossum) using electronic nose. LWT 2018, 87, 77–84. [Google Scholar] [CrossRef] [Green Version]
  23. Baenas, N.; Belović, M.; Ilic, N.; Moreno, D.A.; García-Viguera, C. Industrial use of pepper (Capsicum annum L.) derived products: Technological benefits and biological advantages. Food Chem. 2019, 274, 872–885. [Google Scholar] [CrossRef] [PubMed]
  24. Wan, P.; Toudeshki, A.; Tan, H.; Ehsani, R. A methodology for fresh tomato maturity detection using computer vision. Comput. Electron. Agric. 2018, 146, 43–50. [Google Scholar] [CrossRef]
  25. Zhang, B.; Gu, B.; Tian, G.; Zhou, J.; Huang, J.; Xiong, Y. Challenges and solutions of optical-based nondestructive quality inspection for robotic fruit and vegetable grading systems: A technical review. Trends Food Sci. Technol. 2018, 81, 213–231. [Google Scholar] [CrossRef]
  26. Li, C.; Cao, Q.; Guo, F. A method for color classification of fruits based on machine vision. WSEAS Trans. Syst. 2009, 8, 312–321. [Google Scholar]
  27. Cavallo, D.P.; Cefola, M.; Pace, B.; Logrieco, A.F.; Attolico, G. Non-destructive automatic quality evaluation of fresh-cut iceberg lettuce through packaging material. J. Food Eng. 2018, 223, 46–52. [Google Scholar] [CrossRef]
  28. Huang, Y.; Lu, L.R.; Chen, K. Prediction of firmness parameters of tomatoes by portable visible and near-infrared spectroscopy. J. Food Eng. 2018, 222, 185–1984. [Google Scholar] [CrossRef]
  29. Guo, W.; Li, W.; Yang, B.; Zhu, Z.Z.; Liu, D.; Zhu, X. A novel noninvasive and cost-effective handheld detector on soluble solids content of fruits. J. Food Eng. 2019, 257, 1–9. [Google Scholar] [CrossRef]
  30. Munera, S.; Besada, C.; Aleixos, N.; Talens, P.; Salvador, A.; Sun, D.W.; Cubero, S.; Blasco, J. Non-destructive assessment of the internal quality of intact persimmon using colour and VIS/NIR hyperspectral imaging. LWT 2017, 77, 241–248. [Google Scholar] [CrossRef] [Green Version]
  31. Estrada, B.; Bernal, M.A.; Diaz, J.; Pomar, F.; Merino, F. Fruit development in Capsicum annuum: Changes in capsaicin, lignin, free phenolics, and peroxidase patterns. J. Agric. Food Chem. 2000, 48, 6234–6239. [Google Scholar] [CrossRef]
  32. Goel, N.; Sehgal, P. Fuzzy classification of pre-harvest tomatoes for ripeness estimation—An approach based on automatic rule learning using decision tree. Appl. Soft Comput. J. 2015, 36, 45–56. [Google Scholar] [CrossRef]
  33. Villaseñor-Aguilar, M.J.; Botello-Álvarez, J.E.; Pérez-Pinal, F.J.; Cano-Lara, M.; León-Galván, M.F.; Bravo-Sánchez, M.G.; Barranco-Gutierrez, A.I. Fuzzy classification of the maturity of the tomato using a vision system. J. Sensors 2019, 2019, 1–12. [Google Scholar] [CrossRef]
  34. Constante, P.; Gordon, A.; Chang, O.; Pruna, E.; Acuna, F.; Escobar, I. Artificial Vision Techniques to Optimize Strawberrys Industrial Classification. IEEE Lat. Am. Trans. 2016, 14, 2576–2581. [Google Scholar] [CrossRef]
  35. Fashi, M.; Naderloo, L.; Javadikia, H. The relationship between the appearance of pomegranate fruit and color and size of arils based on image processing. Postharvest Biol. Technol. 2019, 154, 52–57. [Google Scholar] [CrossRef]
  36. Osterloh, A.; Ebert, G.; Held, W.-H. Lagerung von Obst Und Südfrüchten; Verlag Ulmer: Stuttgart, Germany, 1996; p. 253. [Google Scholar]
  37. Wills, R.B.H.; McGlasson, B.; Graham, D.; Joyce, D. Postharvest: An Introduction to the Physiology and Handling of Fruit, Vegetables and Ornamentals; CAB International: New York, NY, USA, 1998; p. 262. [Google Scholar]
  38. Kays, S. Postharvest Biology; Exon Press: Athens, GA, USA, 2004; p. 568. [Google Scholar]
  39. El-Mesery, H.S.; Mao, H.; Abomohra, A.E.-F. Applications of Non-destructive Technologies for Agricultural and Food Products Quality Inspection. Sensors 2019, 19, 846. [Google Scholar] [CrossRef] [Green Version]
  40. Harel, B.; Parmet, Y.; Edan, Y. Maturity classification of sweet peppers using image datasets acquired in different times. Comput. Ind. 2020, 121, 103274. [Google Scholar] [CrossRef]
  41. Elhariri, E.; El-Bendary, N.; Hussein, A.M.M.; Hassanien, A.E.; Badr, A. Bell Pepper Ripeness Classification based on Support Vector Machine. In Proceedings of the 2014 International Conference on Engineering and Technology (ICET), Cairo, Egypt, 19–20 April 2014. [Google Scholar]
  42. Shamili, M. The estimation of mango fruit total soluble solids using image processing technique. Sci. Hortic. 2019, 249, 383–389. [Google Scholar] [CrossRef]
  43. Li, X.; Wei, Y.; Xu, J.; Feng, X.; Wu, F.; Zhou, R.; Jin, J.; Xu, K.; Yu, X.; He, Y. SSC and pH for sweet assessment and maturity classification of harvested cherry fruit based on NIR hyperspectral imaging technology. Postharvest Biol. Technol. 2018, 143, 112–118. [Google Scholar] [CrossRef]
  44. Teerachaichayut, S.; Huong, T.H. Non-destructive prediction of total soluble solids, titratable acidity and maturity index of limes by near infrared hyperspectral imaging. Postharvest Biol. Technol. 2017, 133, 20–25. [Google Scholar] [CrossRef]
  45. Arias, R.; Lee, T.-C.; Logendra, L.; Janes, H. Correlation of Lycopene Measured by HPLC with the L*, a*, b* Color Readings of a Hydroponic Tomato and the Relationship of Maturity with Color and Lycopene Content. J. Agric. Food Chem. 2000, 48, 1697–1702. [Google Scholar] [CrossRef]
  46. Leiva-Valenzuela, G.A.; Lu, R.; Aguilera, J.M. Prediction of firmness and soluble solids content of blueberries using hyperspectral reflectance imaging. J. Food Eng. 2013, 115, 91–98. [Google Scholar] [CrossRef]
  47. Rahman, A.; Kandpal, L.M.; Lohumi, S.; Kim, M.S.; Lee, H.; Mo, C.; Cho, B.-K. Nondestructive Estimation of Moisture Content, pH and Soluble Solid Contents in Intact Tomatoes Using Hyperspectral Imaging. Appl. Sci. 2017, 7, 109. [Google Scholar] [CrossRef]
Figure 1. Distribution of Brix Grades in different stages of maturity.
Applsci 10 05097 g001
Figure 2. Samples of bell peppers in different degrees of maturity.
Applsci 10 05097 g002
Figure 3. Proposed method to classify degrees of maturity in the bell pepper.
Applsci 10 05097 g003
Figure 4. Images acquired by vision system.
Applsci 10 05097 g004
Figure 5. Mapping averages of the red, green, blue (RGB) channels for four classes of bell peppers.
Applsci 10 05097 g005
Figure 6. Pre-processing of images: (i) binarization of the image captured from the fruit; (ii) segmentation of the image and discrimination of areas; (iii) obtaining segmented sample applying the green mask of interest region; (iv) obtaining segmented sample applying the yellow mask of interest region; (v) obtaining segmented sample applying the orange mask of interest region; and (vi) obtaining segmented sample applying the red mask of interest region.
Applsci 10 05097 g006
Figure 7. Brix prediction Artificial neural networks (ANN) model.
Applsci 10 05097 g007
Figure 8. RBF-ANN maturity classifier.
Applsci 10 05097 g008
Figure 9. Architectural description of the model for ° Brix prediction using Fitnet.
Applsci 10 05097 g009
Figure 10. Fuzzy maturity classifier.
Applsci 10 05097 g010
Figure 11. Membership functions of GAROI input.
Applsci 10 05097 g011
Figure 12. Membership functions of YAROI input.
Applsci 10 05097 g012
Figure 13. Membership functions of OAROI input.
Applsci 10 05097 g013
Figure 14. Membership functions of RAROI input.
Applsci 10 05097 g014
Figure 15. Operation of Takagi–Sugeno rules to classify maturity of bell peppers.
Applsci 10 05097 g015
Figure 16. Comparison of maturity prediction models.
Applsci 10 05097 g016
Figure 17. Comparison of ° Brix prediction models.
Applsci 10 05097 g017
Figure 18. The samples ° Brix was measured with refractometry. The measurements are presented as circles and the proposed system’s estimates are indicated by squares.
Applsci 10 05097 g018
Table 1. Segmentation mask thresholds.
Green Mask
H minH maxS minS maxV minV max
4711802550255
Yellow Mask
H minH maxS minS maxV minV max
324602550255
Orange Mask
H minH maxS minS maxV minV max
153202550255
Red Mask
L minL minL minL minL minL min
241155112470255
Table 2. RBF-ANN maturity classifier.
InputsNumber of Neurons in the Hidden LayerOutputEpochsAccuracy
Model 14441092%
Model 24541098%
Model 348410100%
Model 4410410100%
Model 5415410100%
Table 3. Models using neural network Feedback prediction of Brix degrees.
InputsNumber of Neurons in the Hidden LayerOutputEpochsMean Squared Error (MSE)Pearson Correlation Coefficient (R)
Model 6441100.54830.68659
Model 7451100.50130.50130
Model 8481100.50160.73176
Model 94101100.46760.75910
Model 104151100.38880.79543
Table 4. Classification models.
Number of GROI Membership FunctionsNumber of YROI Membership FunctionsNumber of OROI Membership FunctionsNumber of RROI Membership FunctionsTraining Error RMSE 1 × 10⁻⁶
Model 112222930.46
Model 123223479.86
Model 13233219.466
Model 1433339.8679
Model 1544442.0339
Table 5. Models using FL prediction of ° Brix.
Number of GROI Membership FunctionsNumber of YROI Membership FunctionsNumber of OROI Membership FunctionsNumber of RROI Membership FunctionsMean Squared Error (MSE)Root Mean Squared Error (RMSE)Pearson Correlation Coefficient (R)
Model 1633335.9232.4330.499
Model 1743340.8910.9440.696
Model 1834431.6451.2820.424

