Article

A Novel Variable Step Size Incremental Conductance Method with an Adaptive Scaling Factor

Department of Electrical Engineering, National Taiwan University of Science and Technology, Da’an District, Taipei 10607, Taiwan
*
Author to whom correspondence should be addressed.
Appl. Sci. 2020, 10(15), 5214; https://doi.org/10.3390/app10155214
Submission received: 19 June 2020 / Revised: 22 July 2020 / Accepted: 27 July 2020 / Published: 29 July 2020
(This article belongs to the Special Issue Applied Optimization in Clean and Renewable Energy: New Trends)

Abstract

:
In this paper, a novel variable step size (VSS) incremental conductance (INC) method with an adaptive scaling factor is proposed. The proposed technique utilizes the model-based state estimation method to calculate the irradiance level and then determine an appropriate scaling factor accordingly to enhance the capability of maximum power point tracking (MPPT). The fast and accurate tracking can be achieved by the presented method without the need for extra irradiance and temperature sensors. Only the voltage-and-current sets of any two operating points on the characteristic curve are needed to estimate the irradiance level. By choosing a proper scaling factor, the performance of the conventional VSS INC method can be improved. To validate the studied algorithm, a 600 W prototyping circuit is constructed and the performances are demonstrated experimentally. Compared to conventional VSS INC methods under the tested conditions, the tracking time is shortened by 31.8%. The tracking accuracy is also improved by 2.1% and 3.5%, respectively. Besides, tracking energy loss is reduced by 43.9% and 29.9%, respectively.

Graphical Abstract

1. Introduction

Solar power is clean, safe, and pollution-free. Furthermore, no rotating parts are required during the assembly and operation of solar generation systems (SGS). Consequently, solar power is among the most valuable of green energy resources. Because of their ease of installation, SGSs are widely accepted and popular in remote areas [1]. However, SGSs have high construction costs, and their power output is affected by solar irradiance and panel temperature. Hence, many researchers have examined methods to maximize the available output power of SGSs, and have presented a number of maximum power point tracking (MPPT) methods. Traditional MPPT techniques (e.g., hill-climbing, perturbation, and observation (P&O), and incremental conductance (INC) are algorithms that are easy to implement and widely applied [2]. However, for such methods, the main problem lies in the tradeoff of the perturbation step in the MPPT process, because the appropriateness of the perturbation step size has a considerable impact on the transient response dynamics and steady-state oscillation. A small perturbation step leads to slow transient response, while a large perturbation step aggravates steady-state oscillation.
To address the above-mentioned problem, researchers have presented several novel MPPT algorithms, which can be applied to a rapidly-changing environment and provide good transient response dynamics and low steady-state oscillation [3,4,5,6,7,8,9,10,11,12,13,14,15,16,17,18,19]. Specifically, these new MPPT algorithms include variable step size (VSS) techniques that adopt several fixed steps, defined by operating points [3,4], adaptive VSS algorithms [5,6,7,8,9,10,11,12,13,14,15], methods that estimate MPP locations by mathematical models [16], and advanced algorithms that calculate maximum power point (MPP) by fuzzy controllers [17], extremum seeking control [18], and sliding mode control [19]. Among these algorithms, attention has been given to the adaptive VSS algorithms because they enable the simple calculation and are easy to be realized and integrated with common P&O or INC algorithms. For the adaptive VSS algorithms, the perturbation step is determined based on the following: (1) slope of power to voltage (dP/dV) [5,7,10,11,12,15]; (2) derivative of power to duty cycle (dP/dD) [6]; (3) tangent of power to current (dP/dI) [8]; (4) gradient of current to duty cycle (dI/dD) [9]; (5) derivative of power to the difference between voltage and current (dP/(dV−dI)) [13]; (6) power variation (dP) [14]. In the adaptive VSS algorithms, the above variables must be multiplied by a scaling factor to determine the required perturbation step. However, the performance of the adaptive VSS algorithm is essentially decided by the scaling factor. Manual adjusting of this parameter is slow and tedious, and a particular selection of the constant scaling factor only achieves optimal performance in a certain irradiance level. That is, if the same scaling factor is used under all irradiance levels, system performance is optimal only under one specific condition but is relatively worse (including oscillation or slow dynamics) under other conditions. Hence, adjusting the scaling factor automatically by (k − k2*P) has been proposed to solve these problems [12]; however, this method requires that the two constant values (k1 and k2) be determined, and it is impossible to ensure that the two values are optimal. Alternatively, selecting two different scaling factor values according to the irradiance level range (i.e., high irradiance and low irradiance) may offer a solution [14]. Nonetheless, system performance cannot be optimized under other irradiance levels.
Partial shading is another major issue in SGS where the shade of objects in the environment, such as clouds, trees, and buildings causes multiple peaks in the power versus voltage curve of the solar panel. Conventional MPPT techniques cannot deal with partially shaded conditions (PSCs) because they cannot distinguish local MPP and global MPP (GMPP). To deal with PSC, specially designed MPPT algorithms are typically required, these methods can be categorized into (1) soft computing (SC) related techniques and (2) two-stage methods. For the first category, particle swarm optimization [20], grey wolf optimization (GWO) [21], transfer reinforcement learning approach [22], and Q-learning algorithm [23] are applied to find the real GMPP. However, the complexity of these algorithms raises questions about its practical implementation into a low-cost microcontroller. For the second category, a scan is initially conducted to find all the possible “candidate intervals” of GMPP, and a second stage is then utilized to find the exact GMPP location. Among this category, Liu et al. [24] employed a fixed-spacing segmentation, Patel and Agarwal [25] utilized a tentative simulation, Boztepe et al. [26] used restrictive voltage windows, and Wang et al. [27] applied a search-and-skip process to find the candidate interval. In the second stage, P&O [24,25,26] and INC [27] are utilized. Overall the search for the GMPP in this category generally involves a candidate interval locating method and an approach to maintain the GMPP which is simply identical to the local MPP tracking algorithm. Consequently, the proposed technique can also be integrated with some developed candidate interval locating method, which will be left as a future work for this paper, to track the GMPP.
As such, this study proposes a novel VSS INC MPPT method with an adaptive scaling factor. The proposed technique is similar to the conventional adaptive VSS algorithm, but with one additional feature that incorporates an adaptive mechanism that guarantees the optimal selection of the scaling factor according to the operating conditions. To the best of the author’s knowledge, this is the first research work that constantly adapts the scaling factor according to the irradiance levels. Besides, the proposed method is simple and can easily be integrated into the original SGS firmware. Firstly, intensive simulations are utilized to find the corresponding scaling factor that serves to optimize system performance. Secondly, the irradiance estimation method proposed in [19] is employed to estimate the current irradiance level. Based on the acquired irradiance level, an appropriate scaling factor is adopted and then the VSS INC MPPT technique is performed. The proposed method has the advantages of easy implementation and simple calculation. Besides, optimal performance can be guaranteed under fast-changing environments. Comparing with conventional adaptive VSS INC MPPT technique, the proposed method can improve both the transient response and steady-state oscillation.

2. Determination of the Optimal Scaling Factor Values

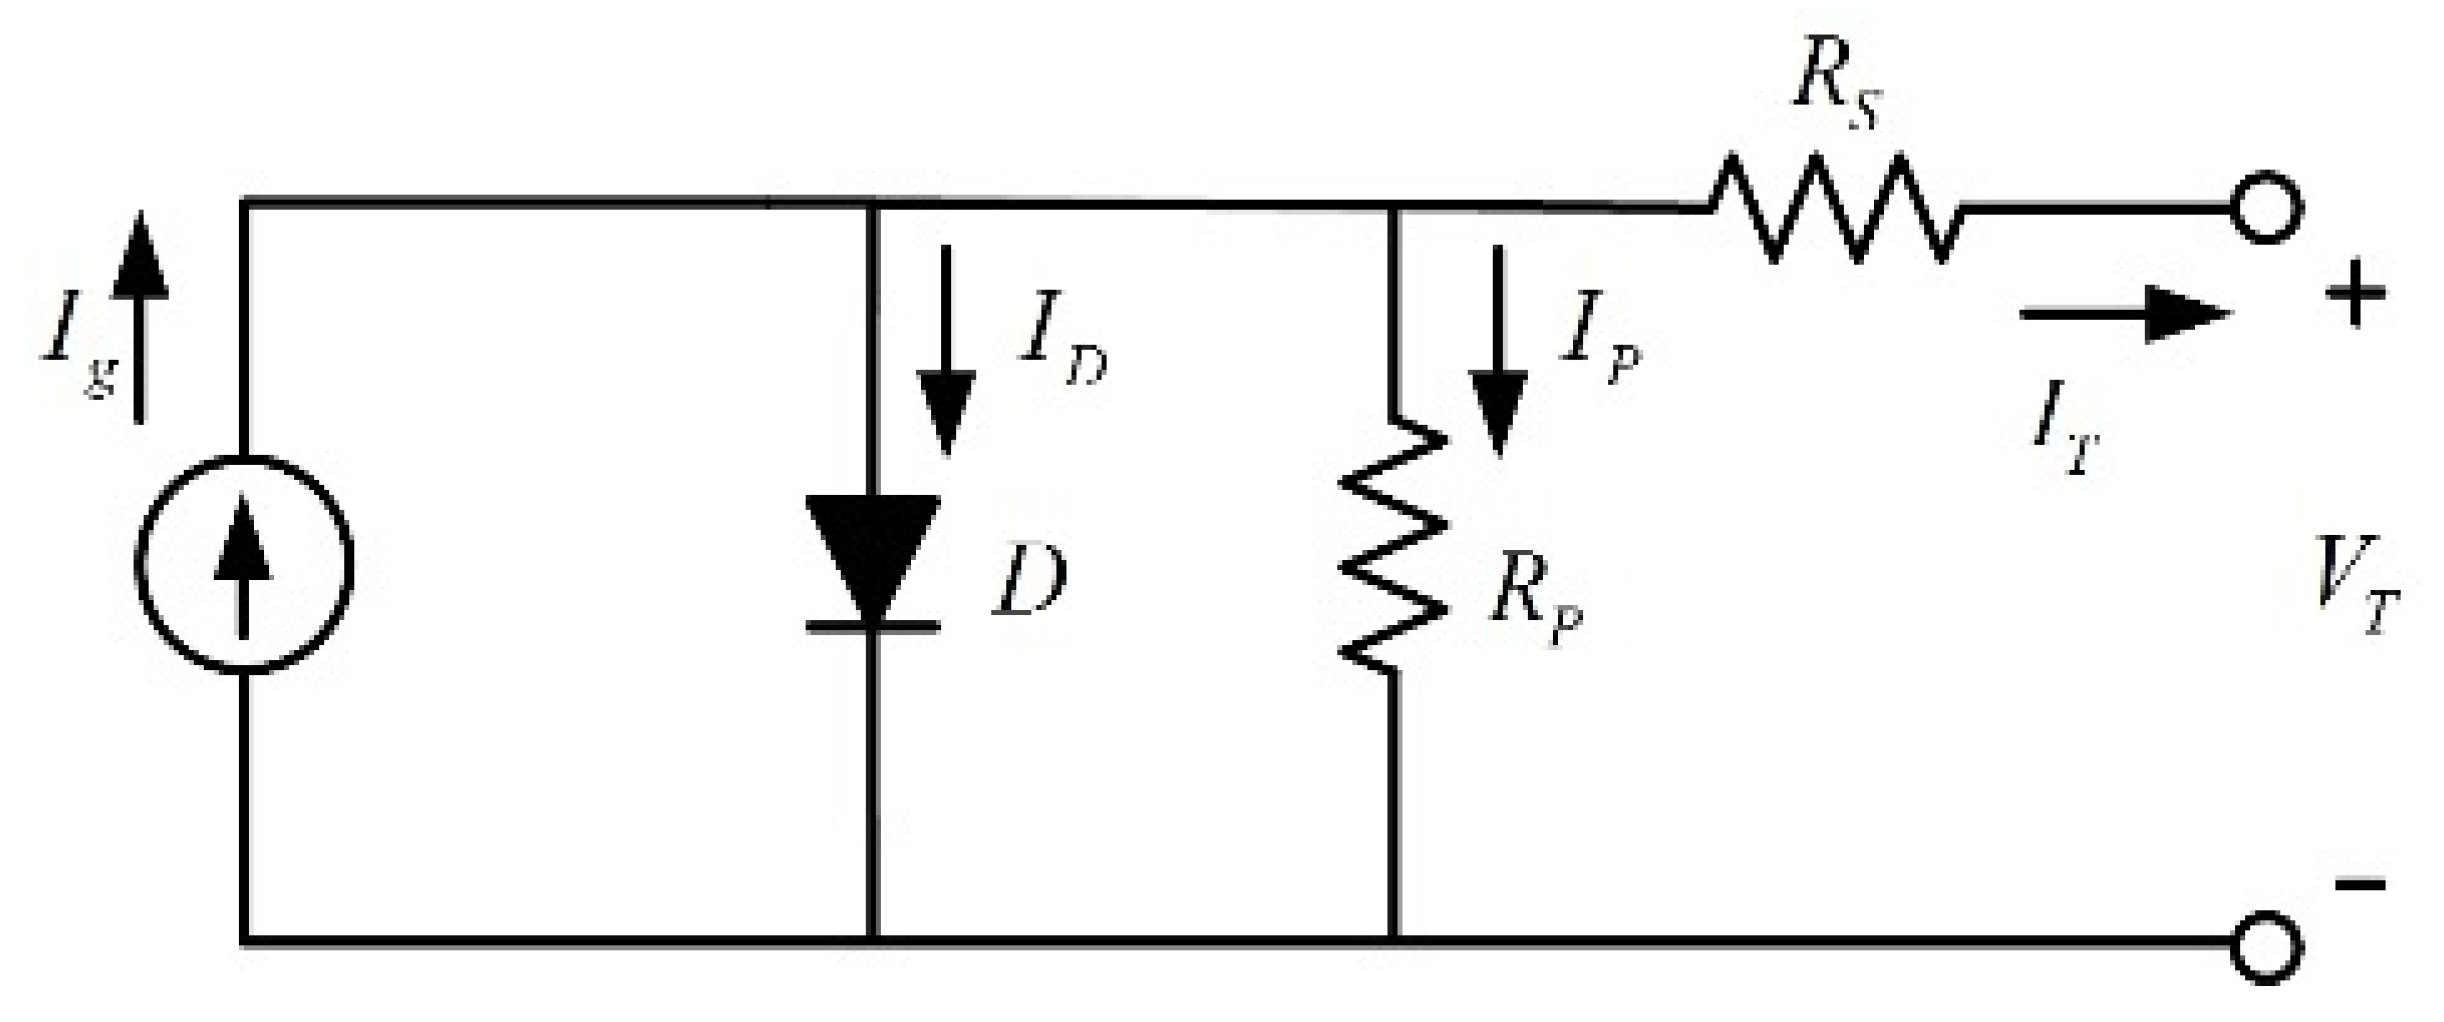
2.1. Solar Cell Characteristics

A solar cell can be modeled as an equivalent circuit as shown in Figure 1. The equivalent circuit includes a current source Ig, a diode D, a series equivalent resistance Rs, and a parallel equivalent resistance Rp. The relationship of the output voltage and output current of a solar cell can then be represented by Equation (1).
I T = I g I S { e [ q ( R s I T + V T ) K A T N ] 1 } R s I T + V T R P
where A is the quality factor, K is the Boltzmann’s constant, N is the number of cells connected in series, q is the electron charge, T is the temperature in Kelvin and Ig, IT, and Is are the photogenerated current, panel current, and saturation currents, respectively. The Ig can be represented by
I g = S 1000 × I S C
where ISC stands for the short-circuit current of the PV module, and S is the irradiance level. Typically, the parallel equivalent resistance is much larger than the series equivalent resistance, and the RS is small. Then, a concise form can be derived by neglecting the RP and RS to simplify (1)
I T ( V T , S , T ) = S 1000 × I S C I s ( e q V T K A T N 1 )

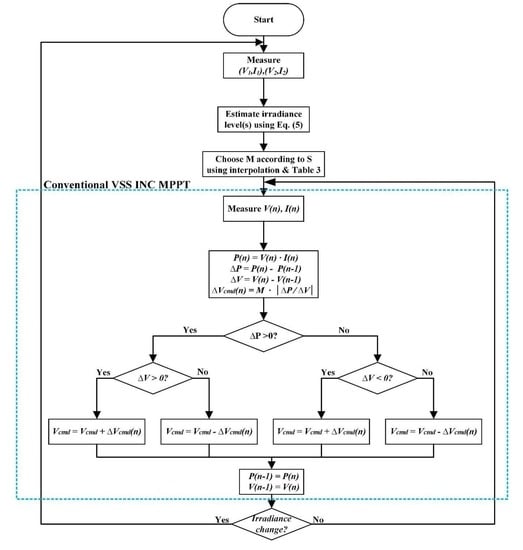
2.2. Conventional VSS INC MPPT Algorithm

Conventionally, the perturbation step size of the INC MPPT method is fixed. When a large perturbation step is used, the dynamic response will be quick, but there will exist a large steady-state oscillation. A small perturbation step has a favorable steady-state response, but the dynamic response will be slowed down. Therefore, how to obtain a balance between the dynamic response and the steady-state response becomes a major problem of the conventional INC MPPT method.
To improve the performance, the fixed perturbation step size is replaced by the slope of power to voltage in VSS INC MPPT methods, as shown in Equation (4).
V ( n + 1 ) = V ( n ) ± M | d P d V |
The scaling factor (M) which is a constant in scalar form is an important parameter of the VSS INC MPPT technique. However, the selection of the scaling factor M remains one difficulty for the implementation of the VSS methods. A large value of M is beneficial for the tracking speed; however, it will result in substantial oscillations around the MPP. In contrast, a small value of M can cause the MPP tracking speed becomes slow. For different conditions, the derived scaling factor is different, which limits the universality of the method. Therefore, a novel VSS INC MPPT method with an adaptive scaling factor is proposed in this study. The determination process of optimal scaling factors will be provided in the next subsections.

2.3. Optimal Scaling Factor for Different Irradiance Levels

In this study, the optimal scaling factors for different irradiance levels are obtained via intensive simulations. To fairly evaluate and compare the acquired results of different scaling factor values, tracking energy loss (Eloss) is utilized as a performance index in this study. Tracking energy loss is adopted because it can simultaneously take the tracking time and steady-state tracking accuracy into account. Figure 2 shows a typical tracking response of one MPP tracking curve under certain irradiance level and panel temperature. The tracking energy loss in this study is defined as the area between the exact MPP and the power tracking curve within a certain time interval, as shown in the shaded part of Figure 2. To take both transient and steady-state responses into account, the total simulation time was set as 10 s. This study simulated 10 possible operating conditions (10 irradiance levels (100 W/m2–1000 W/m2) with the interval of 100 W/m2 under constant panel temperature (25 °C)). In this study, the range of tested scaling factor is 0.1–10.0. With the interval of 0.01, there are 990 possible scaling factor values and the scaling factor with the best tracking energy loss under 10 different operating conditions will be recorded. The parameters used for the simulations are as detailed in Table 1 and Table 2, the obtained optimal scaling factor values are listed in Table 3.

3. Description of the Proposed Method

3.1. Irradiance Level Estimation Method

In this study, the state estimation method proposed in [16] is adopted to estimate the irradiance level. The fundamental of the state estimation is that the system parameters wanted to know can be obtained through the time history of measurements and system function. The common approach utilized to solve state estimation is the weighted least square technique. In this study, the solar irradiance and the panel temperature are treated as system parameters. The measured voltages and currents at different time periods and the characteristic output function of SGS are regarded as the time history of measurements and system function, respectively. It can be observed from (3) that provided the two values of the IT and VT were measured, then both S and T can be obtained. Using Equation (3), the Jacobian Matrix and the current mismatch vector can be calculated as Equation (5) and Equation (6)
[ H j ] = [ I T 1 ( S j , T j , V 1 ) S I T 1 ( S j , T j , V 1 ) T I T 2 ( S j , T j , V 2 ) S I T 2 ( S j , T j , V 2 ) T ] = [ H 11 , j H 12 , j H 21 , j H 22 , j ]
[ Δ I n ] = [ I ( S n , T n , V 1 ) I 1 I ( S n , T n , V 2 ) I 2 ] = [ Δ I 1 , n Δ I 2 , n ]
Using two measurement sets (V1, I1) and (V2, I2) for time t1 and t2, the irradiance level S can be solved iteratively using Equation (7).
S n + 1 = S n + J 11 , n Δ I 1 , n + J 12 , n Δ I 2 , n
where D = H 11 , n H 22 , n H 12 , n H 21 , n , J 11 , n = 1 D H 22 , n , J 12 , n = 1 D H 12 , n . Using Equation (3), the elements in the Jacobian matrix can be calculated as H 11 , n = I S C 1000 , H 12 , n = I S × q V 1 K A T 2 N × e q V 1 K A T N
H 21 , n = I S C 1000 , H 22 , n = I S × q V 2 K A T 2 N × e q V 2 K A T N

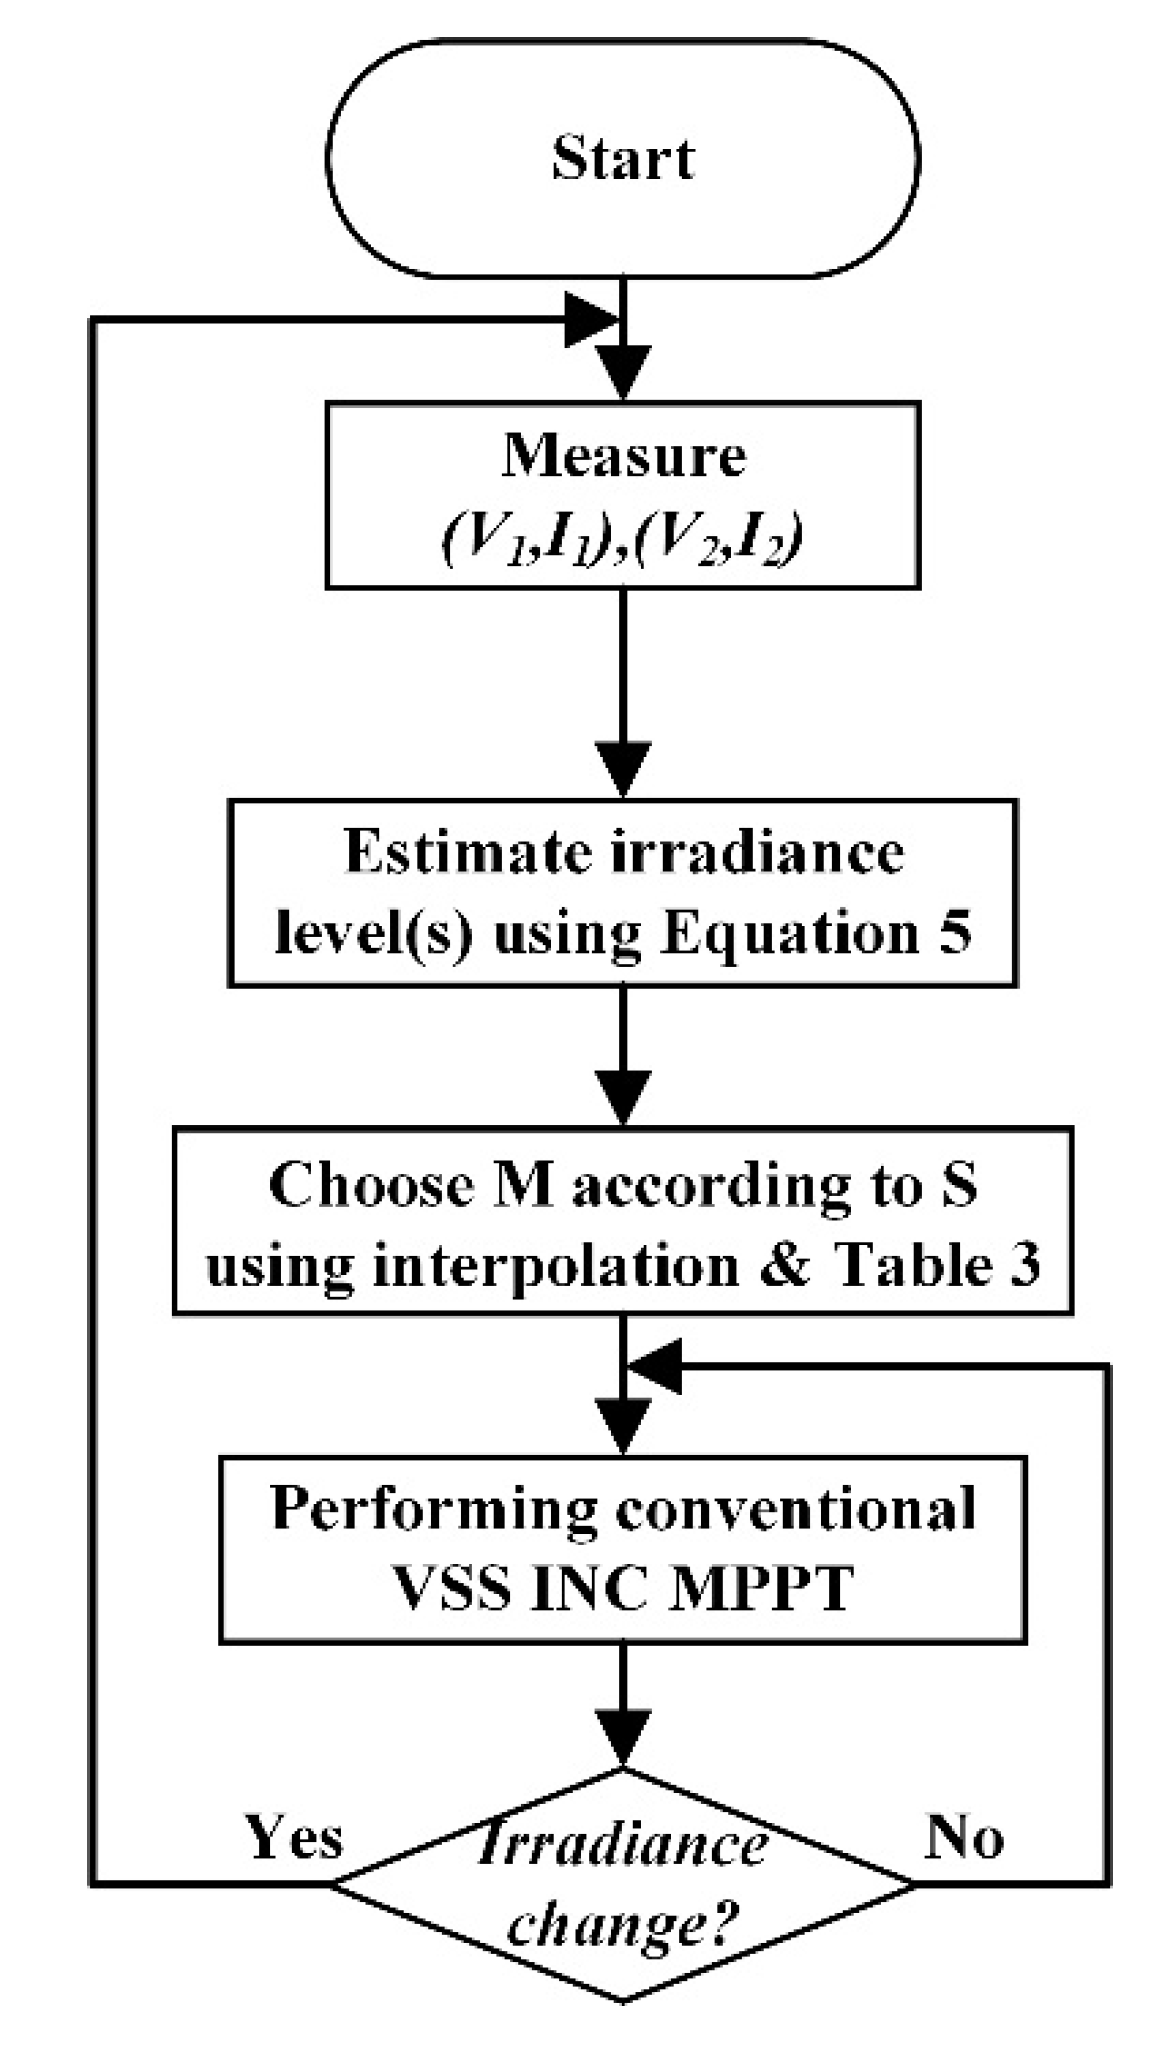
3.2. Flowchart of the Proposed Method

Figure 3 shows the flowchart of the method proposed in this study. The block in the dotted line is identical to the conventional VSS INC MPPT method. Firstly, the state estimation method as described in Section 3.1 is utilized to estimate the irradiance level using two (V, I) samples. Once the irradiance level is known, the proposed method calculates the optimal scaling factor value under current irradiance levels by interpolation according to the optimal scaling factor listed in Table 3, and the conventional VSS INC MPPT technique with the selected M value will be carried out. When the irradiance level changes, two additional perturbation steps will be performed and the state estimation will be used again to estimate the new irradiance level and calculate the new optimal scaling factor accordingly. The proposed method has advantages such as simple operation, fast tracking, and zero steady-state oscillation under any circumstances.

4. Simulation and Experimental Results

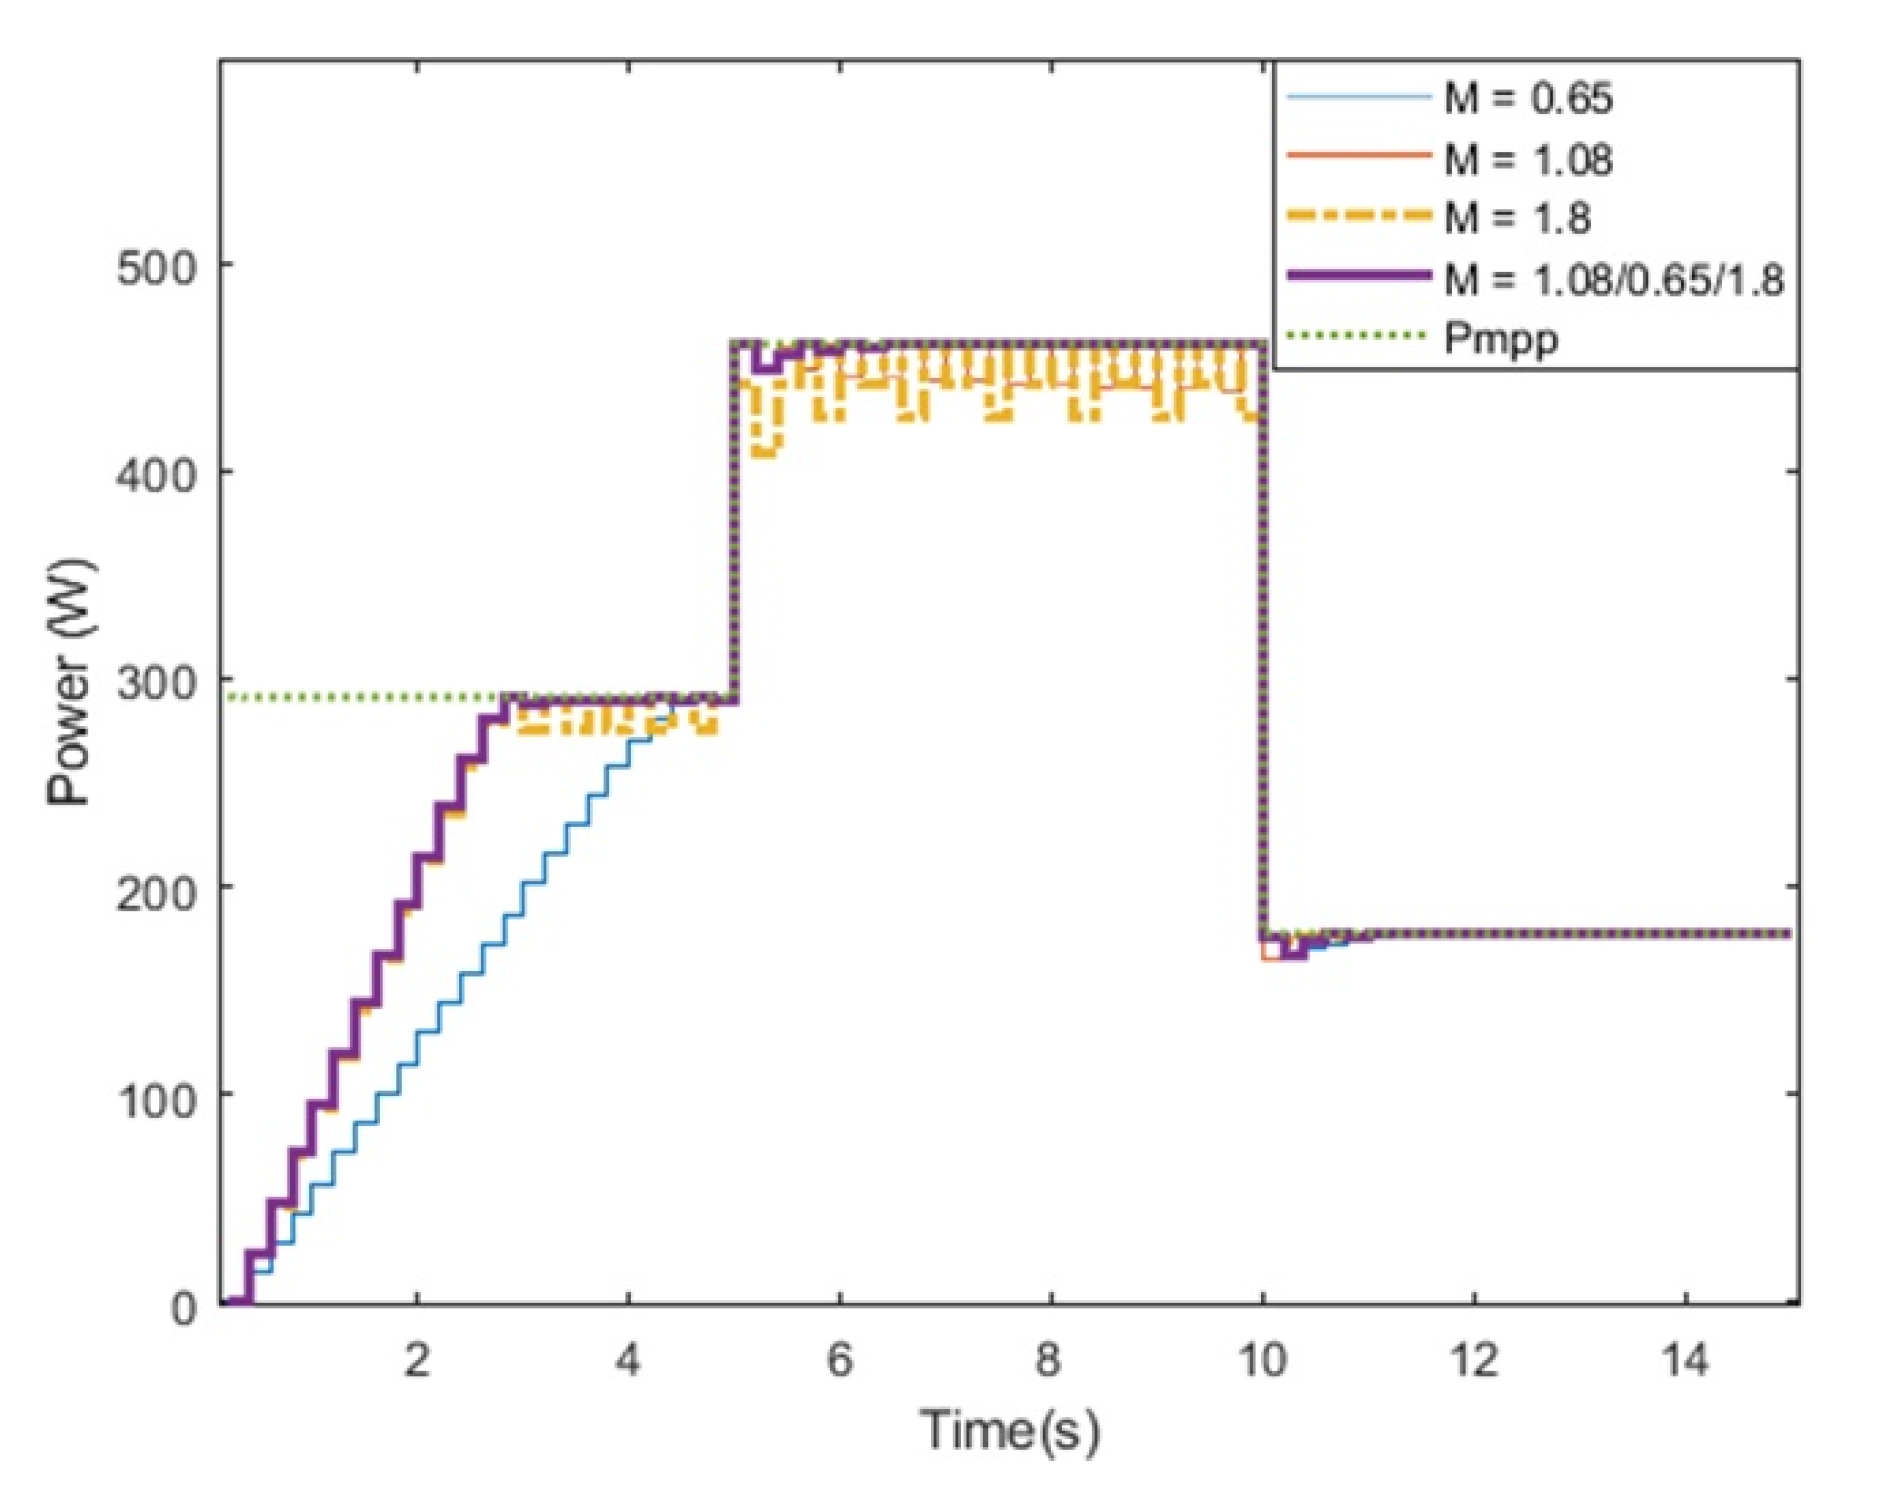
4.1. Simulation Result

MATLAB/SIMULINK software was utilized in this study for obtaining simulation results and to compare the performances of different MPPT techniques. To validate the correctness of the proposed method, this study compared the tracking performances (tracking time, tracking accuracy, and total energy loss) of different methods under various irradiance levels. In this study, the tracking time is defined as the time required for the tracking power enters the range of ±1% of MPP, and the tracking accuracy can be calculated by dividing the sum of the power of 1 s after steady state with the ideal MPP. Figure 4 shows the tracking performance of different scaling factors (M value). In Figure 4, the irradiance level is 500 W/m2 during 0–5 s and increases to 800 W/m2 during 5–10 s. As shown in Table 3, when the irradiance level is 500 W/m2, the optimal M value is 1.08, and the optimal M value is 0.65 when the irradiance level is 800 W/m2. Therefore, this study simulated three conditions, such as an M value fixed at 0.65, an M value fixed at 1.08, and utilizing the optimal M value according to the current irradiance level. In terms of the first 5 s of the tracking process (500 W/m2), the M value fixed at 0.65 is too small compared to the current optimal M value (1.08). On the other hand, in the last 5 s of the tracking process (800 W/m2), the M value fixed at 1.08 is too large compared to the current optimal M value (0.65). As shown in Figure 4, the tracking time of a smaller M value in the first half section of Figure 4a is longer than those in Figure 4b,c. On the other hand, the larger M value in the second half section of Figure 4b results in oscillation in the steady-state compared with Figure 4a,c. However, if an appropriate M value is adopted according to the current irradiance level (Figure 4c), the dynamic tracking will be fast and the steady-state oscillation can be eliminated.
Figure 5 shows the tracking performance of different scaling factors (M value) when the irradiance level decreases. In Figure 5, the irradiance level is 800 W/m2 during 0–5 s and decreases to 300 W/m2 during 5–10 s. As shown in Table 3, when the irradiance level is 800 W/m2, the optimal M value is 0.65 and the optimal M value is 1.8 when the irradiance level is 300 W/m2. Therefore, this study simulated three conditions, such as an M value fixed at 1.8, an M value fixed at 0.65, and adopting the optimal M value according to the current irradiance level. In the first 5 s of the tracking process (800 W/m2), the M value fixed at 1.8 is too large compared to the current optimal M value (0.65). On the other hand, in the last 5 s of the tracking process (300 W/m2), the M value fixed at 0.65 is too small compared to the current optimal M value (1.8). As shown in Figure 5, a smaller M value will slow down the tracking process, while a larger M value will result in steady-state oscillation during tracking. However, if an appropriate M value is employed according to the current irradiance level (Figure 5c), the optimal performance can be obtained.
To further validate the effectiveness of the proposed method, this study compares four different MPPT methods under various irradiance and panel temperature values. In this study, the conventional VSS INC MPPT method using three fixed scaling factor values (0.65, 1.08, and 1.8) was compared with the proposed VSS INC MPPT technique with adaptive scaling factor. Figure 6 shows the obtained MPP tracking results. As shown in Figure 6, the irradiance level and panel temperature are 500 W/m2 and 30 °C during 0–5 s, which increases to 800 W/m2 and 50 °C during 5–10 s, and decreases to 300 W/m2 and 20 °C during 10–15 s. From Figure 6, the performance indexes such as tracking time, tracking accuracy, and tracking energy loss can be calculated. The obtained results are summarized in Table 4. As shown in Figure 6 and Table 4, the proposed method has the best performance for the transient tracking speed and steady-state tracking accuracy. Moreover, the proposed method has a minimum tracking energy loss.

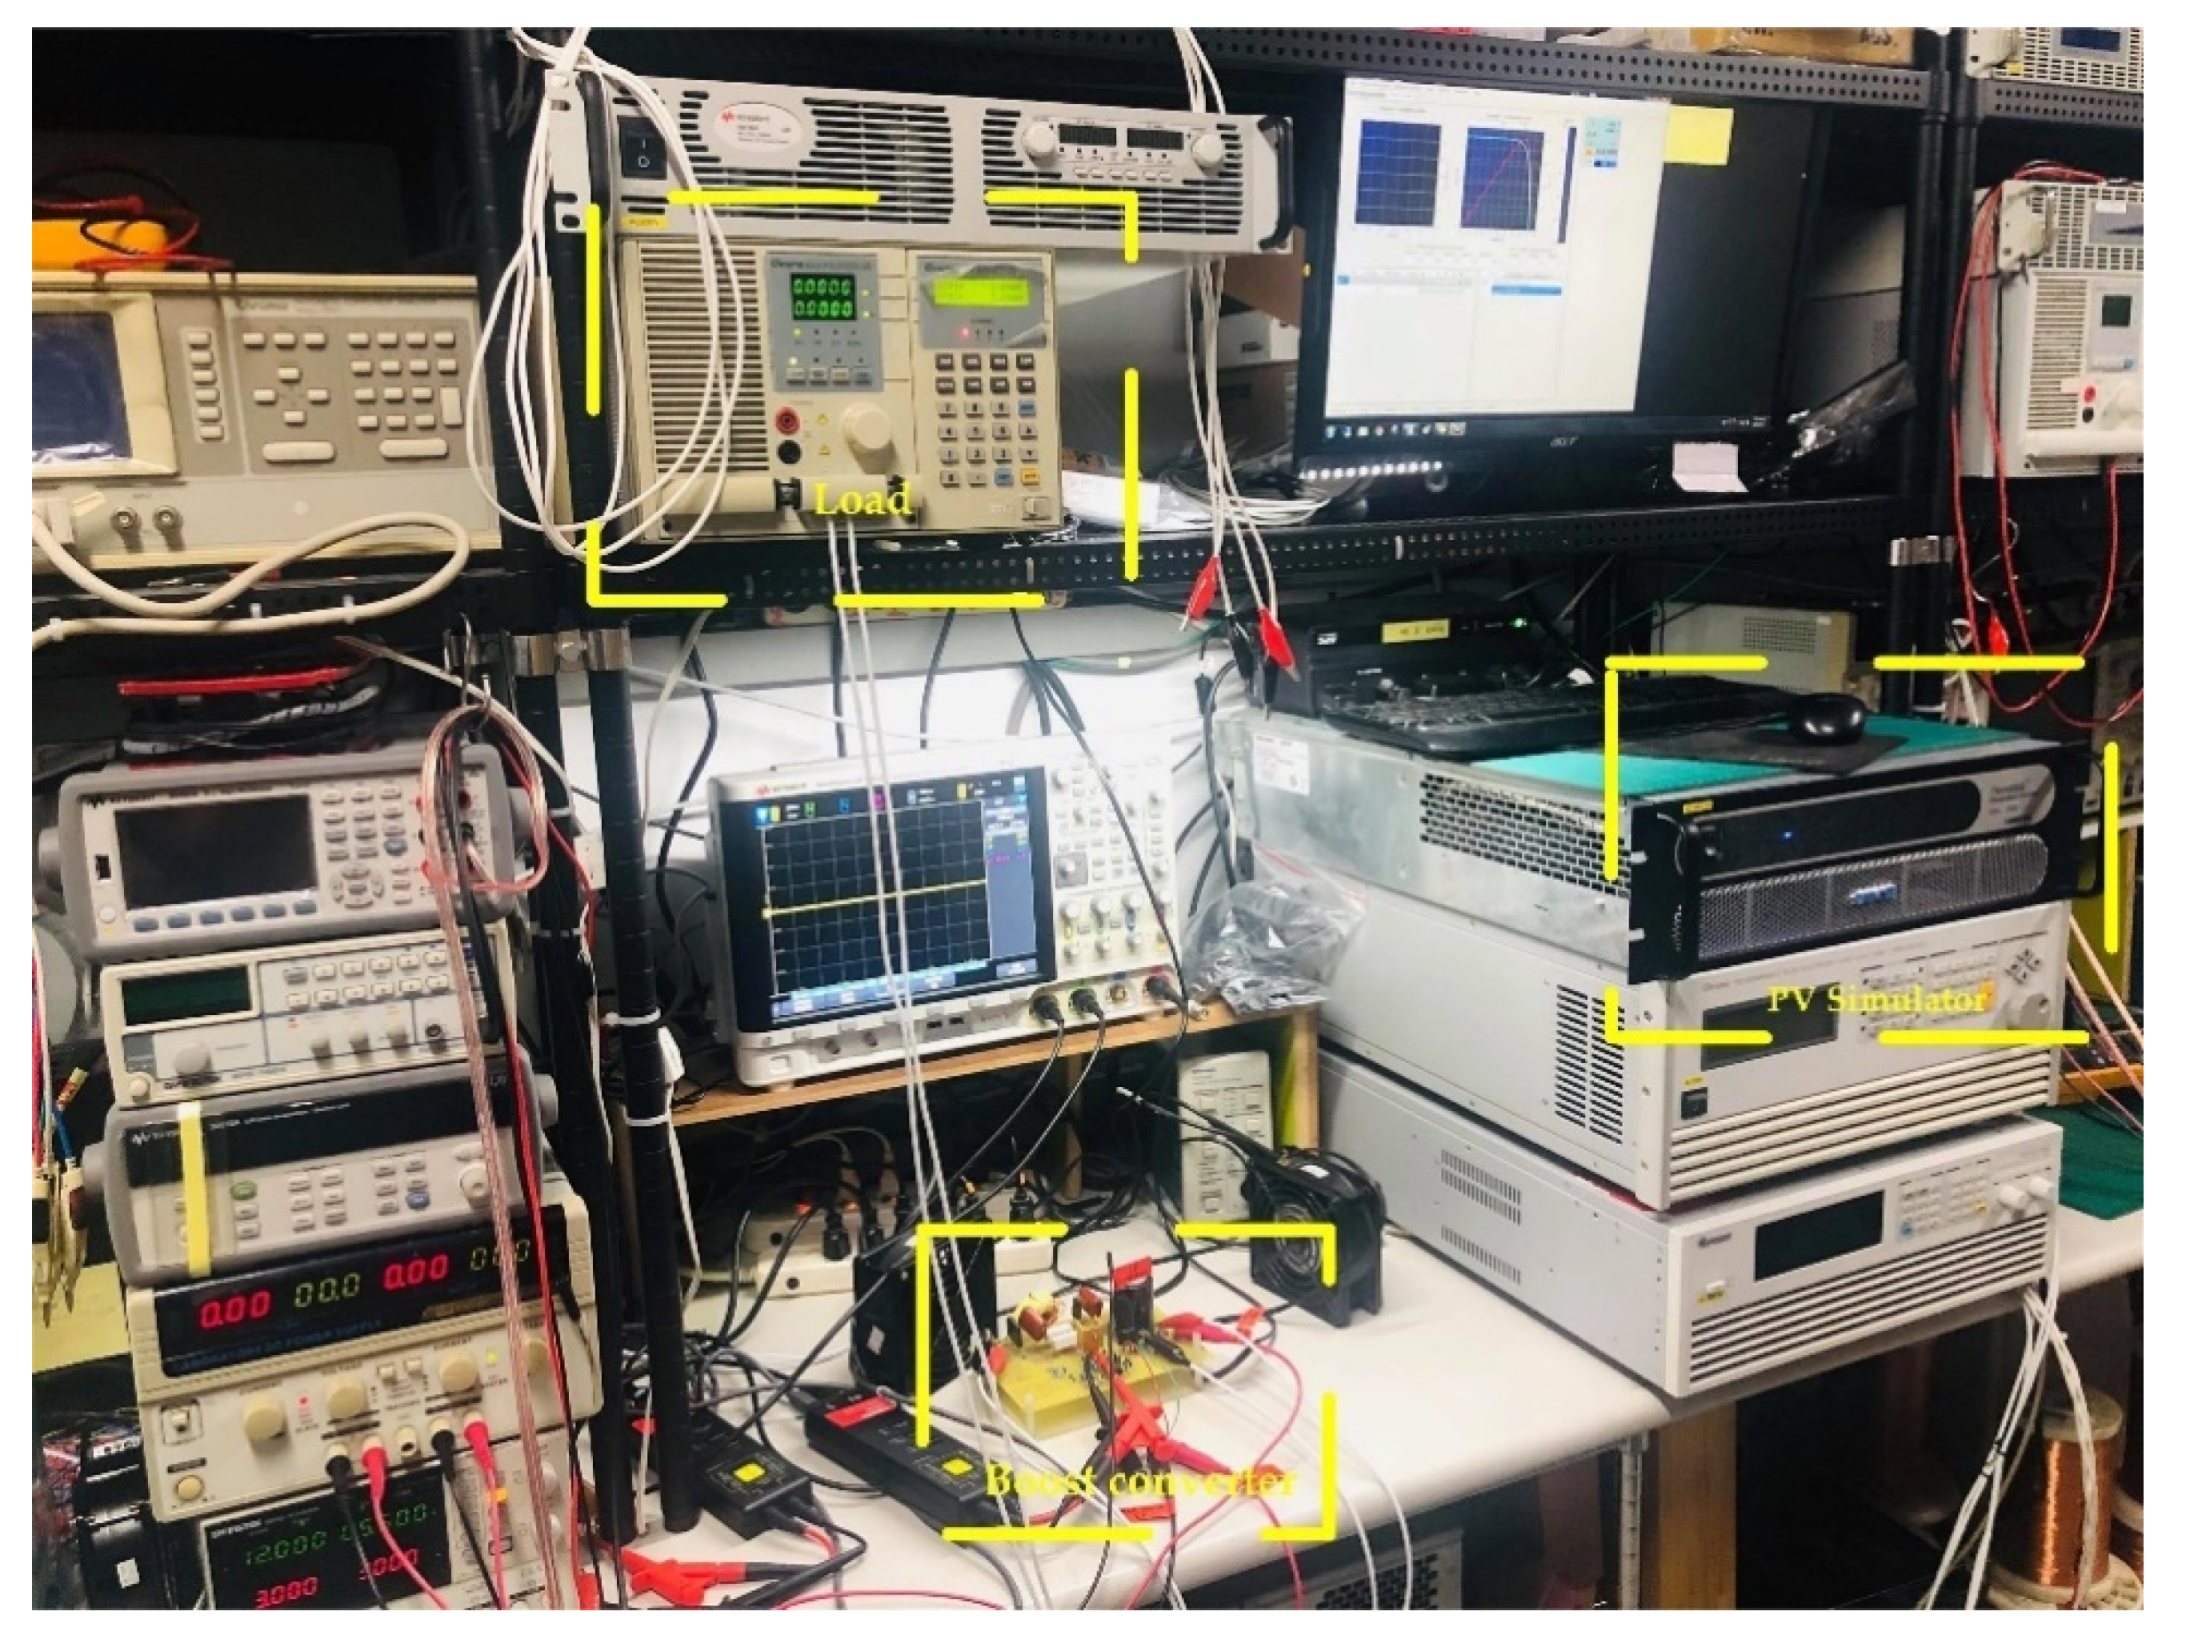
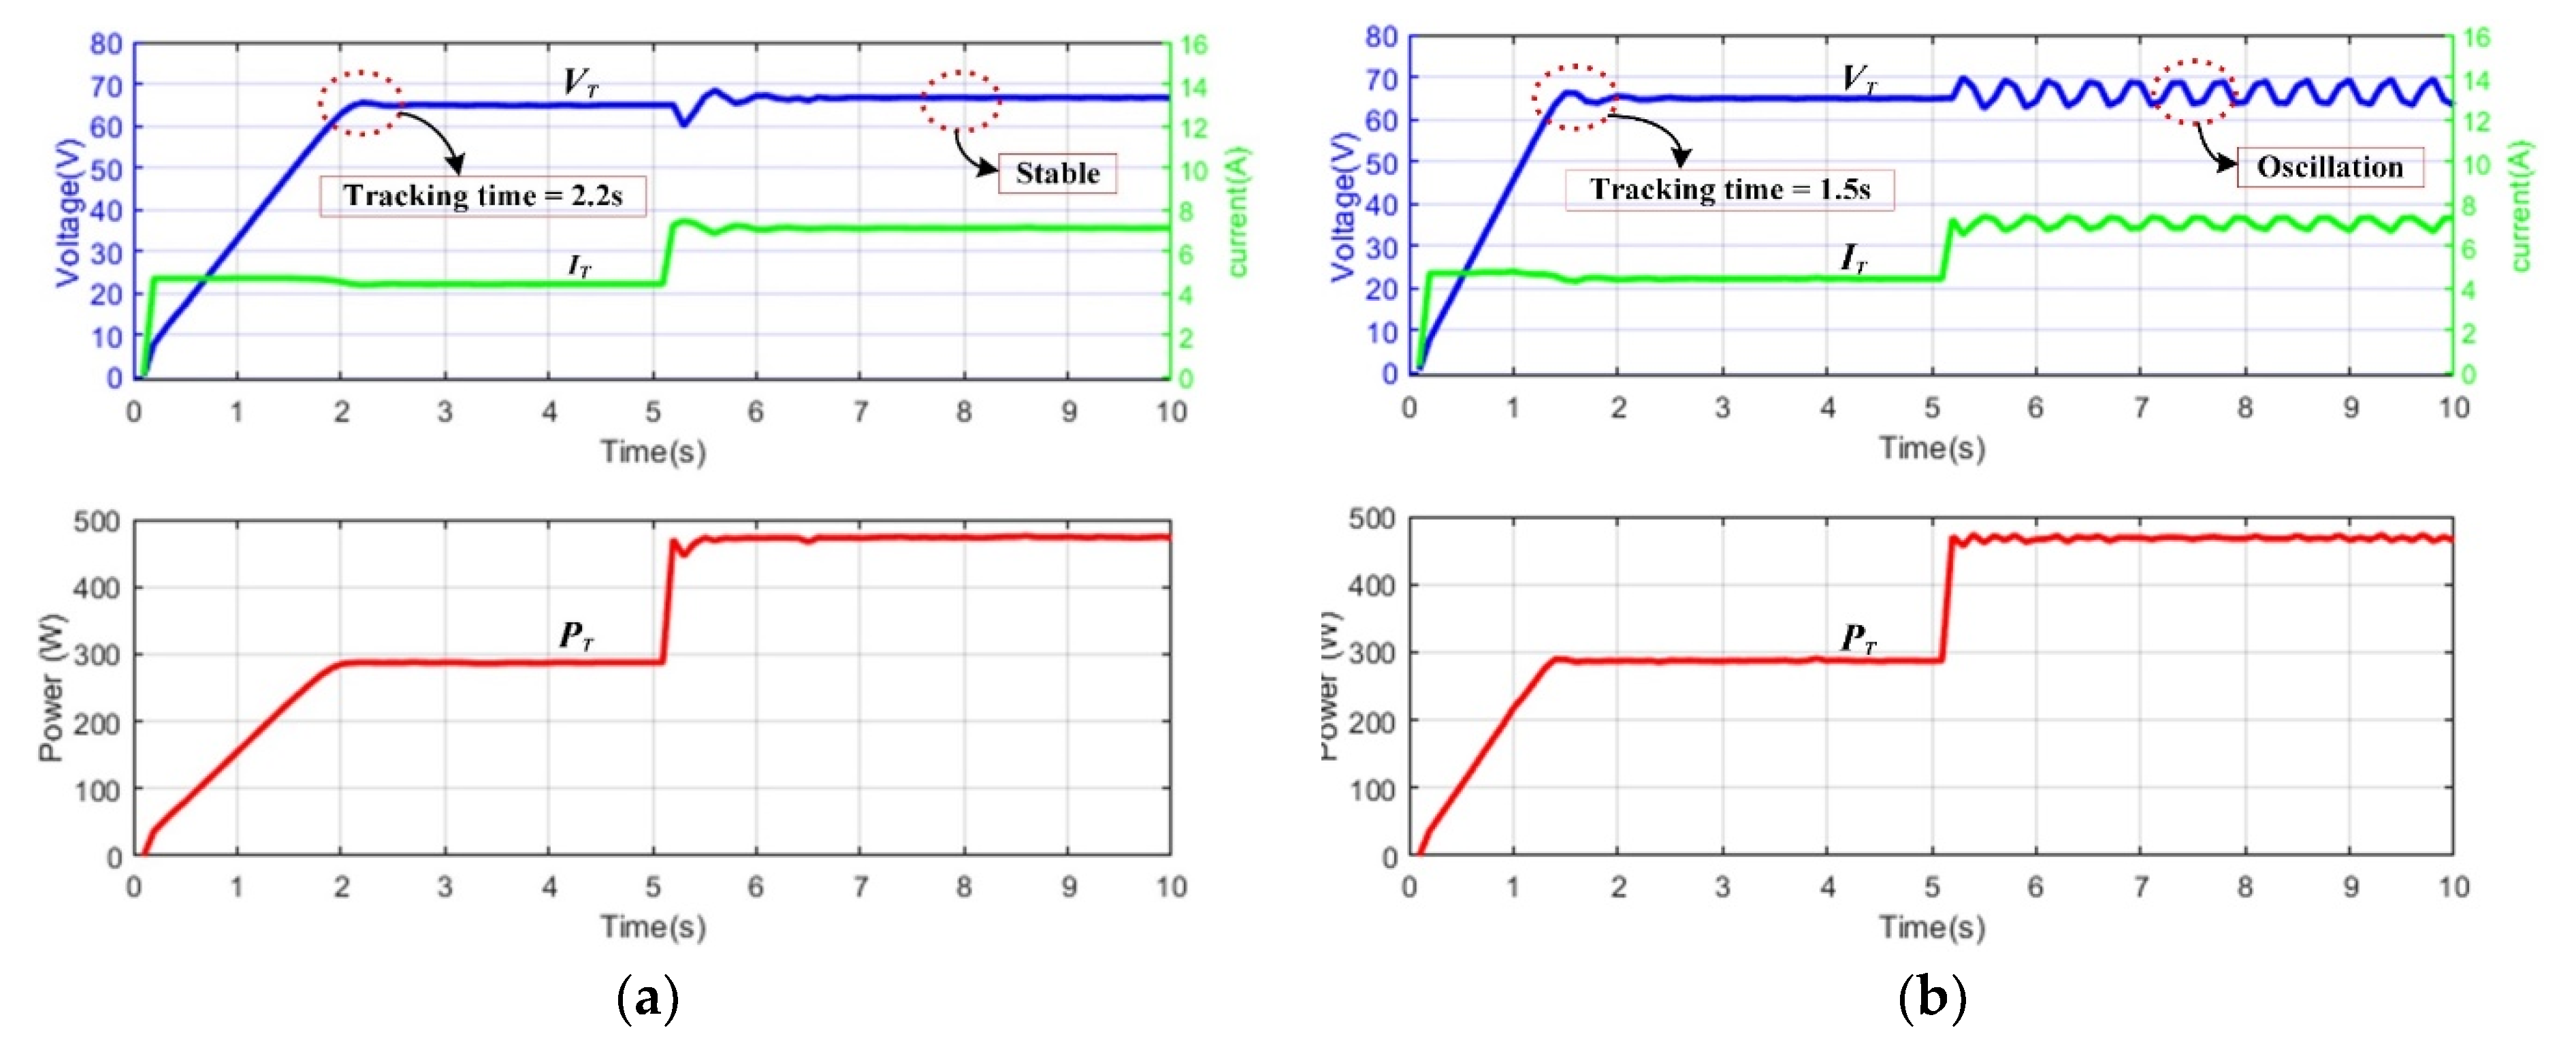
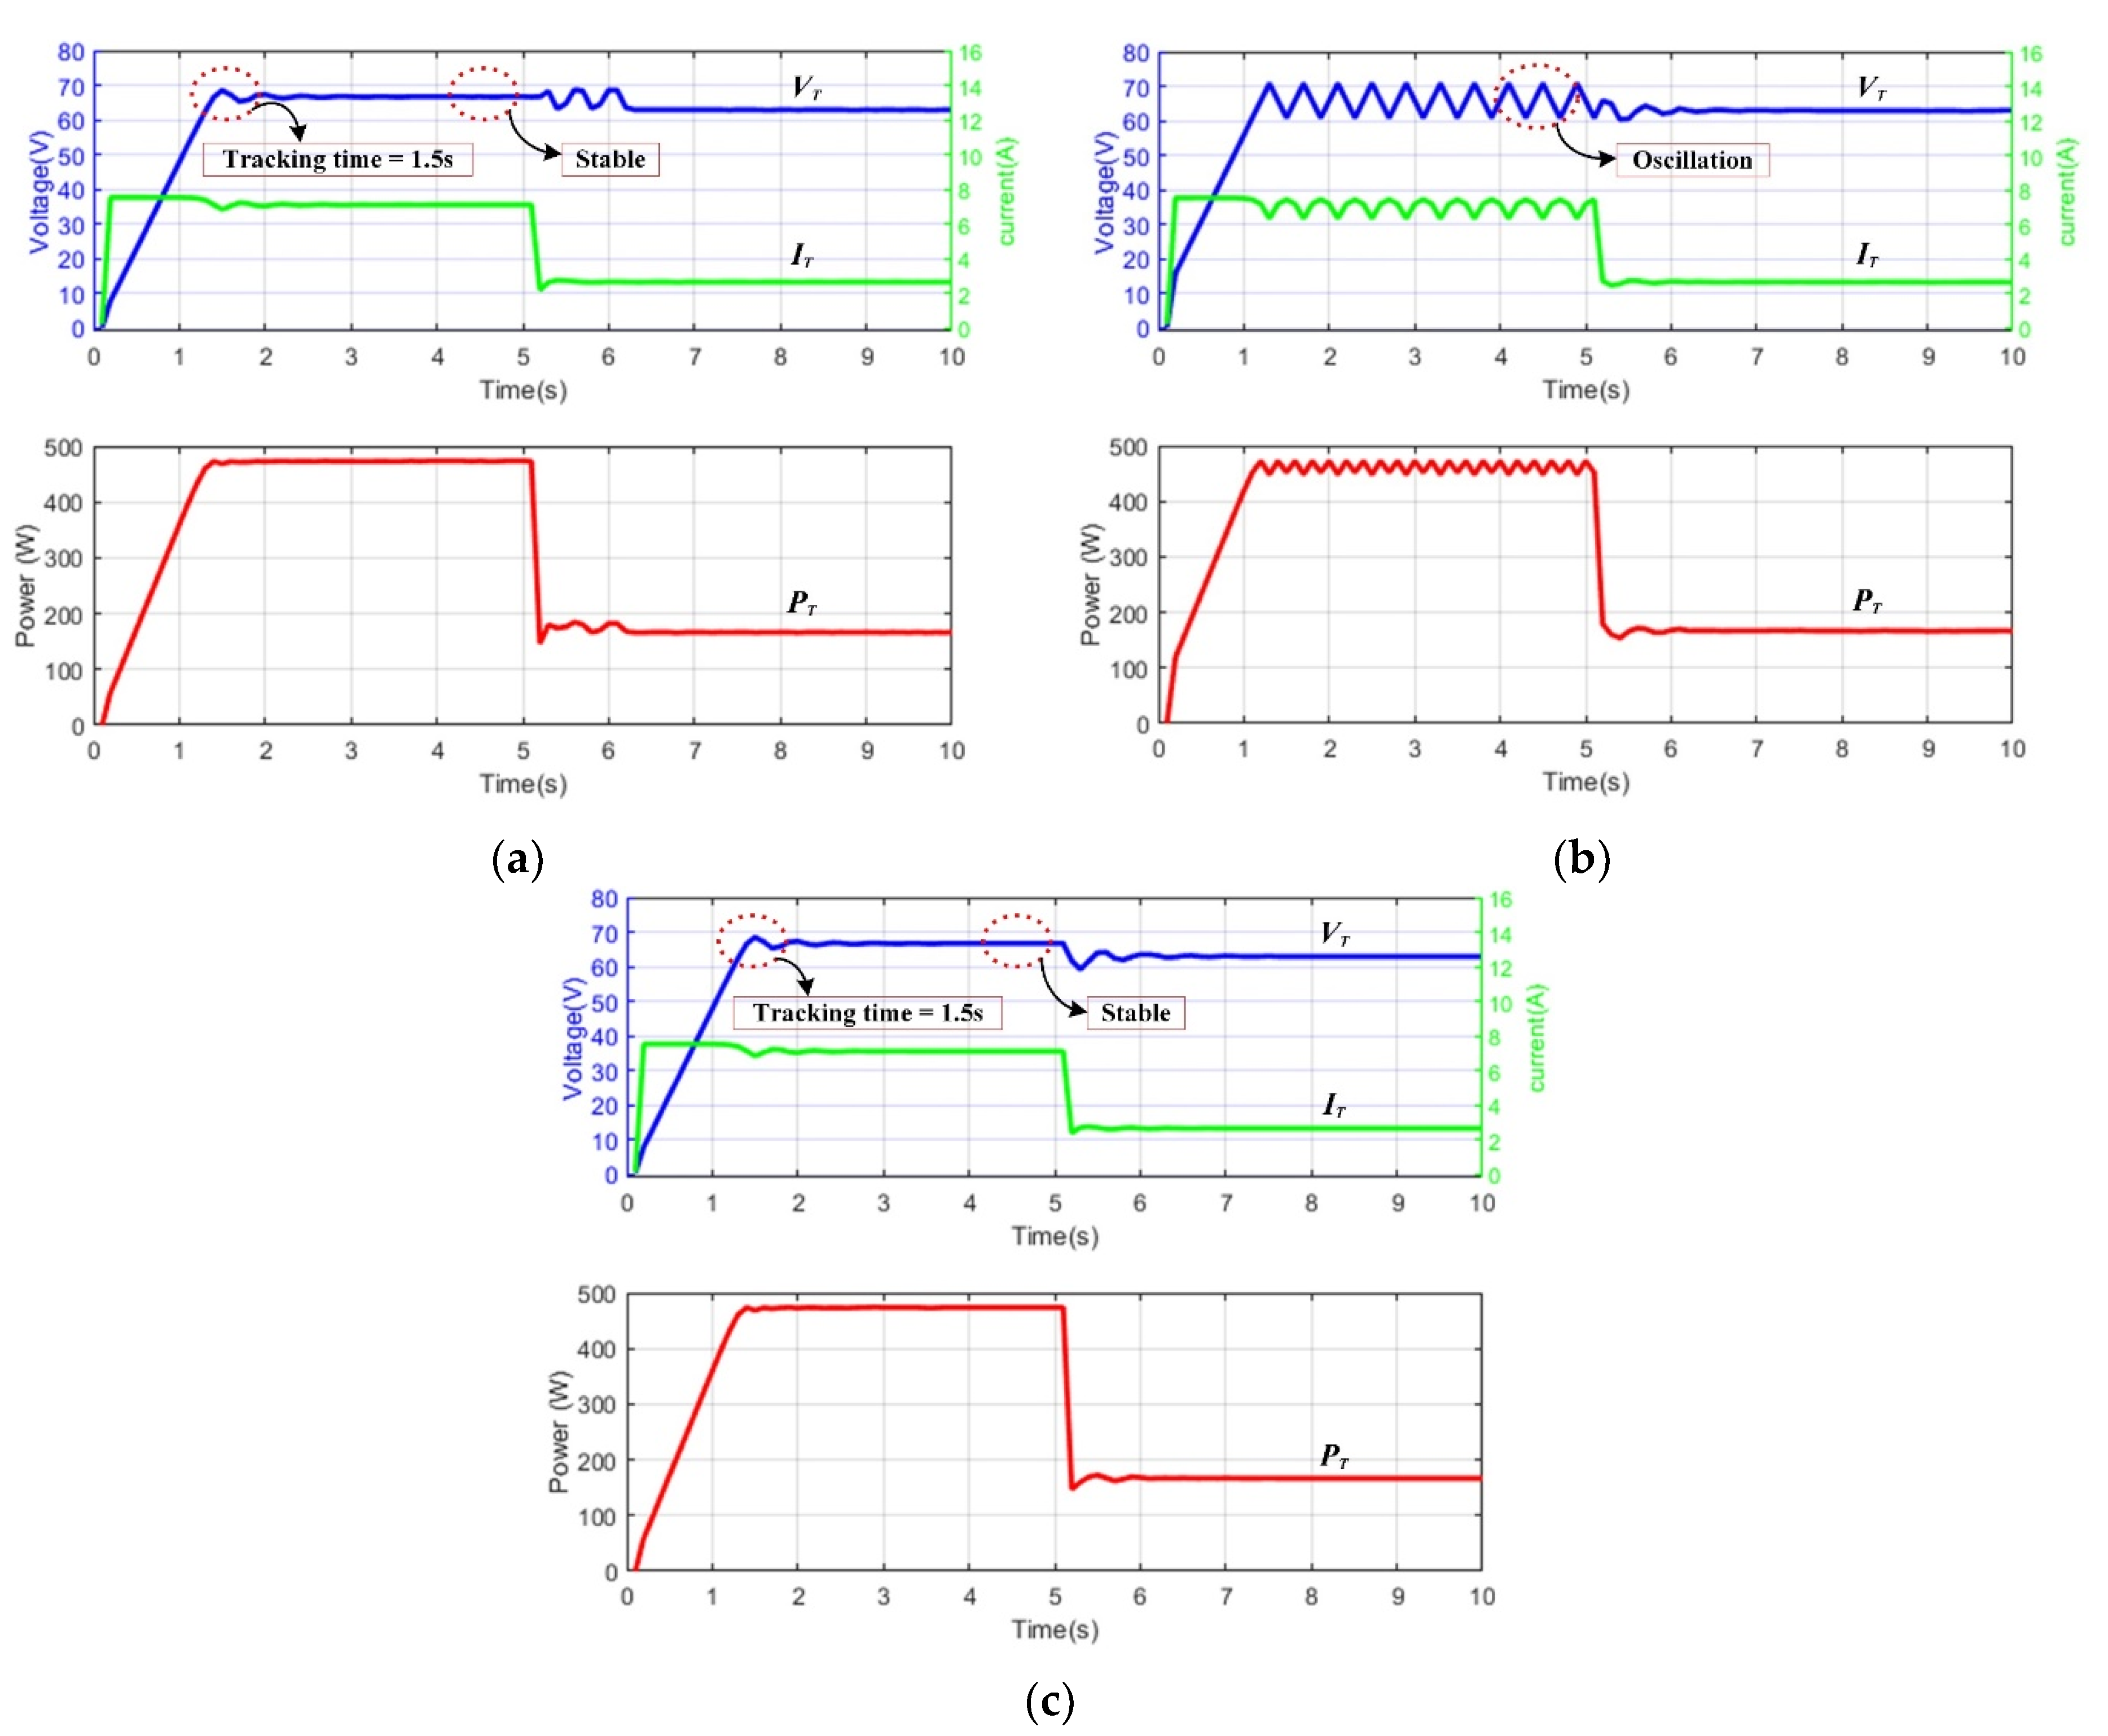
4.2. Experimental Results

In this paper, a 600 W prototyping circuit is implemented from which experiments are carried out accordingly. Figure 7 shows the block diagram of the proposed system. From Figure 7, a low-cost DSC dsPIC33FJ16GS502 from Microchip Corp. (Chandler, AZ, USA) is used to realize the MPPT algorithms mentioned above, and the experiments are performed with an AMETEK TerraSAS DCS80-15 Solar Array Simulator (San Diego, CA, USA) in SAS mode as a power source. The specifications of the utilized power converter are listed in Table 1 and the parameters of the utilized PV panel are listed in Table 2. A photo of the experimental setup and the testing environment is shown in Figure 8.
Figure 9 shows the measured tracking performance of different M values when the irradiance level increases. Figure 10 shows the measured tracking performance of different M values when the irradiance level decreases. As shown in Figure 9 and Figure 10, the experimental MPP tracking curves correspond well to the MPP tracking curve obtained by simulations (Figure 4 and Figure 5). The obtained experimental results are summarized in Table 5. Compared to the conventional VSS INC MPPT method, the proposed method can improve the tracking energy loss by 43.9% under increasing irradiance level condition and can improve the tracking energy loss by 29.9% under decreasing irradiance level condition.

5. Discussions and Limitations
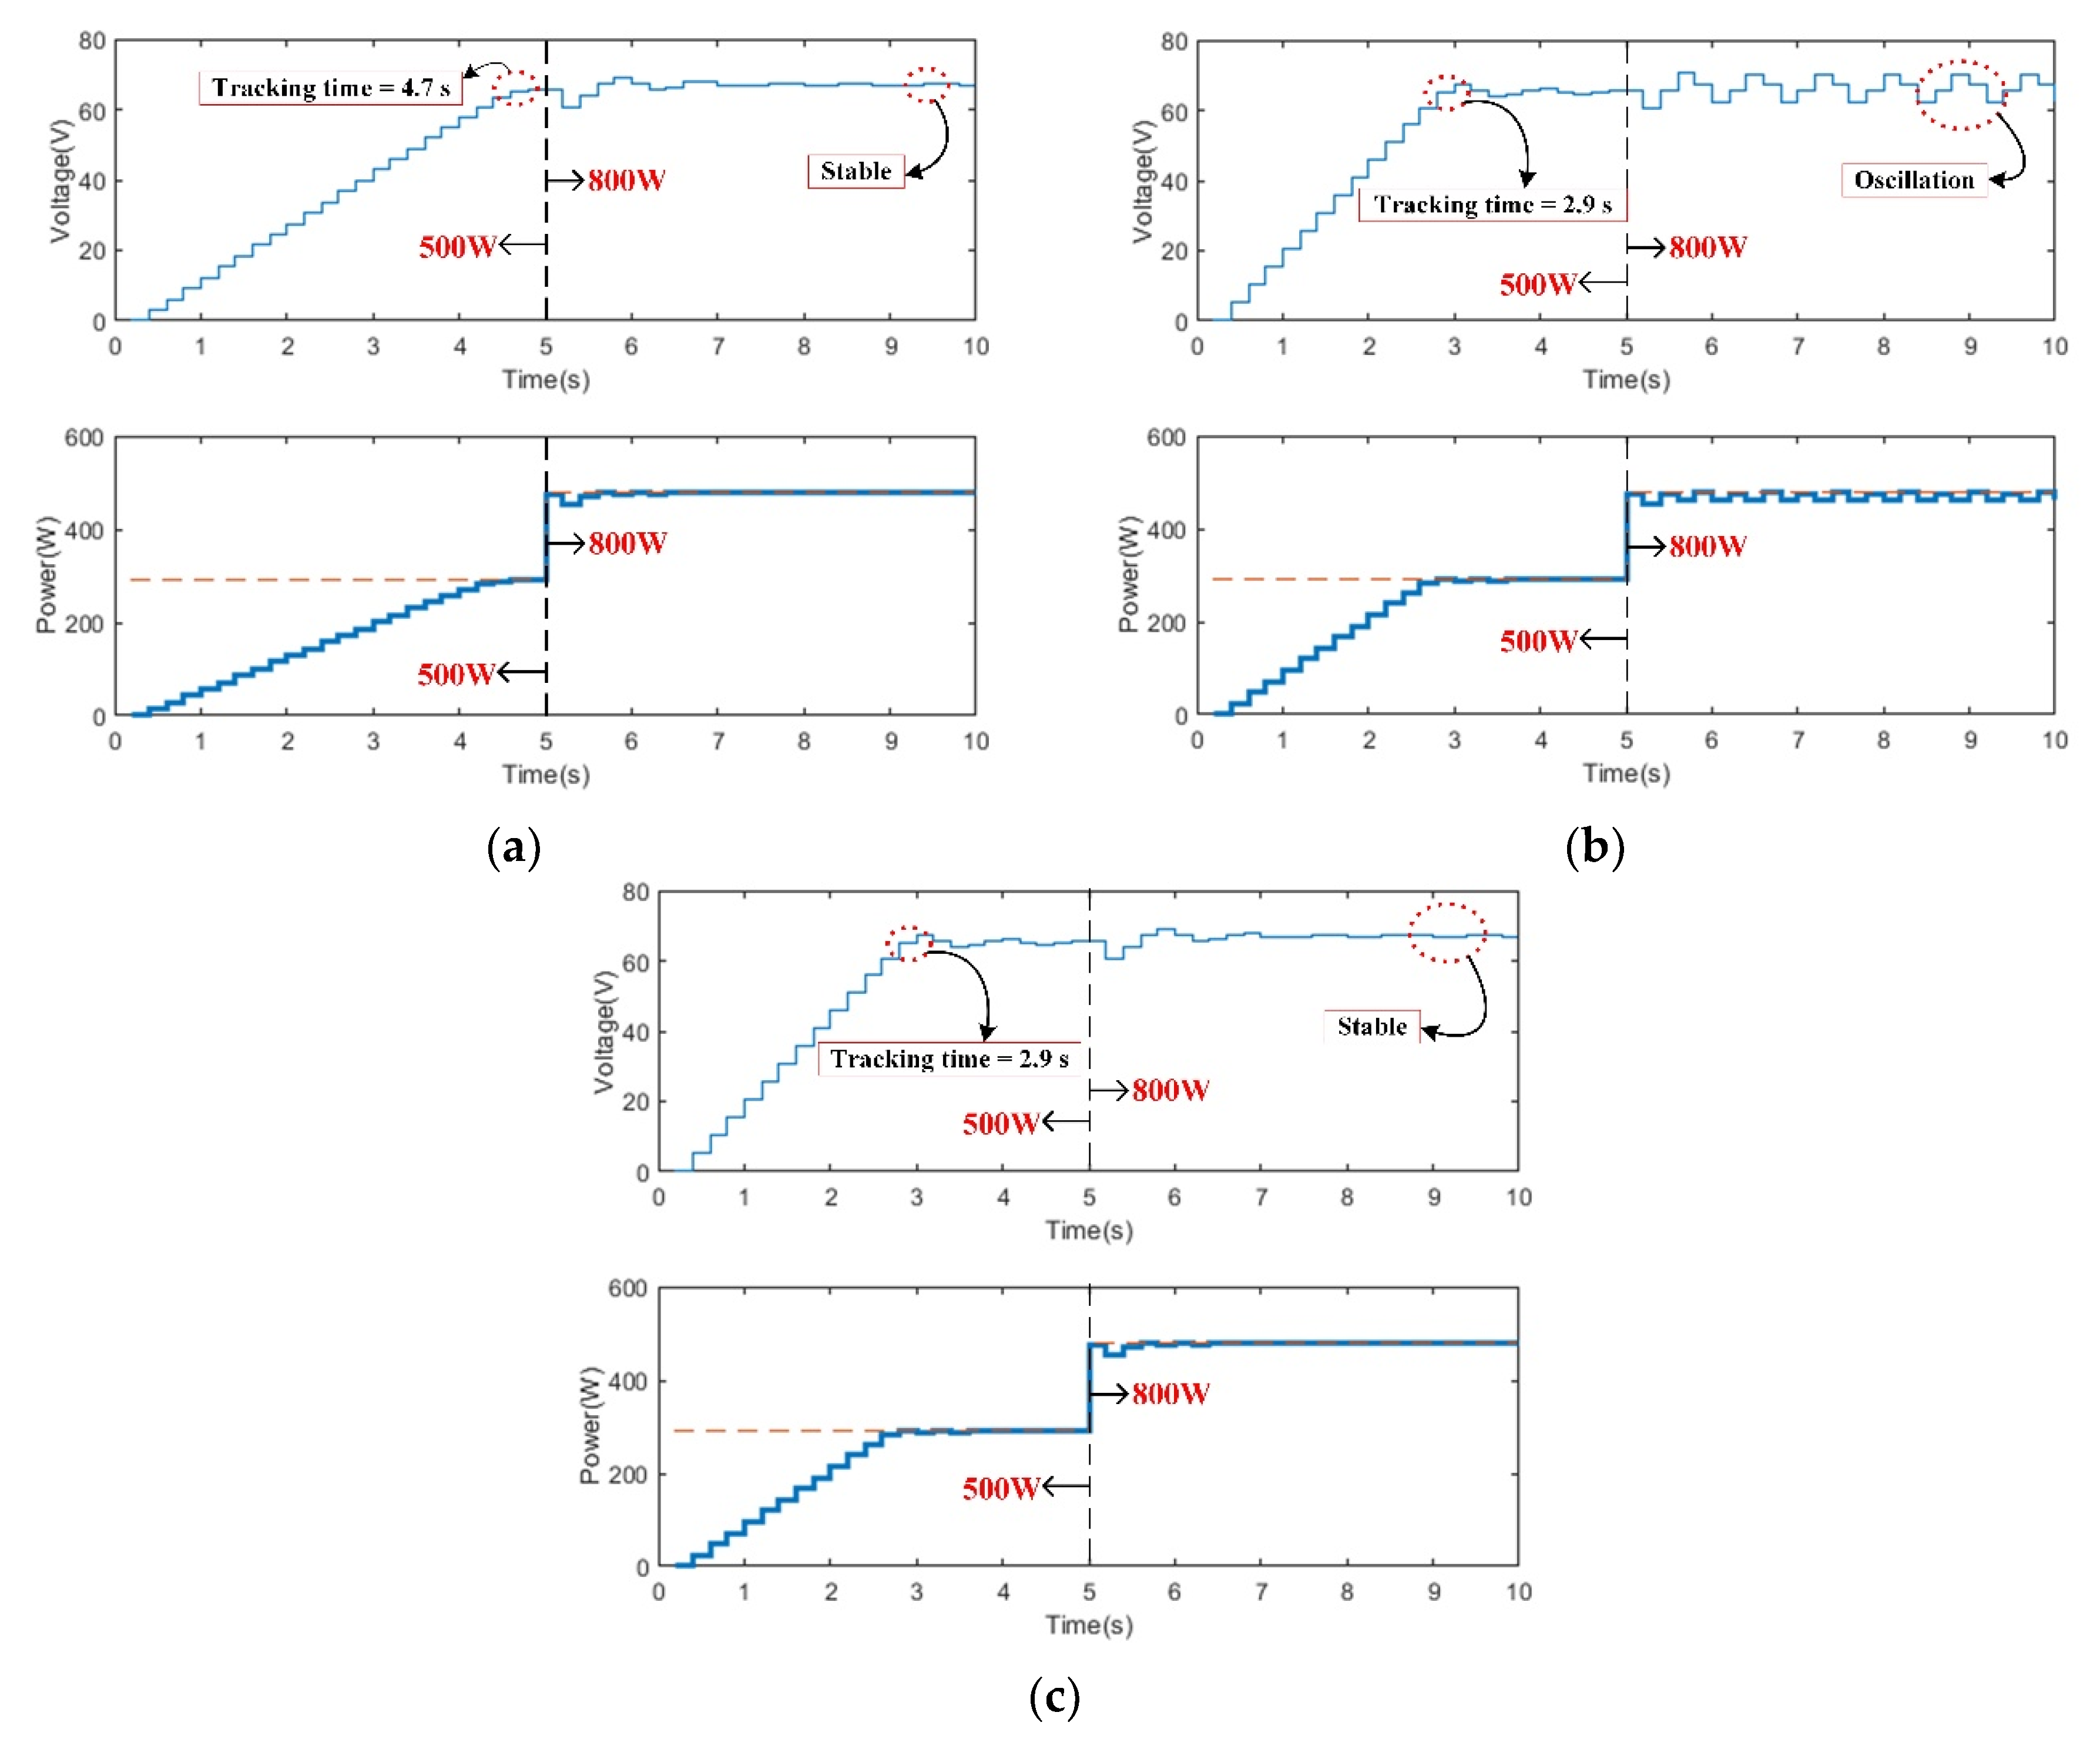
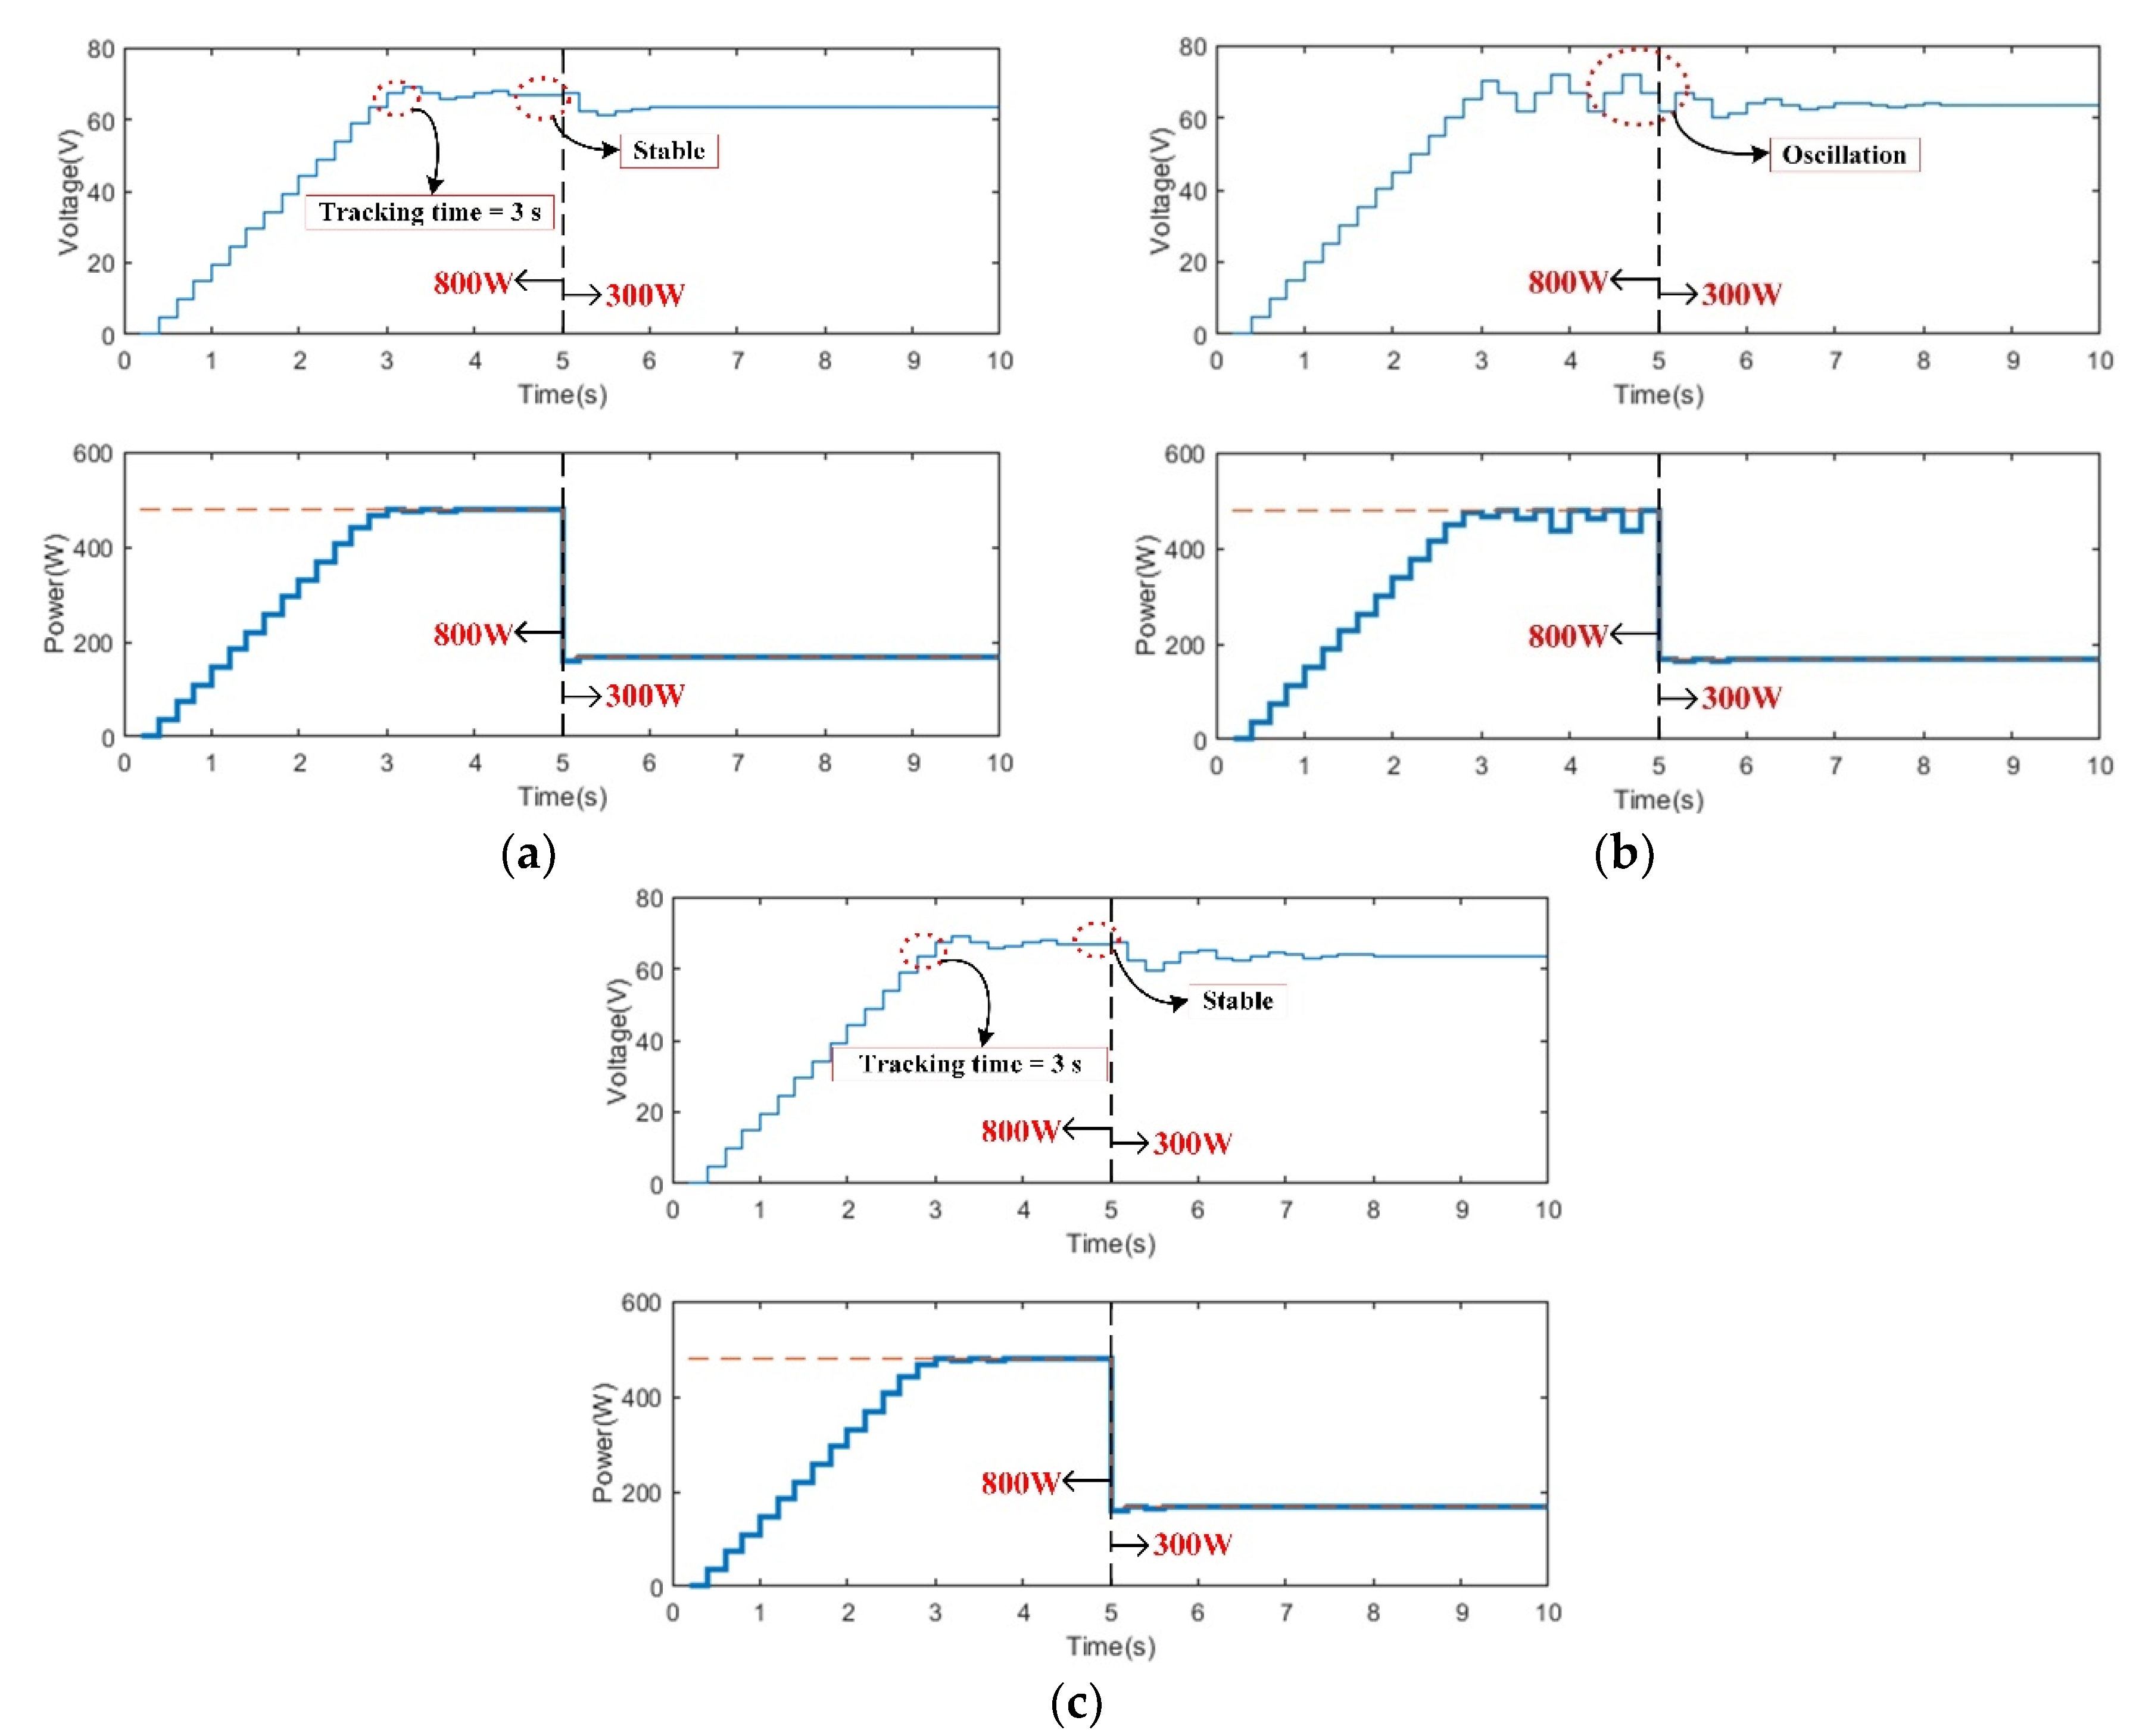
According to the simulation and experimental results, when the VSS method uses an inappropriate M value, the transient or steady-state response will become worse, and the system has larger tracking energy loss. Relatively, the method proposed in this paper can select the optimal scaling factor M value according to the irradiance level to hasten tracking speed, reduce steady-state oscillation, and increase the tracking efficiency.

5.1. Tracking Time

The simulation and experimental results showed that the novel VSS INC MPPT technology with adaptive scaling factor proposed in this paper has a faster tracking speed than the conventional VSS INC MPPT method. According to the experimental results, the proposed method can improve the tracking time by 31.8% under the tested increasing irradiance level conditions. It should be noted that the voltage waveform oscillates and never reach the steady state; hence, the tracking time value is not available in decreasing irradiance level conditions.

5.2. Tracking Accuracy

As indicated by the simulation and experimental results, the proposed novel VSS INC MPPT technology can improve the steady-state oscillation comparing with conventional VSS INC MPPT method; therefore, the tracking accuracy will be better. According to the experimental results, the proposed method can improve the tracking accuracy by 2.1% and 3.5% under the tested increasing and decreasing irradiance level conditions, respectively.

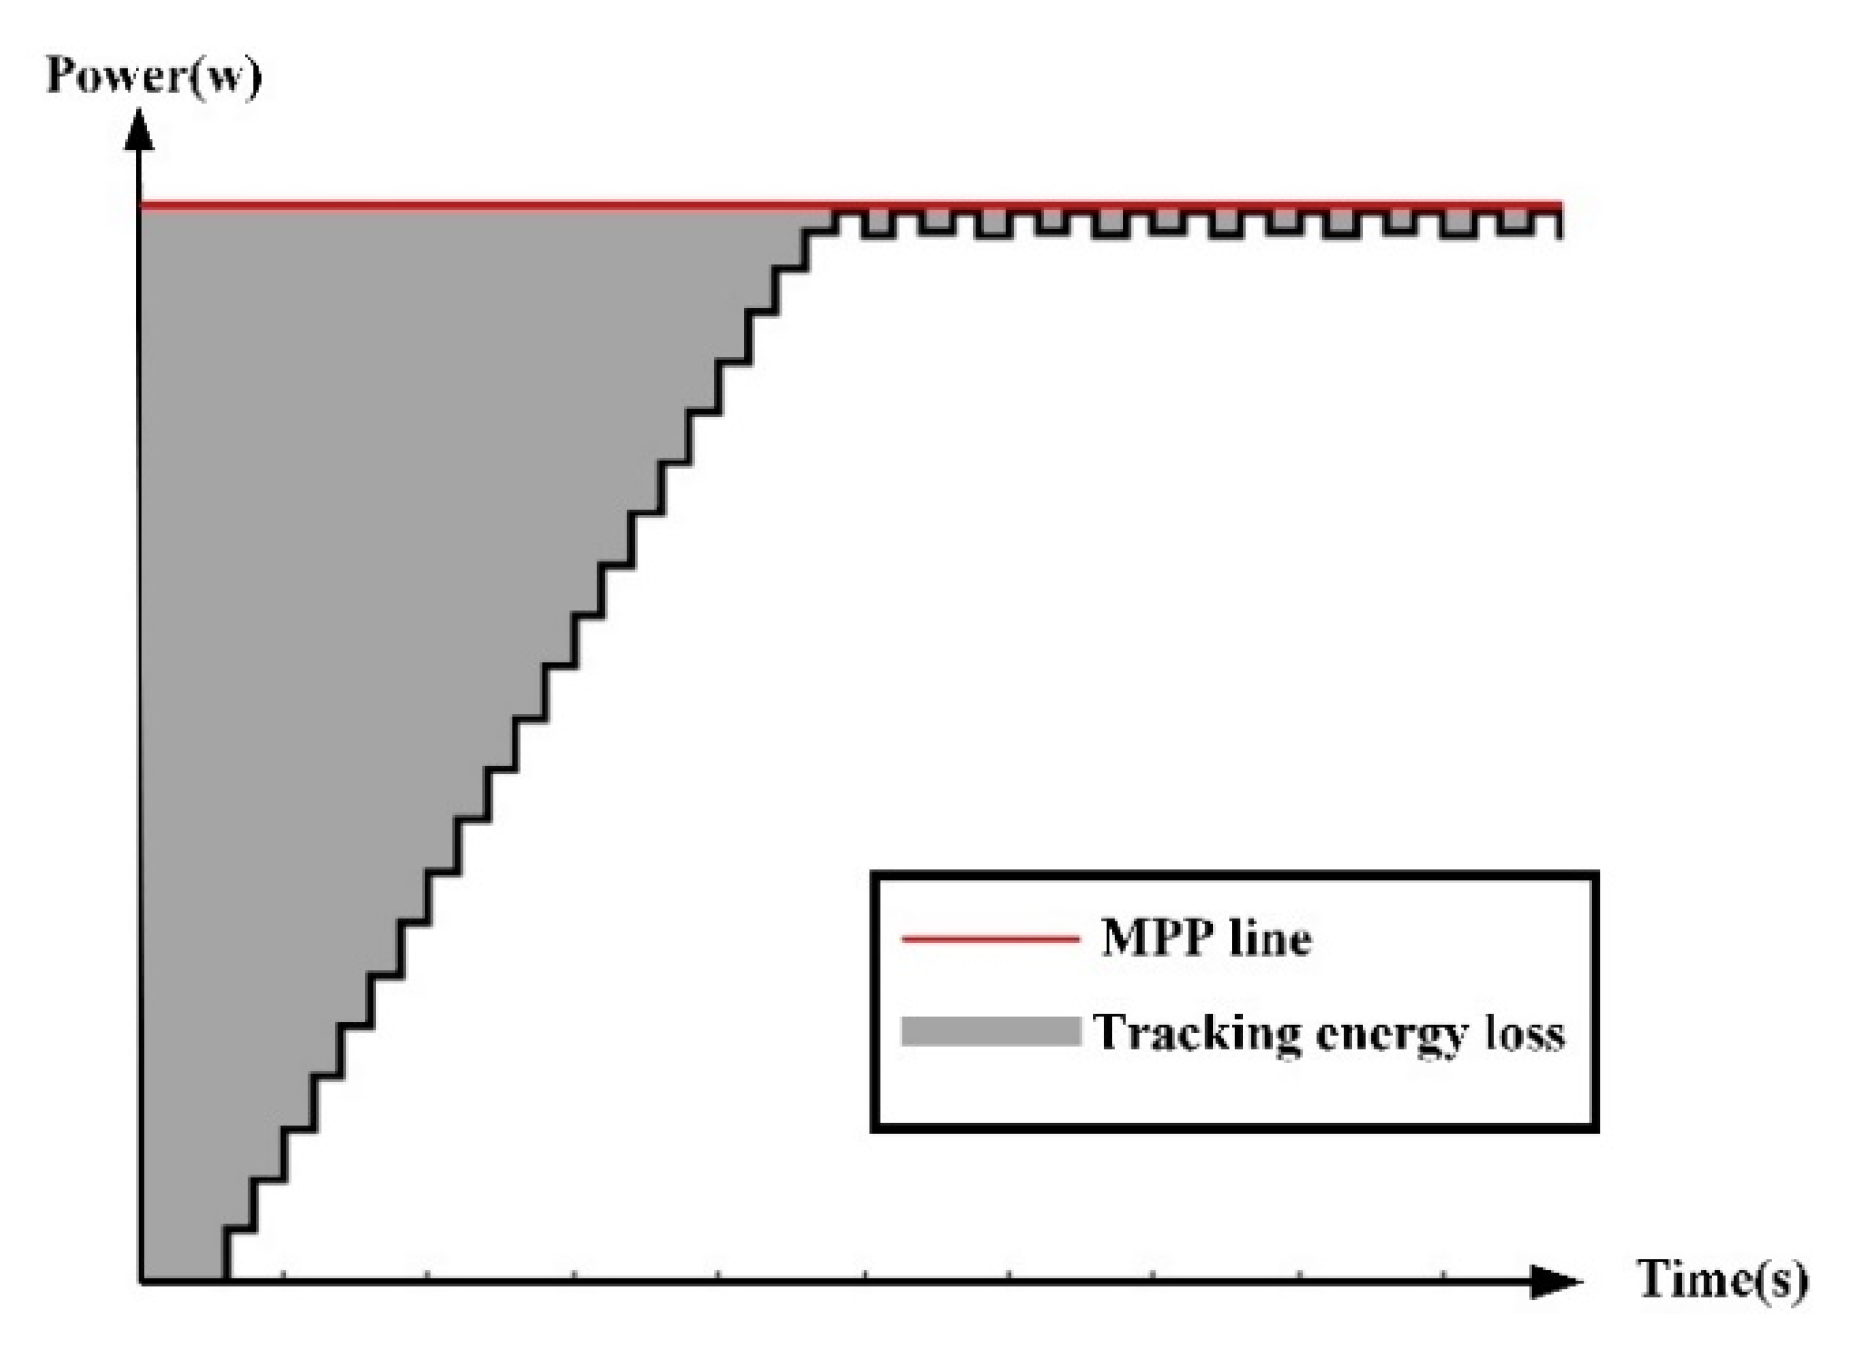
5.3. Tracking Energy Loss

The overall tracking efficiency of the system can be increased by simultaneously improving the transient tracking speed and steady-state tracking accuracy. According to the experimental results, the proposed method can improve the tracking energy loss by 43.9% and 29.9% under the tested increasing and decreasing irradiance level conditions, respectively. Therefore, the proposed method has the best MPP tracking performance.

5.4. Limitations

This study only focused on the derivation of the adaptive scaling factor under fast-changing environments. Subsequently, GMPP tracking under PSC has been left as a future work for this paper. However, the proposed method can be integrated with some GMPP candidate interval locating algorithms to enhance its tracking performance under PSC. Besides, the optimal scaling factor is obtained using tentative simulations in this study. An intelligent algorithm may be designed to be integrated into the VSS INC MPPT algorithms for automatically solving the optimal design.

6. Conclusions

A novel VSS INC MPPT method with adaptive scaling factor for rapid irradiance changes has been proposed in this paper. Using the irradiance level value determined by the model-based state estimation method, an appropriate scaling factor can be determined to enhance the performance of the conventional VSS INC technique. By adjusting the scaling factor according to the irradiance level, the tracking speed, tracking accuracy, and tracking energy loss can all be improved comparing with the VSS INC MPPT method using fixed scaling factor values. Specifically, the tracking energy loss can be reduced by 43.9% and 29.9% under the tested conditions according to the experimental results. Hence, the proposed method can yield more energy and is suitable for fast-changing environments. Another contribution of this study is that fast and accurate tracking can be achieved without the need for extra expensive irradiance and temperature sensors. The proposed method is simple and can easily be integrated into conventional VSS INC algorithms, which makes the developed MPPT solution more suitable for solar generation system applications. Future works include the development of a GMPP tracking algorithm suitable for PSC, and develop an optimal design algorithm to obtain the adequate scaling factor automatically.

Author Contributions

M.-T.C., Y.-H.L., and S.-P.Y. made considerable contributions in this research, Y.-H.L. and M.-T.C. proposed ideas and research concepts at the beginning of the study, M.-T.C. and S.-P.Y. completed the construction of the simulation platform and the construction of the experimental platform during the research process. All authors are responsible for the integrity of the work as a whole. All authors have read and agreed to the published version of the manuscript.

Funding

This research received no external funding.

Conflicts of Interest

The authors declare no conflict of interest.

References

  1. Kalaiarasi, N.; Dash, S.S.; Padmanaban, S.; Paramasivam, S.; Morati, P.K. Maximum power point tracking implementation by dspace controller integrated through z-source inverter using particle swarm optimization technique for photovoltaic applications. Appl. Sci. 2018, 8, 145. [Google Scholar]
  2. Chen, P.C.; Chen, P.Y.; Liu, Y.H.; Chen, J.H.; Lu, Y.F. A comparative study on maximum power point tracking techniques for photovoltaic generation systems operating under fast changing environments. Sol. Energy 2015, 119, 261–276. [Google Scholar] [CrossRef]
  3. Antonio, A.; Rujula, B.; Antonio, J.; Abia, C. A novel MPPT method for PV systems with irradiance measurement. Sol. Energy 2014, 109, 95–104. [Google Scholar]
  4. Fathabad, H. Novel fast dynamic MPPT (maximum power point tracking) technique with the capability of very high accurate power tracking. Energy 2016, 94, 466–475. [Google Scholar] [CrossRef]
  5. Pandey, A.; Dasgupta, N.; Mukerjee, A.K. High-performance algorithms for drift avoidance and fast tracking in solar MPPT system. IEEE Trans. Enegry Cover. 2008, 23, 681–689. [Google Scholar] [CrossRef] [Green Version]
  6. Liu, F.; Duan, S.; Liu, F.; Liu, B.; Kan, Y. A VSS INC MPPT method for PV systems. IEEE Trans. Ind. Electron. 2008, 55, 2622–2628. [Google Scholar]
  7. Lalili, D.; Mellit, A.; Lourci, N.; Medjahed, B.; Berkouk, E.M. Input output feedback linearization control and VSS MPPT algorithm of a grid-connected photovoltaic inverter. Renew. Energy 2011, 36, 3282–3291. [Google Scholar] [CrossRef]
  8. Mei, Q.; Shan, M.; Liu, L.; Guerrero, J.M. A novel improved variable step-size incremental-resistance MPPT method for PV systems. IEEE Trans. Ind. Electron. 2011, 58, 2427–2434. [Google Scholar] [CrossRef]
  9. Jiang, Y.; Qahouq, J.A.A.; Haskew, T.A. Adaptive step size with adaptive-perturbation-frequency digital MPPT controller for a single-sensor photovoltaic solar system. IEEE Trans. Power Electron. 2013, 28, 3195–3205. [Google Scholar] [CrossRef]
  10. Lalili, D.; Mellit, A.; Lourci, N.; Medjahed, B.; Boubakir, C. State feedback control and VSS MPPT algorithm of three-level grid-connected photovoltaic inverter. Sol. Energy 2013, 98, 561–571. [Google Scholar] [CrossRef]
  11. Killi, M.; Samant, S. An adaptive voltage-sensor-based MPPT for photovoltaic systems with SEPIC converter including steady-state and drift analysis. IEEE Trans. Ind. Electron. 2015, 62, 7609–7618. [Google Scholar] [CrossRef]
  12. Shi, Y.; Li, R.; Xue, Y.; Li, H. High-frequency-link-based grid-tied PV system with small DC-link capacitor and low-frequency ripple-free maximum power point tracking. IEEE Trans. Power Electron. 2016, 31, 328–339. [Google Scholar] [CrossRef]
  13. Loukriz, A.; Haddadi, M.; Messalti, S. Simulation and experimental design of a new advanced VSS incremental conductance MPPT algorithm for PV systems. ISA Trans. 2016, 62, 30–38. [Google Scholar] [CrossRef] [PubMed]
  14. Amir, A.; Amir, A.; Selvaraj, J.; Rahima, N.A.; Abusorrah, A.M. Conventional and modified MPPT techniques with direct control and dual scaled adaptive step-size. Sol. Energy 2017, 157, 1017–1031. [Google Scholar] [CrossRef]
  15. Thangavelu, A.; Vairakannu, S.; Parvathyshankar, D. Linear open circuit voltage-variable step-sizeincremental conductance strategy-based hybrid MPPT controller for remote power applications. IET Power Electron. 2017, 10, 1363–1376. [Google Scholar] [CrossRef]
  16. Teng, J.H.; Huang, W.H.; Hsu, T.A.; Wang, C.Y. Novel and fast maximum power point tracking for photovoltaic generation. IEEE Trans. Ind. Electron. 2016, 63, 4955–4966. [Google Scholar] [CrossRef]
  17. Na, W.; Chen, P.; Kim, J. An improvement of a fuzzy logic-controlled maximum power point tracking algorithm for photovoltic applications. Appl. Sci. 2017, 7, 326. [Google Scholar] [CrossRef]
  18. Hamed, H.D.; Keypour, R.; Khalghani, M.R.; Khooban, M.H. A new approach in MPPT for photovoltaic array based on extremum seeking control under uniform and non-uniform irradiances. Sol. Energy 2013, 94, 28–36. [Google Scholar]
  19. Kchaou, A.; Naamane, A.; Koubaa, Y.; M’sirdi, N. Second order sliding mode-based MPPT control for photovoltaic applications. Sol. Energy 2017, 155, 758–769. [Google Scholar] [CrossRef]
  20. Renaudineau, H.; Donatantonio, F.; Fontchastagner, J.; Petrone, G.; Spagnuolo, G.; Martin, J.P.; Pierfederici, S. A PSO-based global MPPT technique for distributed PV power generation. IEEE Trans. Ind. Electron. 2015, 62, 1047–1058. [Google Scholar] [CrossRef]
  21. Mohanty, S.; Subudhi, B.; Ray, P.K. A new MPPT design using grey wolf optimization technique for photovoltaic system under partial shading conditions. IEEE Trans. Sustain. Energy 2016, 7, 181–188. [Google Scholar] [CrossRef]
  22. Ding, M.; Lv, D.; Yang, C.; Li, S.; Fang, Q.; Yang, B.; Zhang, X. Global maximum power point tracking of PV systems under partial shading condition: A transfer reinforcement learning approach. Appl. Sci. 2019, 9, 2769. [Google Scholar] [CrossRef] [Green Version]
  23. Kalogerakis, C.; Koutroulis, E.; Lagoudakis, M.G. Global MPPT based on machine-learning for PV arrays operating under partial shading conditions. Appl. Sci. 2020, 10, 700. [Google Scholar] [CrossRef] [Green Version]
  24. Liu, Y.H.; Chen, J.H.; Huang, J.W. Global maximum power point tracking algorithm for PV systems operating under partially shaded conditions using the segmentation search method. Sol. Energy 2014, 103, 350–363. [Google Scholar] [CrossRef]
  25. Patel, H.; Agarwal, V. Maximum power point tracking scheme for PV systems operating under partially shaded conditions. IEEE Trans. Ind. Electron. 2008, 55, 1689–1698. [Google Scholar] [CrossRef]
  26. Boztepe, M.; Guinjoan, F.; Velasco-Quesada, G.; Silvestre, S.; Chouder, A.; Karatepe, E. Global MPPT scheme for photovoltaic string inverters based on restricted voltage window search algorithm. IEEE Trans. Ind. Electron. 2014, 61, 3302–3312. [Google Scholar] [CrossRef]
  27. Wang, Y.; Li, Y.; Ruan, X. High-accuracy and fast-speed MPPT methods for PV string under partially shaded conditions. IEEE Trans. Ind. Electron. 2016, 63, 235–245. [Google Scholar] [CrossRef]
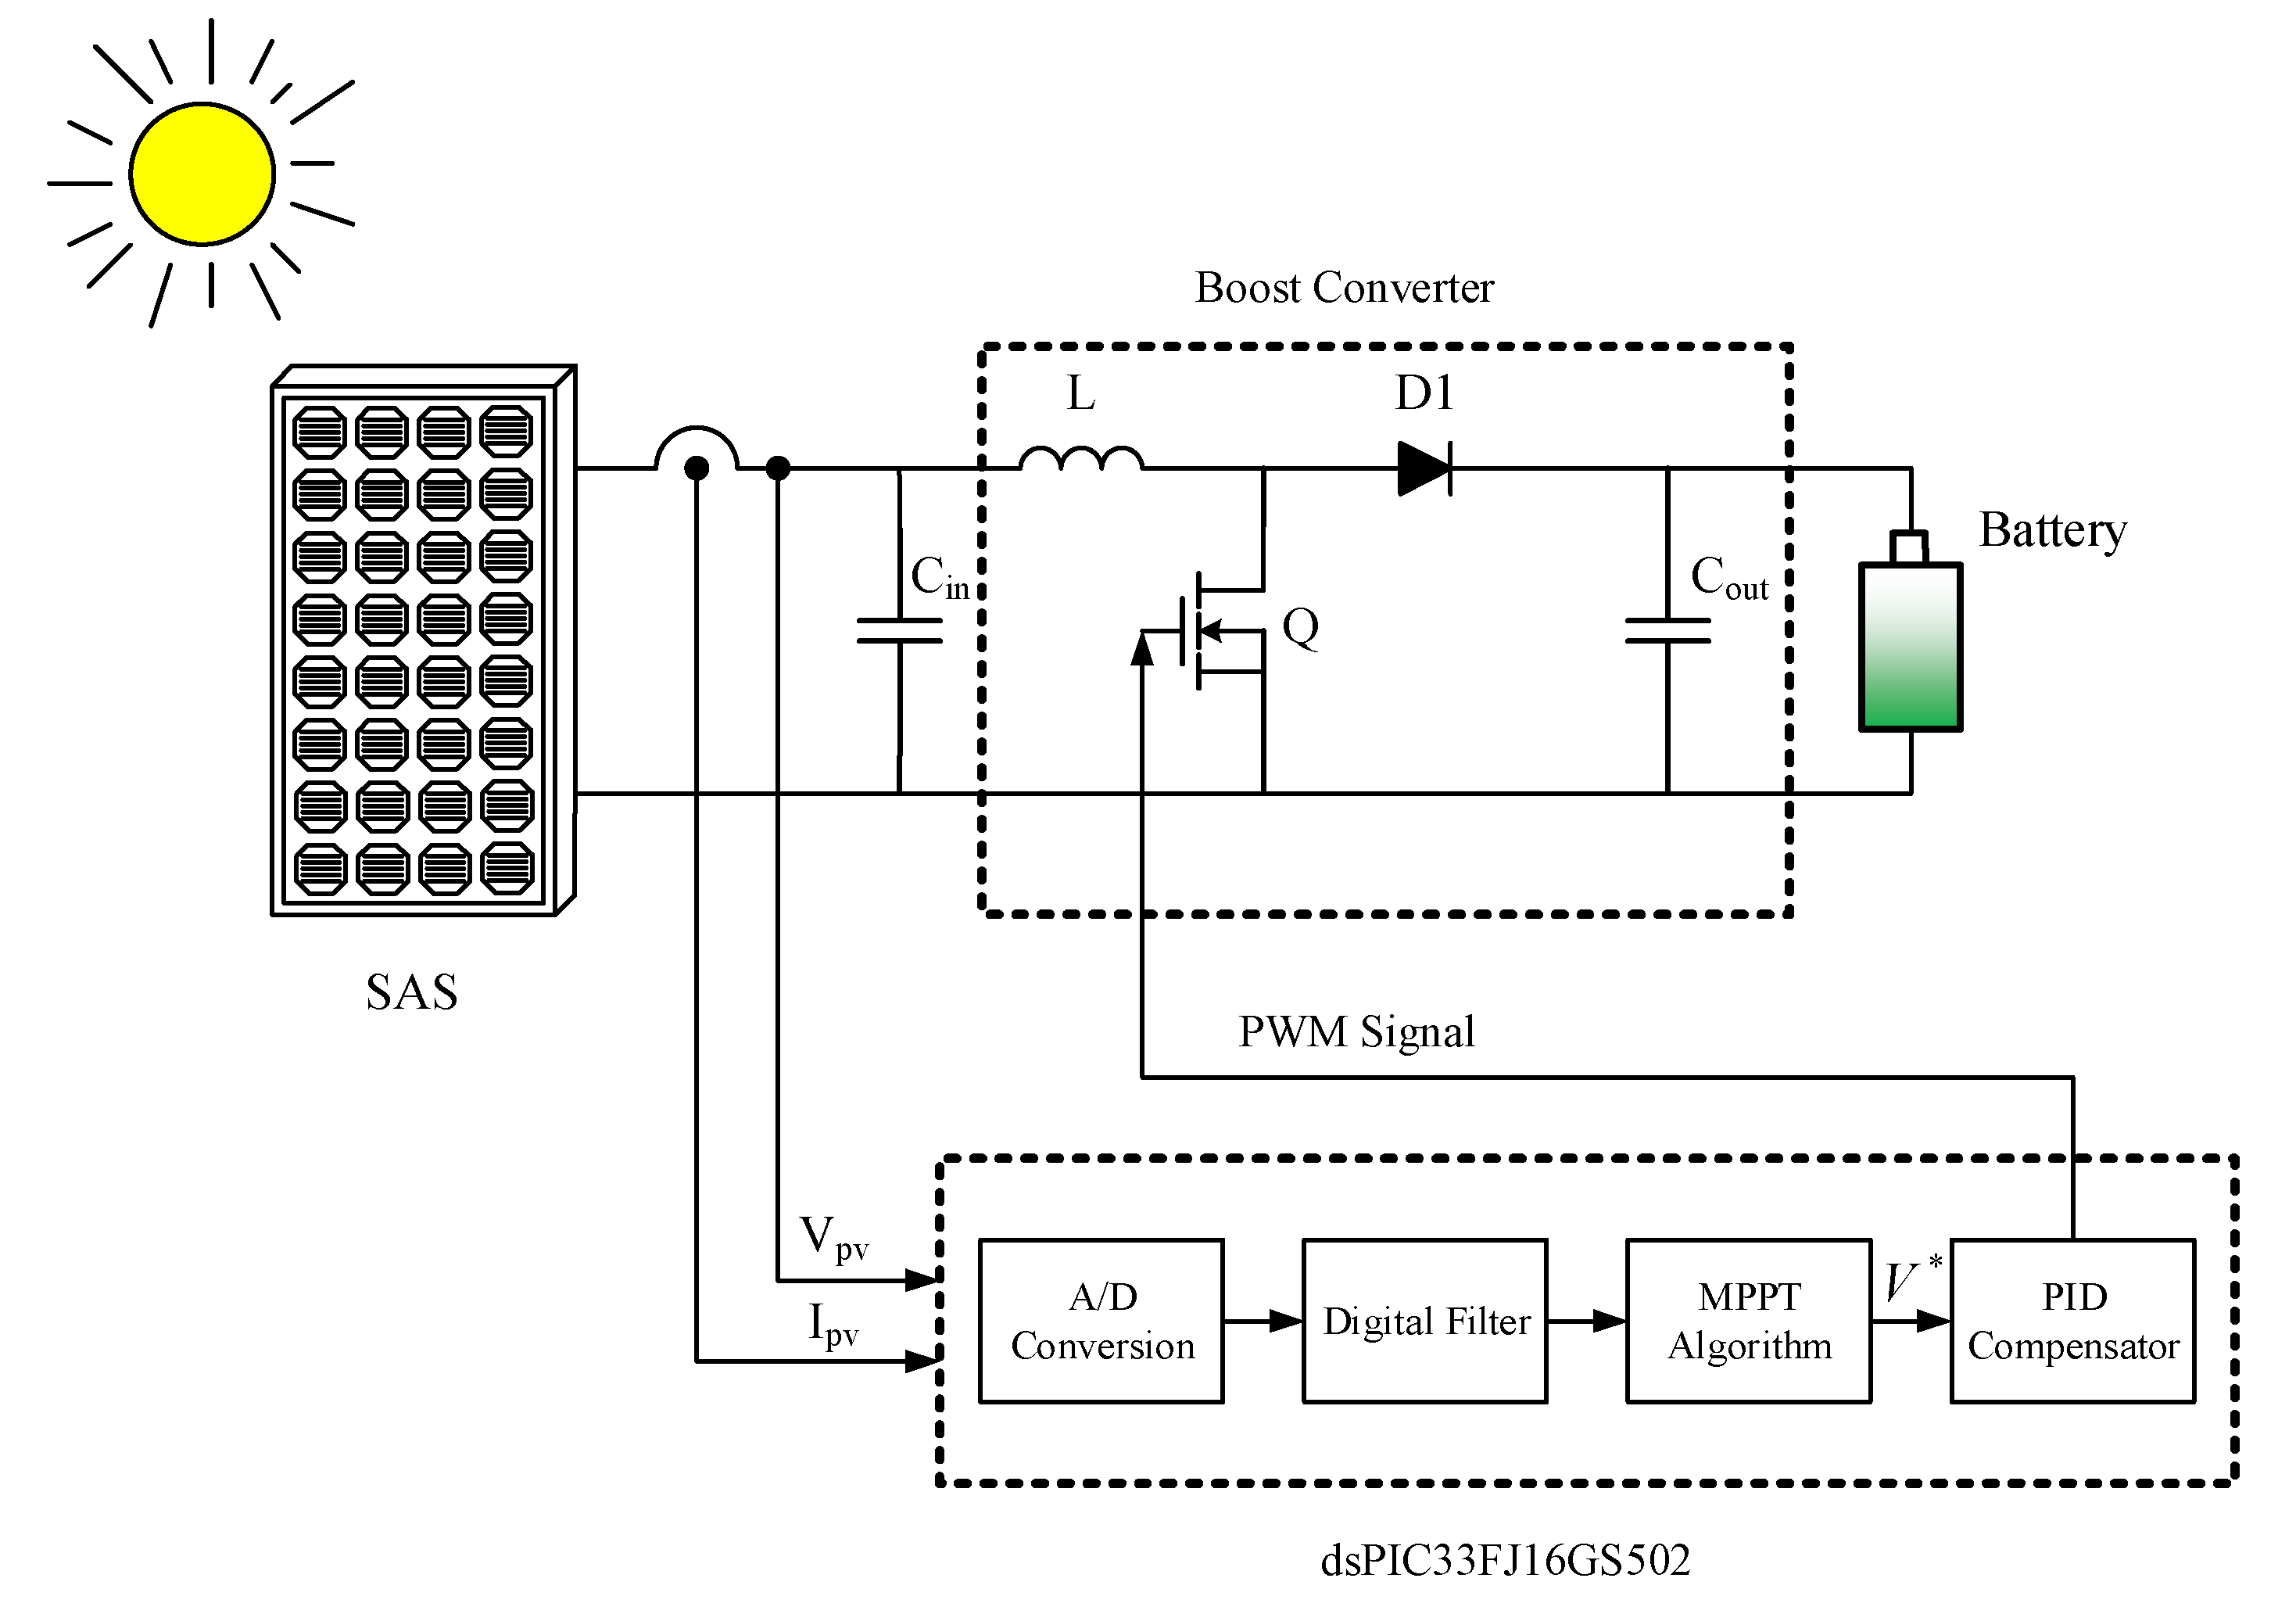
Figure 1. Equivalent circuit of solar cell.
Applsci 10 05214 g001
Figure 2. Illustration of tracking energy loss. MPP: Maximum Power Point.
Applsci 10 05214 g002
Figure 3. Flow chart of the proposed method. VSS: Variable Step Size; INC: Incremental Conductance; MPPT: Maximum Power Point Tracking.
Applsci 10 05214 g003
Figure 4. Simulation results of different M values (a) M = 0.65, (b) M = 1.08, (c) M = 1.08/0.65 under increasing irradiance level.
Applsci 10 05214 g004
Figure 5. Simulation results of different M values (a) M = 0.65, (b) M = 1.8, (c) M = 0.65/1.8 under decreasing irradiance levels.
Applsci 10 05214 g005
Figure 6. Power tracking curves of different M values.
Applsci 10 05214 g006
Figure 7. The block diagram of the proposed system. A/D: Analog-to-Digital; PID: Proportional-Integral-Derivative.
Applsci 10 05214 g007
Figure 8. Experimental setup and the testing environment.
Applsci 10 05214 g008
Figure 9. Experimental results of different M values (a) M = 0.65, (b) M = 1.08, (c) M = 1.08/0.65.
Applsci 10 05214 g009aApplsci 10 05214 g009b
Figure 10. Experimental results of different M values (a) M = 0.65, (b) M = 1.8, (c) M = 0.65/1.8.
Applsci 10 05214 g010
Table 1. Specification of the utilized boost converter.
SpecificationDesigned Parameter
Input VoltageVin = 20–100 VL11.08 mH
Rated Output VoltageVo = 200 VC1100 μF
Rated Output CurrentIo = 3 AQ1IPP65R110CFDA
Rated Output PowerPo = 600 WD1C3D10060
Switching Frequencyfs = 50 kHz
Output Voltage RippleVo/Vo ≤ 1%
Table 2. Specifications of the utilized Photovoltaic Module.
ParametersValue
Maximum PV Power599.8 W
Voltage at MPP67.52 V
Current at MPP8.885 A
Open circuit voltage, Voc79.08 V
Short circuit current, Isc9.41 A
Note: Irradiance 1000 W/m2 and panel temperature 25 °C.
Table 3. The optimal scaling factor (M) for different irradiance levels.
W/m2Optimal MW/m2Optimal M
1005.406000.90
2002.707000.78
3001.808000.65
4001.359000.60
5001.0810000.54
Table 4. Summarized simulated results of different M values.
tt of 500 W/m2tt of 800 W/m2tt of 300 W/m2ta of 500 W/m2ta of 800 W/m2ta of 300 W/m2Total Energy Loss
VSS INC (M = 0.65)4.7 s0.4 s0.6 s99.8%99.9%99.9%3145.6 W
VSS INC (M = 1.08)2.9 s0.4 s0.4 s99.8%98.2%99.9%2175.7 W
VSS INC (M = 1.8)2.9 s0.4 s0.4 s97.5%97.8%99.9%2446.3 W
Proposed method2.9 s0.4 s0.4 s99.8%99.9%99.9%1970.2 W
Note: tt: tracking time, ta: tracking accuracy.
Table 5. Summarized experimental results of different M values.
tt of ii Casett of di Caseta of ii Caseta of di CaseTotal Energy Loss of ii CaseTotal Energy Loss of di Case
VSS INC (M = 0.65)2.2 s1.5 s99.8%99.1%401.5 W402.5 W
VSS INC (M = 1.08)1.5 sX97.7%X275.6 WX
VSS INC (M = 1.8)XN.A.X96.3%X358.6 W
Proposed method1.5 s1.5 s99.8%99.8%225.5 W282.3 W
Note: tt: tracking time, ta: tracking accuracy, ii: increasing irradiance, di: decreasing irradiance.

