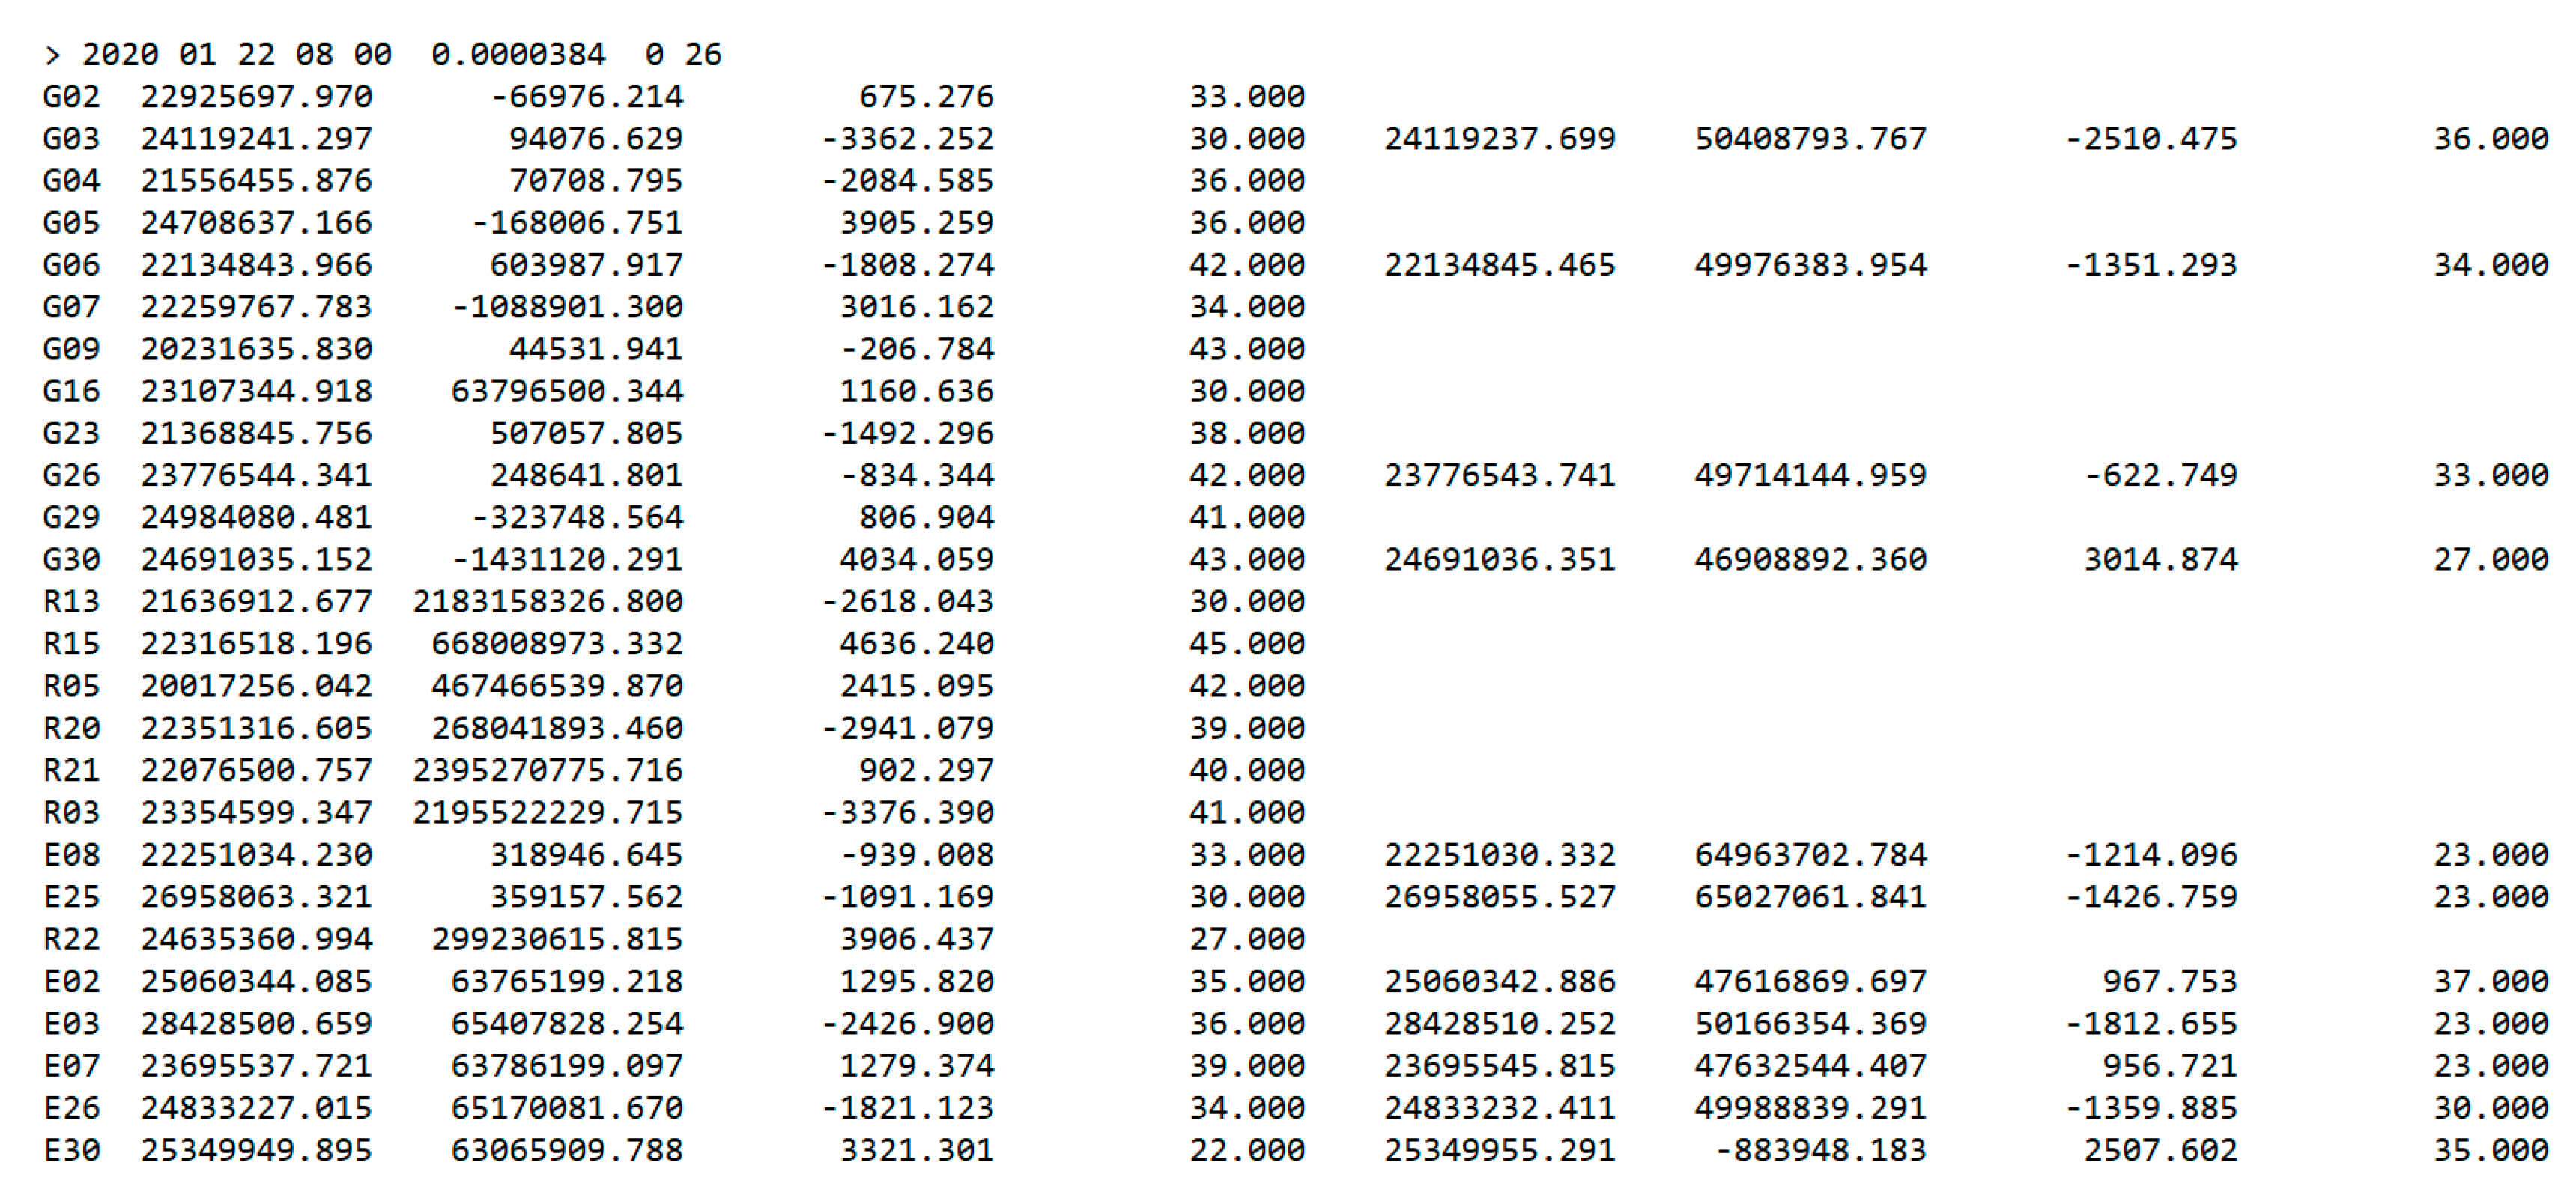
Figure 1.
Single epoch for a Huawei P30 Pro smartphone collected in RINEX 3.03 (Receiver Independent Exchange Format 3.03).
Figure 1.
Single epoch for a Huawei P30 Pro smartphone collected in RINEX 3.03 (Receiver Independent Exchange Format 3.03).
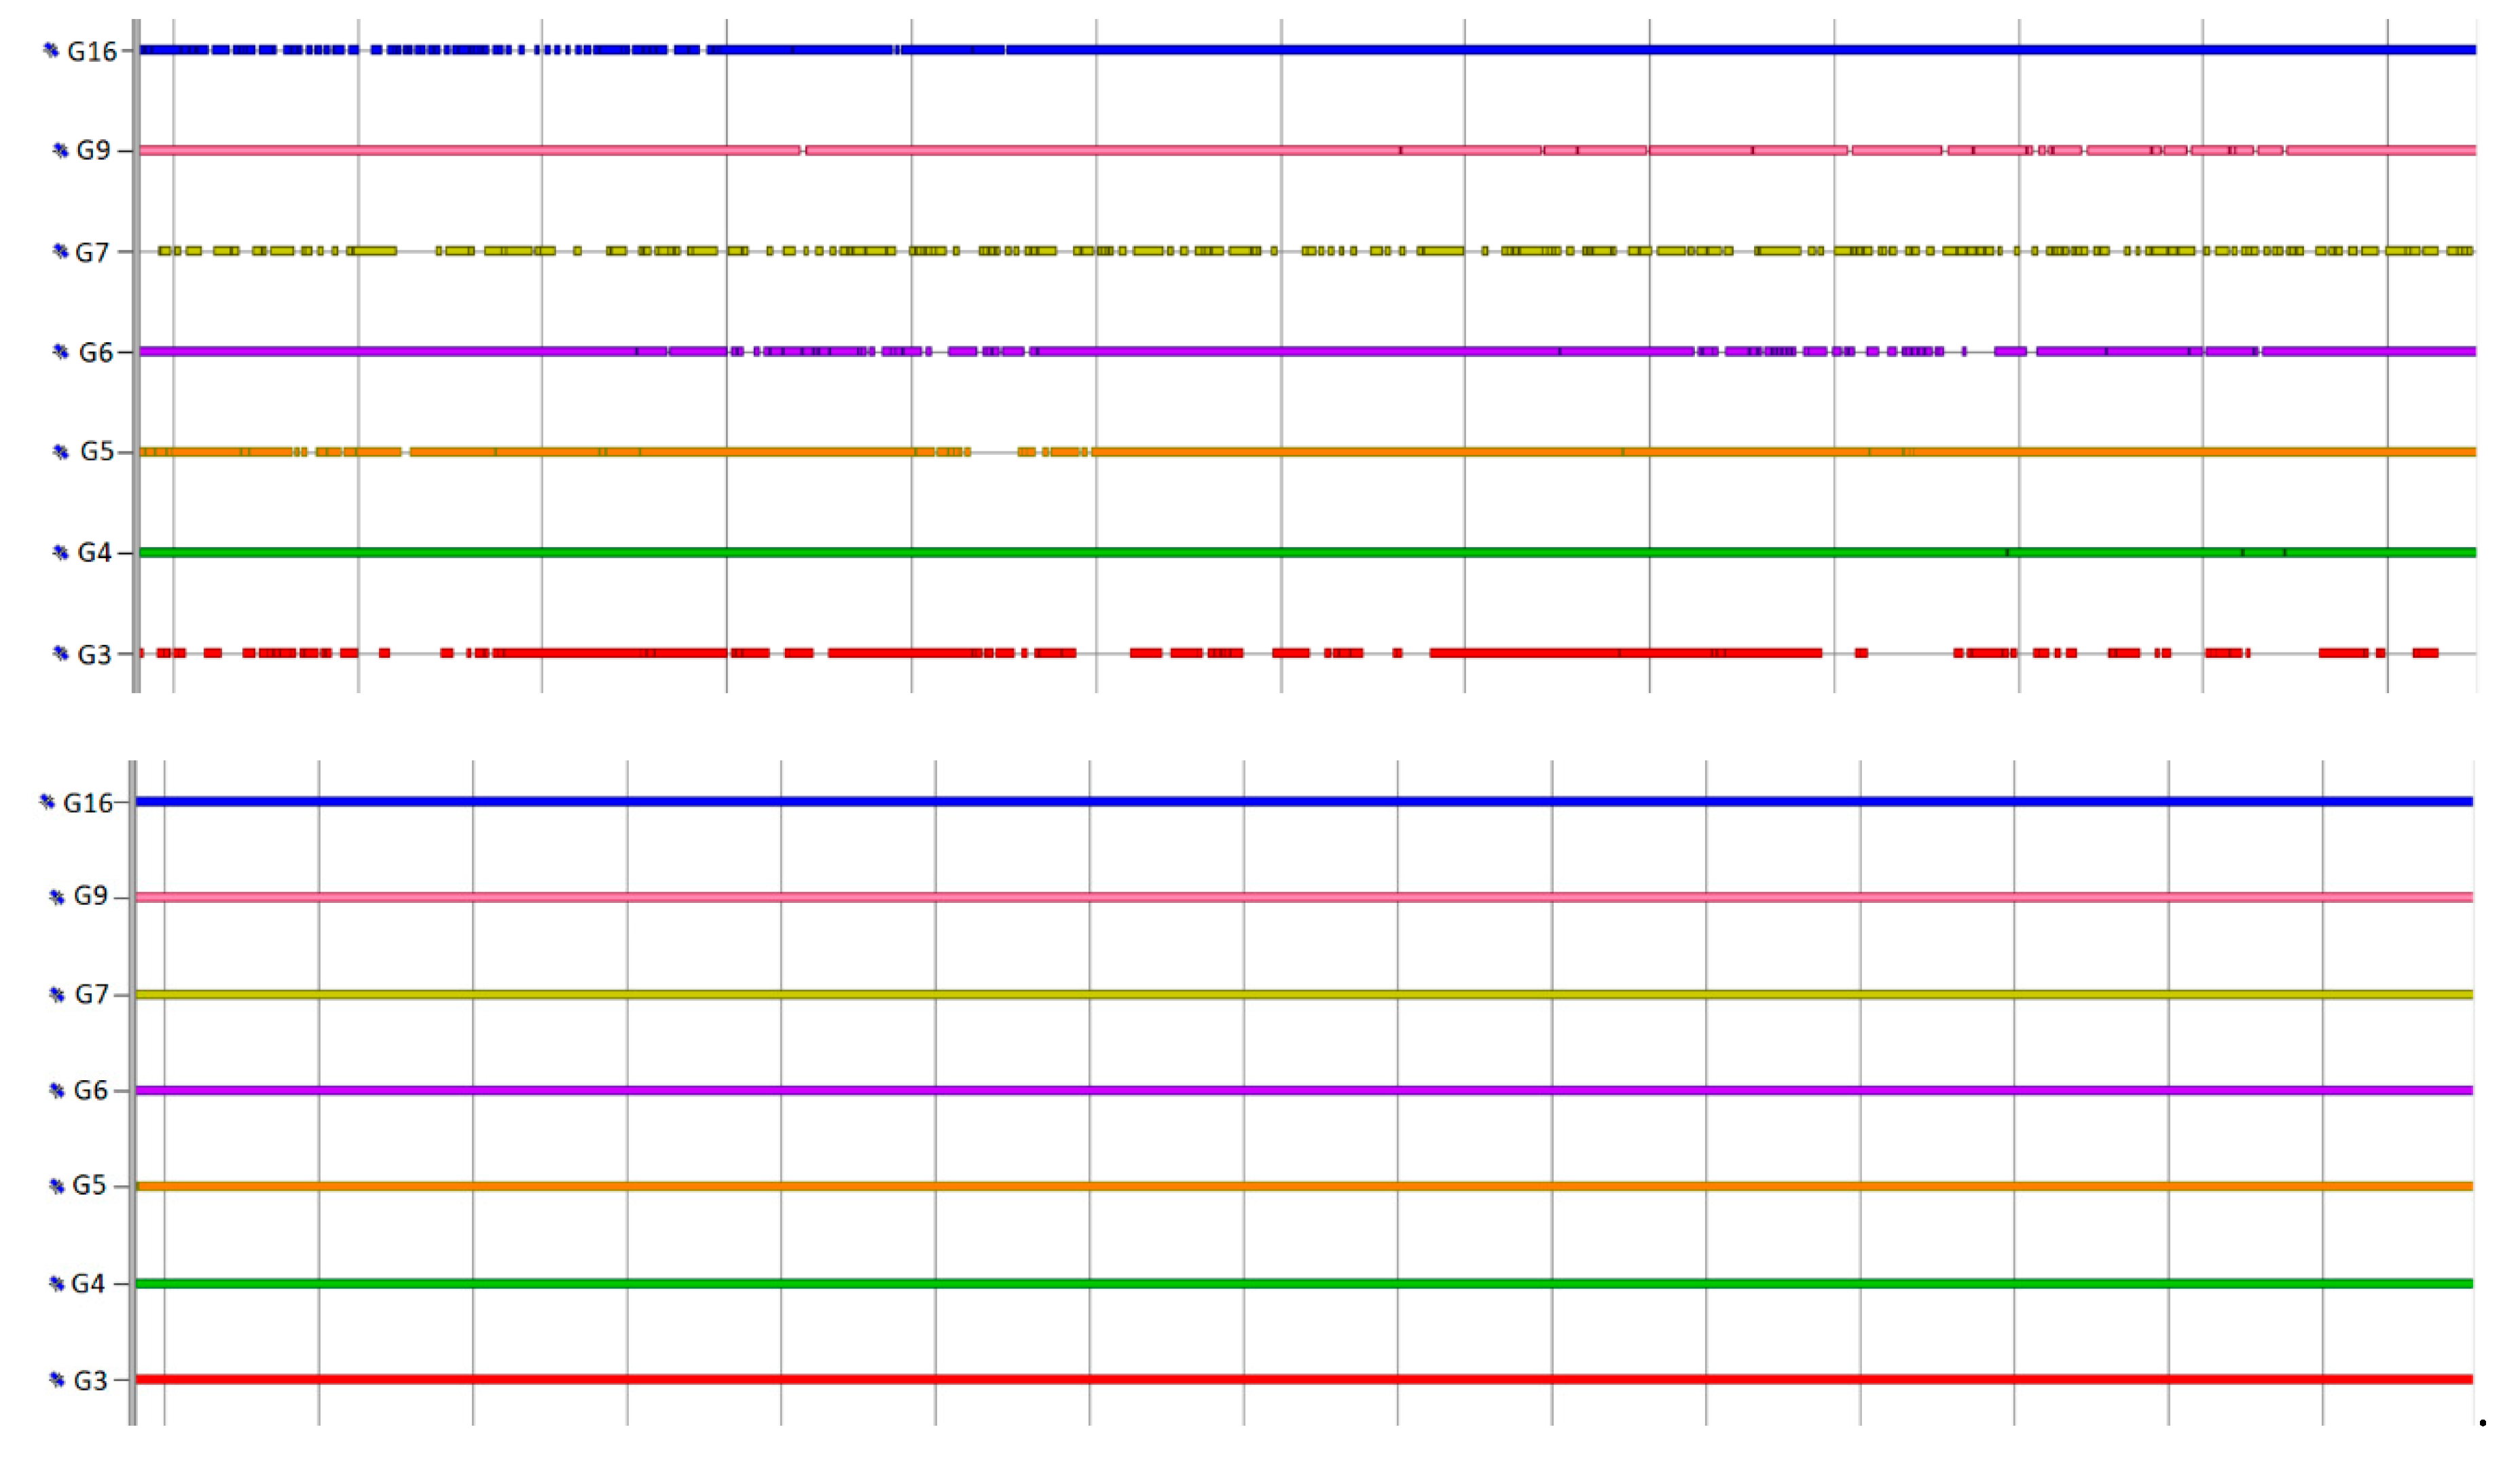
Figure 2.
Comparison of data quality collected by GEO++ RINEX Logger (upper) and RINEX ON (bottom).
Figure 2.
Comparison of data quality collected by GEO++ RINEX Logger (upper) and RINEX ON (bottom).
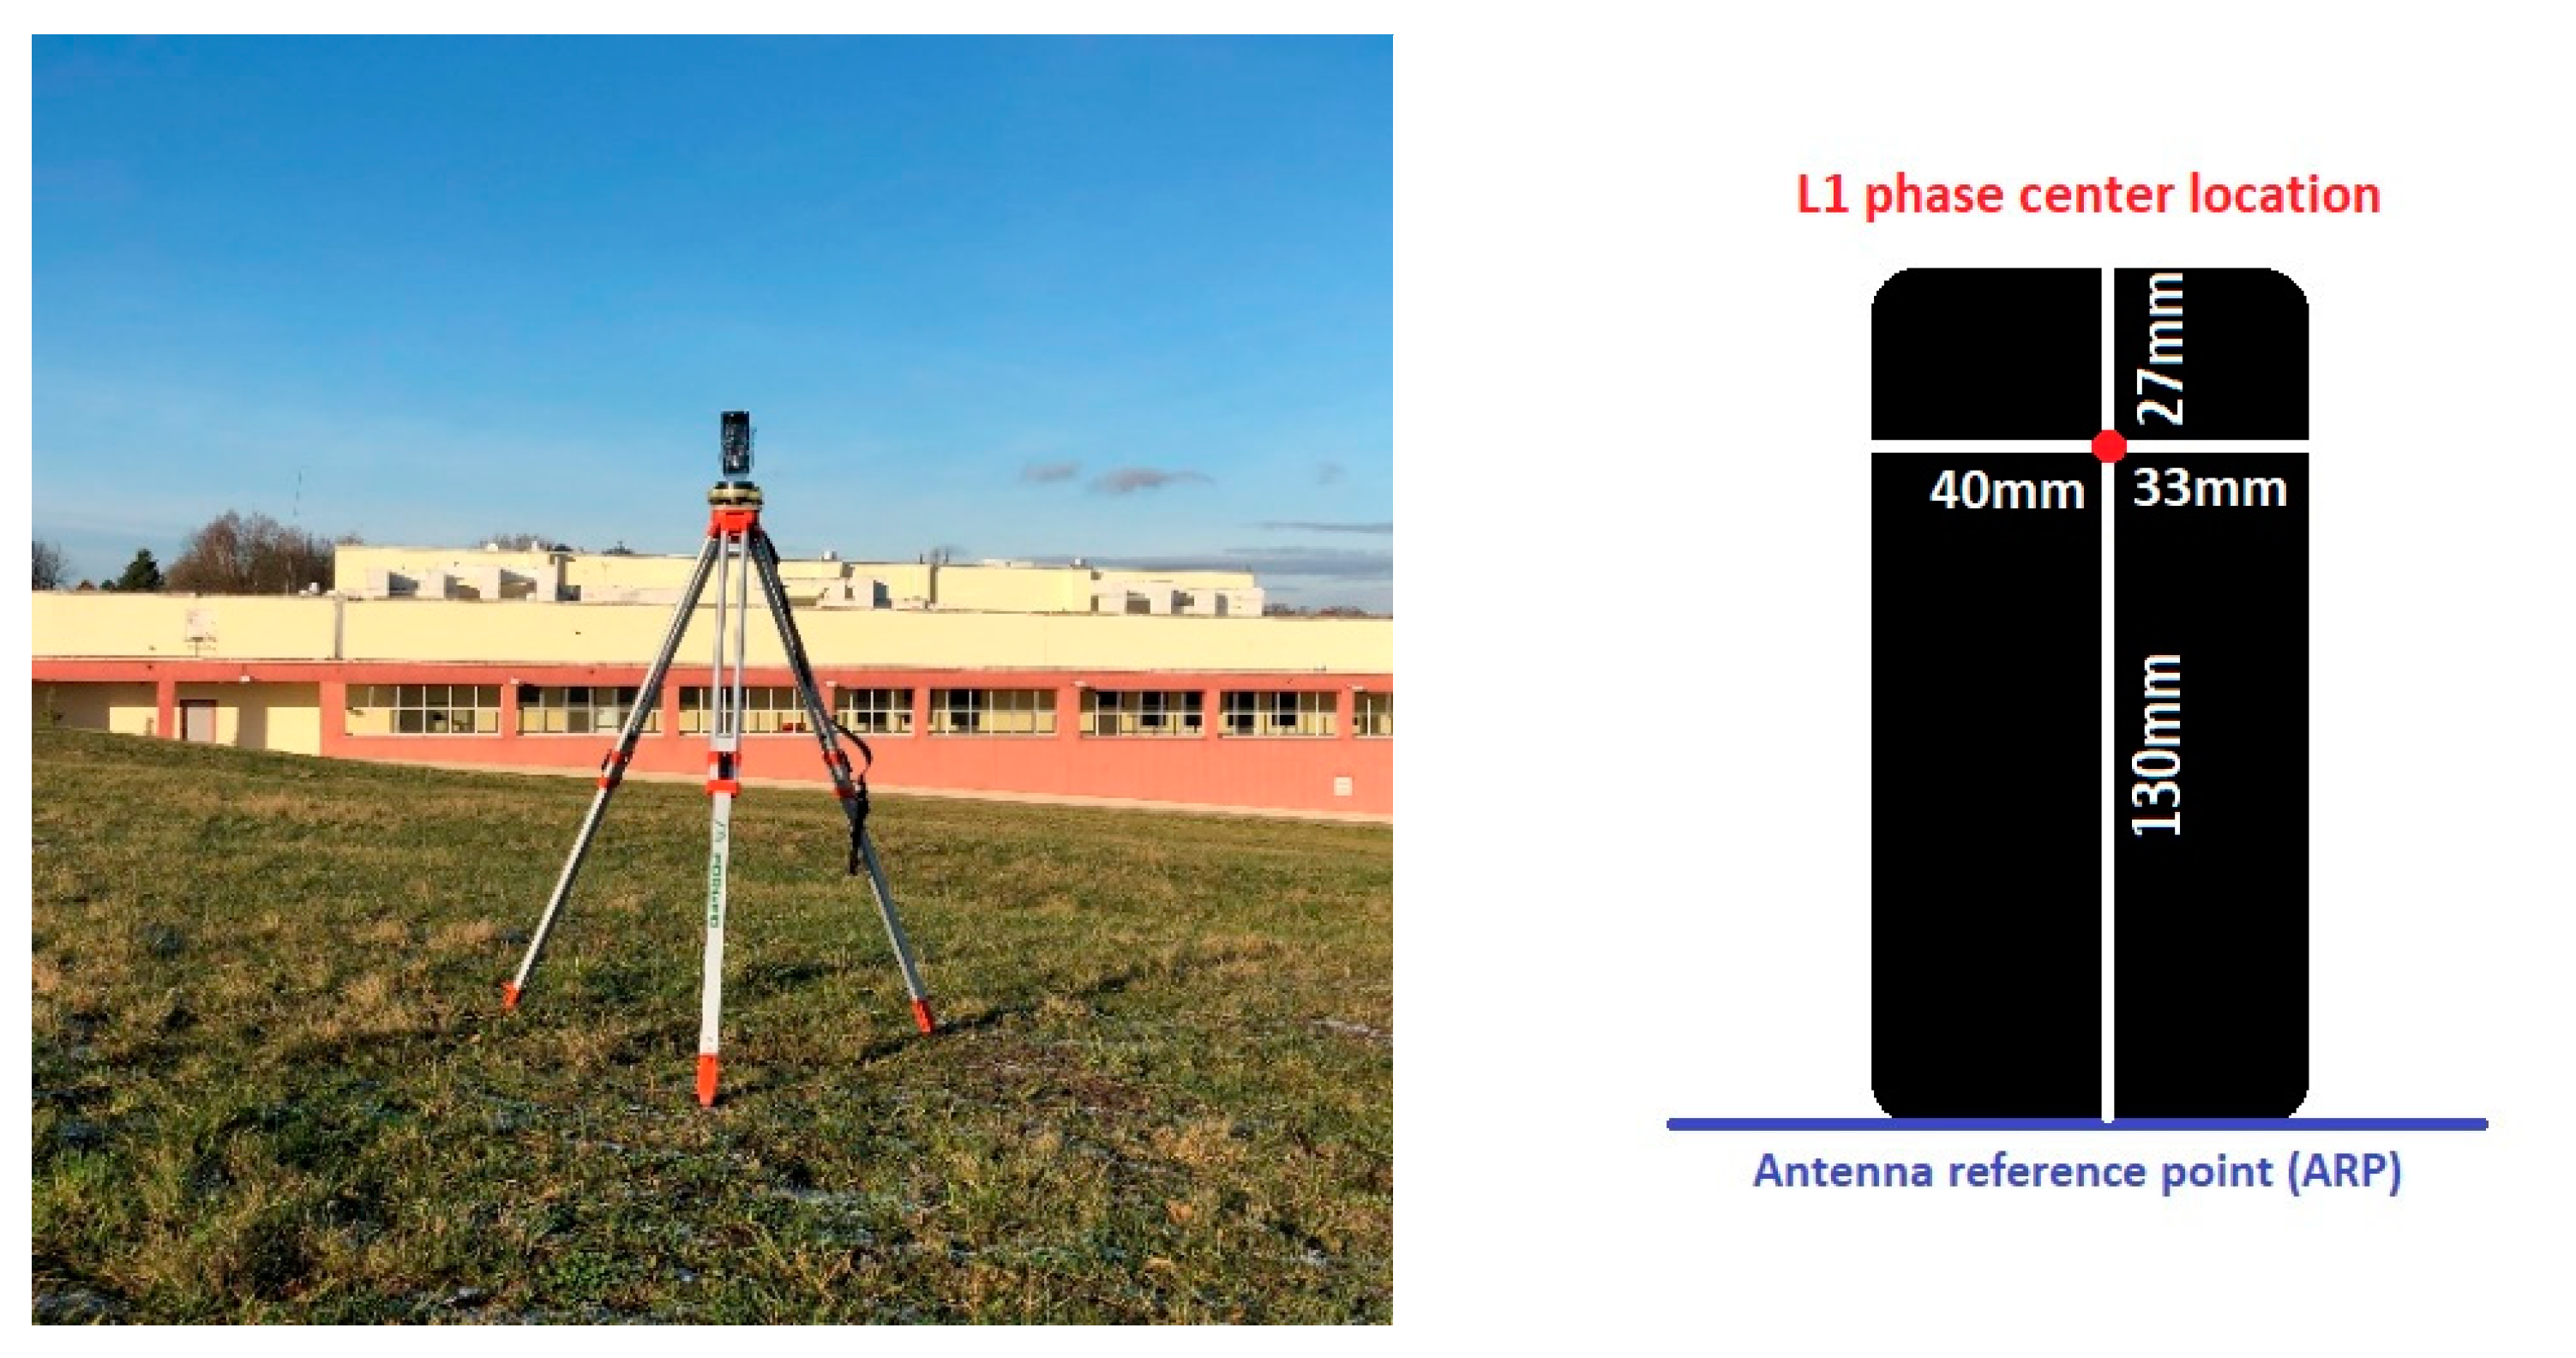
Figure 3.
Test area and the initial research on Huawei P30 Pro static positioning accuracy. Huawei P30 Pro L1 phase center location.
Figure 3.
Test area and the initial research on Huawei P30 Pro static positioning accuracy. Huawei P30 Pro L1 phase center location.
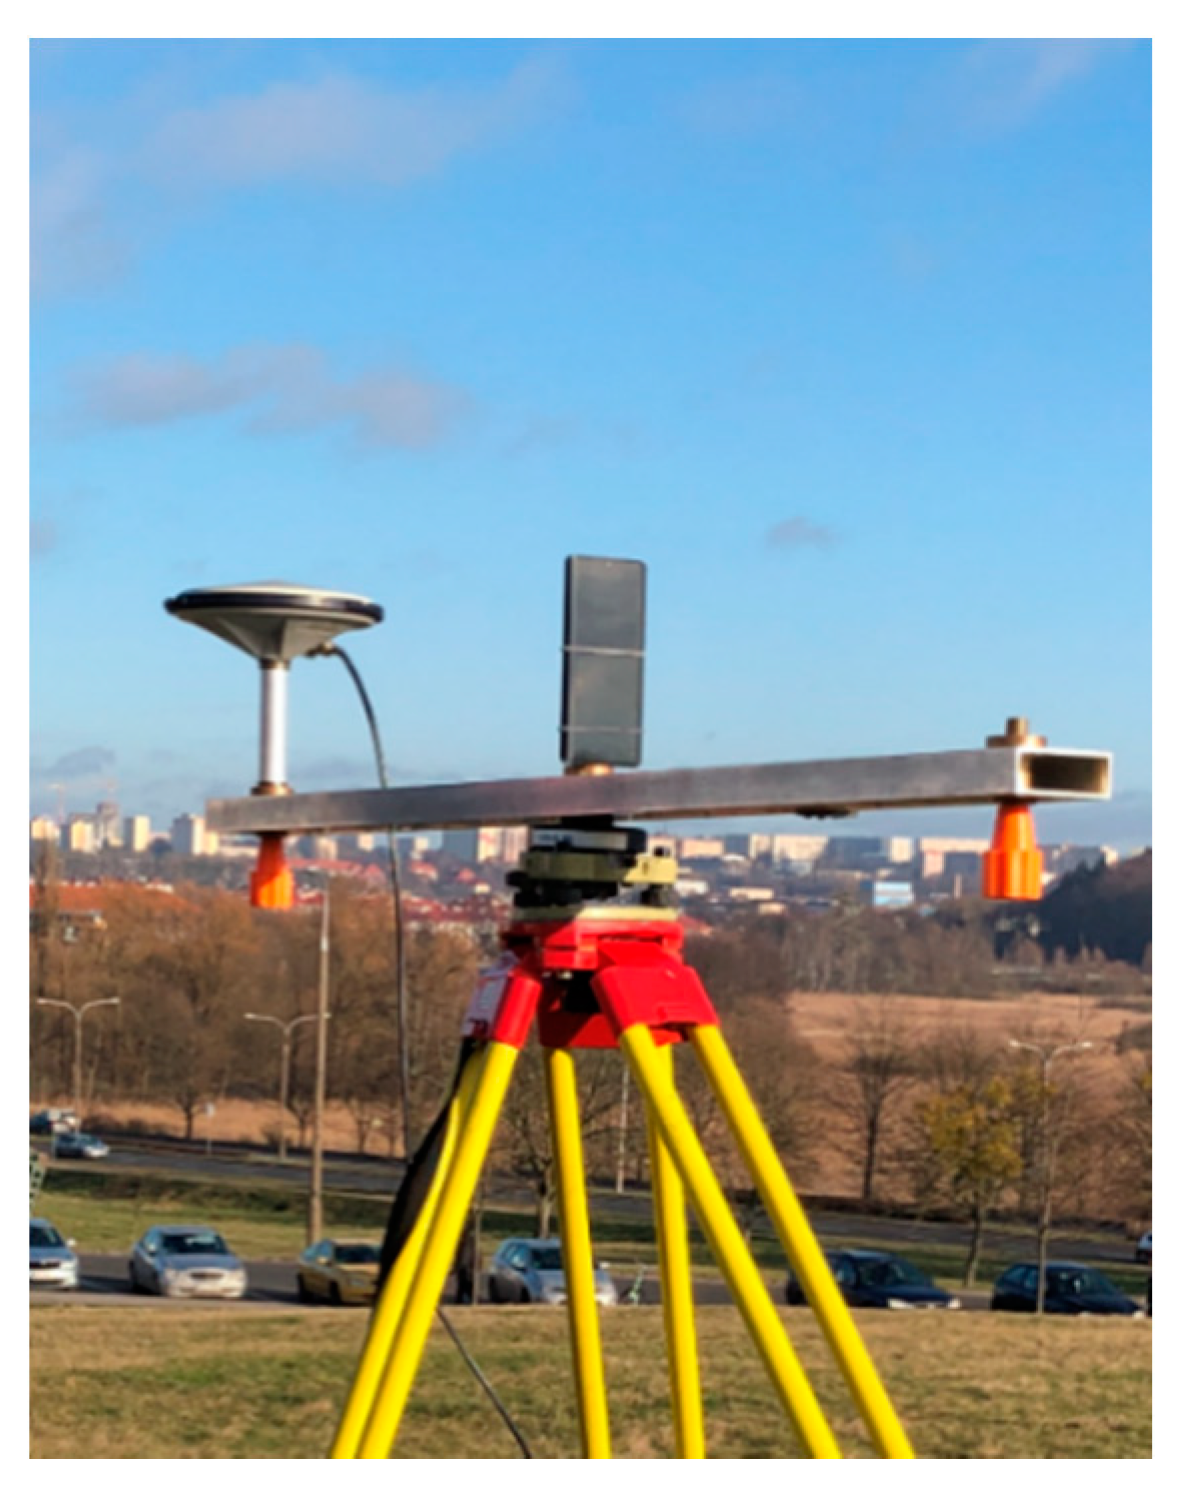
Figure 4.
Second test setup. Huawei P30 Pro mounted in vertical position.
Figure 4.
Second test setup. Huawei P30 Pro mounted in vertical position.
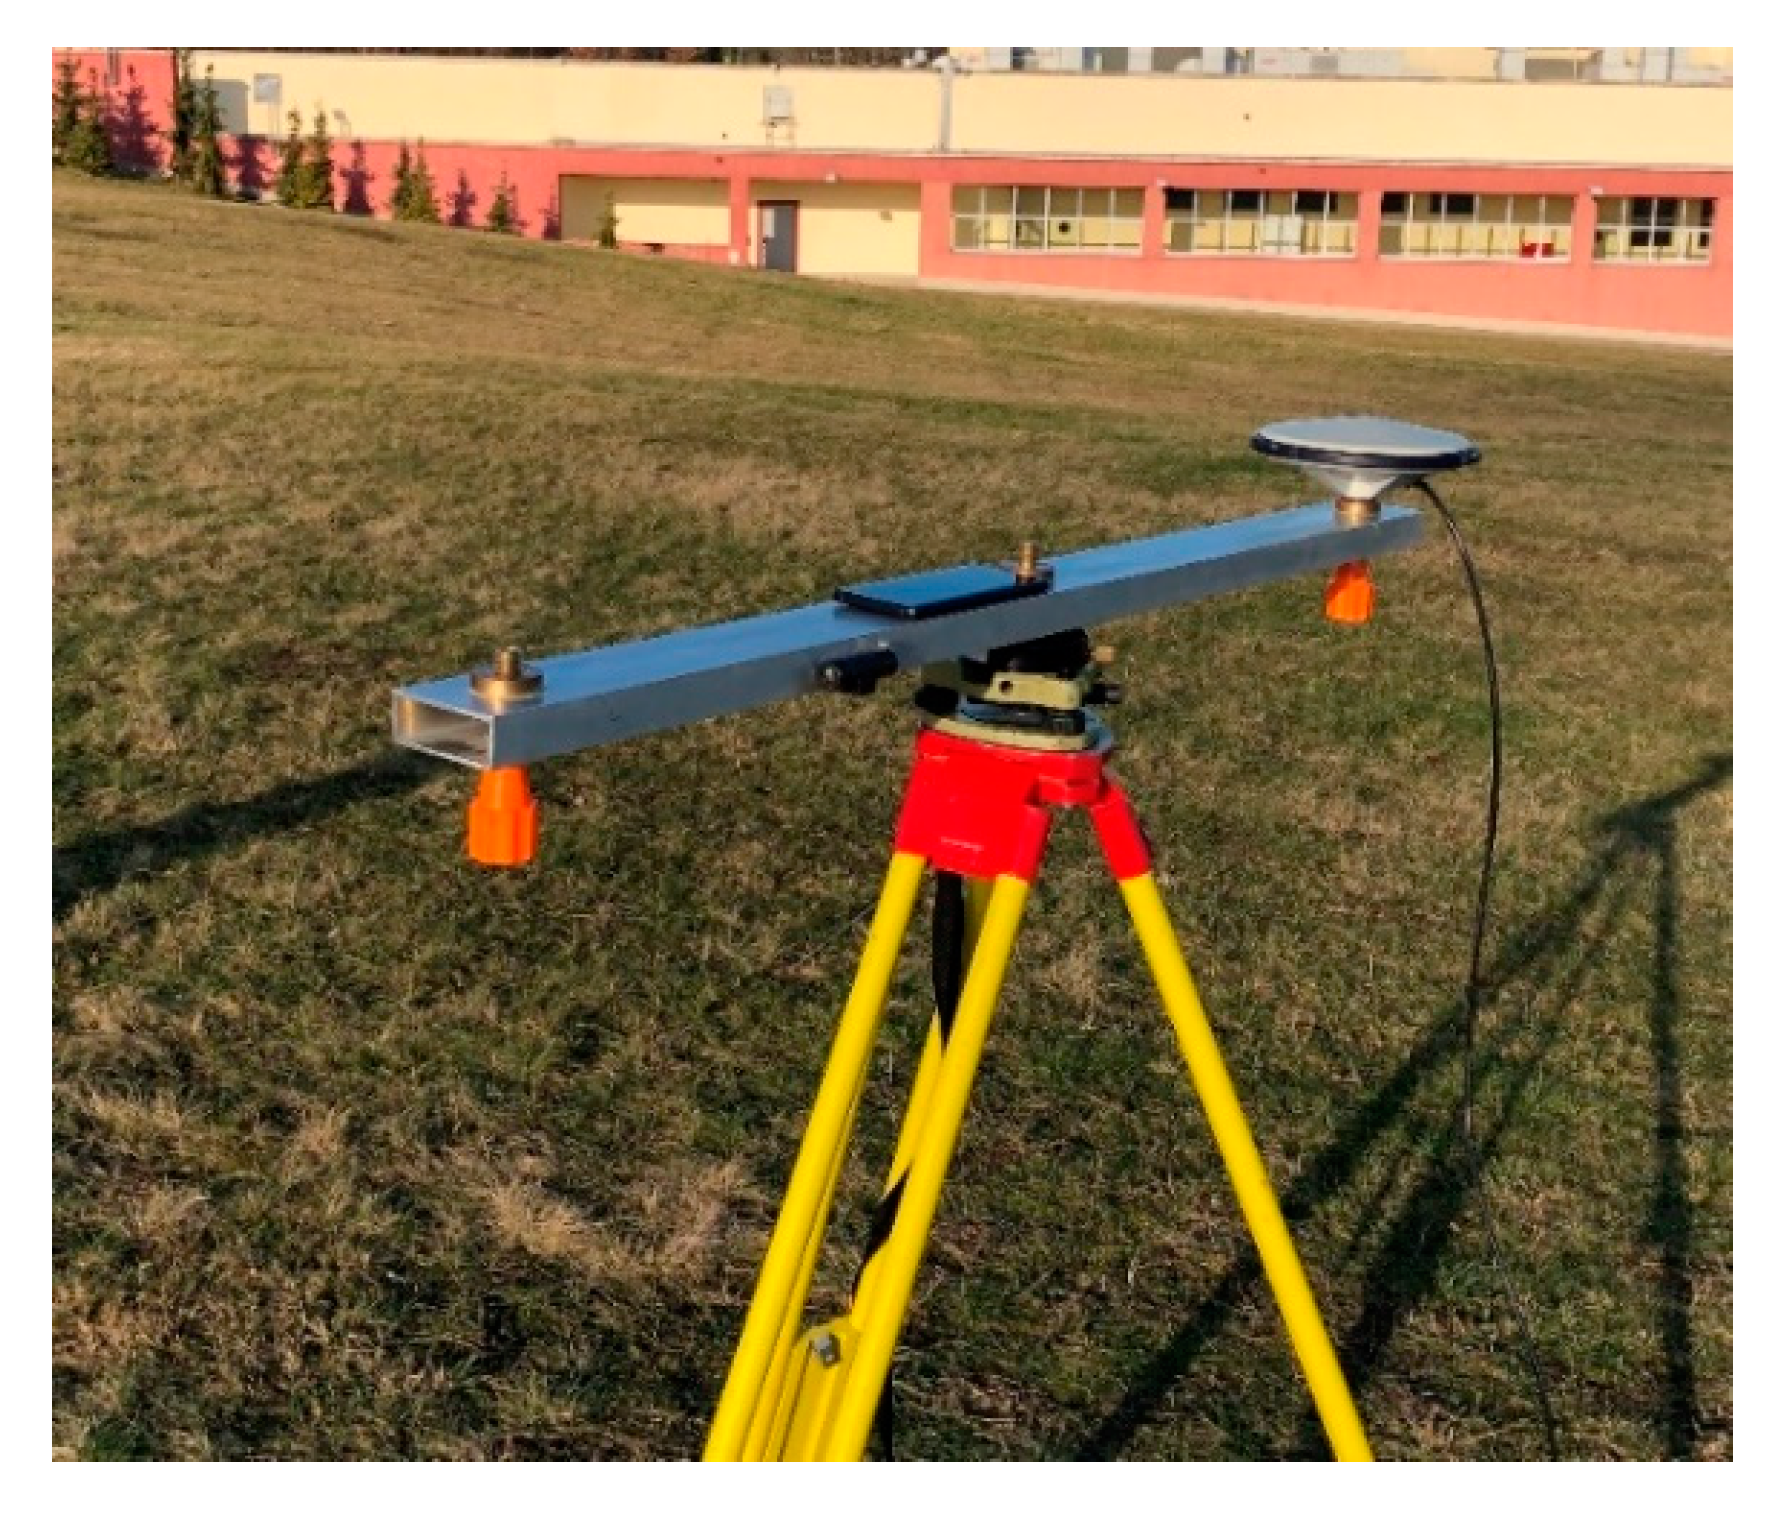
Figure 5.
Third test setup. Huawei P30 Pro mounted in a horizontal position.
Figure 5.
Third test setup. Huawei P30 Pro mounted in a horizontal position.
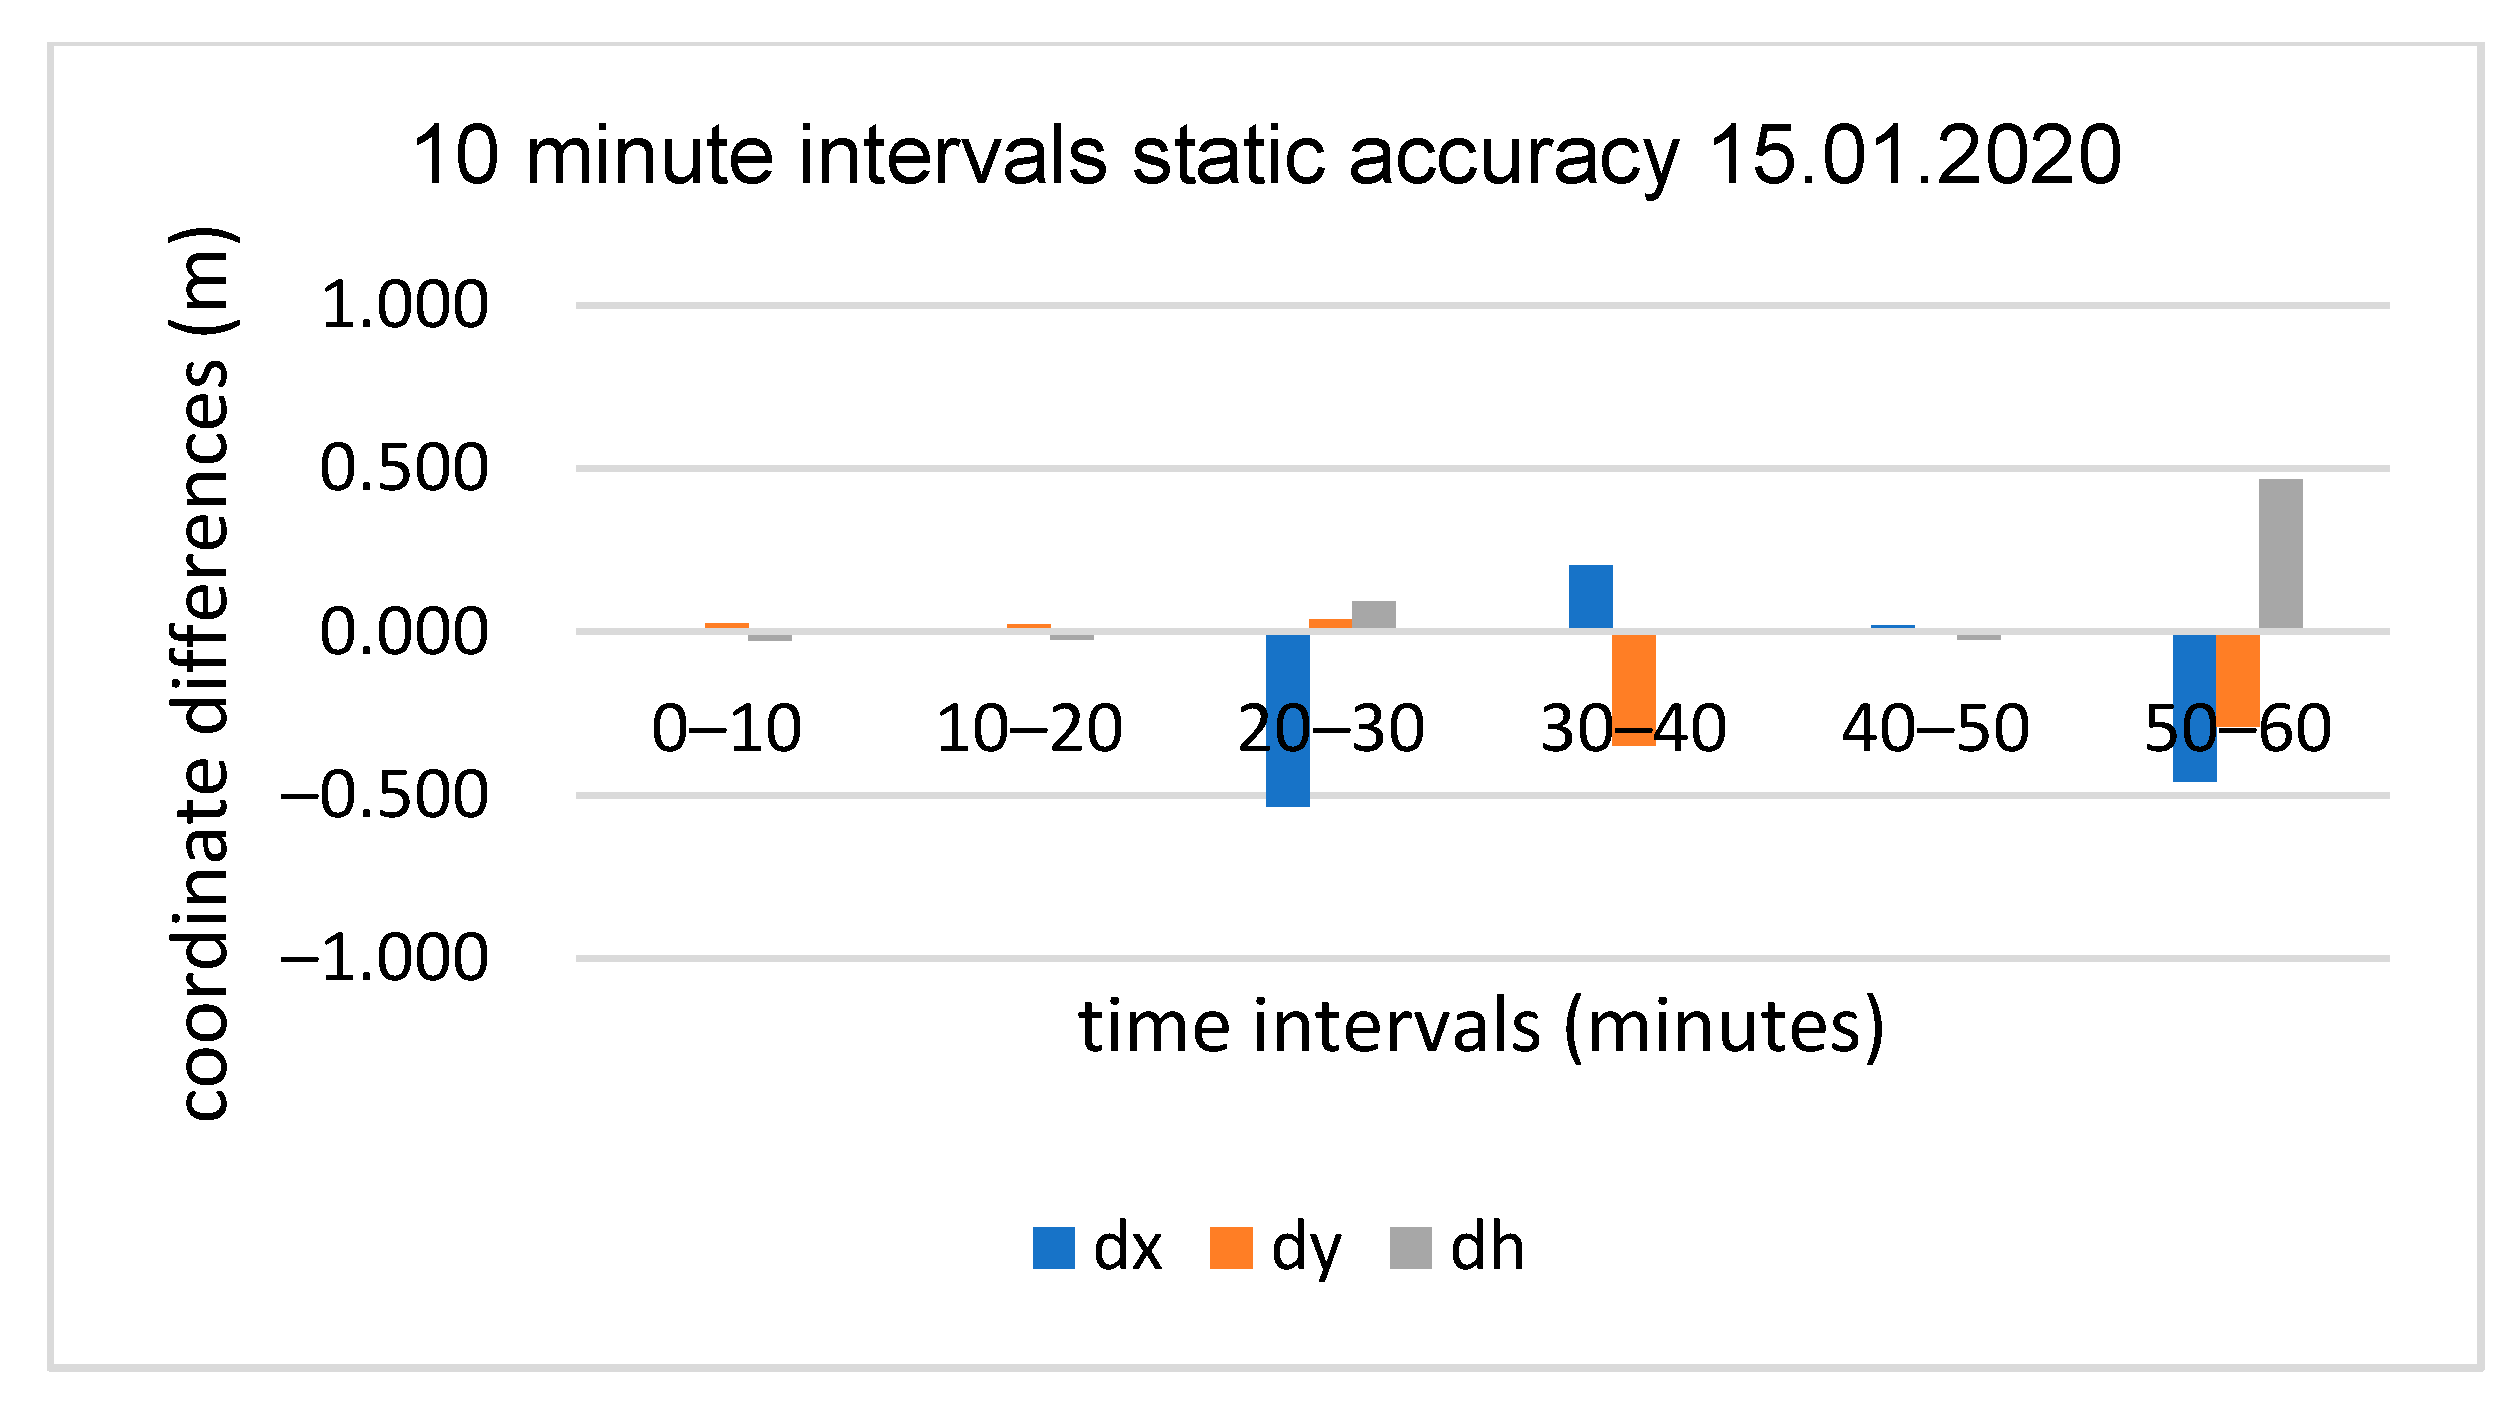
Figure 6.
10 min sub-session positioning results for initial test, baseline OPNT–P30Pro (4 km). OPNT: Olsztynski Park Naukowo-Technologiczny; dx, dy, dh: coordinate differences between the true position and smartphone static results in north (dx), east (dy) and height (dh) components, respectively.
Figure 6.
10 min sub-session positioning results for initial test, baseline OPNT–P30Pro (4 km). OPNT: Olsztynski Park Naukowo-Technologiczny; dx, dy, dh: coordinate differences between the true position and smartphone static results in north (dx), east (dy) and height (dh) components, respectively.
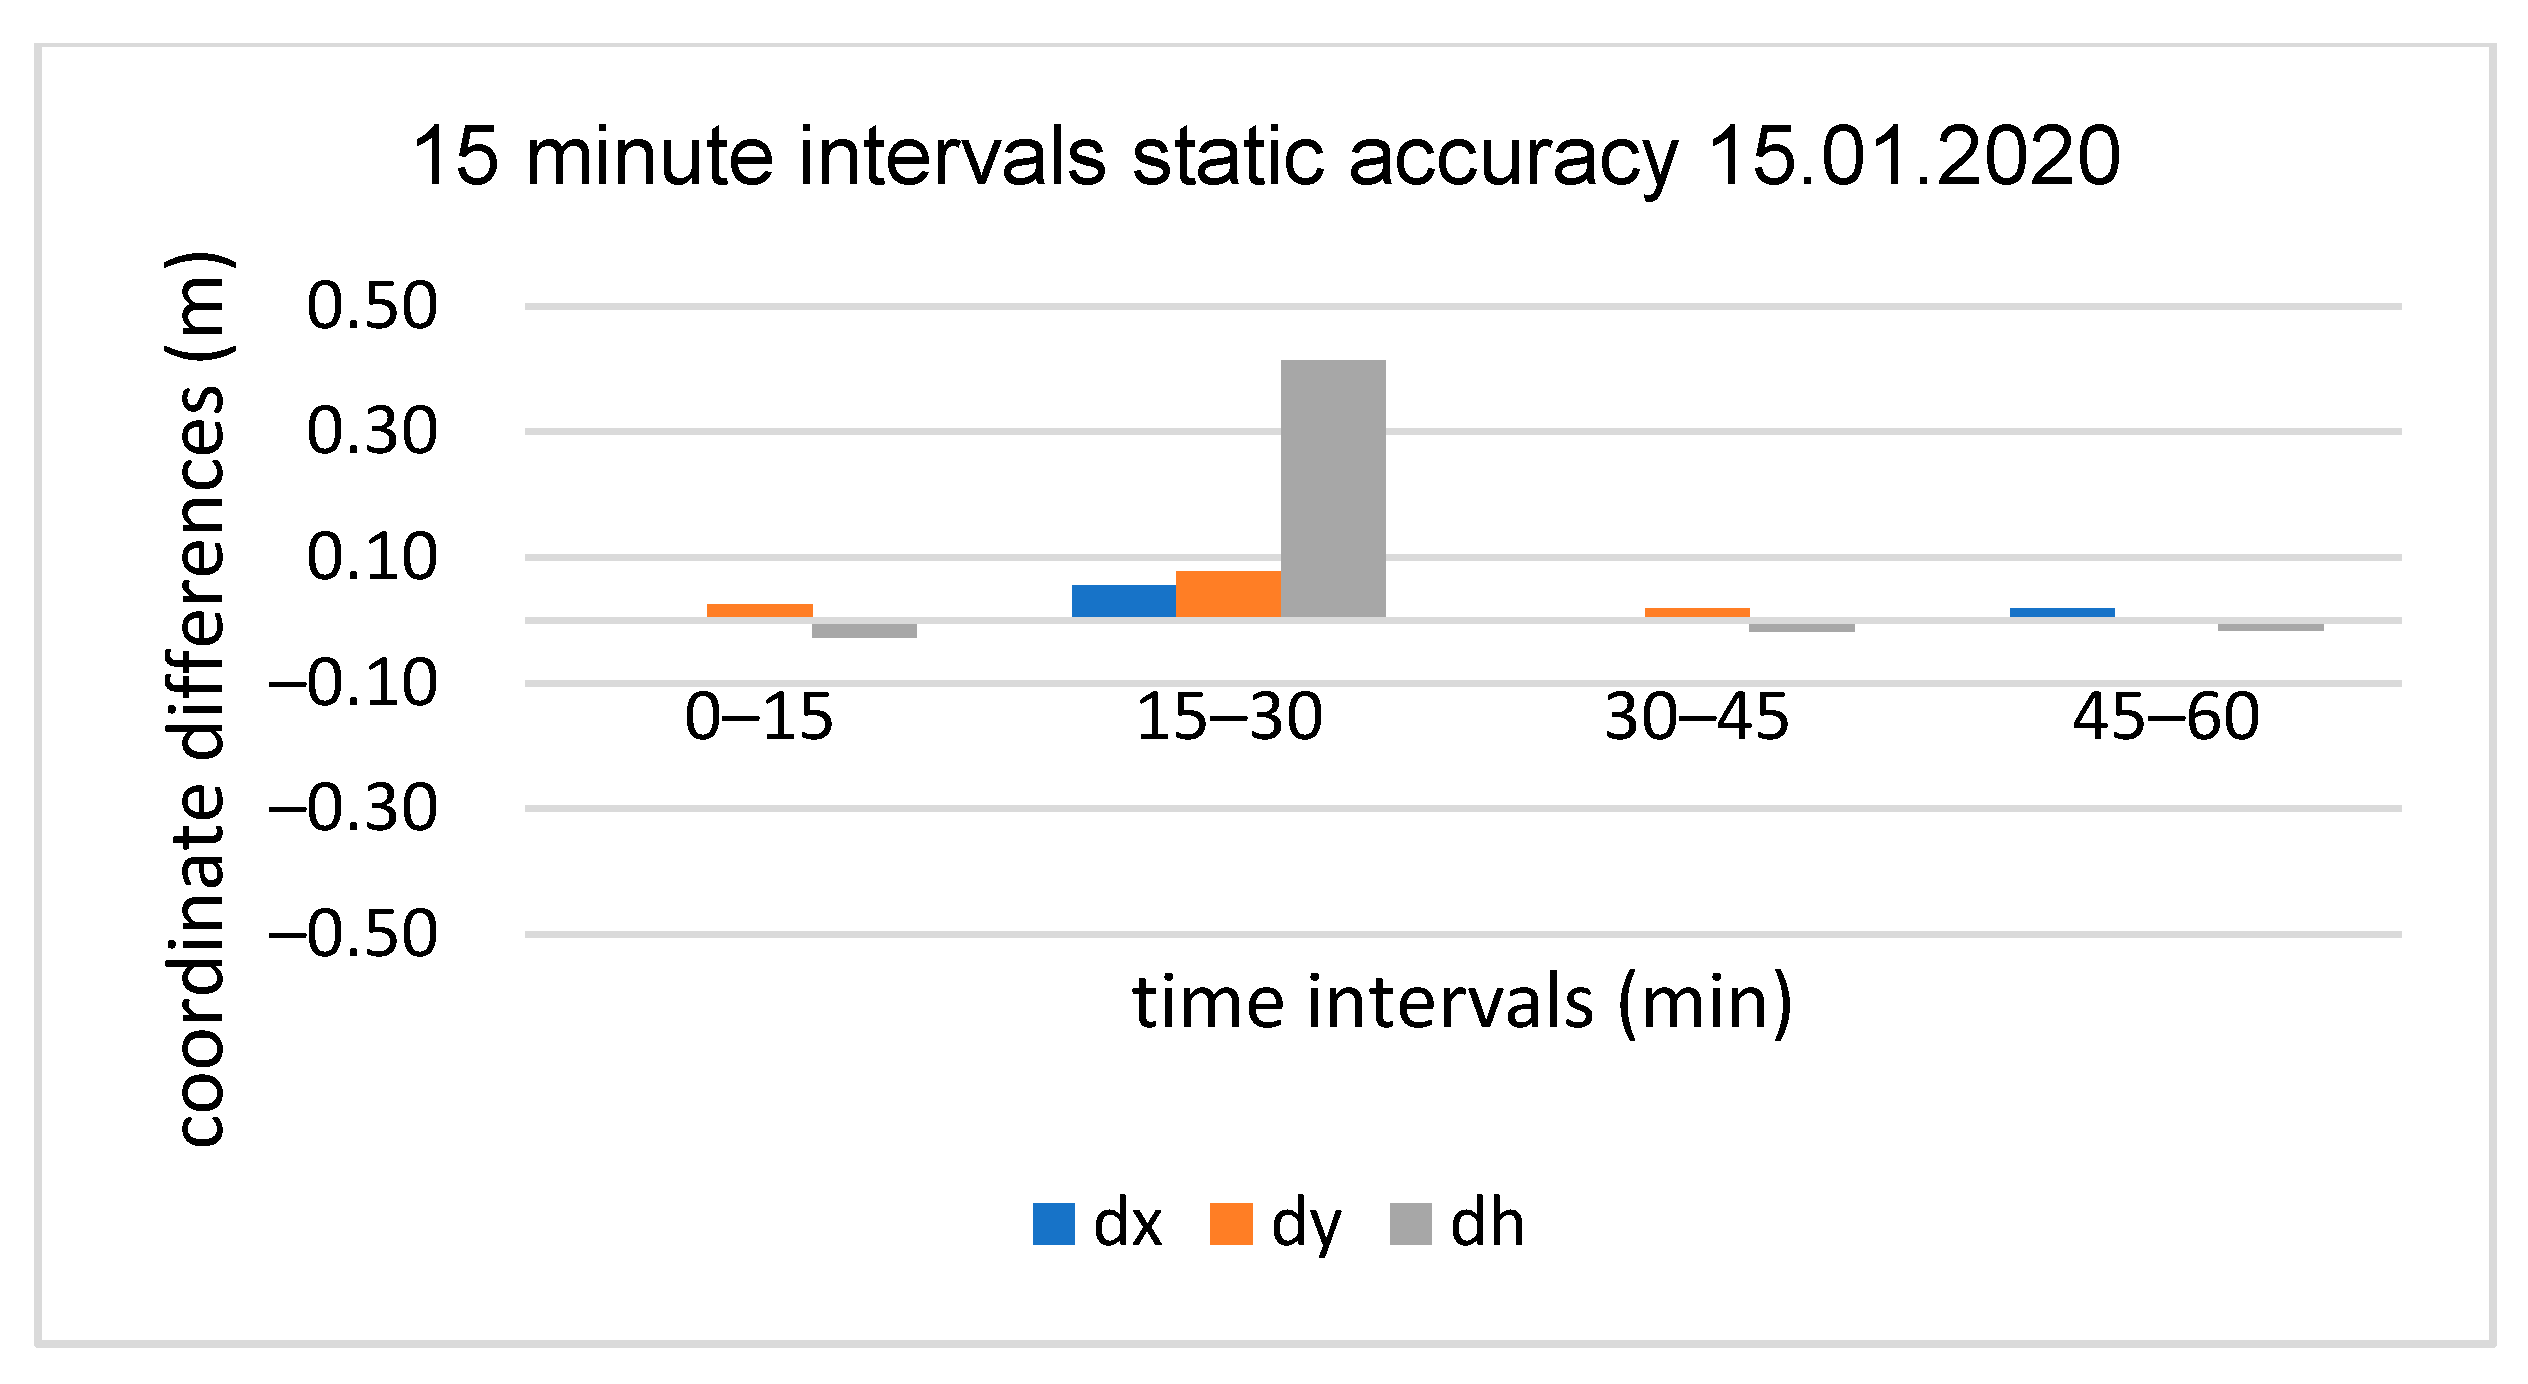
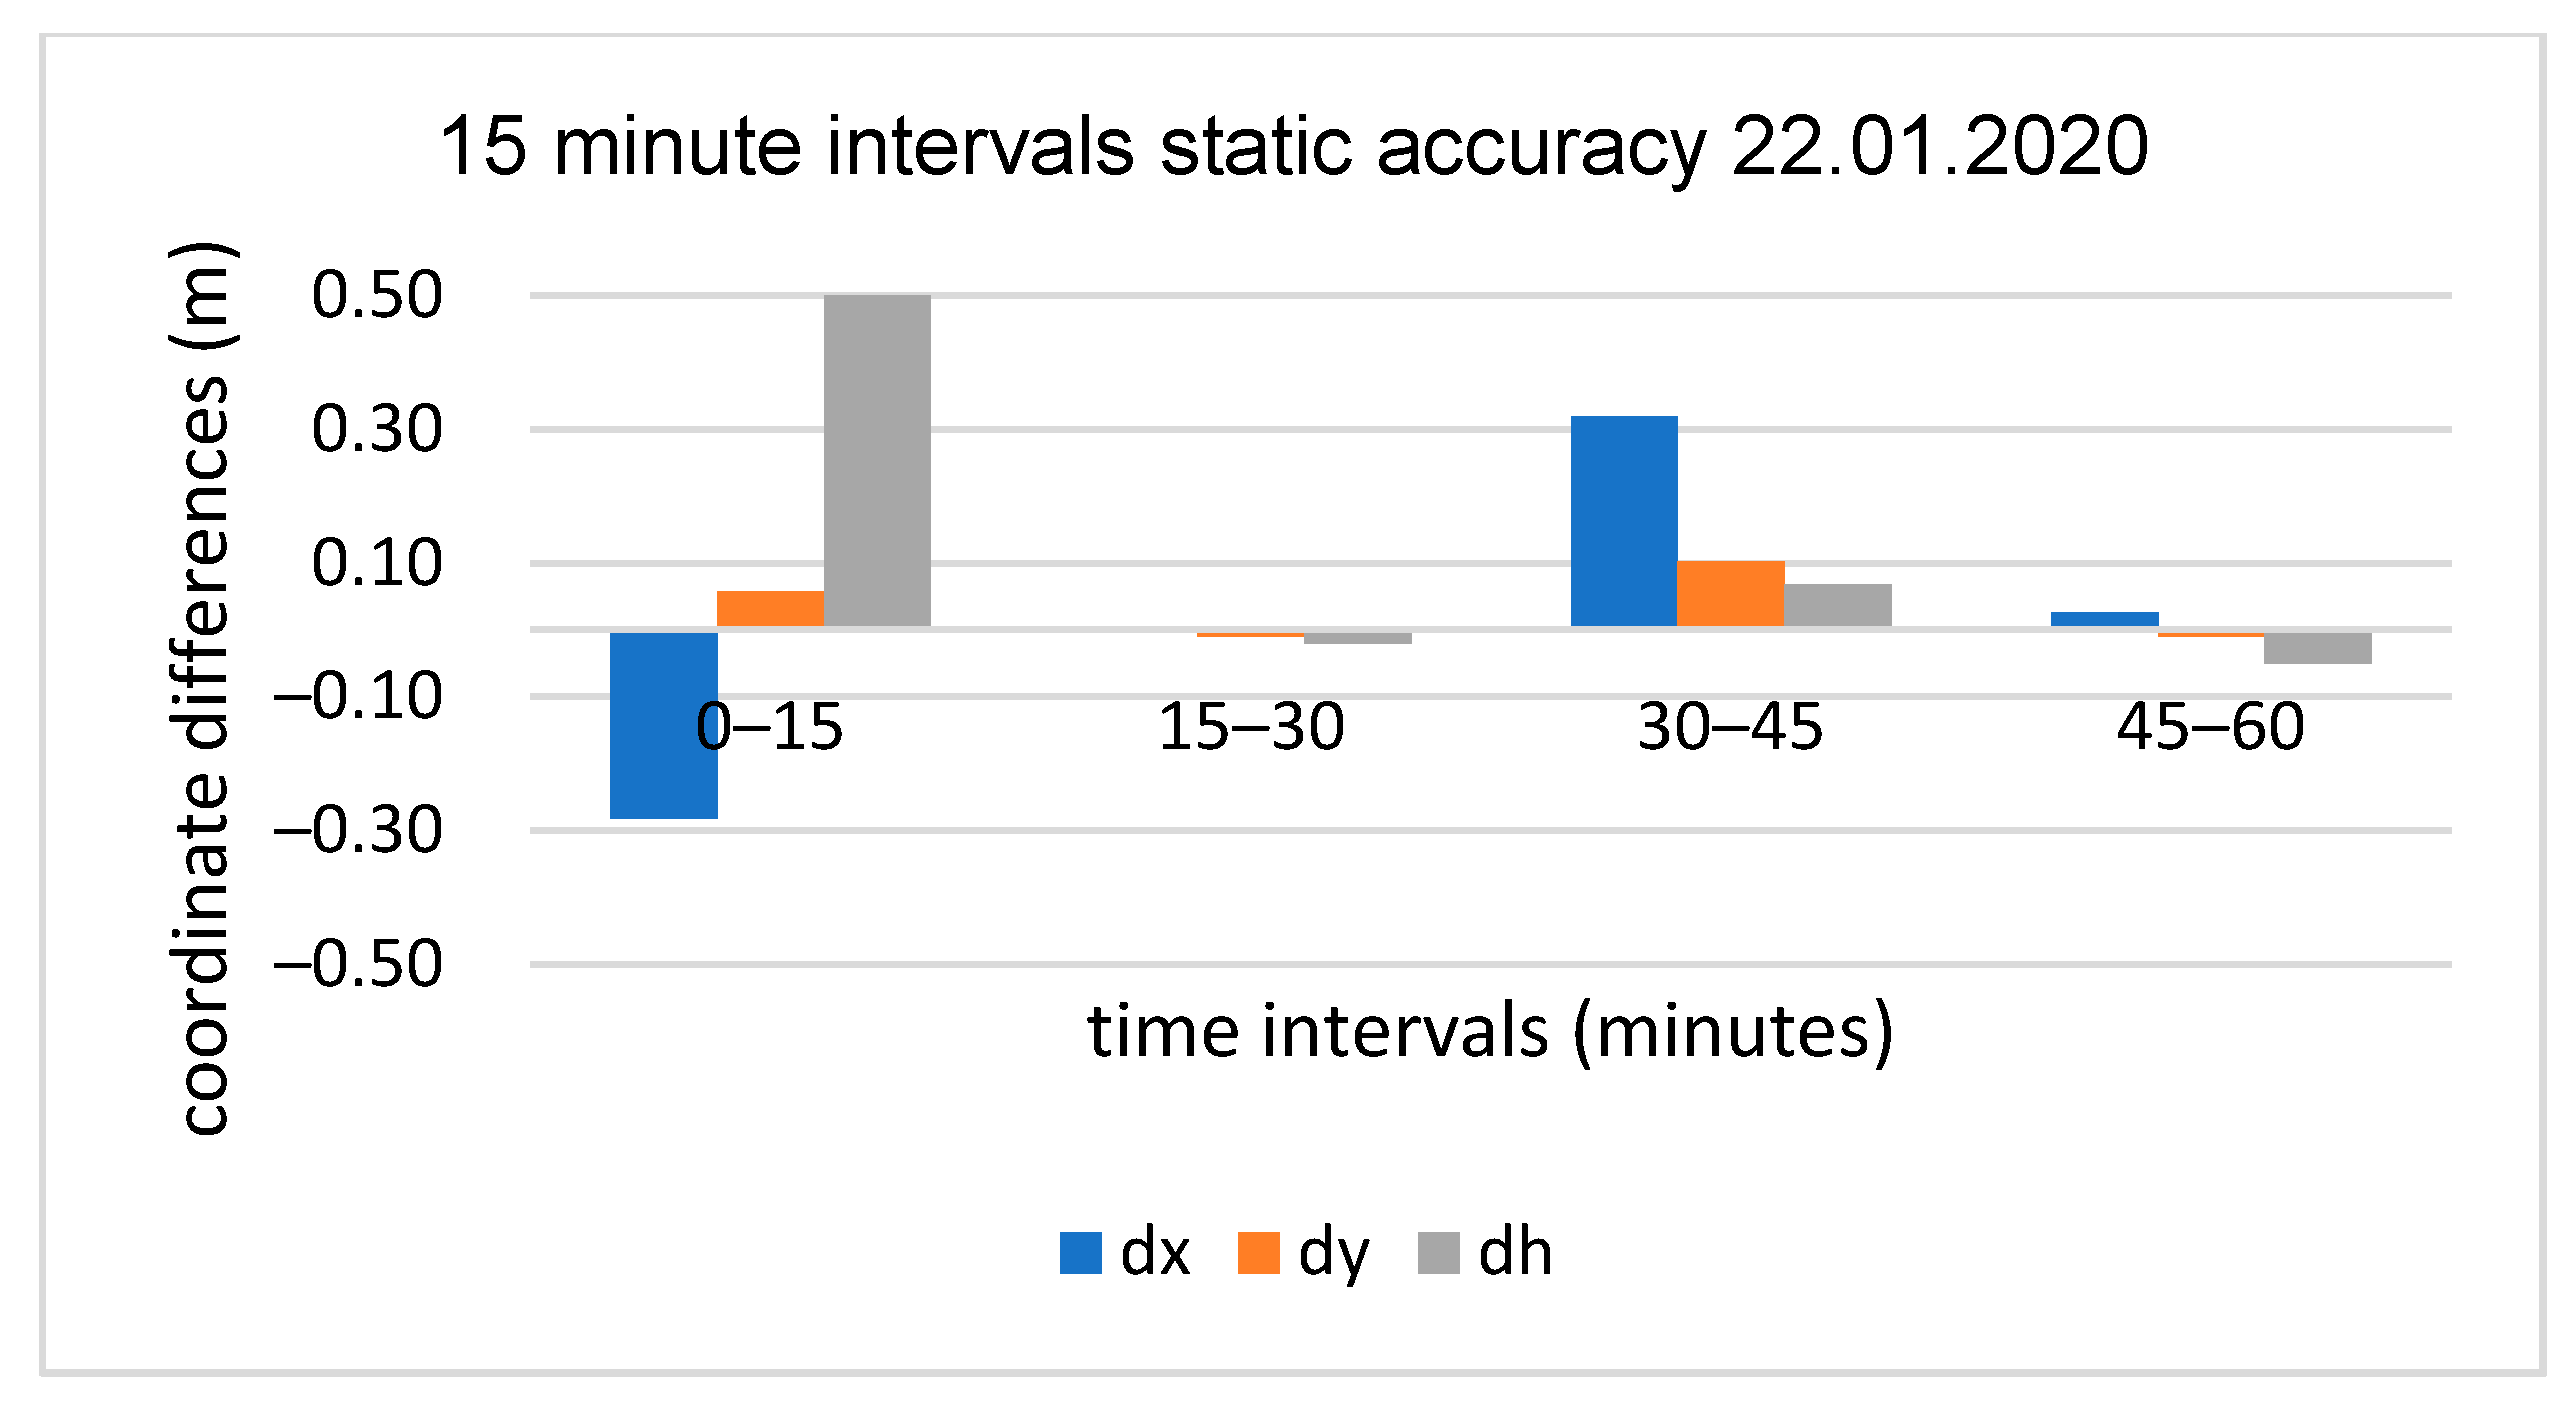
Figure 7.
15 min sub-session positioning results for initial test, baseline OPNT–P30Pro (4 km).
Figure 7.
15 min sub-session positioning results for initial test, baseline OPNT–P30Pro (4 km).
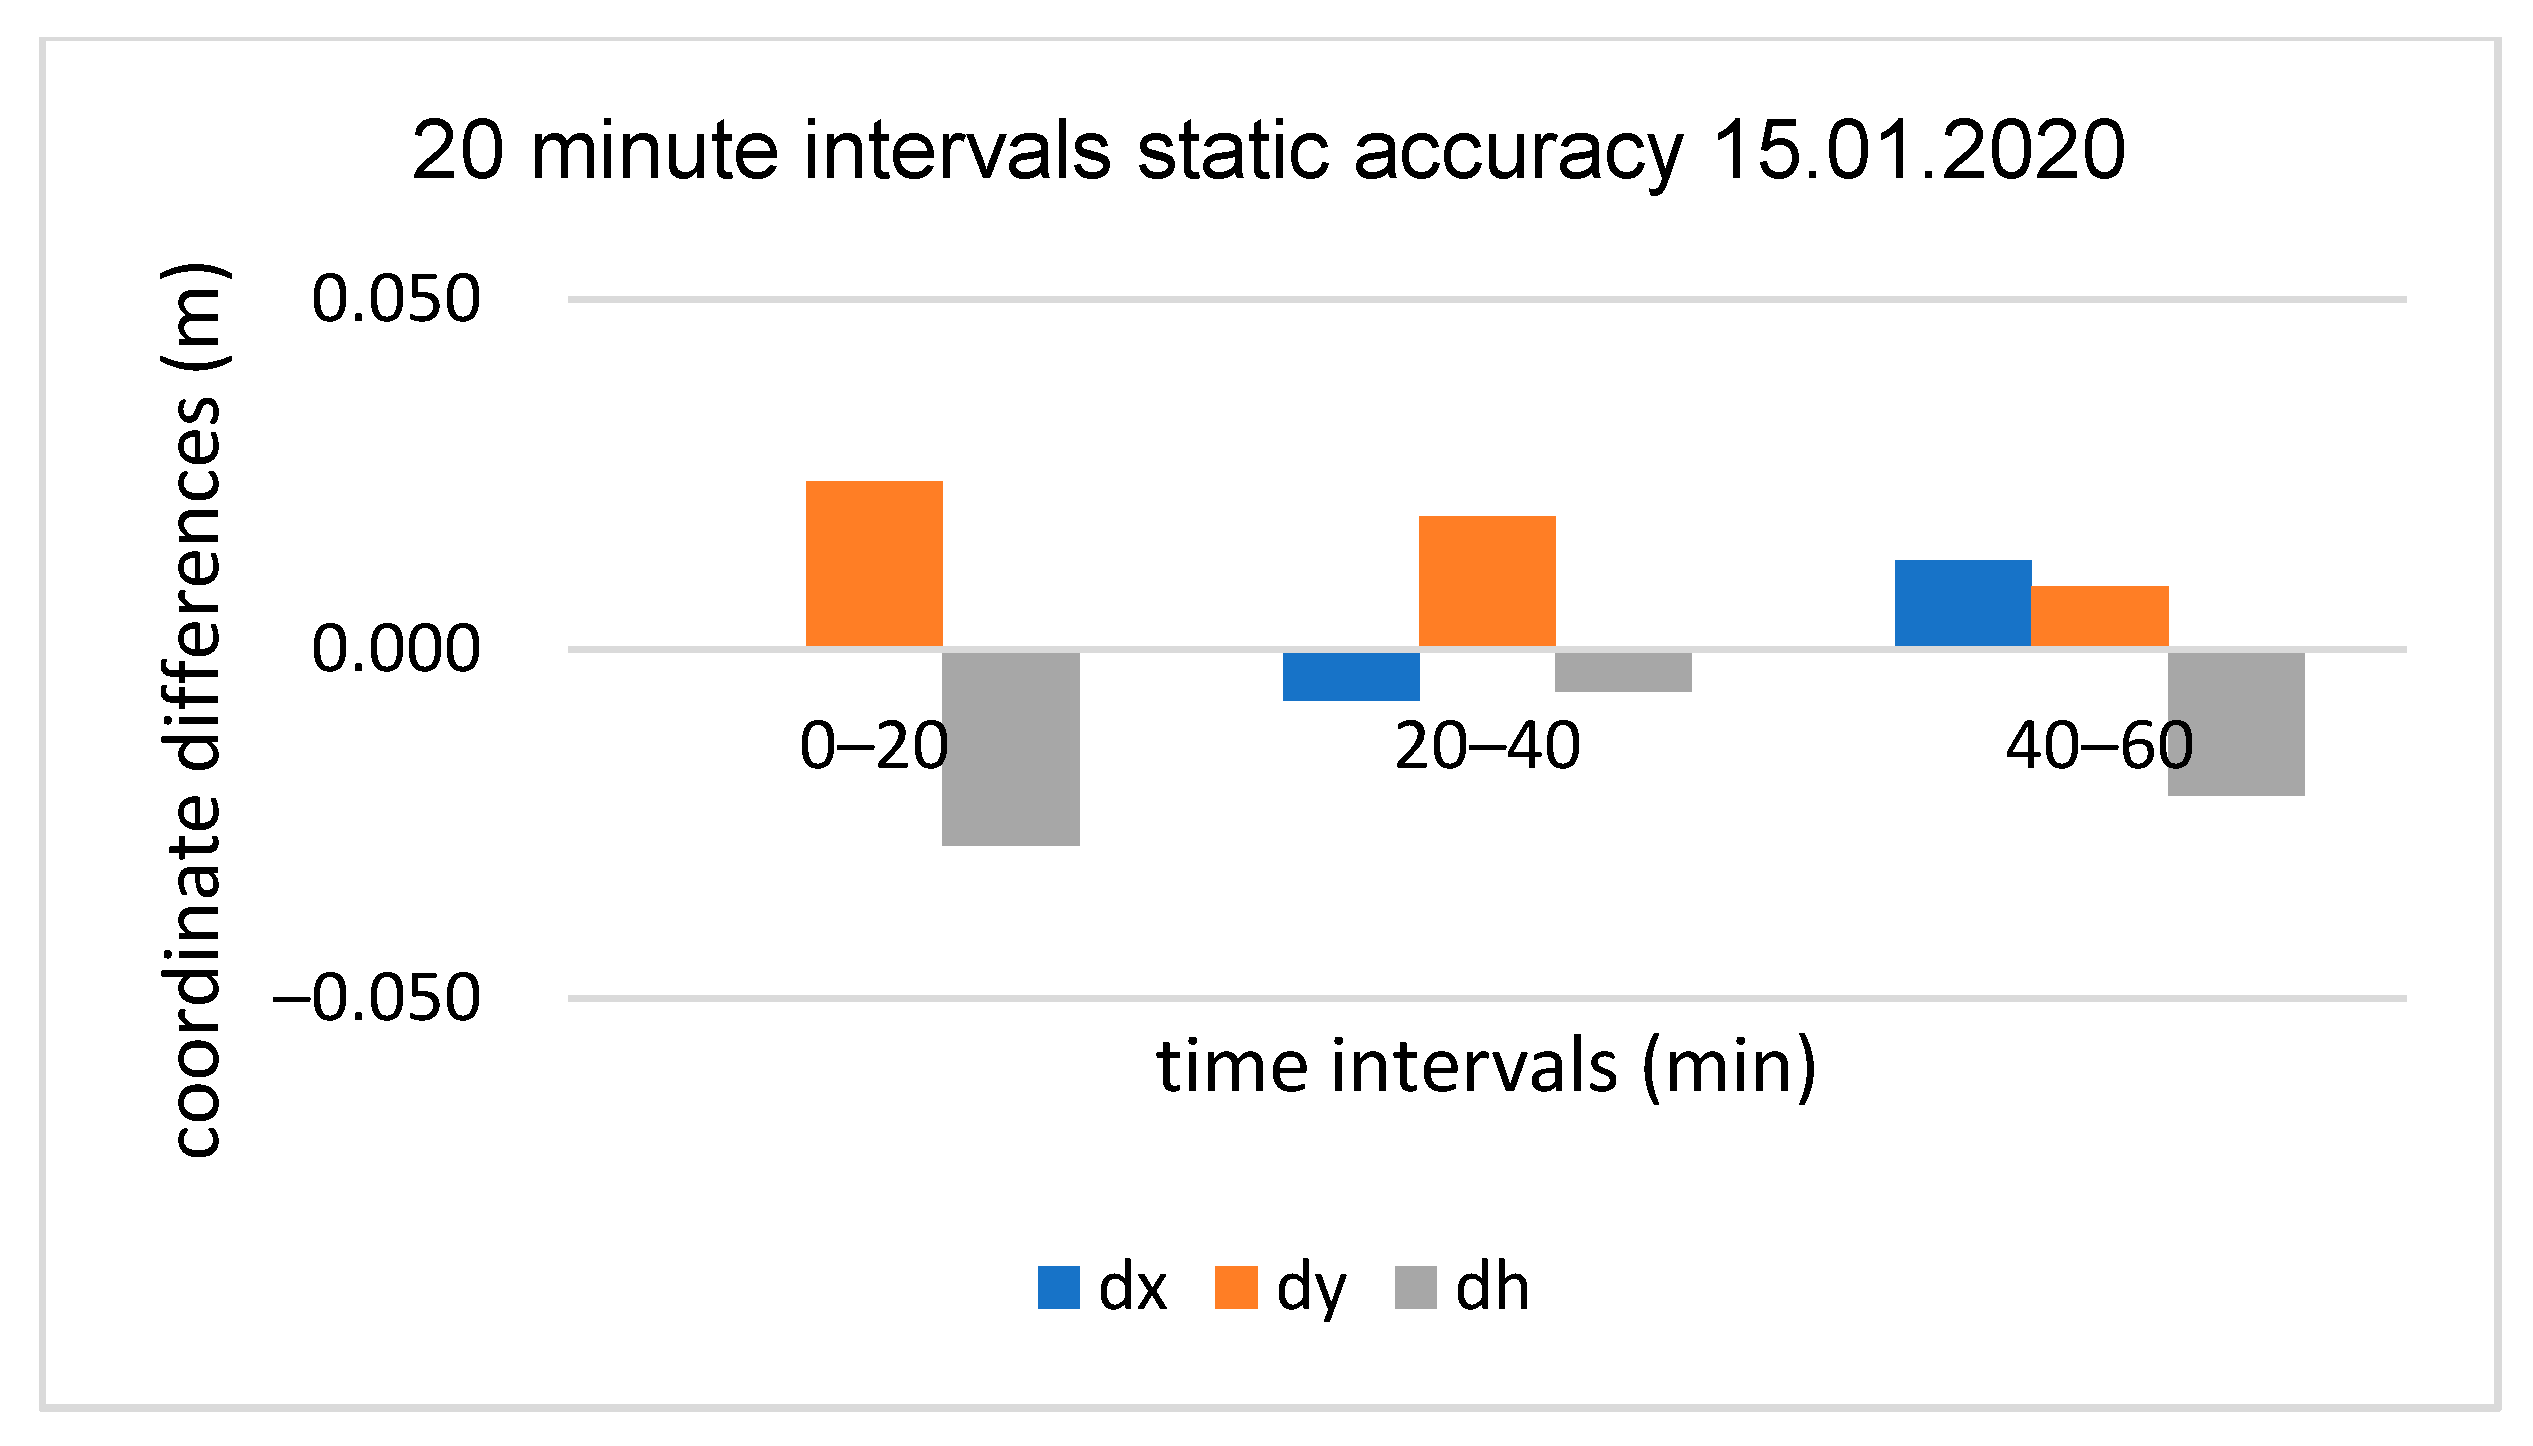
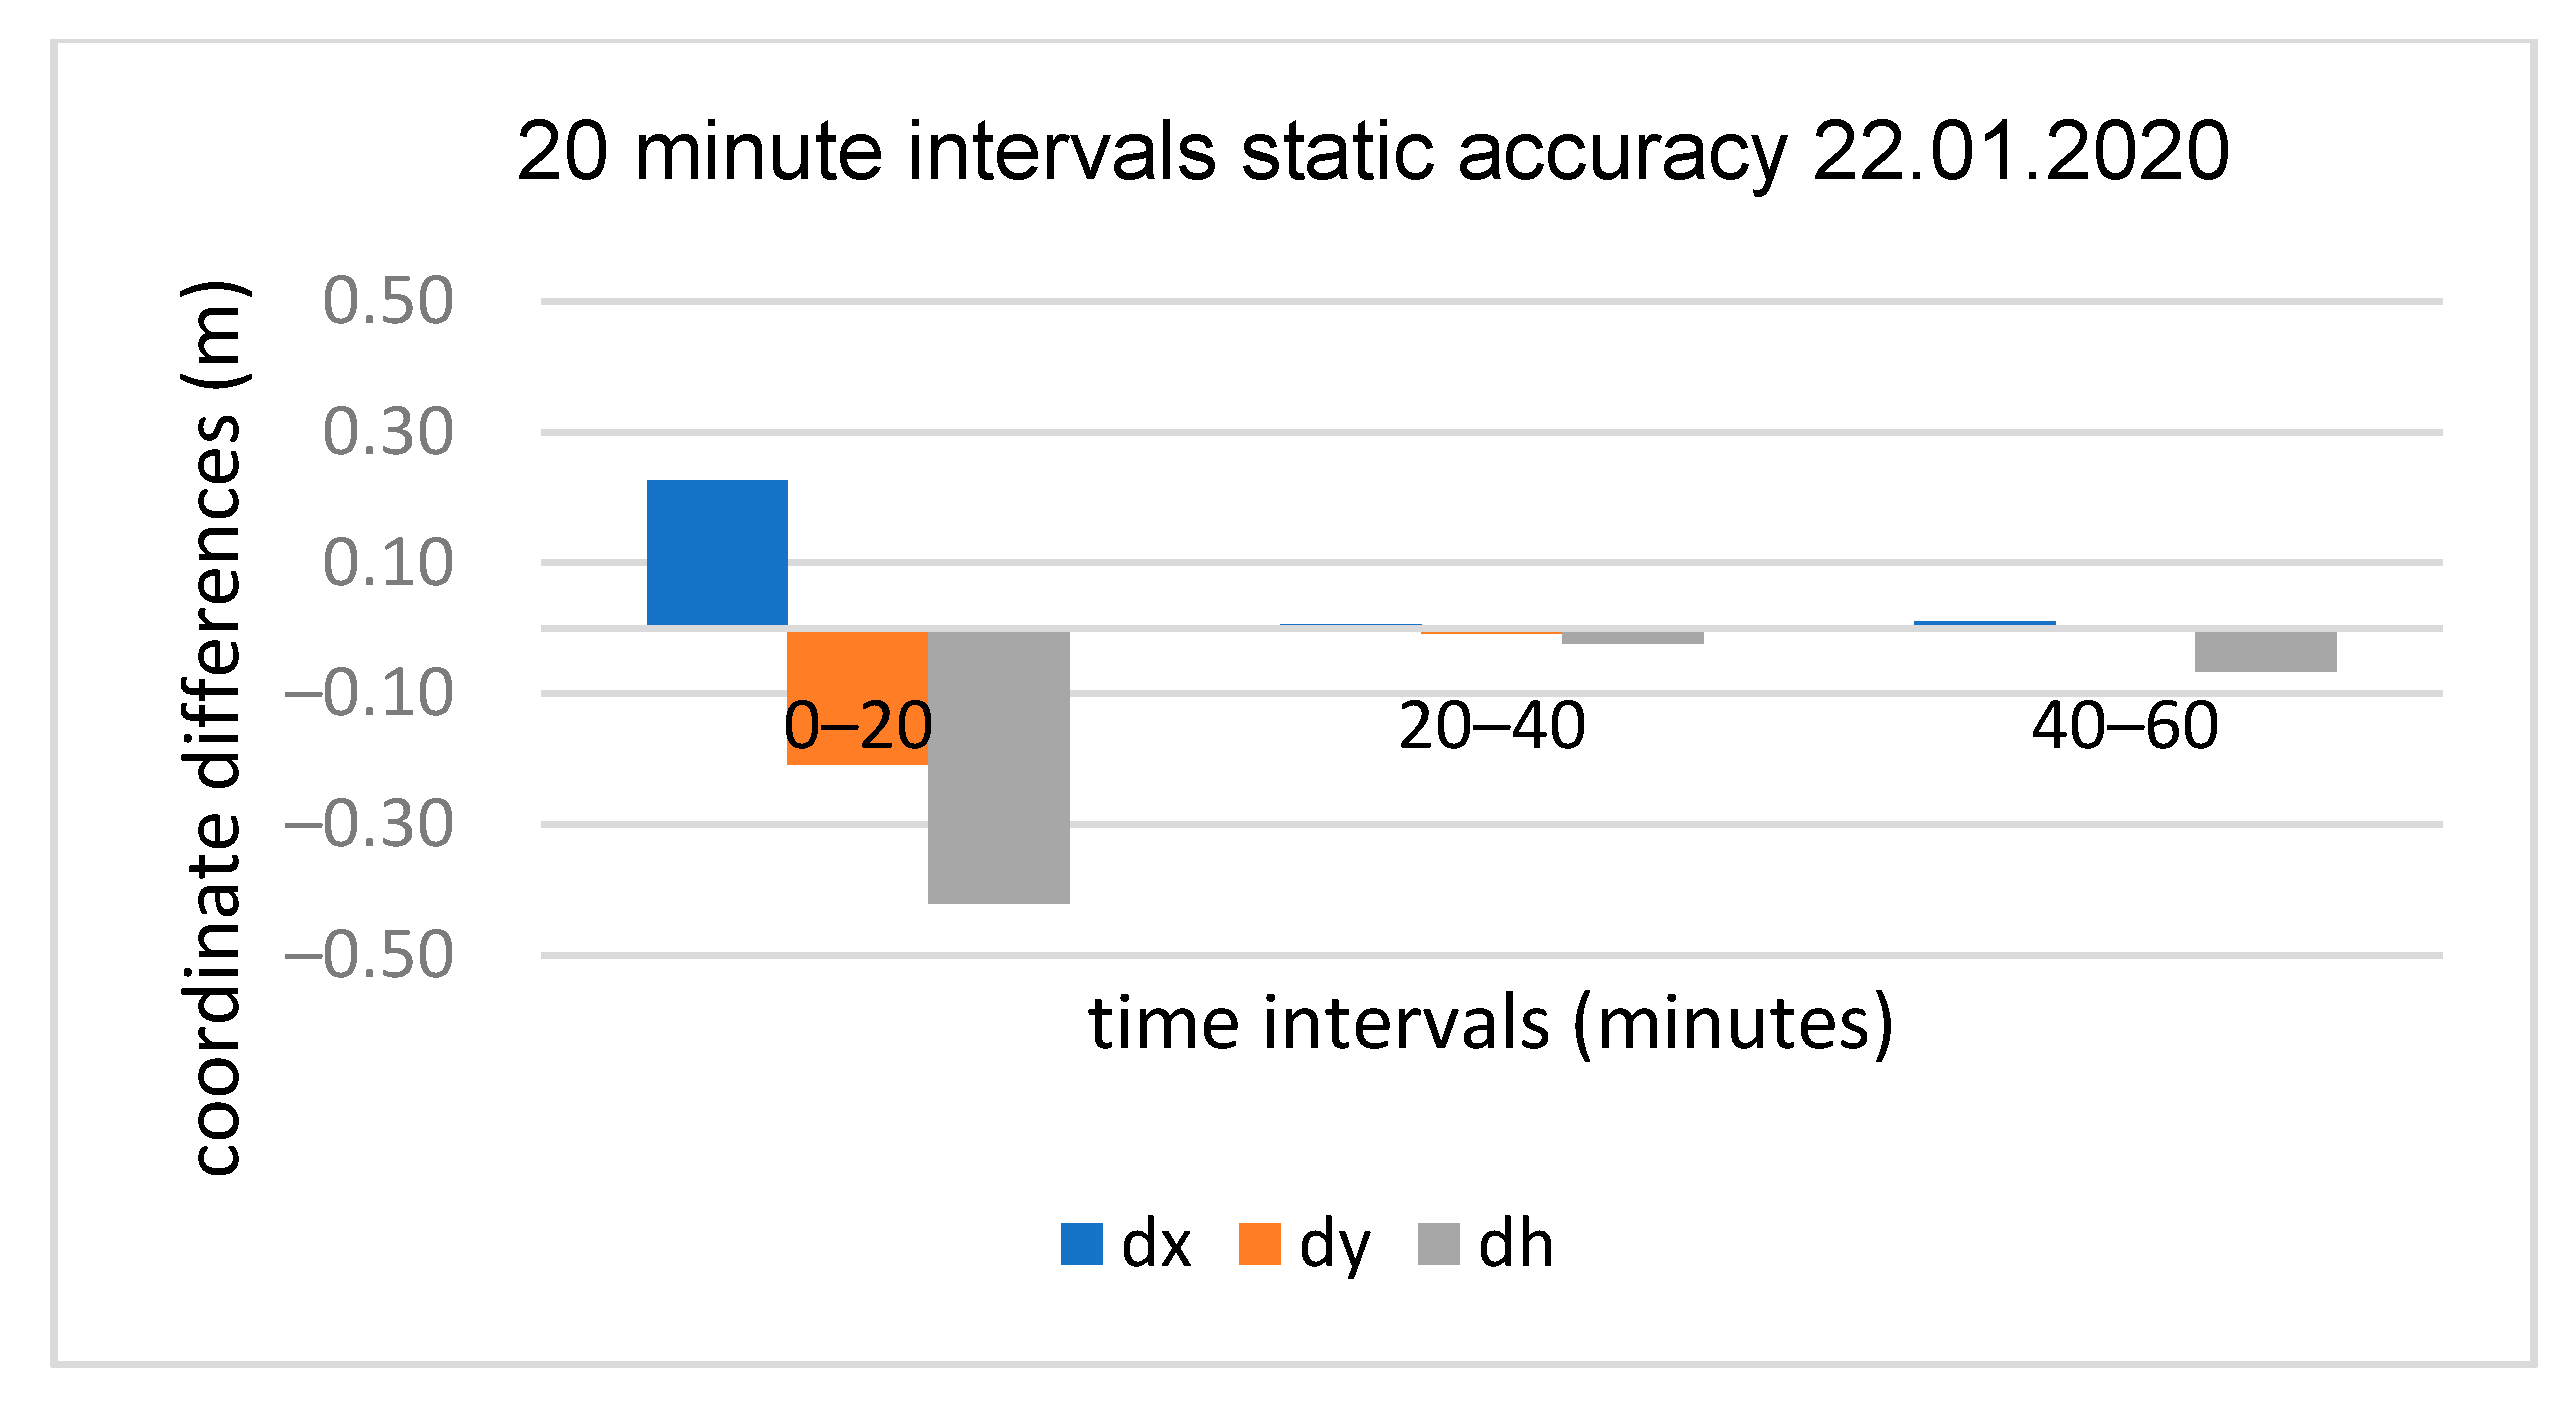
Figure 8.
20 min sub-session positioning results for initial test, baseline OPNT–P30Pro (4 km).
Figure 8.
20 min sub-session positioning results for initial test, baseline OPNT–P30Pro (4 km).
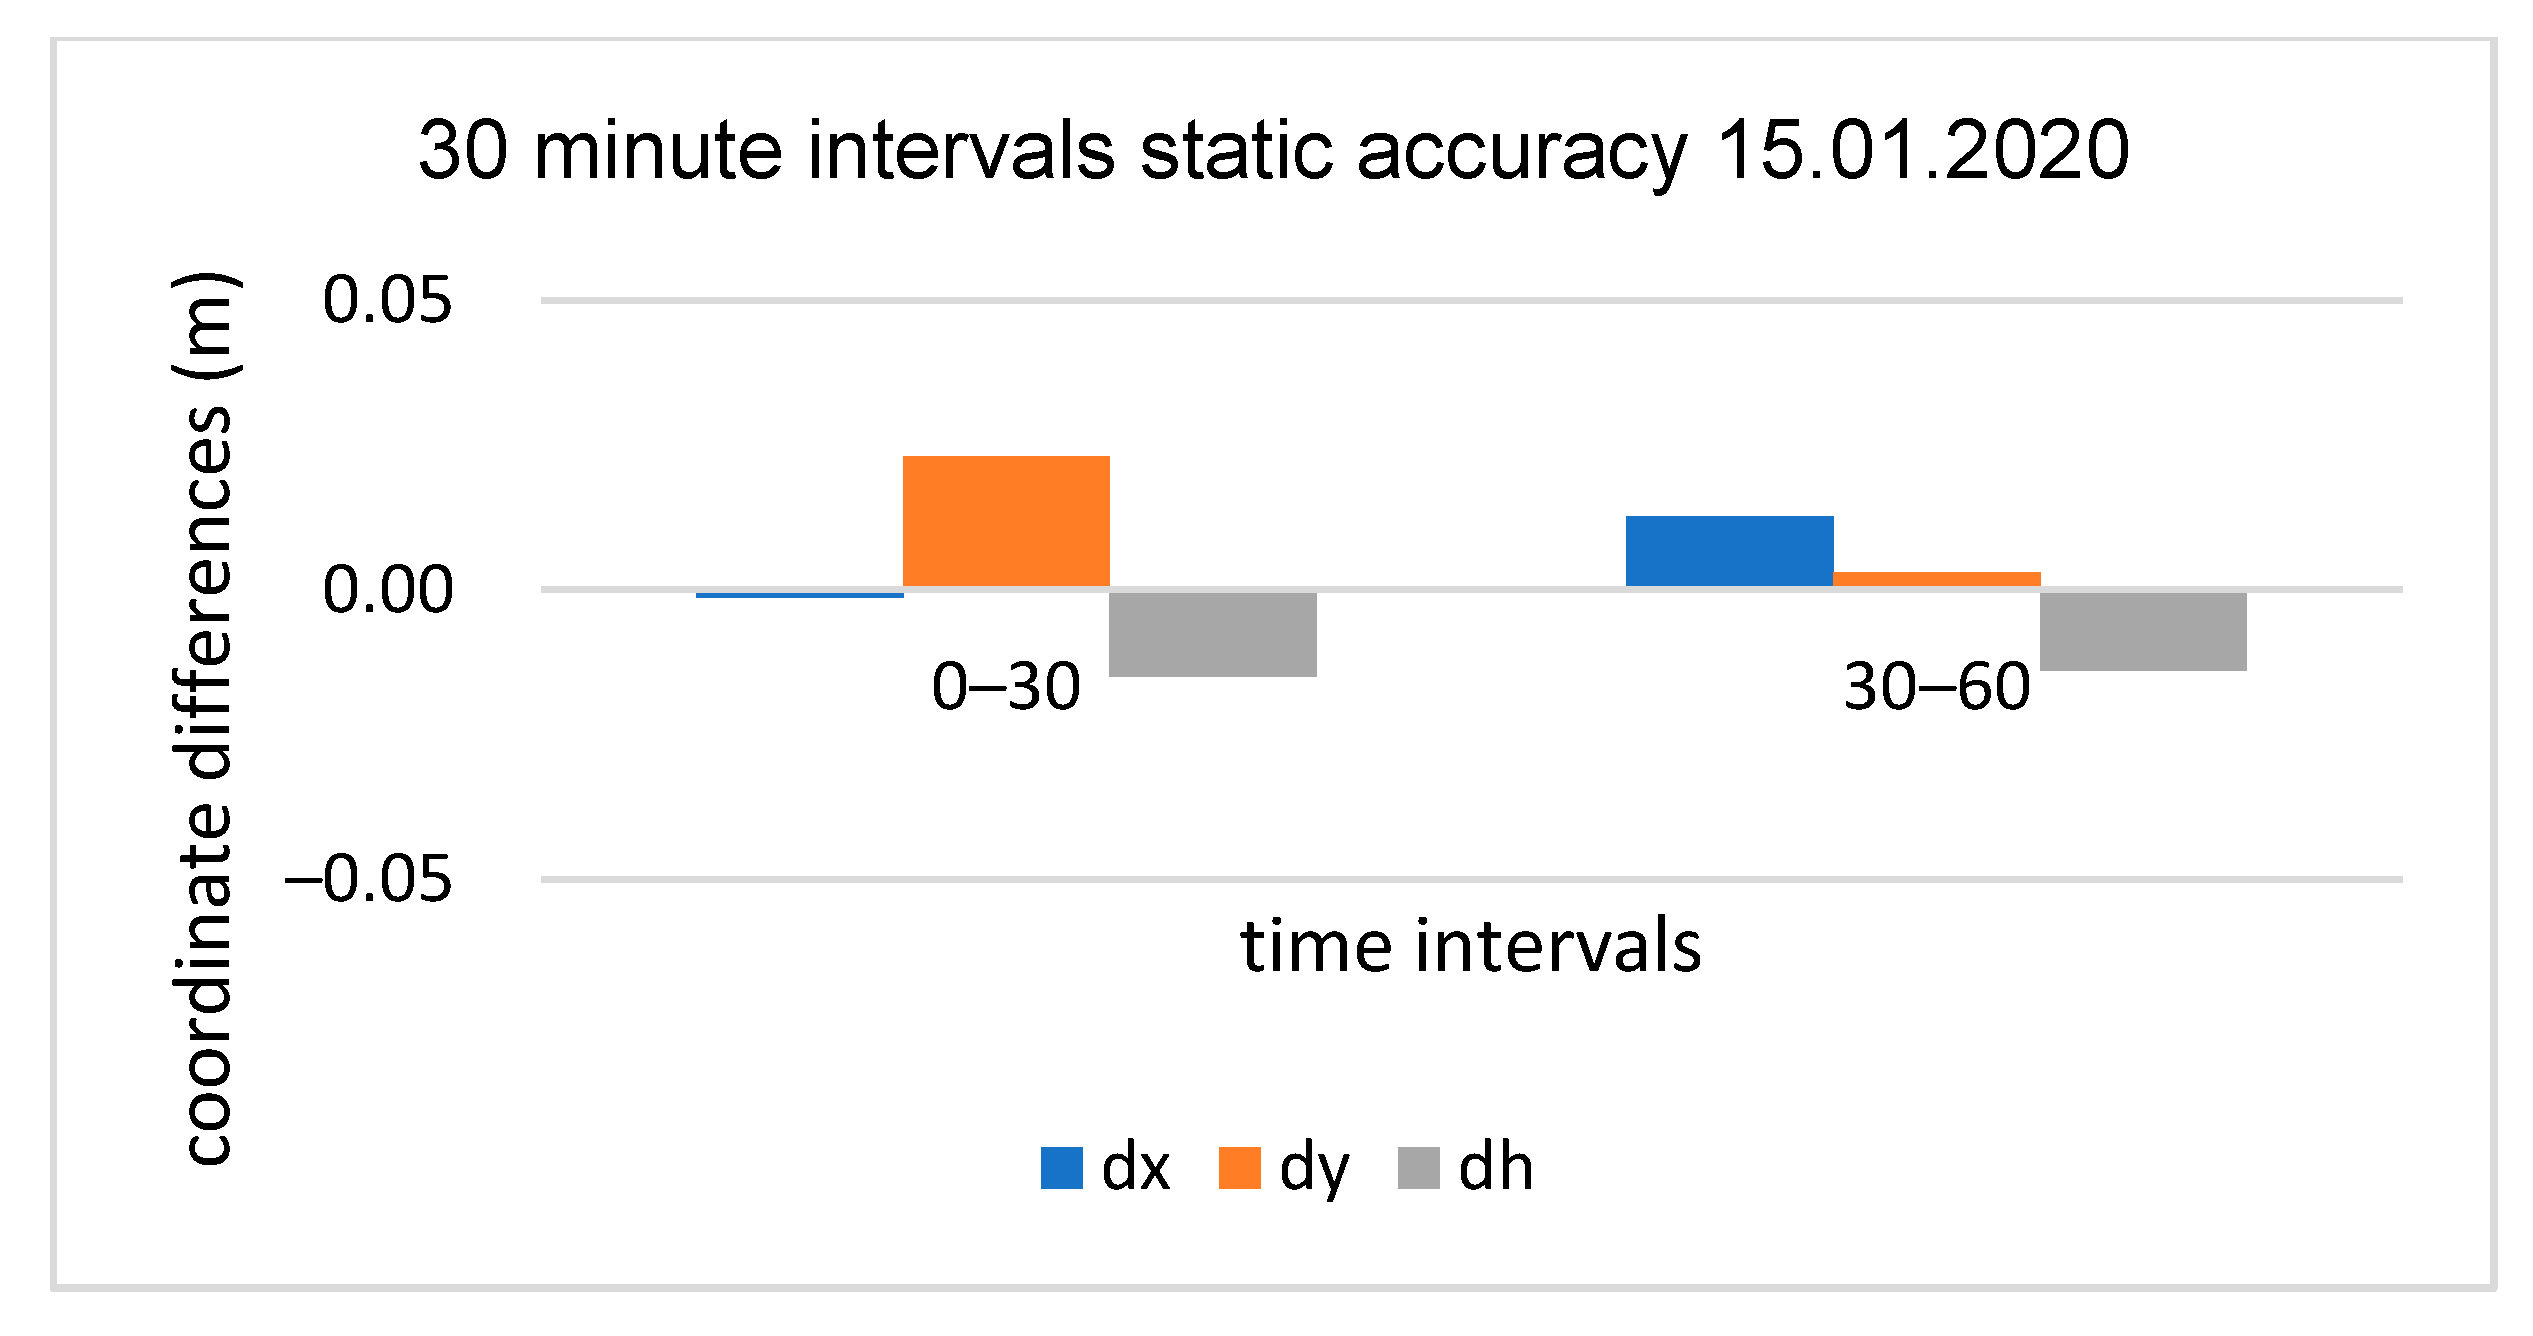
Figure 9.
30 min sub-session positioning results for initial test, baseline OPNT–P30Pro (4 km).
Figure 9.
30 min sub-session positioning results for initial test, baseline OPNT–P30Pro (4 km).
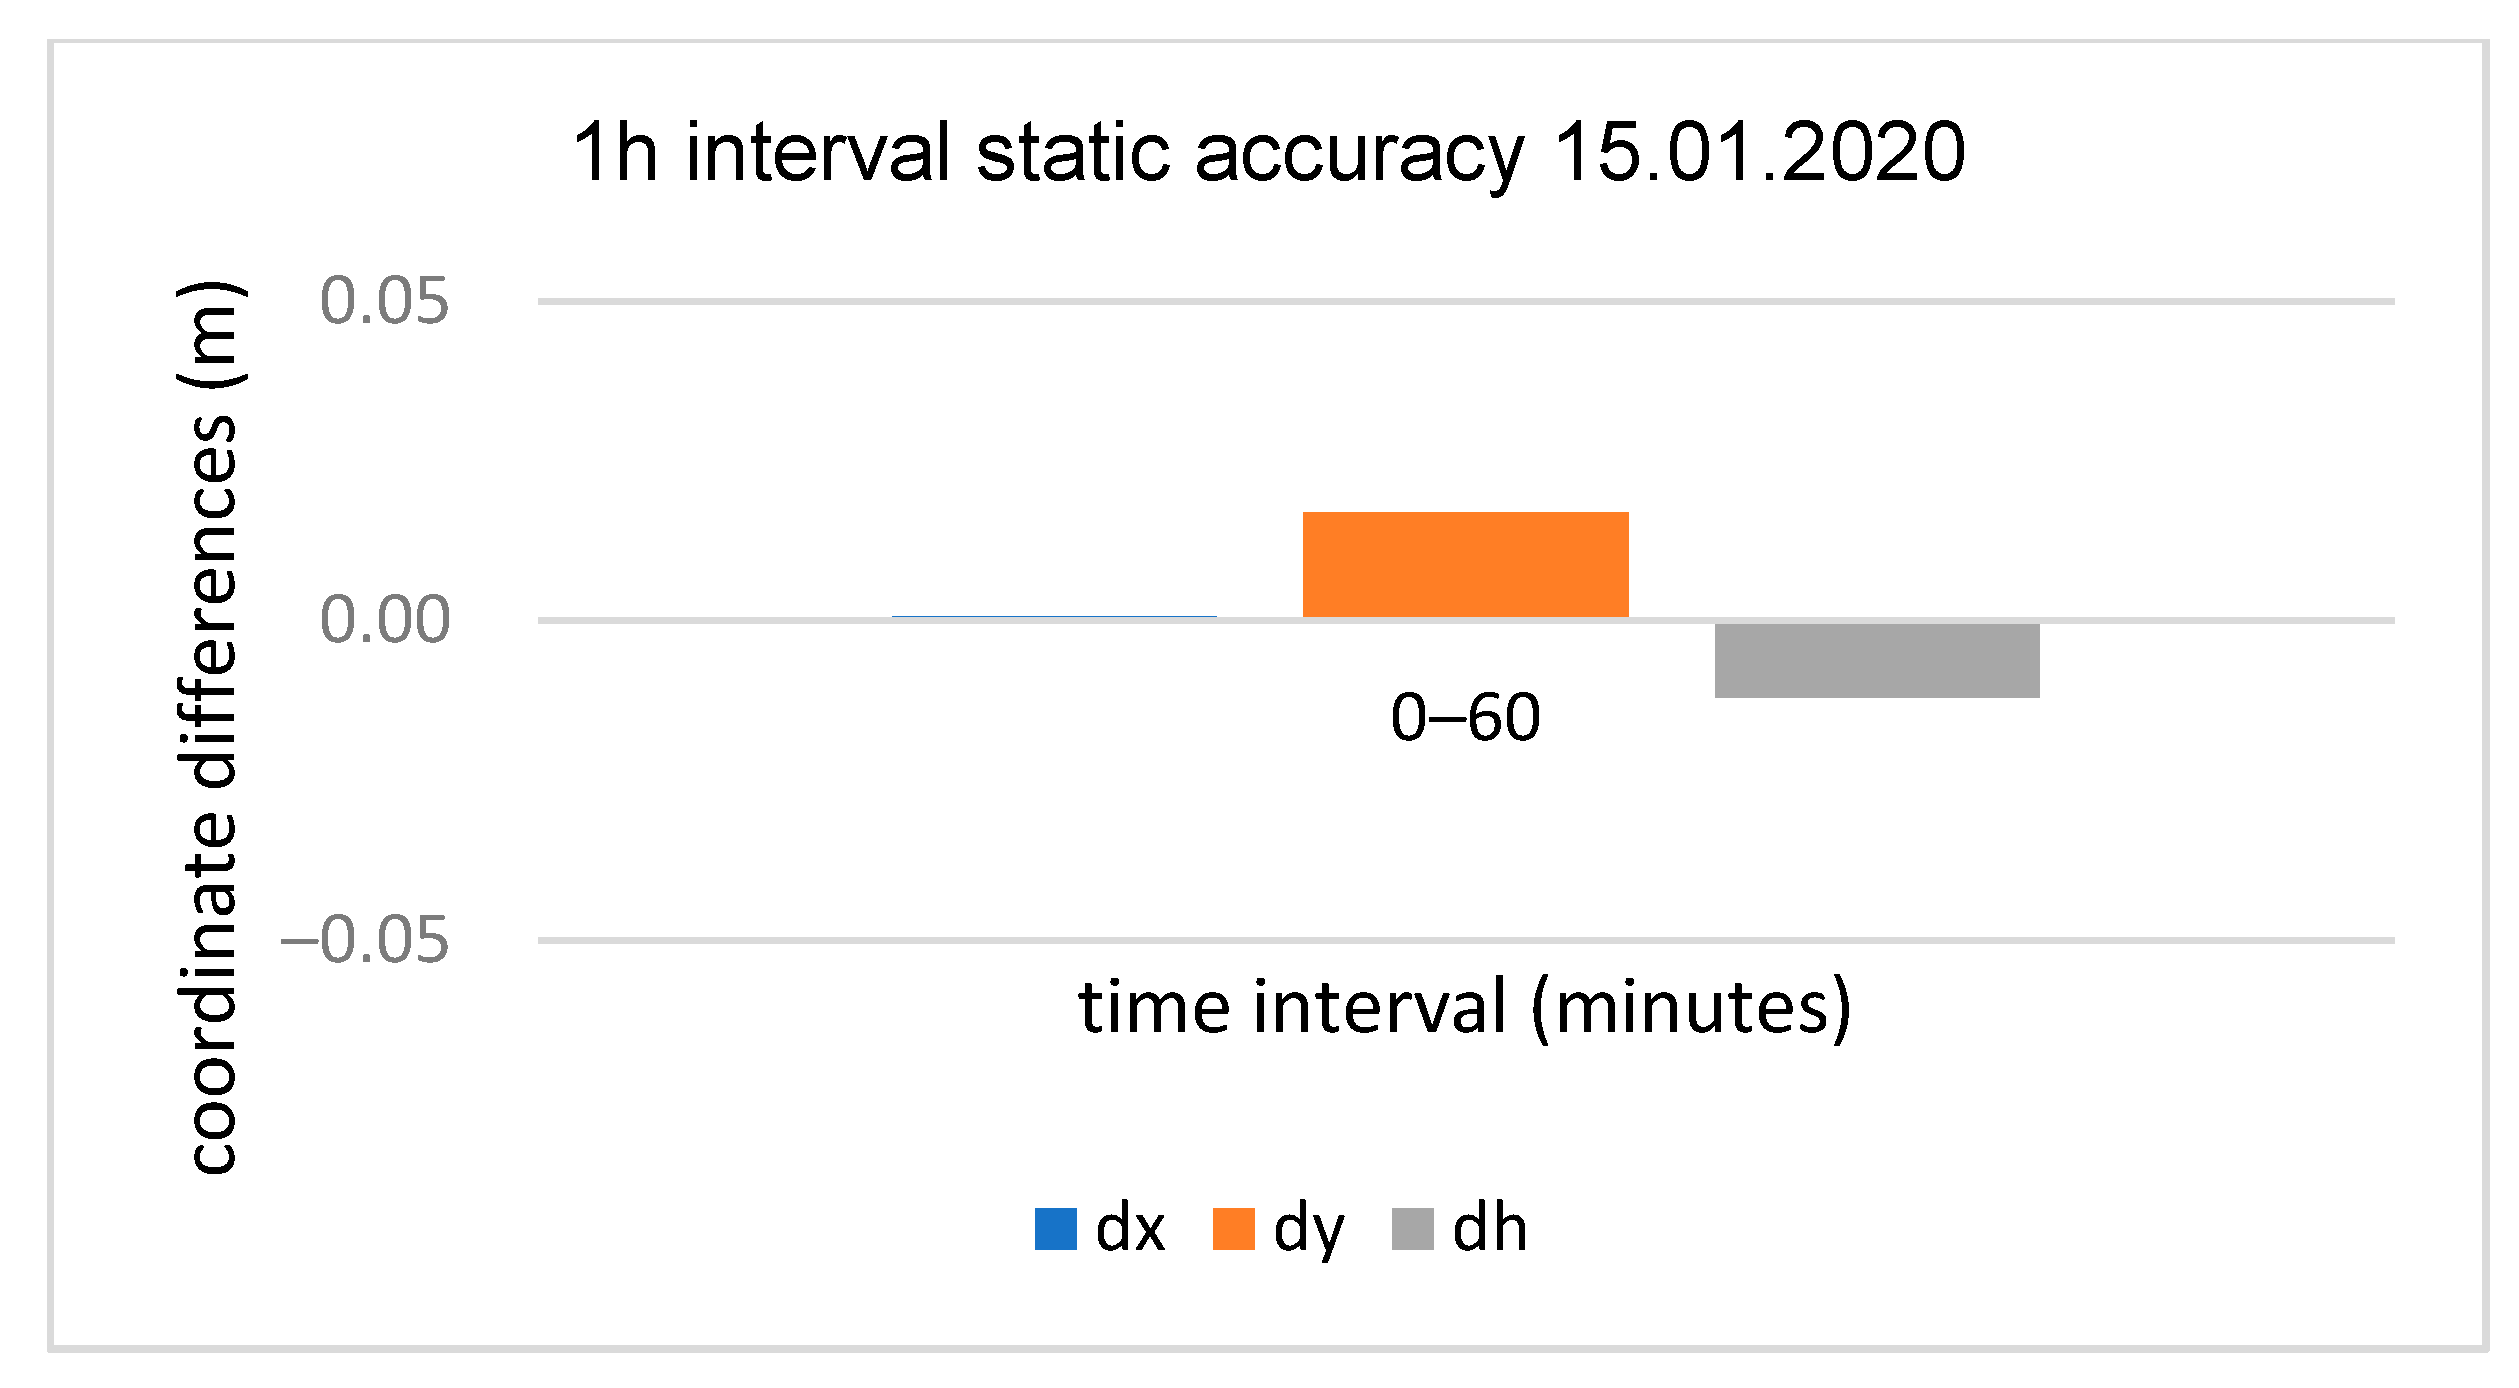
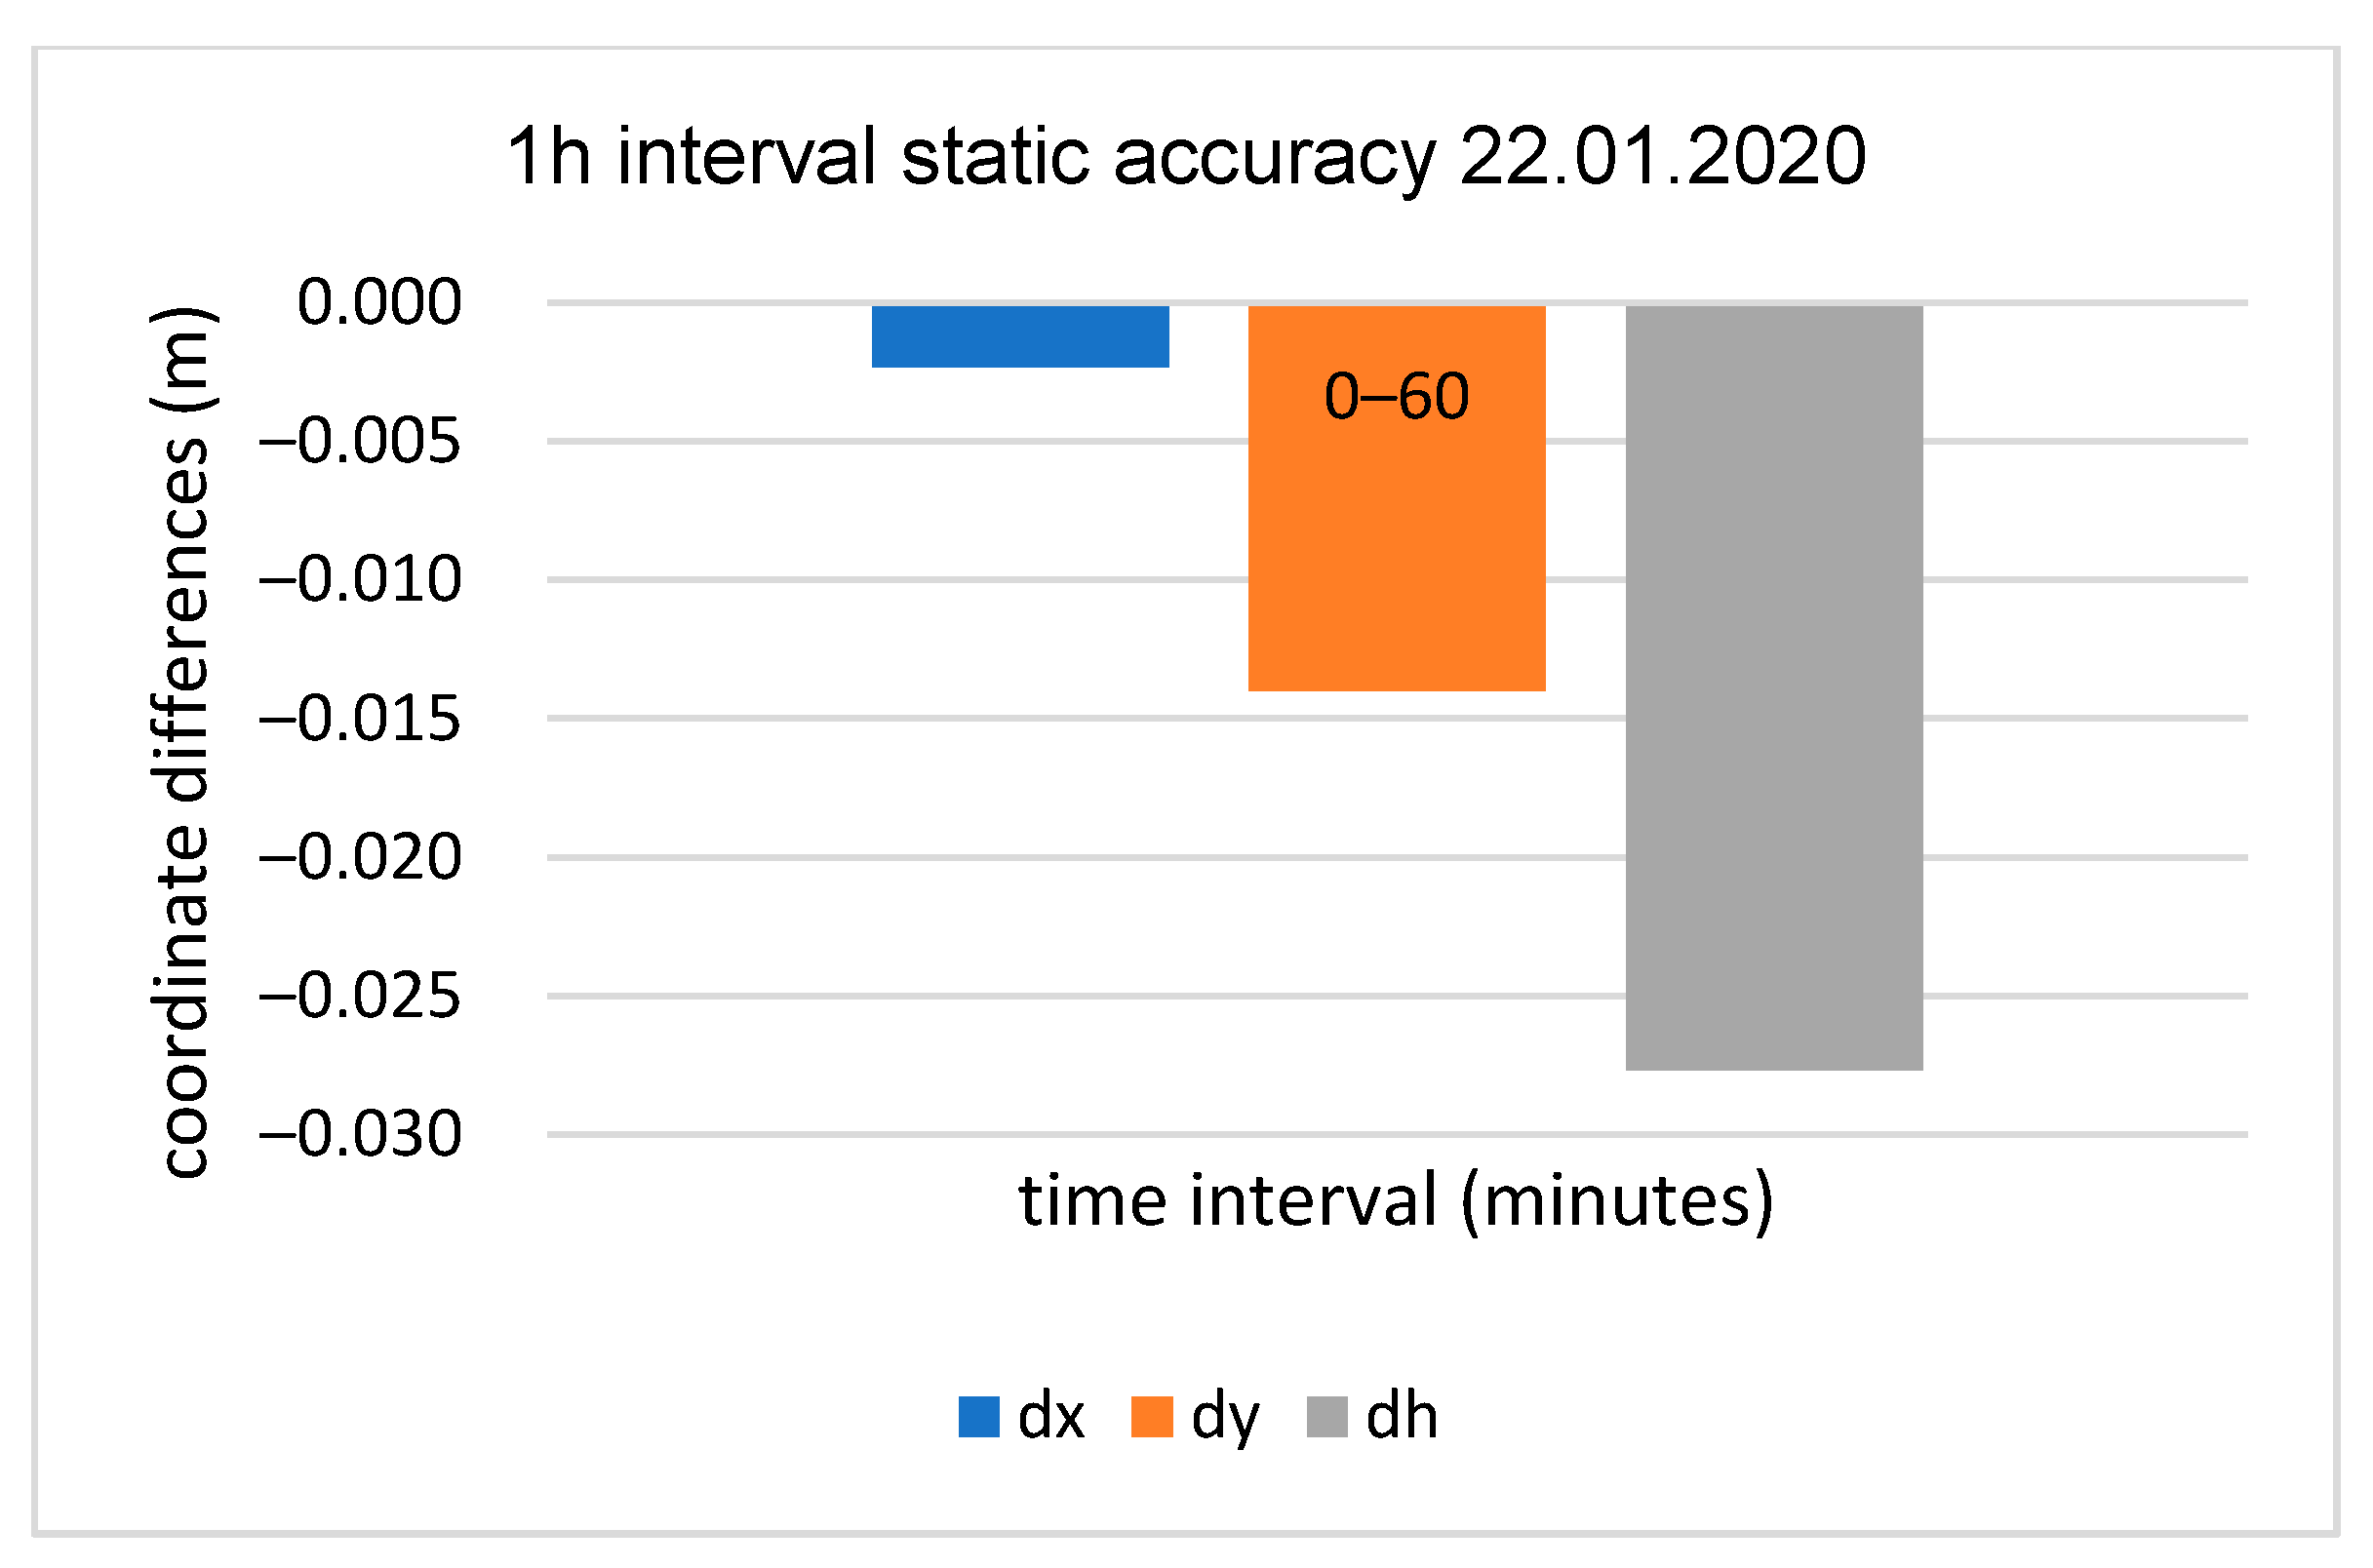
Figure 10.
60 min session positioning results for initial test, baseline OPNT–P30Pro (4 km).
Figure 10.
60 min session positioning results for initial test, baseline OPNT–P30Pro (4 km).
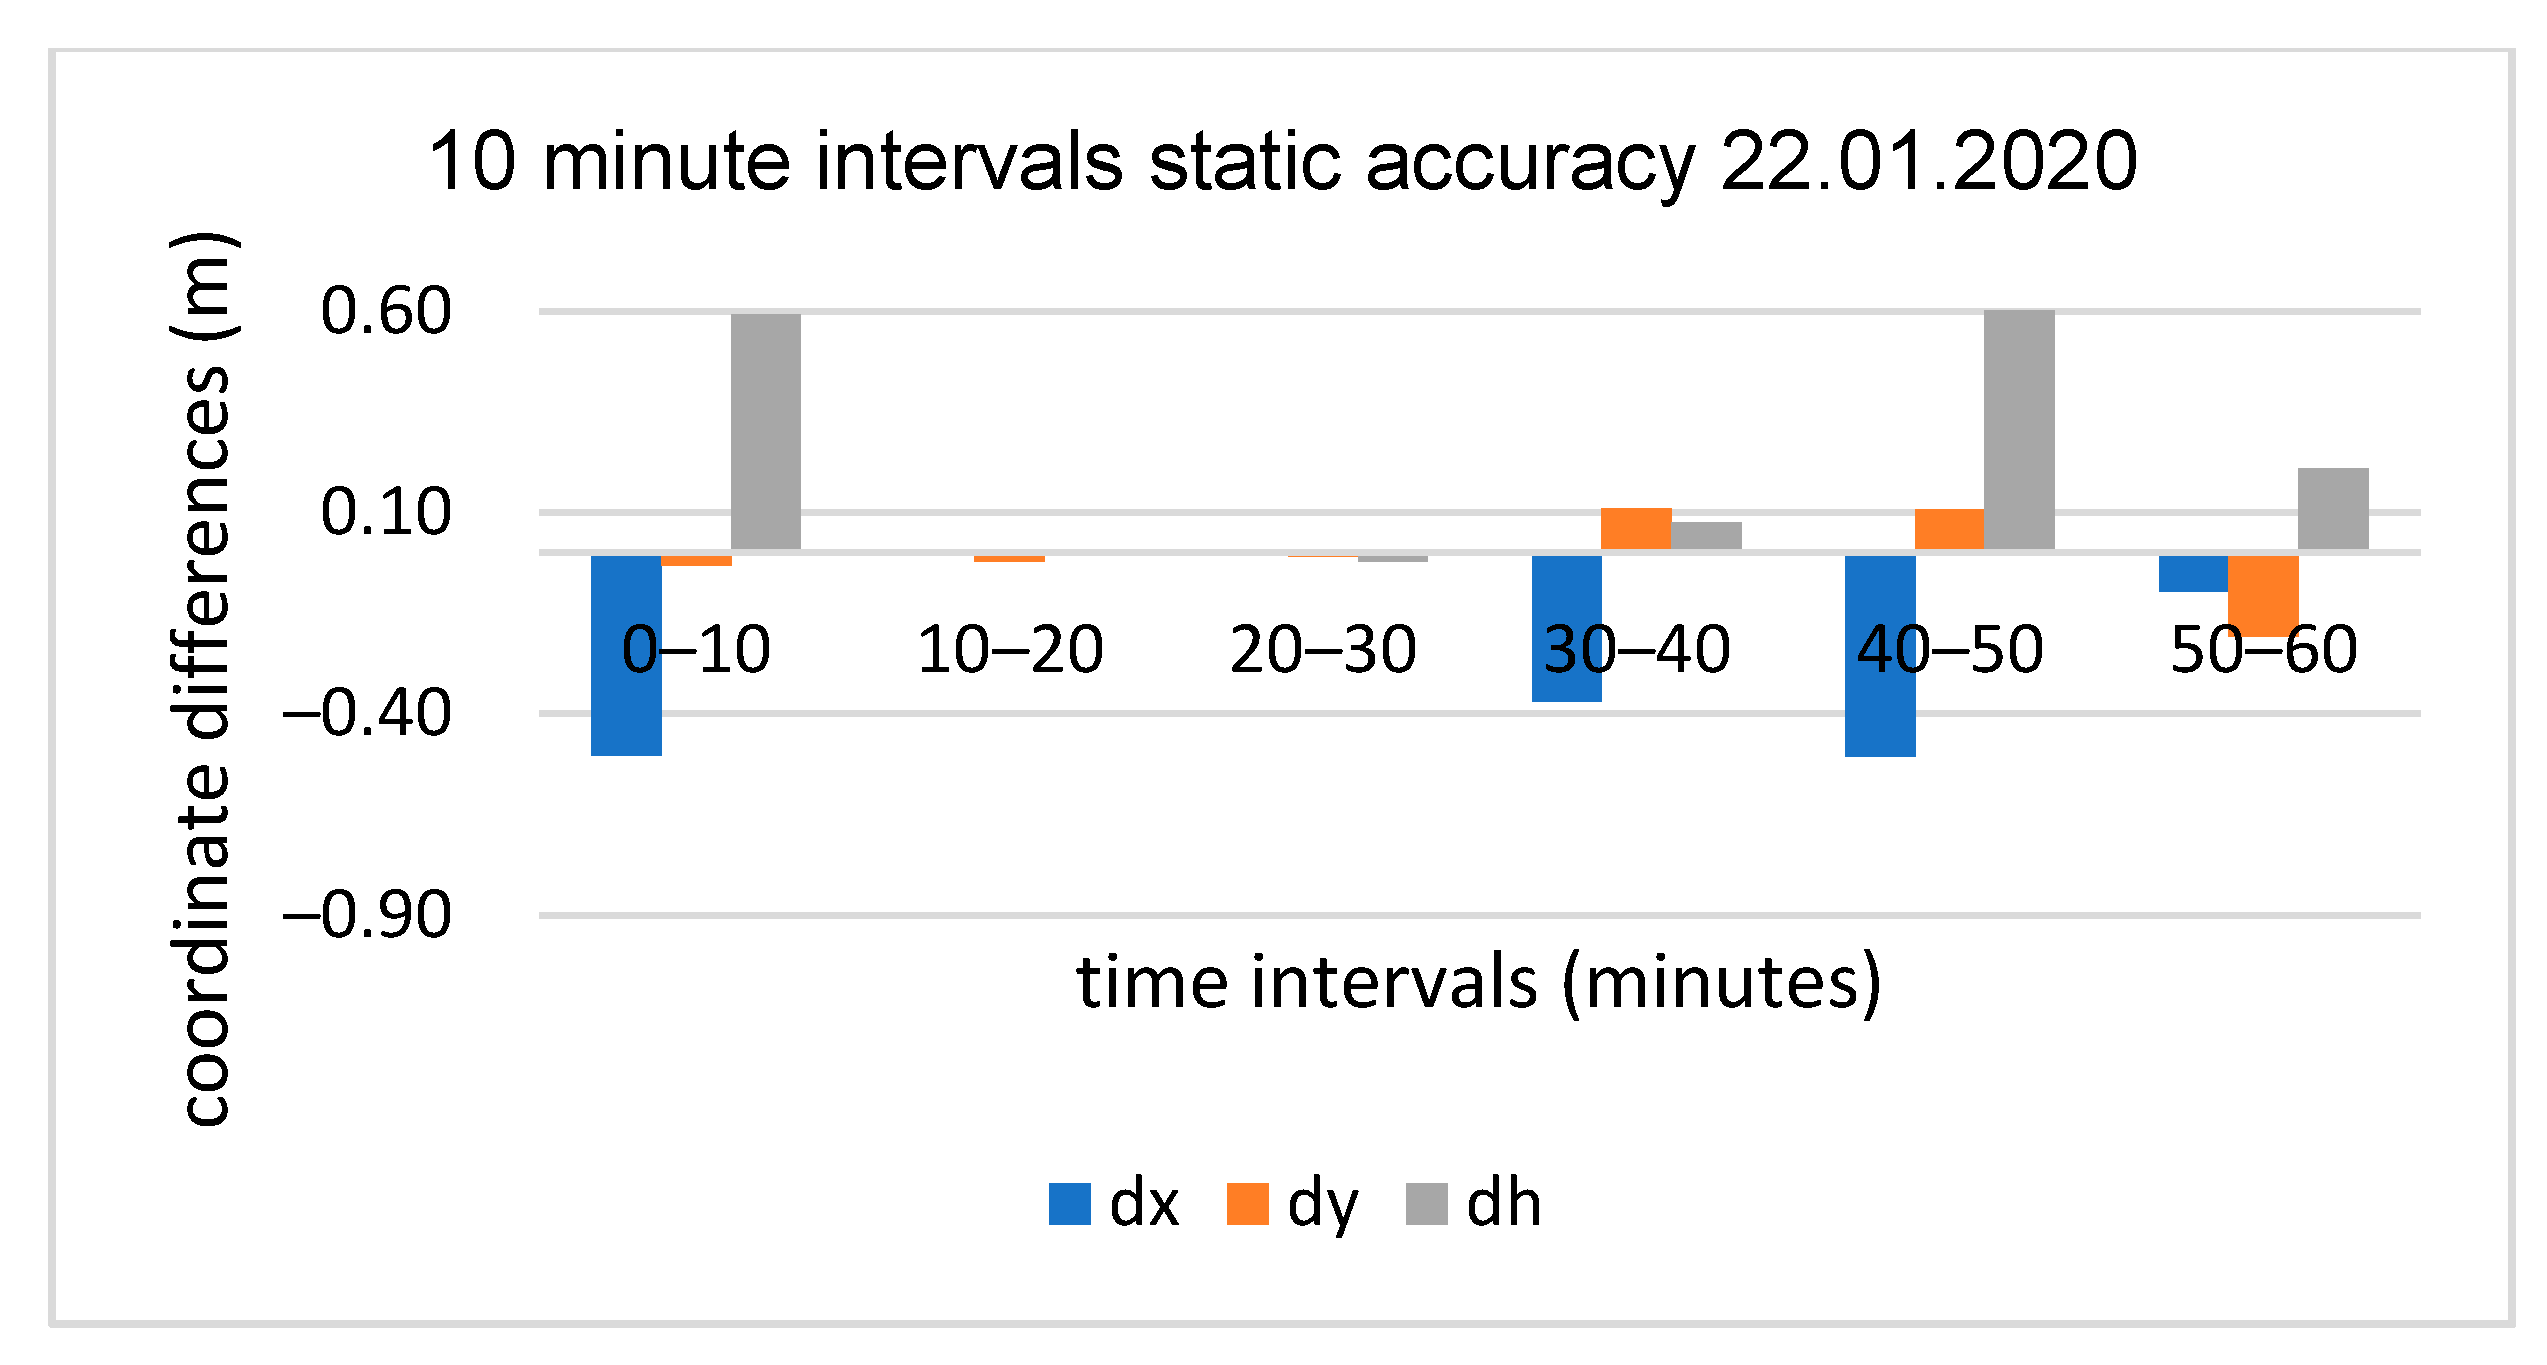
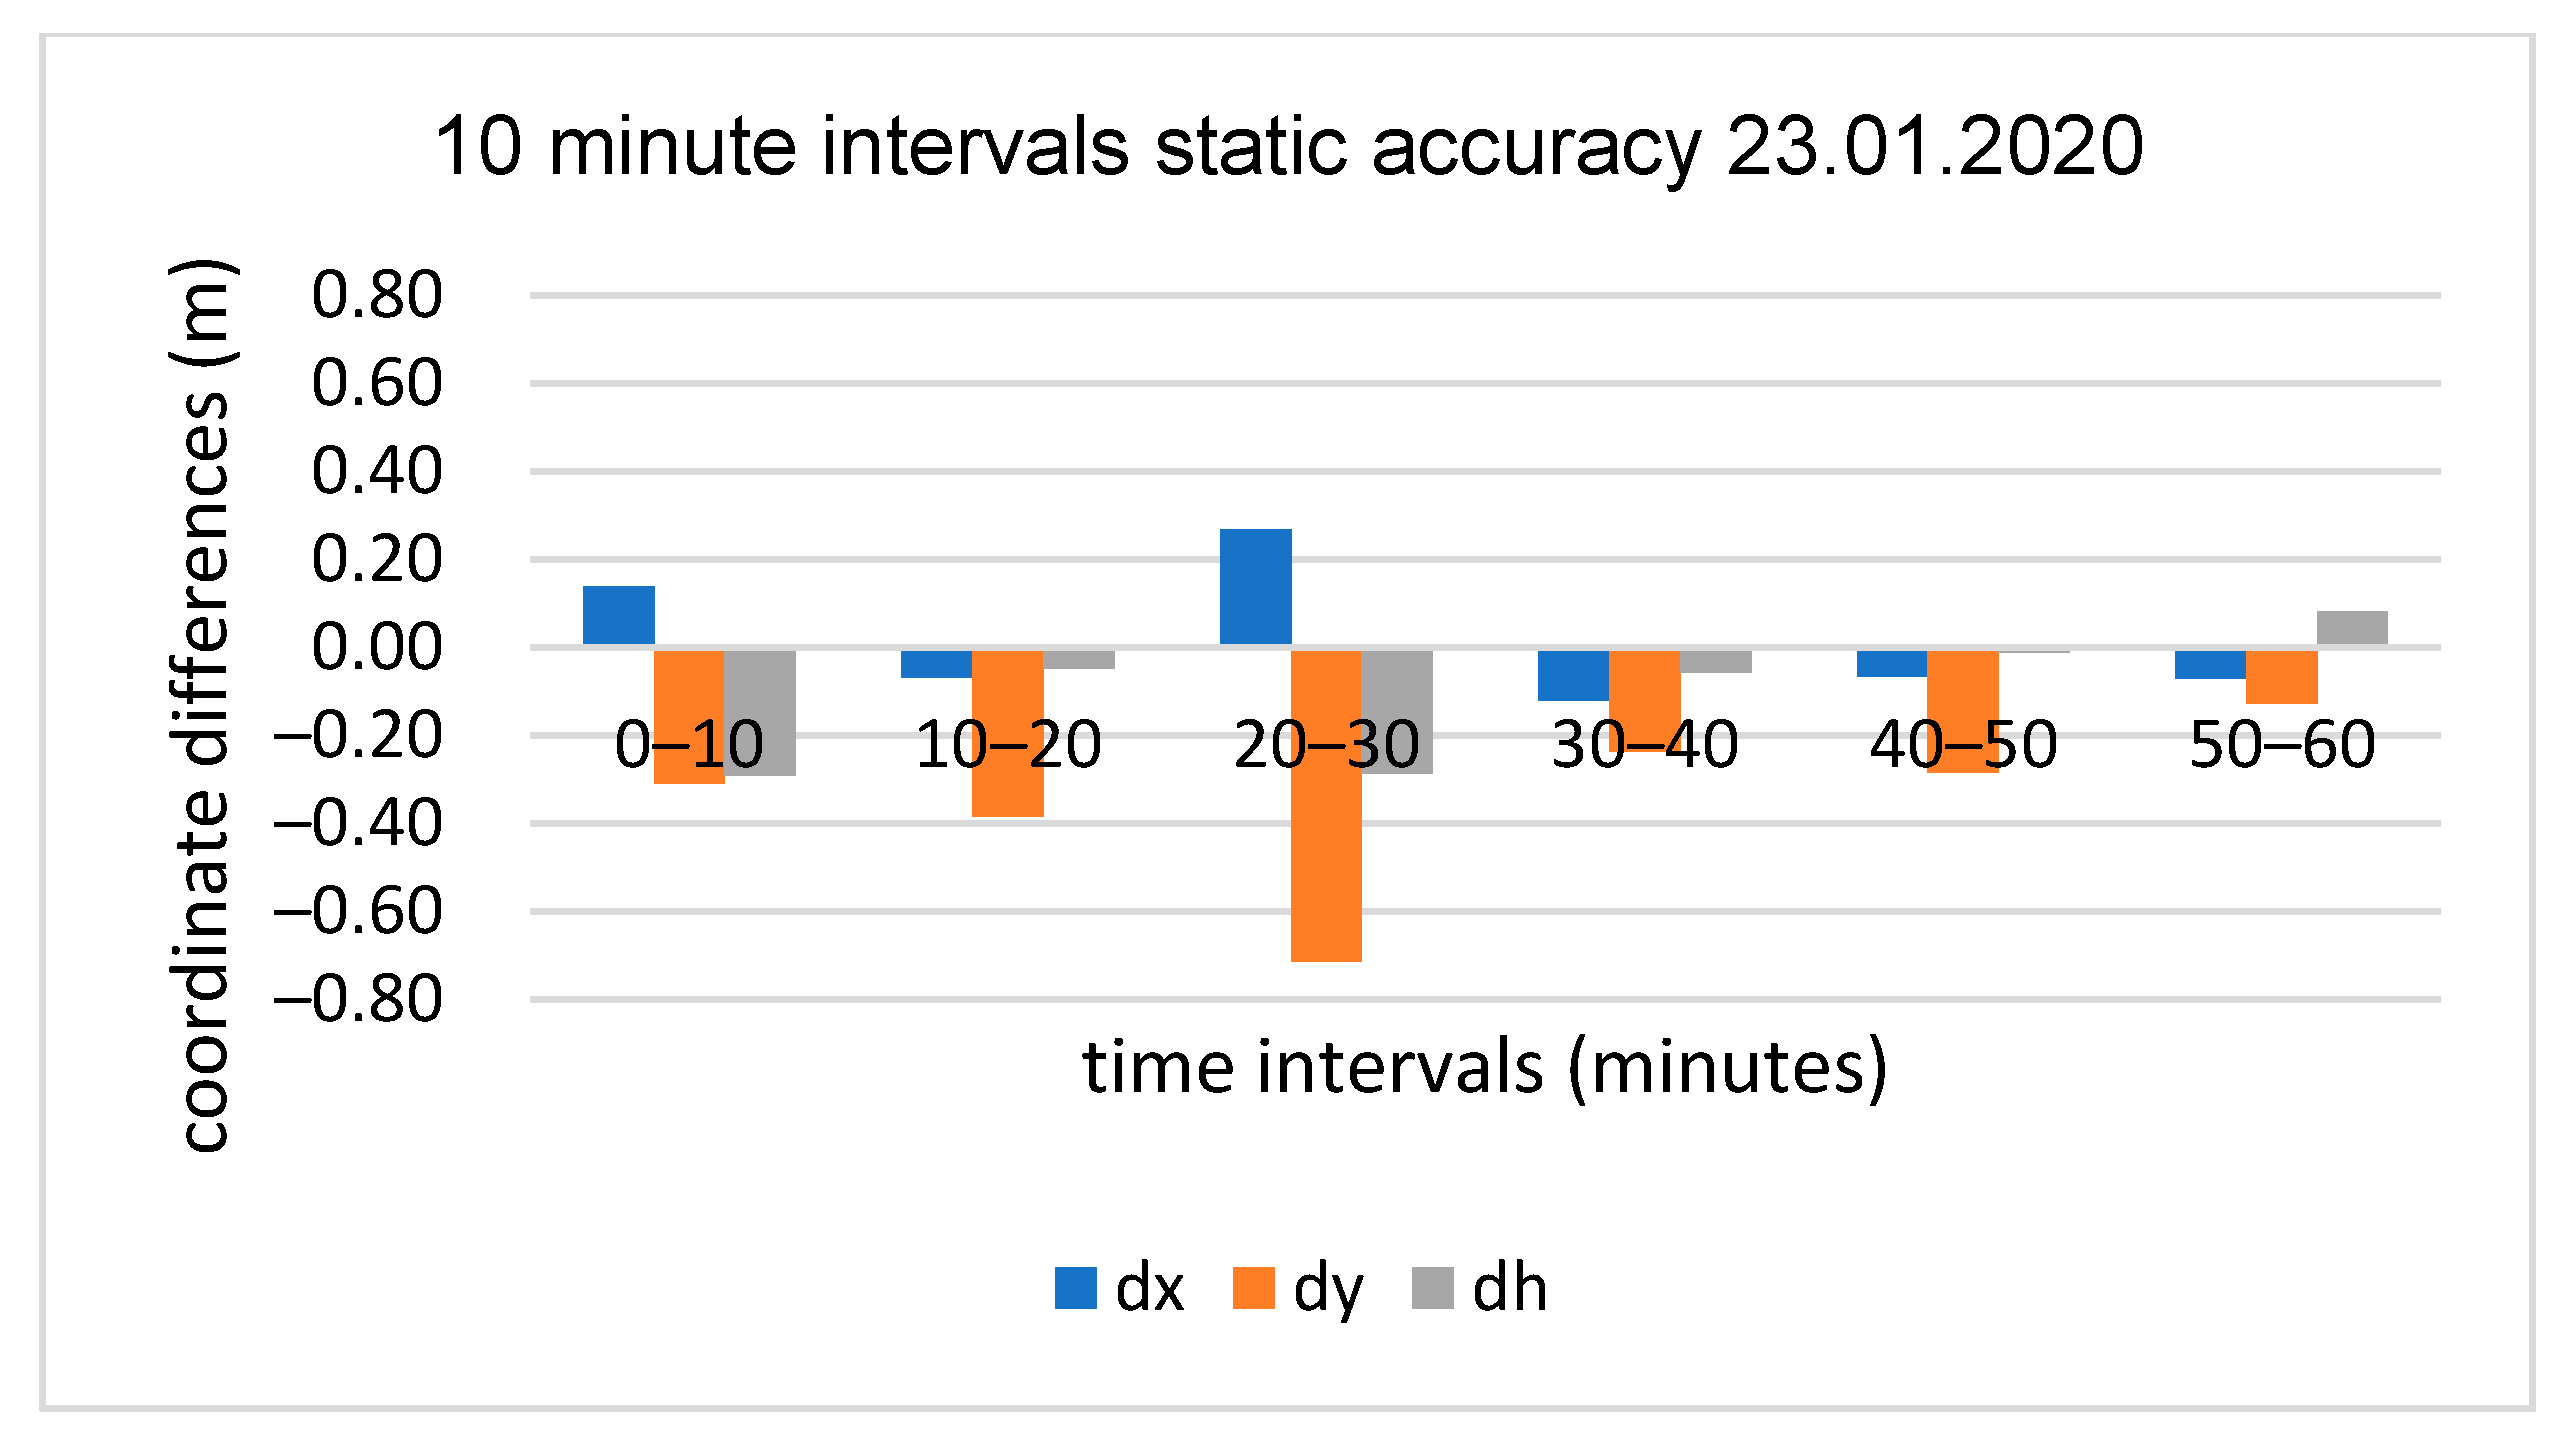
Figure 11.
10 min sub-session positioning results for the second test, baseline OPNT–P30Pro (4 km).
Figure 11.
10 min sub-session positioning results for the second test, baseline OPNT–P30Pro (4 km).
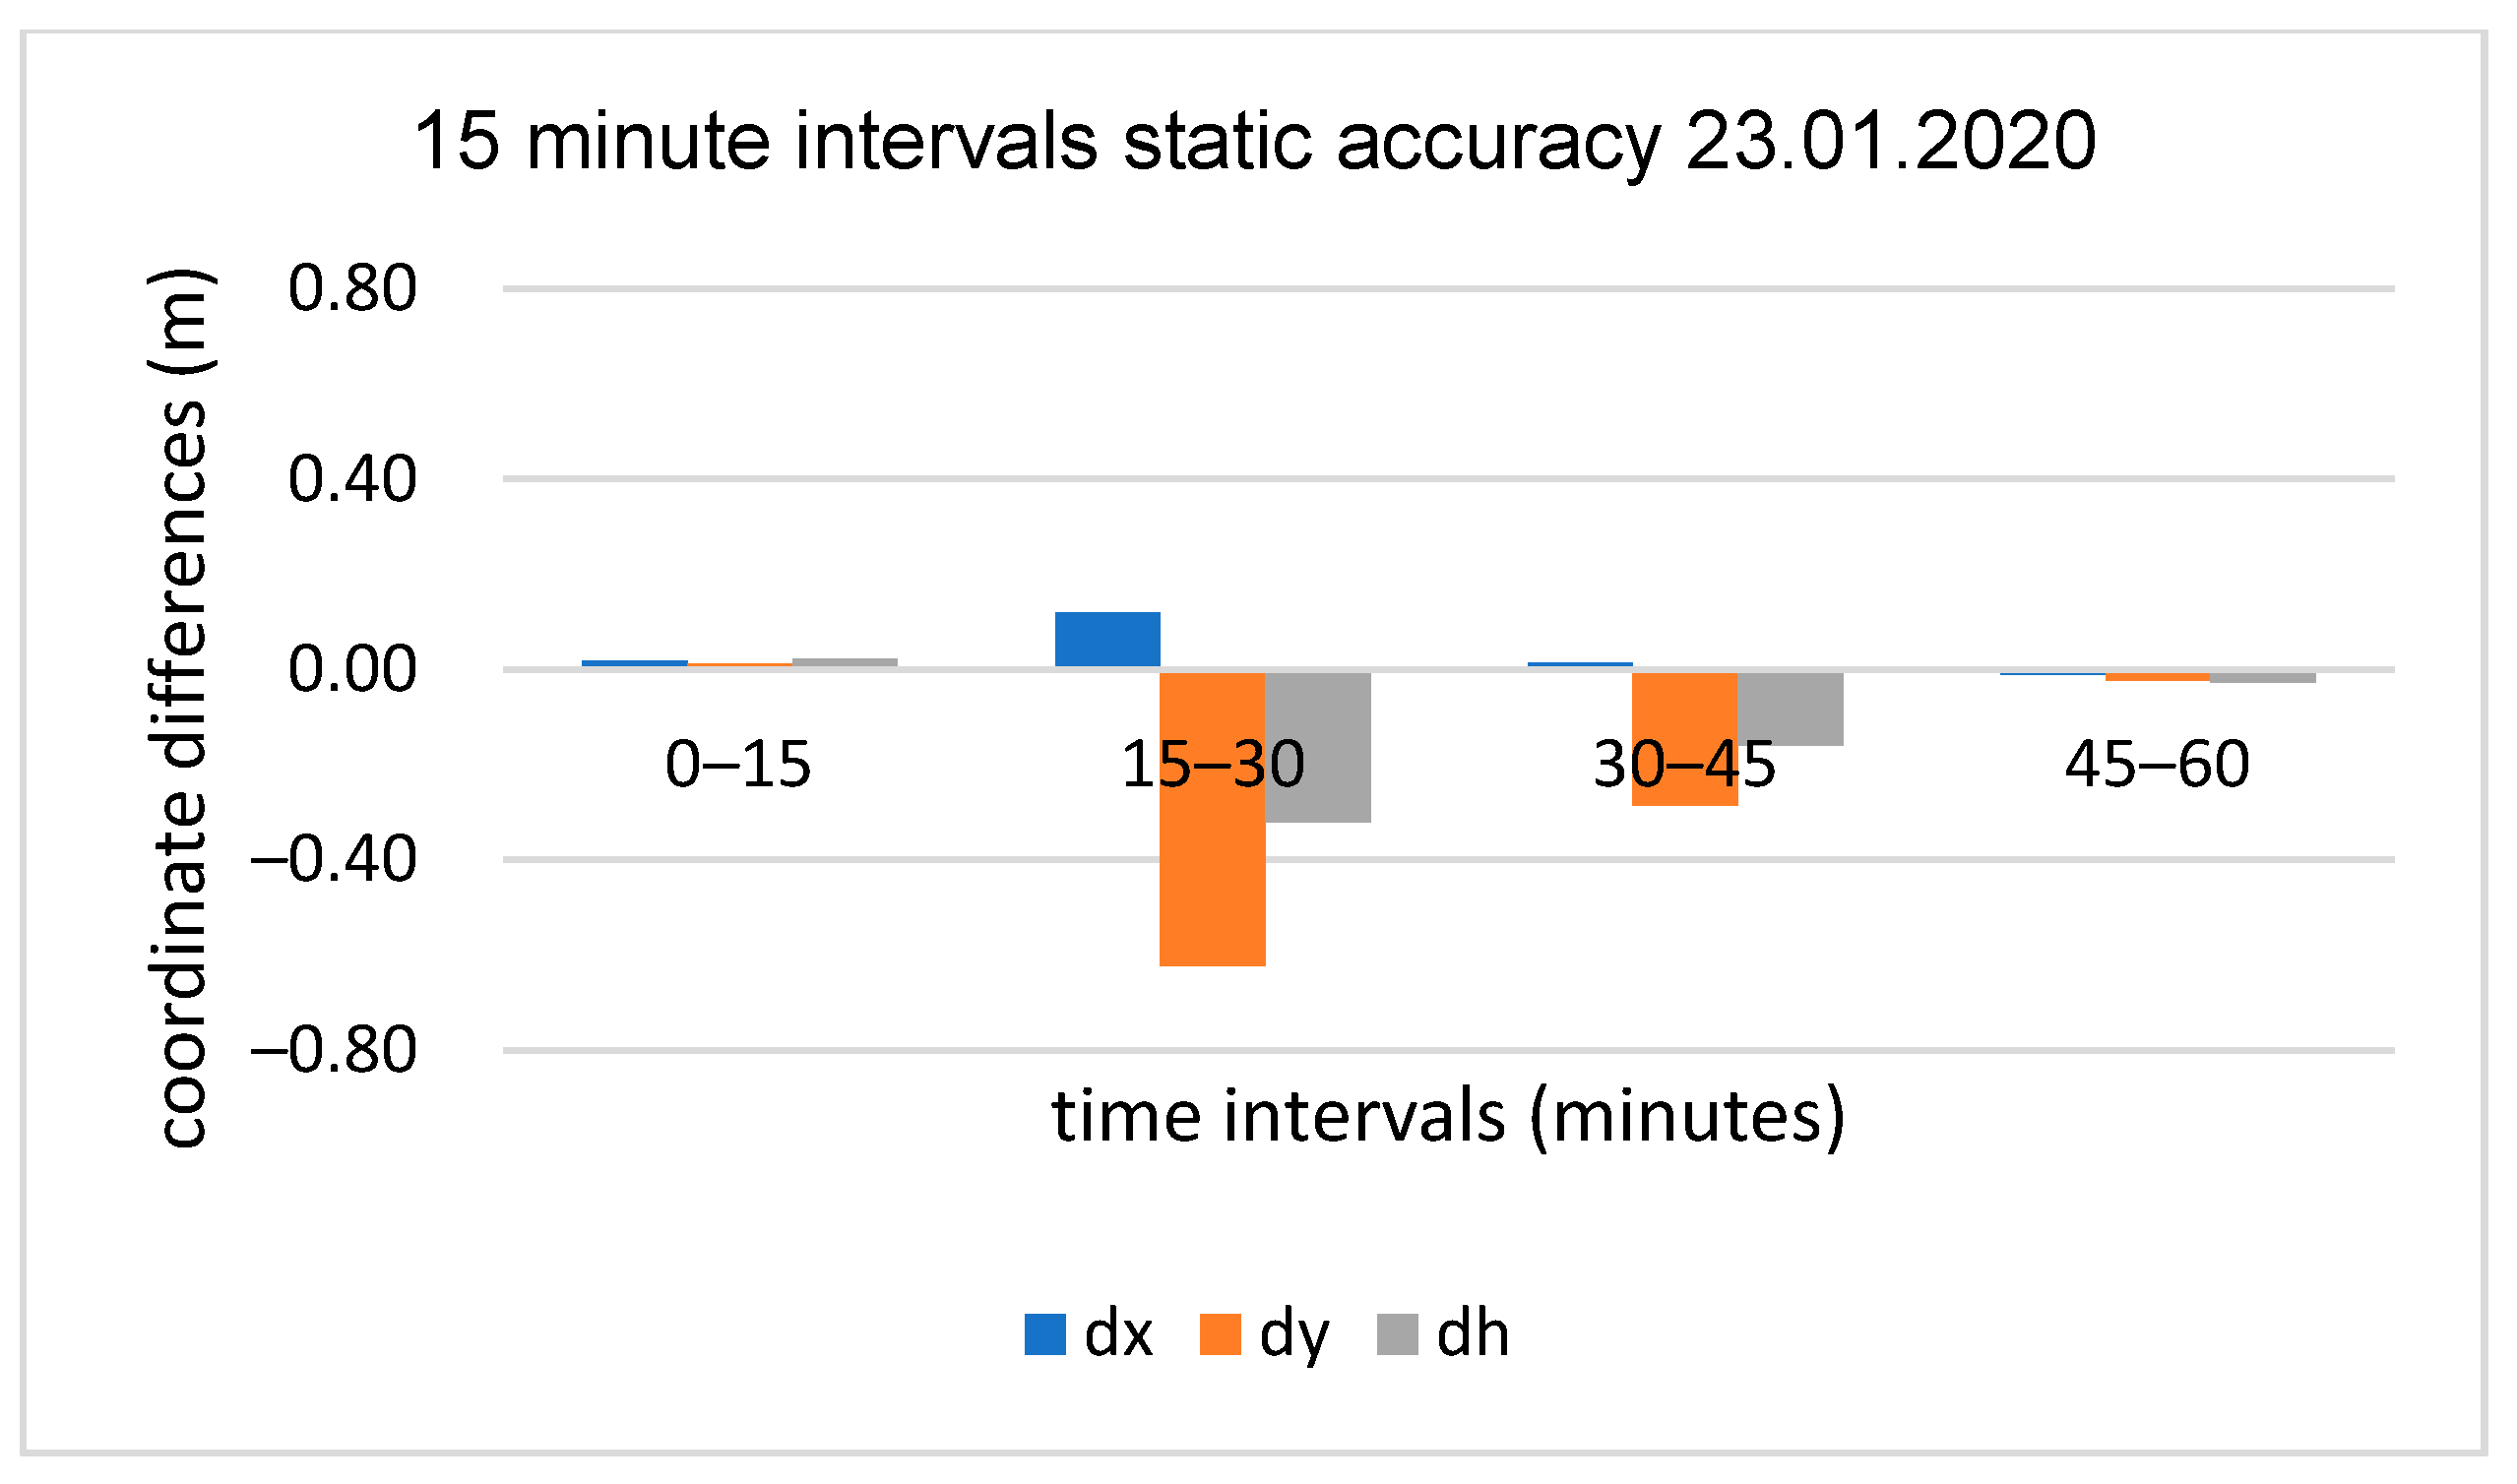
Figure 12.
15 min sub-session positioning results for the second test, baseline OPNT–P30Pro (4km).
Figure 12.
15 min sub-session positioning results for the second test, baseline OPNT–P30Pro (4km).
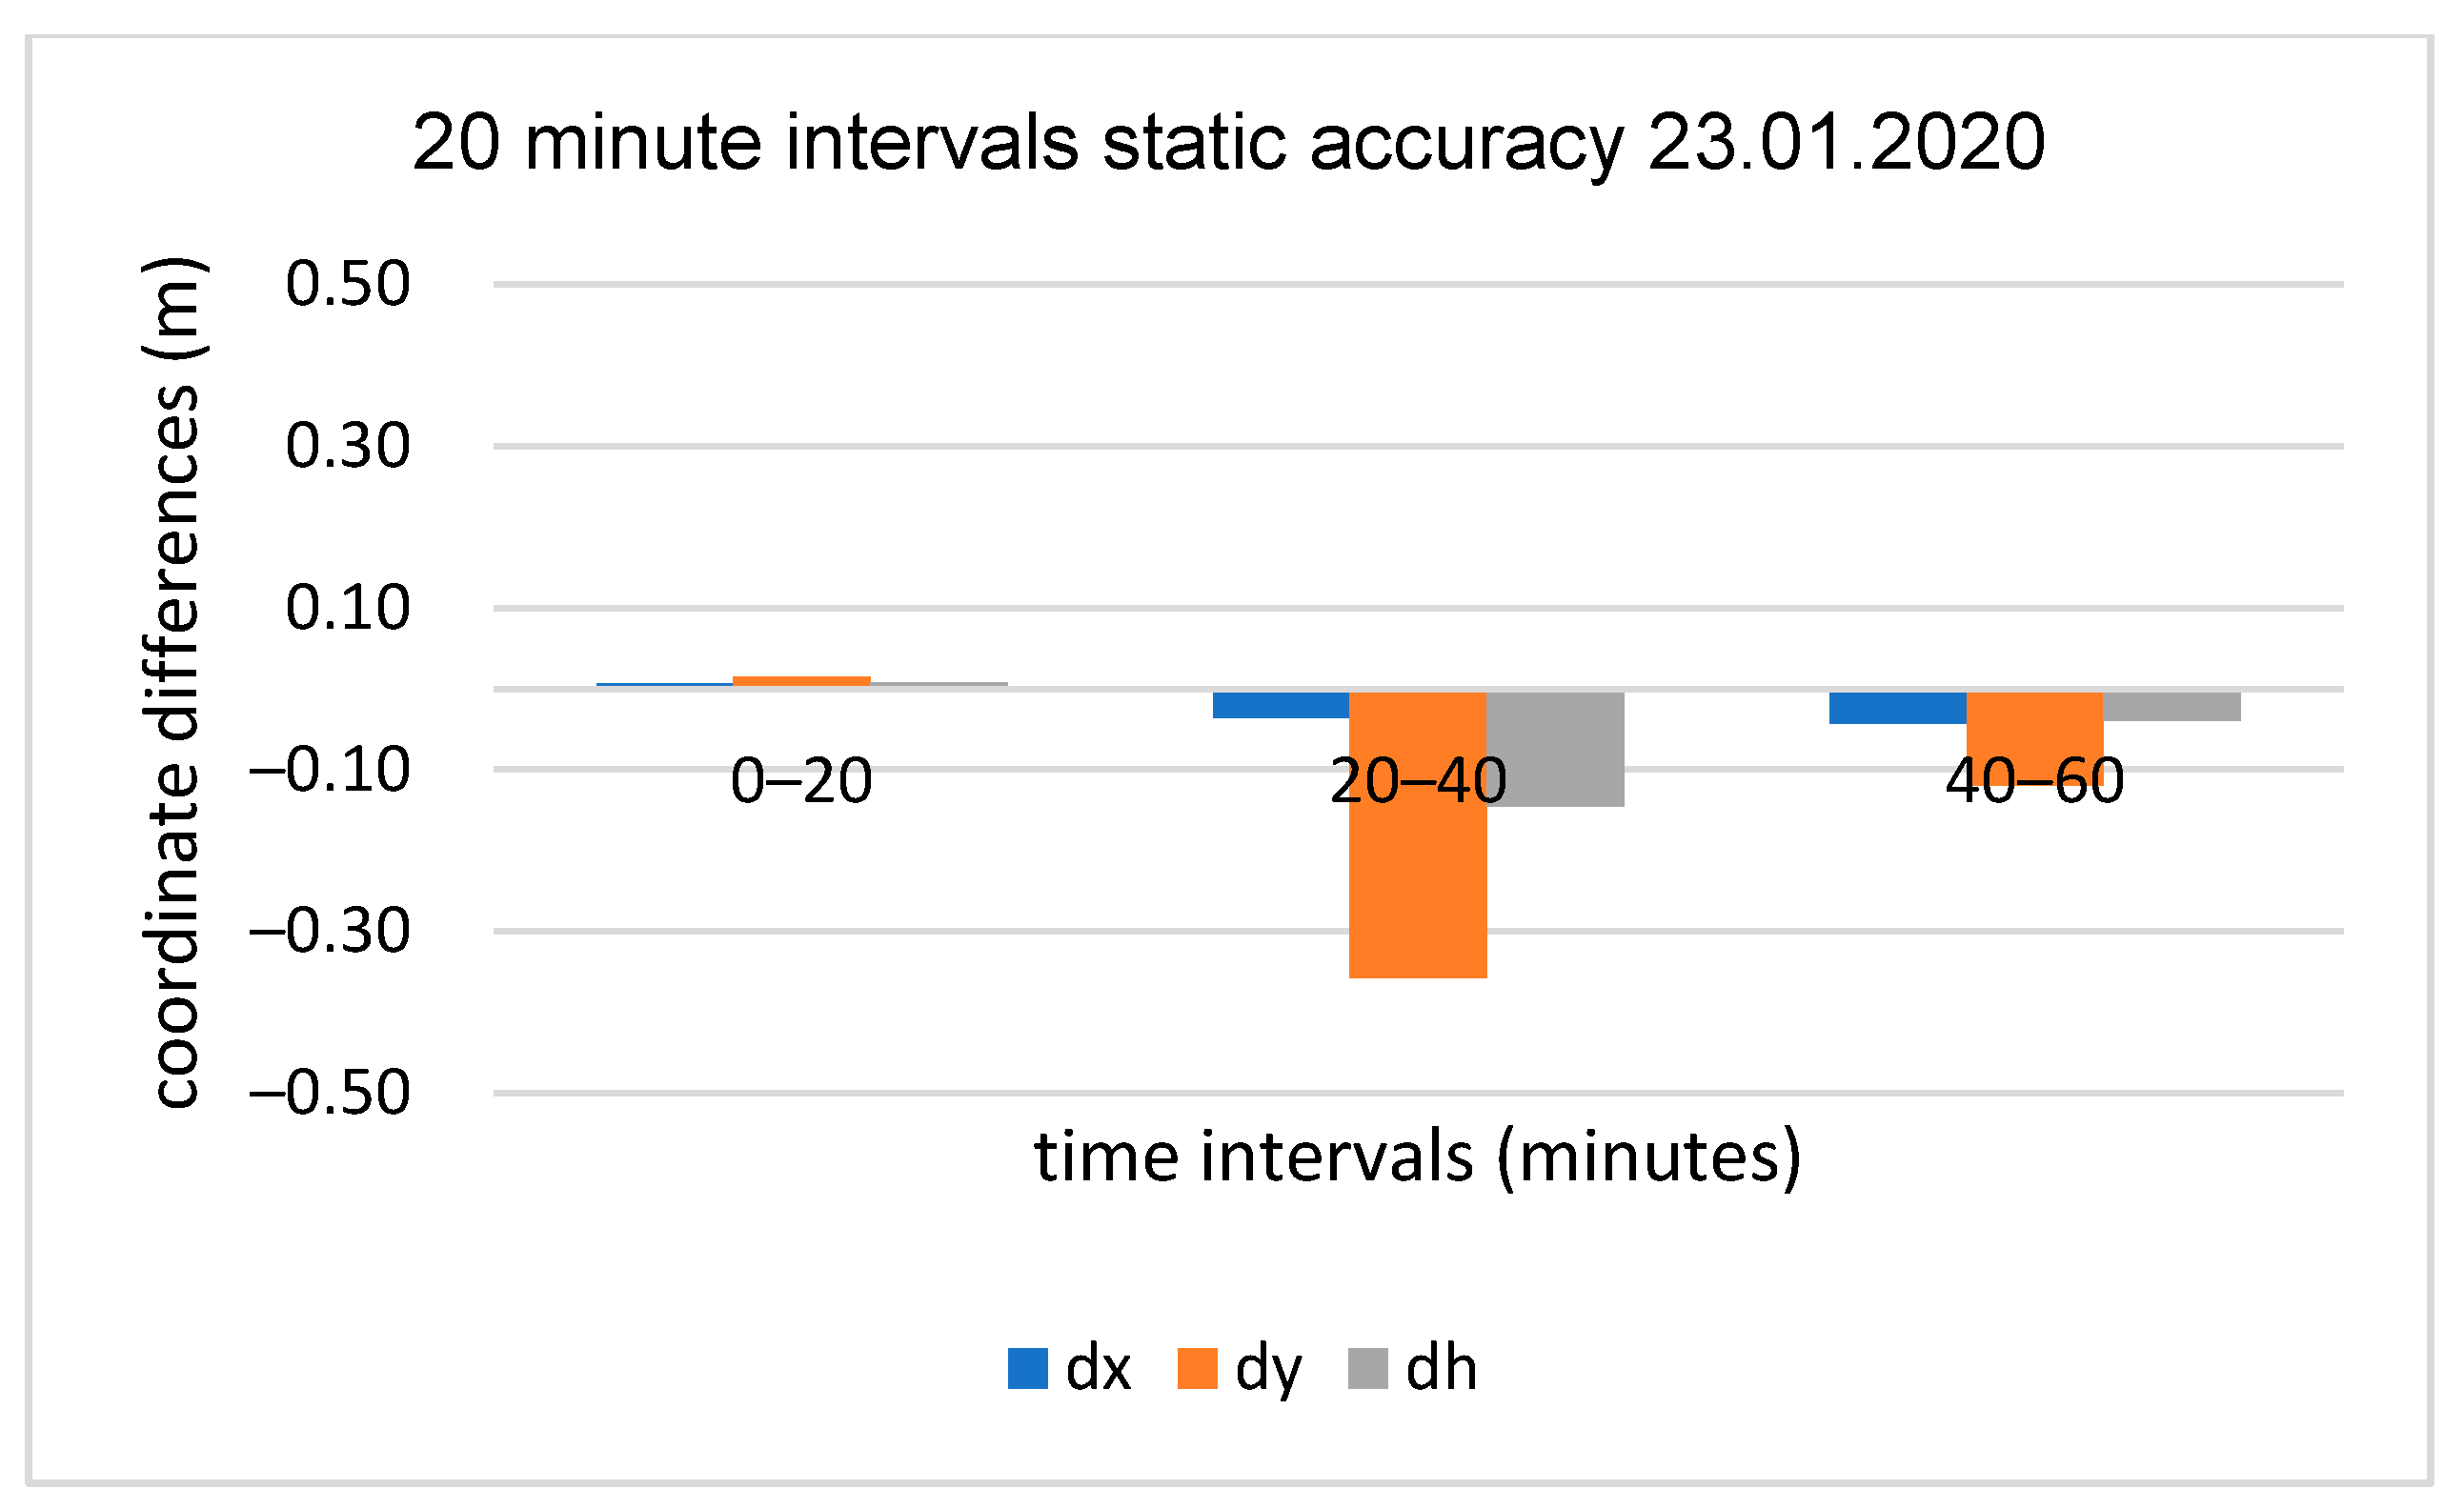
Figure 13.
20 min sub-session positioning results for the second test, baseline OPNT–P30Pro (4 km).
Figure 13.
20 min sub-session positioning results for the second test, baseline OPNT–P30Pro (4 km).
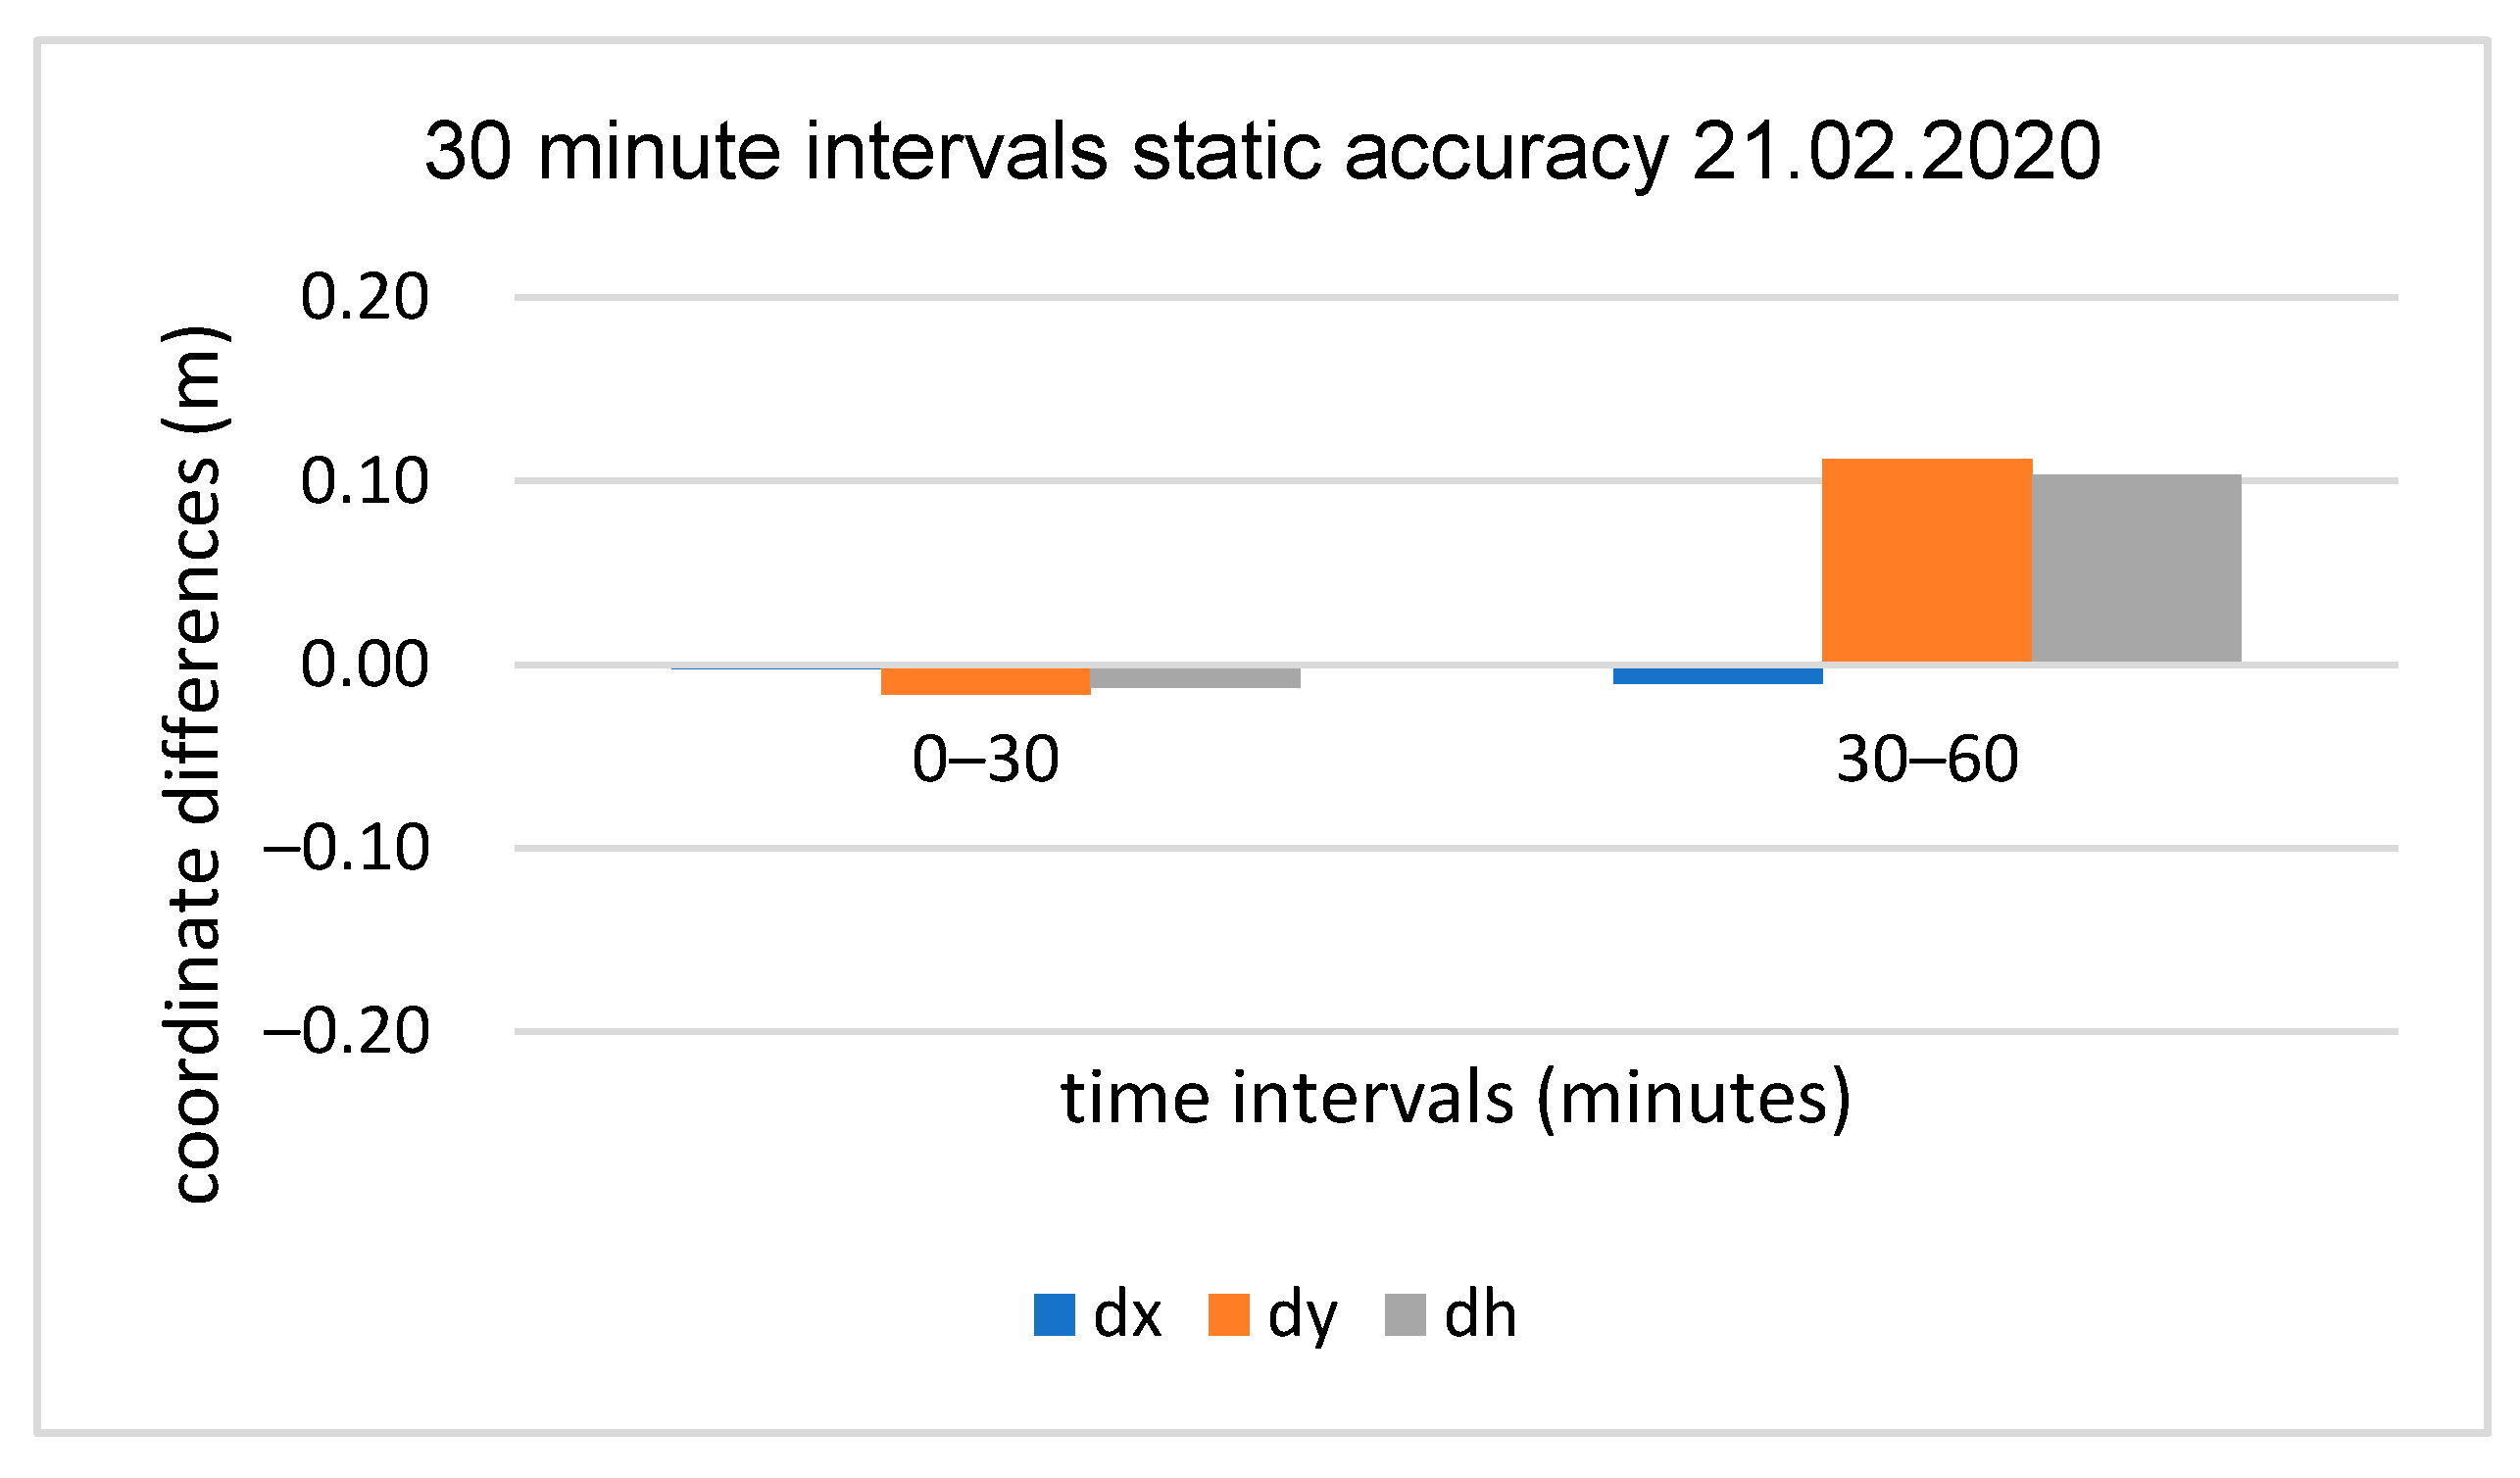
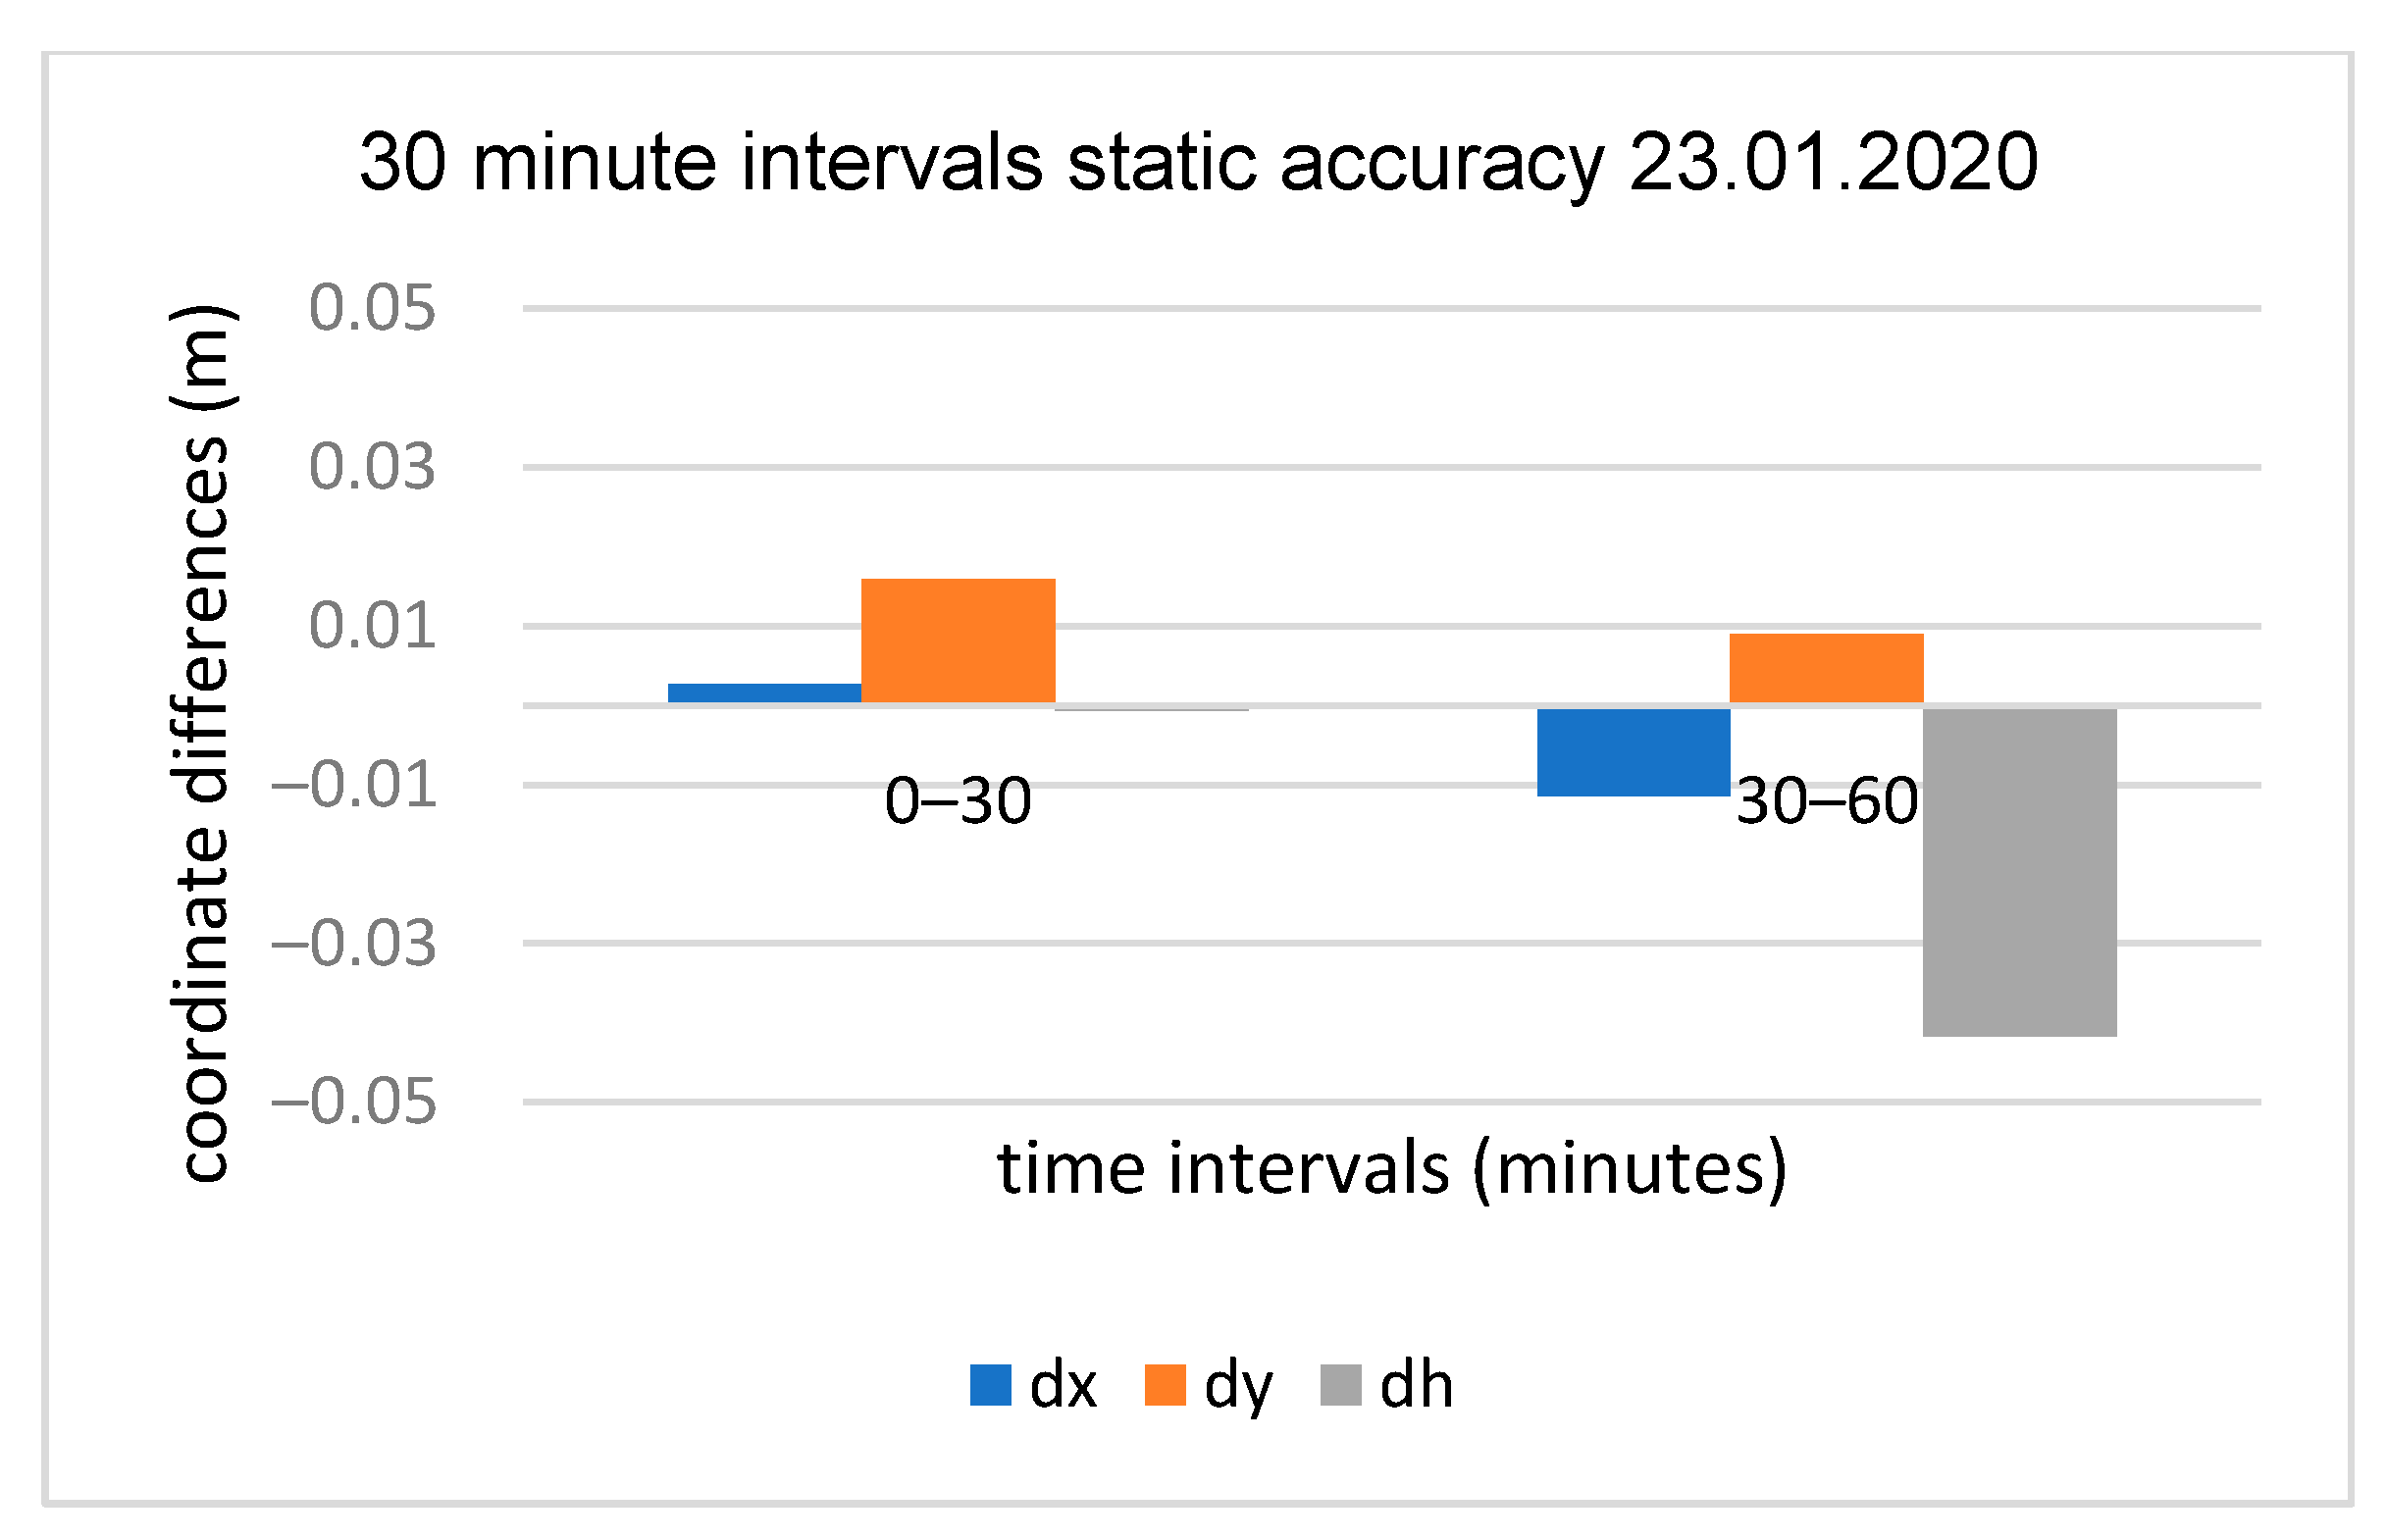
Figure 14.
30 min sub-session positioning results for the second test, baseline OPNT–P30Pro (4 km).
Figure 14.
30 min sub-session positioning results for the second test, baseline OPNT–P30Pro (4 km).
Figure 15.
60 min session positioning results for the second test, baseline OPNT–P30Pro (4 km).
Figure 15.
60 min session positioning results for the second test, baseline OPNT–P30Pro (4 km).
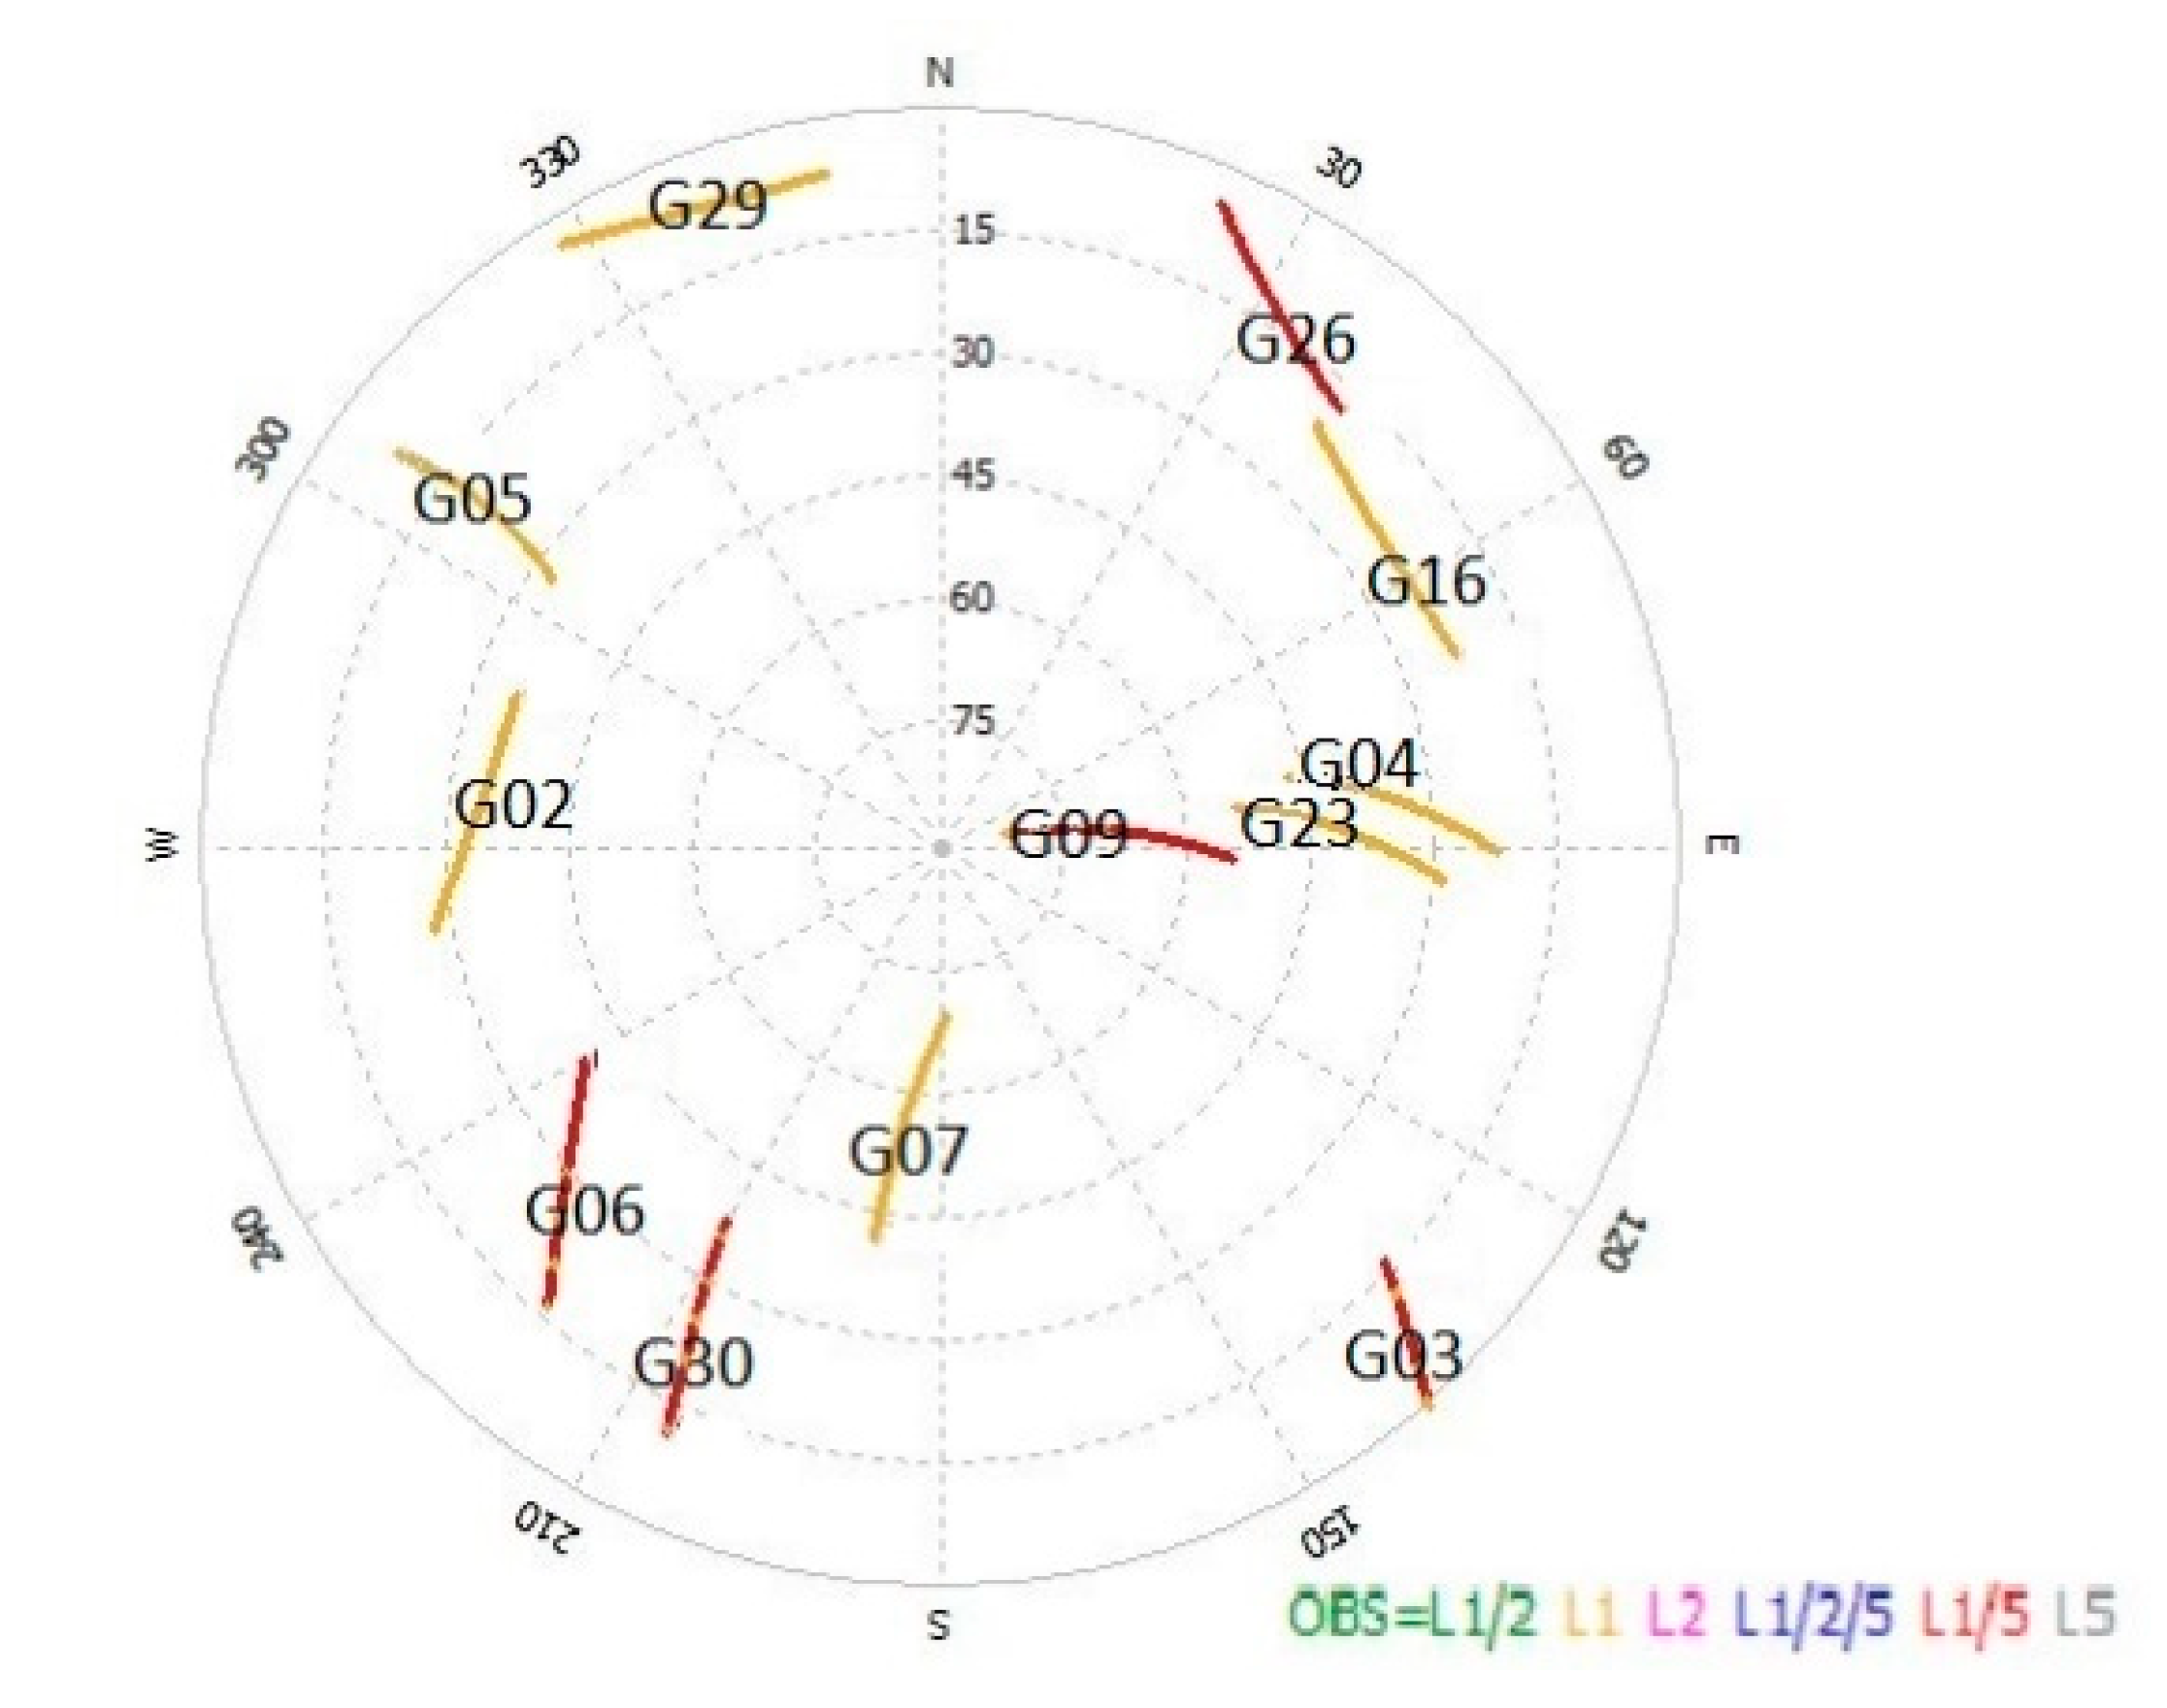
Figure 16.
Huawei P30 Pro skyplot of Global Positioning System (GPS)-only.
Figure 16.
Huawei P30 Pro skyplot of Global Positioning System (GPS)-only.
Figure 17.
10 min sub-session positioning results for the third test, baseline OPNT–P30Pro (4 km).
Figure 17.
10 min sub-session positioning results for the third test, baseline OPNT–P30Pro (4 km).
Figure 18.
15 min sub-session positioning results for the third test, baseline OPNT–P30Pro (4 km).
Figure 18.
15 min sub-session positioning results for the third test, baseline OPNT–P30Pro (4 km).
Figure 19.
20 min sub-session positioning results for the third test, baseline OPNT–P30Pro (4 km).
Figure 19.
20 min sub-session positioning results for the third test, baseline OPNT–P30Pro (4 km).
Figure 20.
30 min sub-session positioning results for the third test, baseline OPNT–P30Pro (4 km).
Figure 20.
30 min sub-session positioning results for the third test, baseline OPNT–P30Pro (4 km).
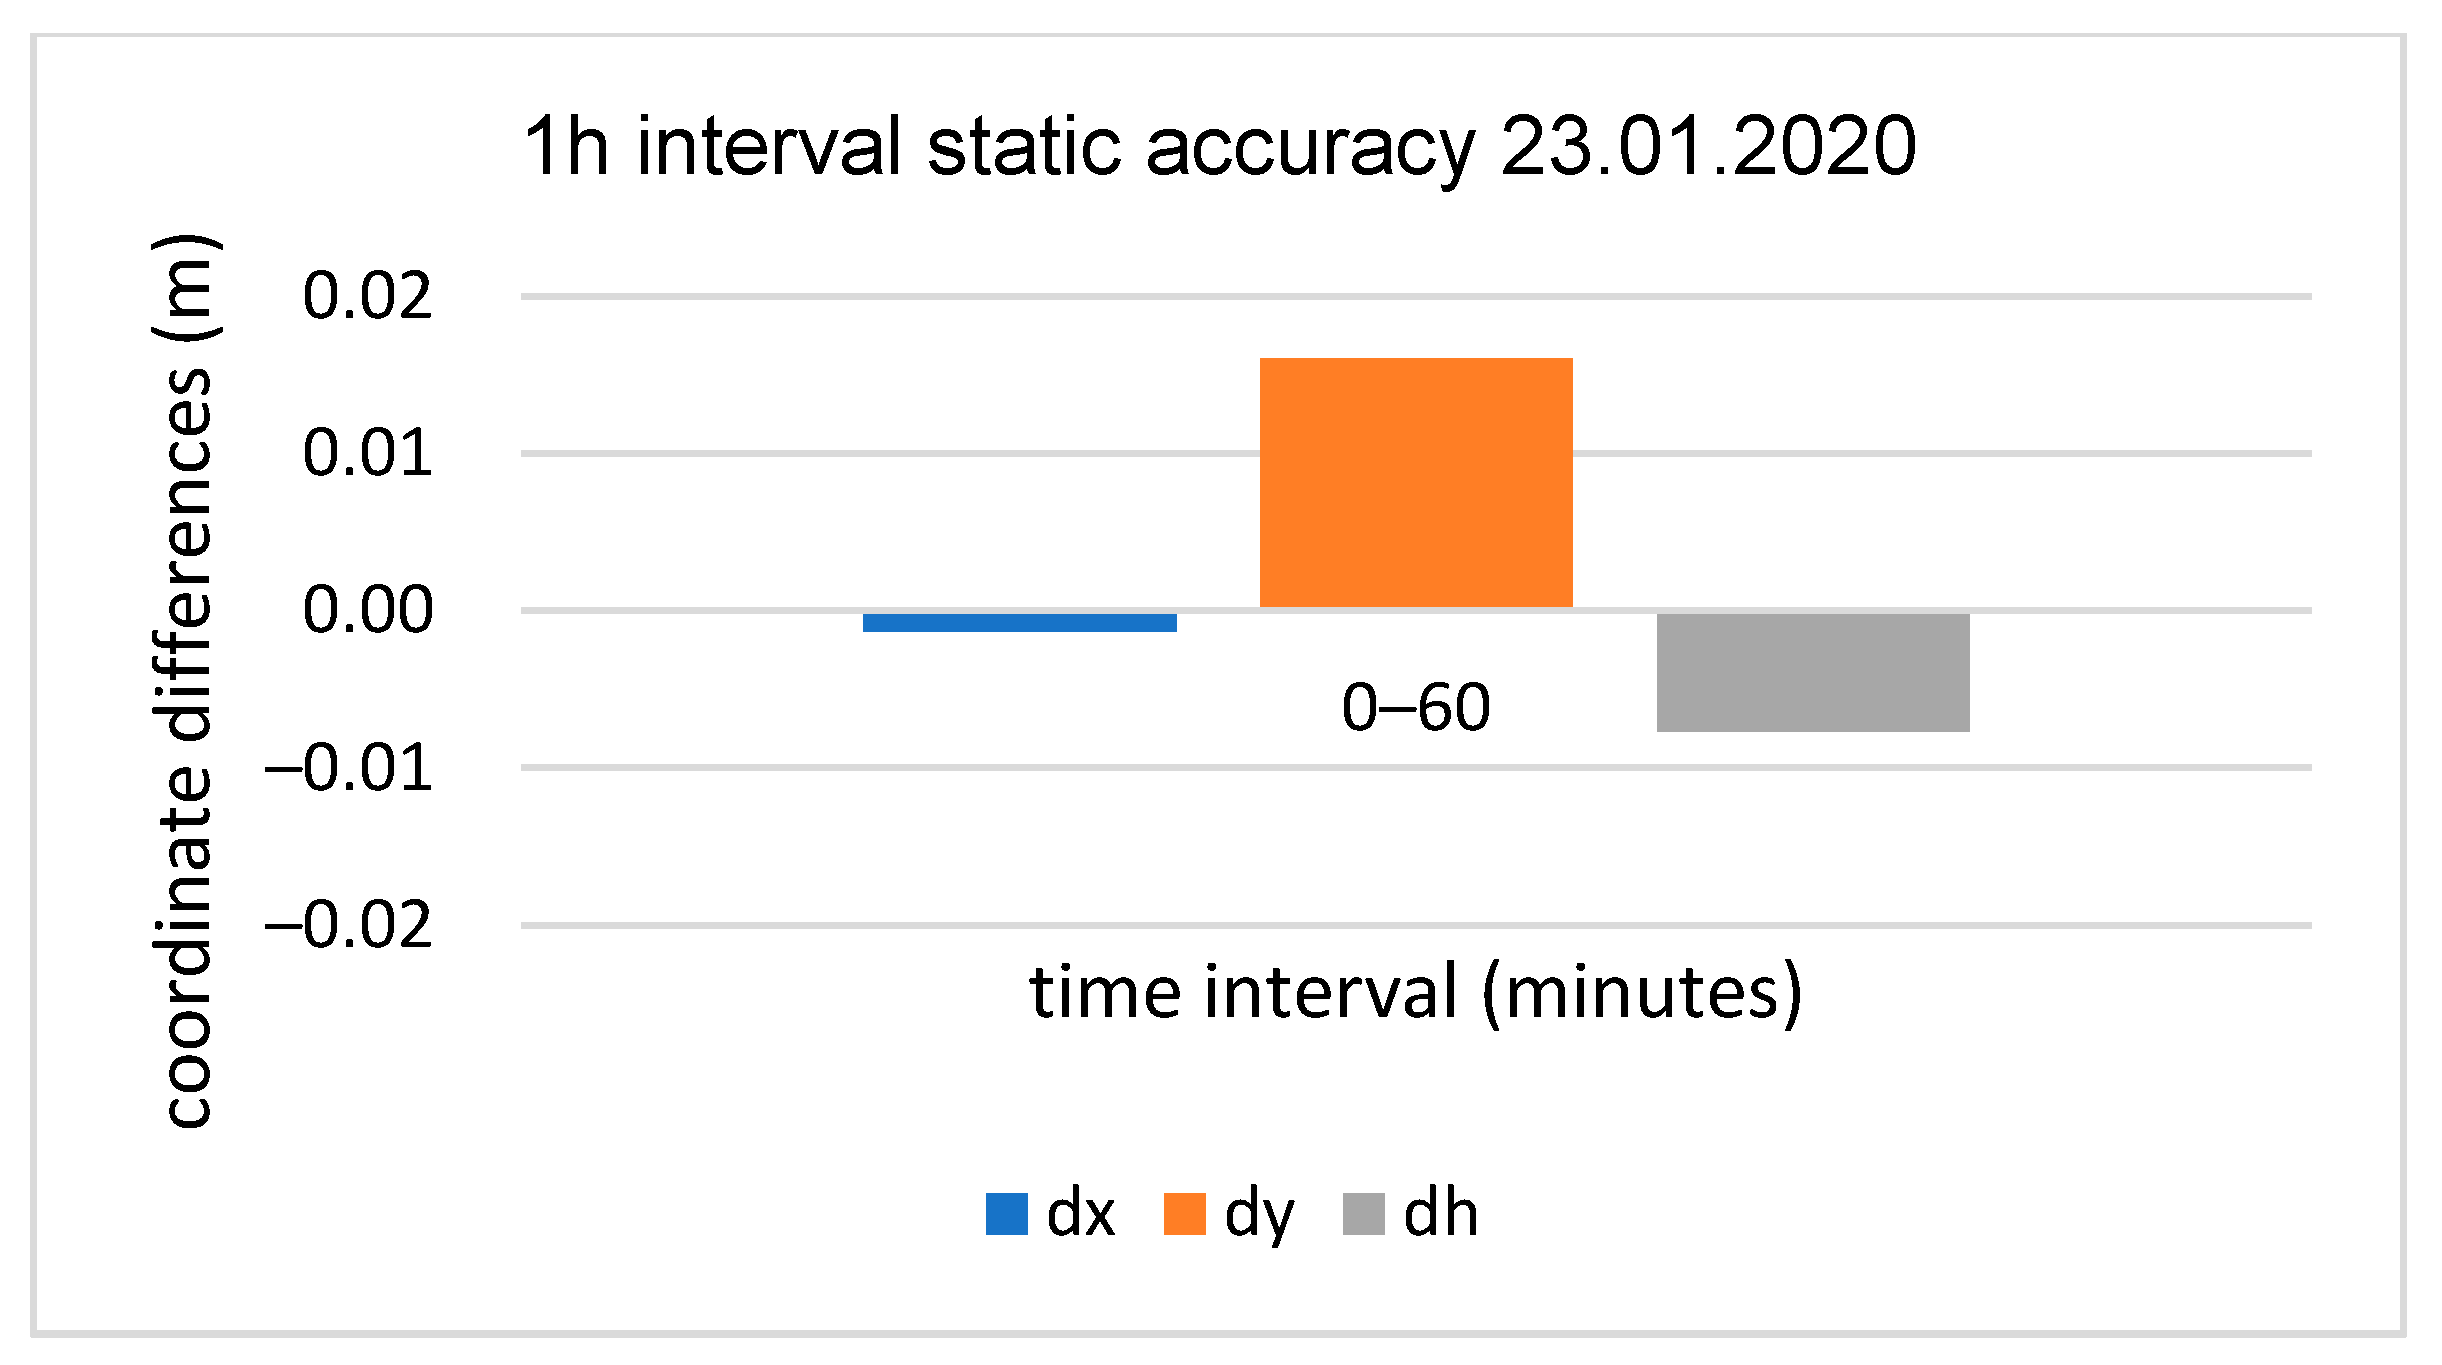
Figure 21.
60 min session positioning results for the third test, baseline OPNT–P30Pro (4 km).
Figure 21.
60 min session positioning results for the third test, baseline OPNT–P30Pro (4 km).
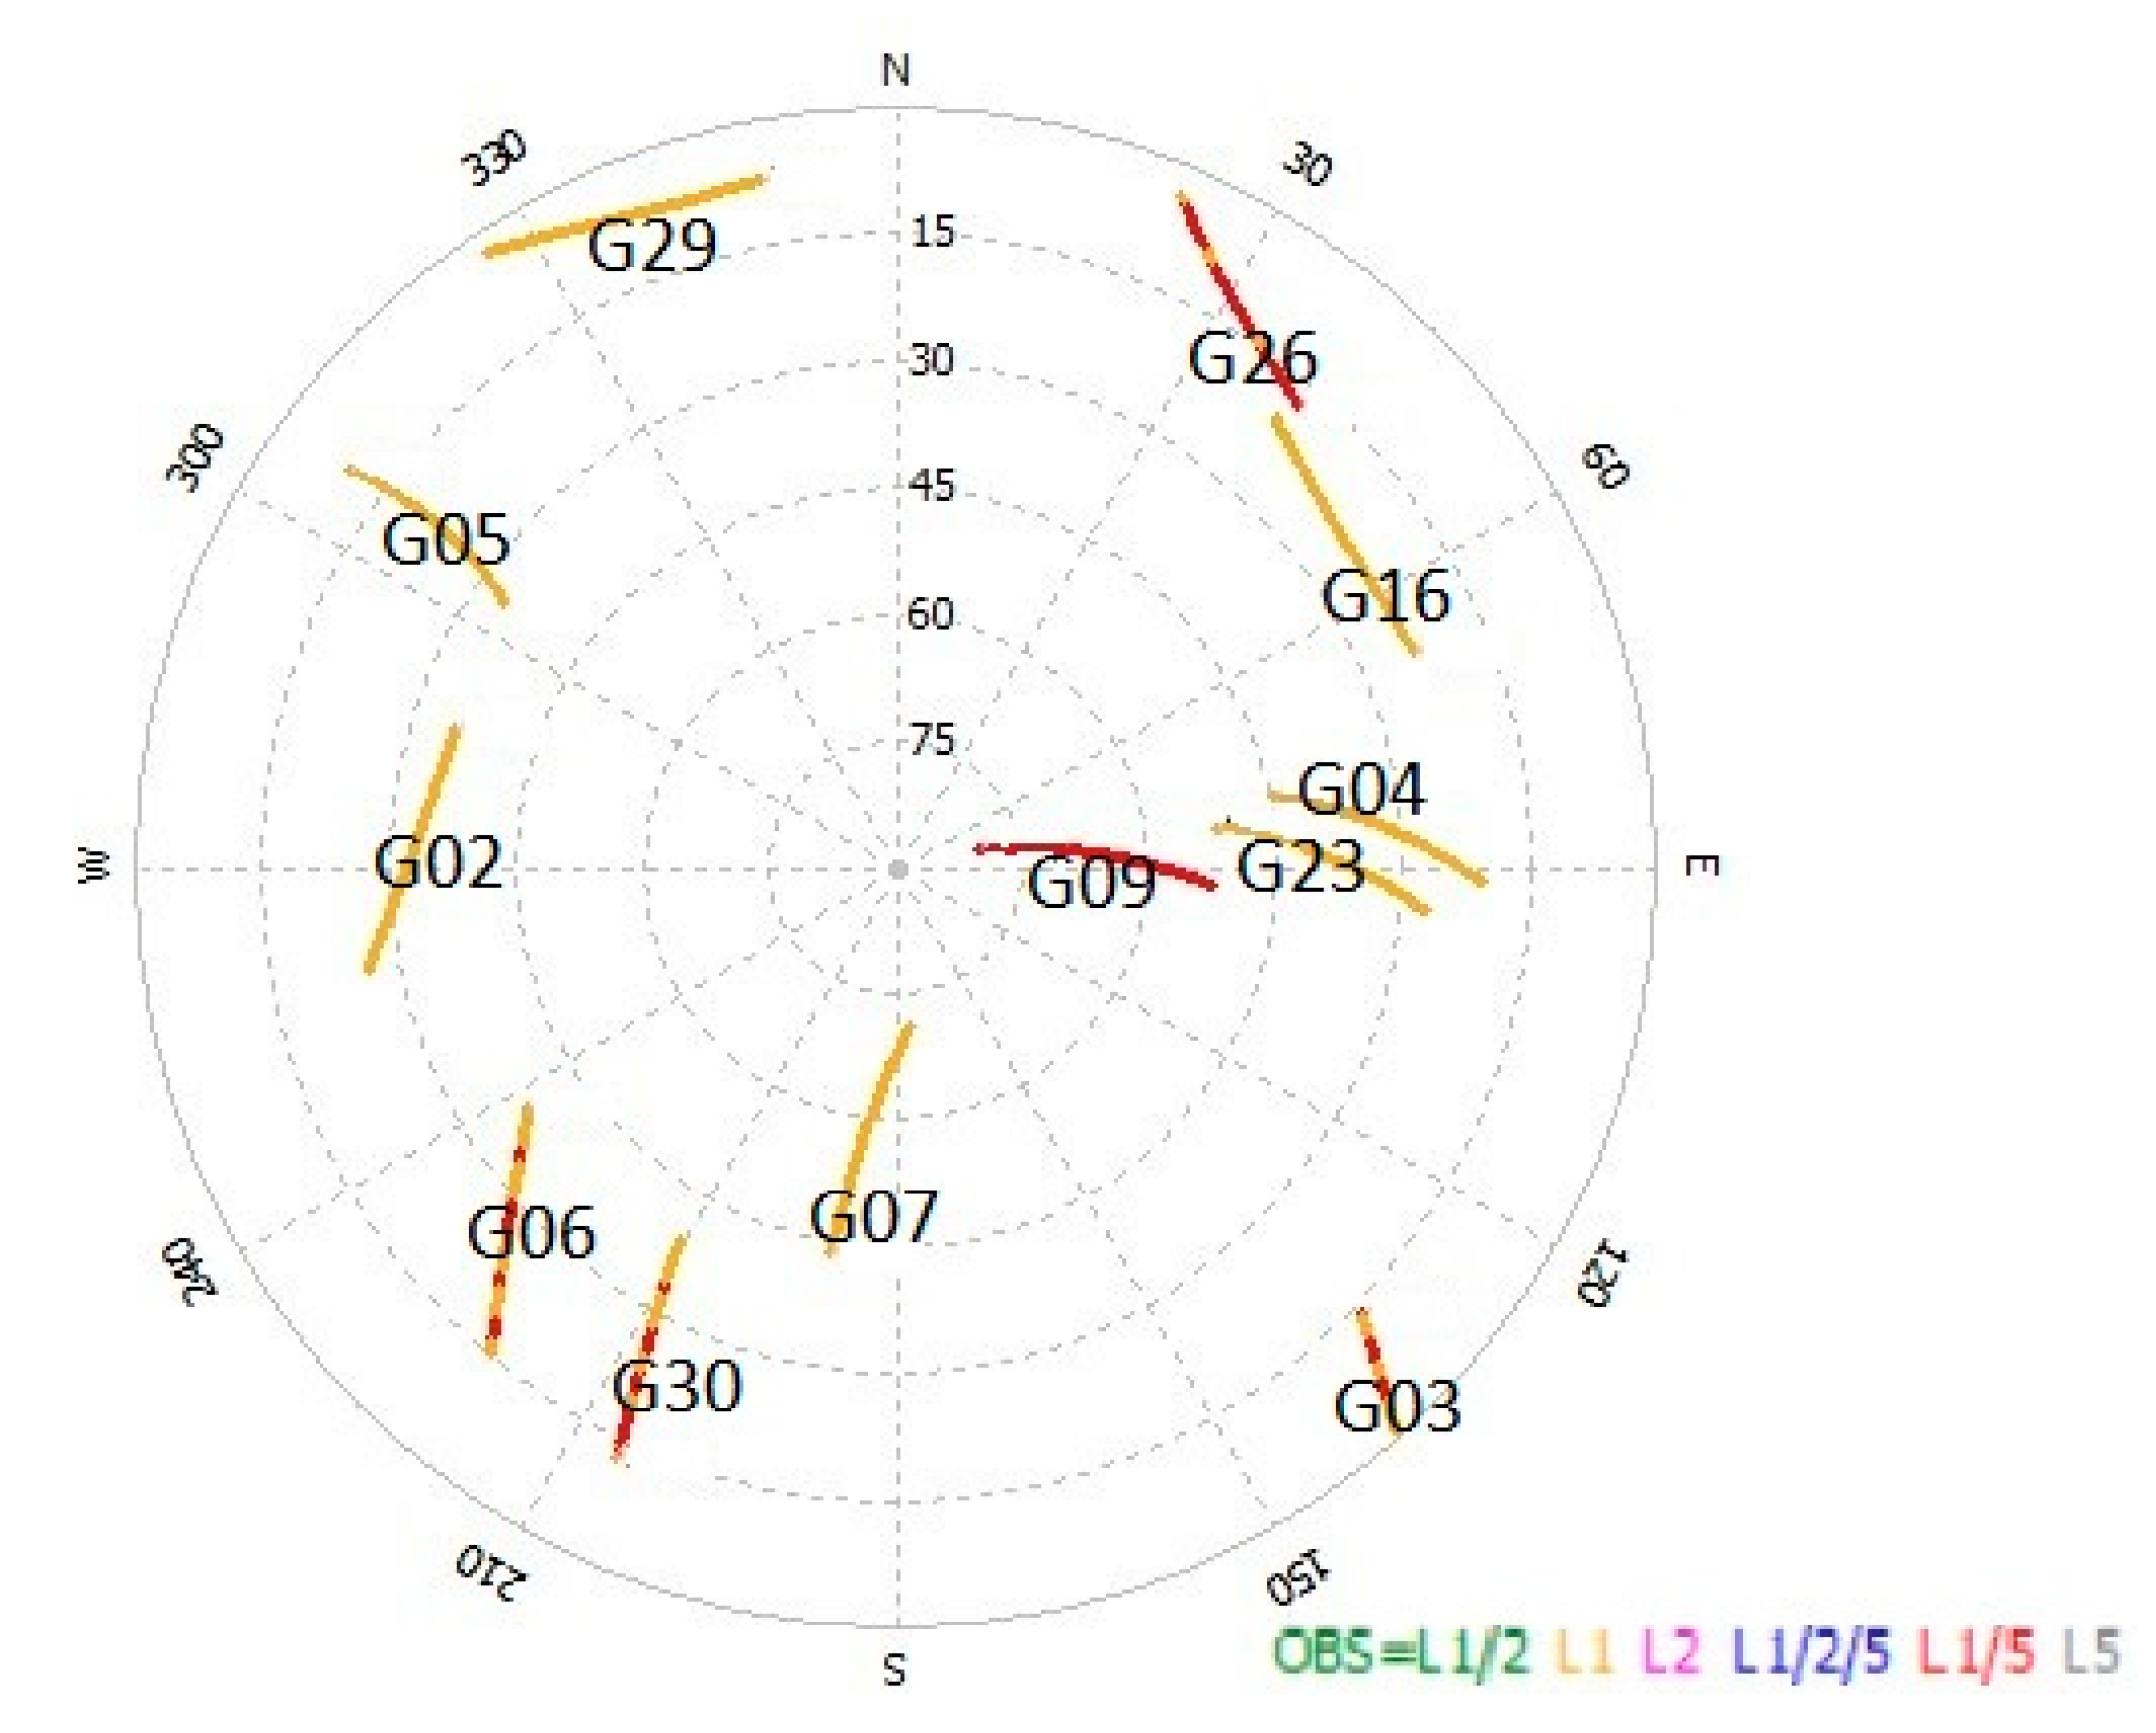
Figure 22.
Huawei P30 Pro skyplot of GPS-only (third experiment).
Figure 22.
Huawei P30 Pro skyplot of GPS-only (third experiment).
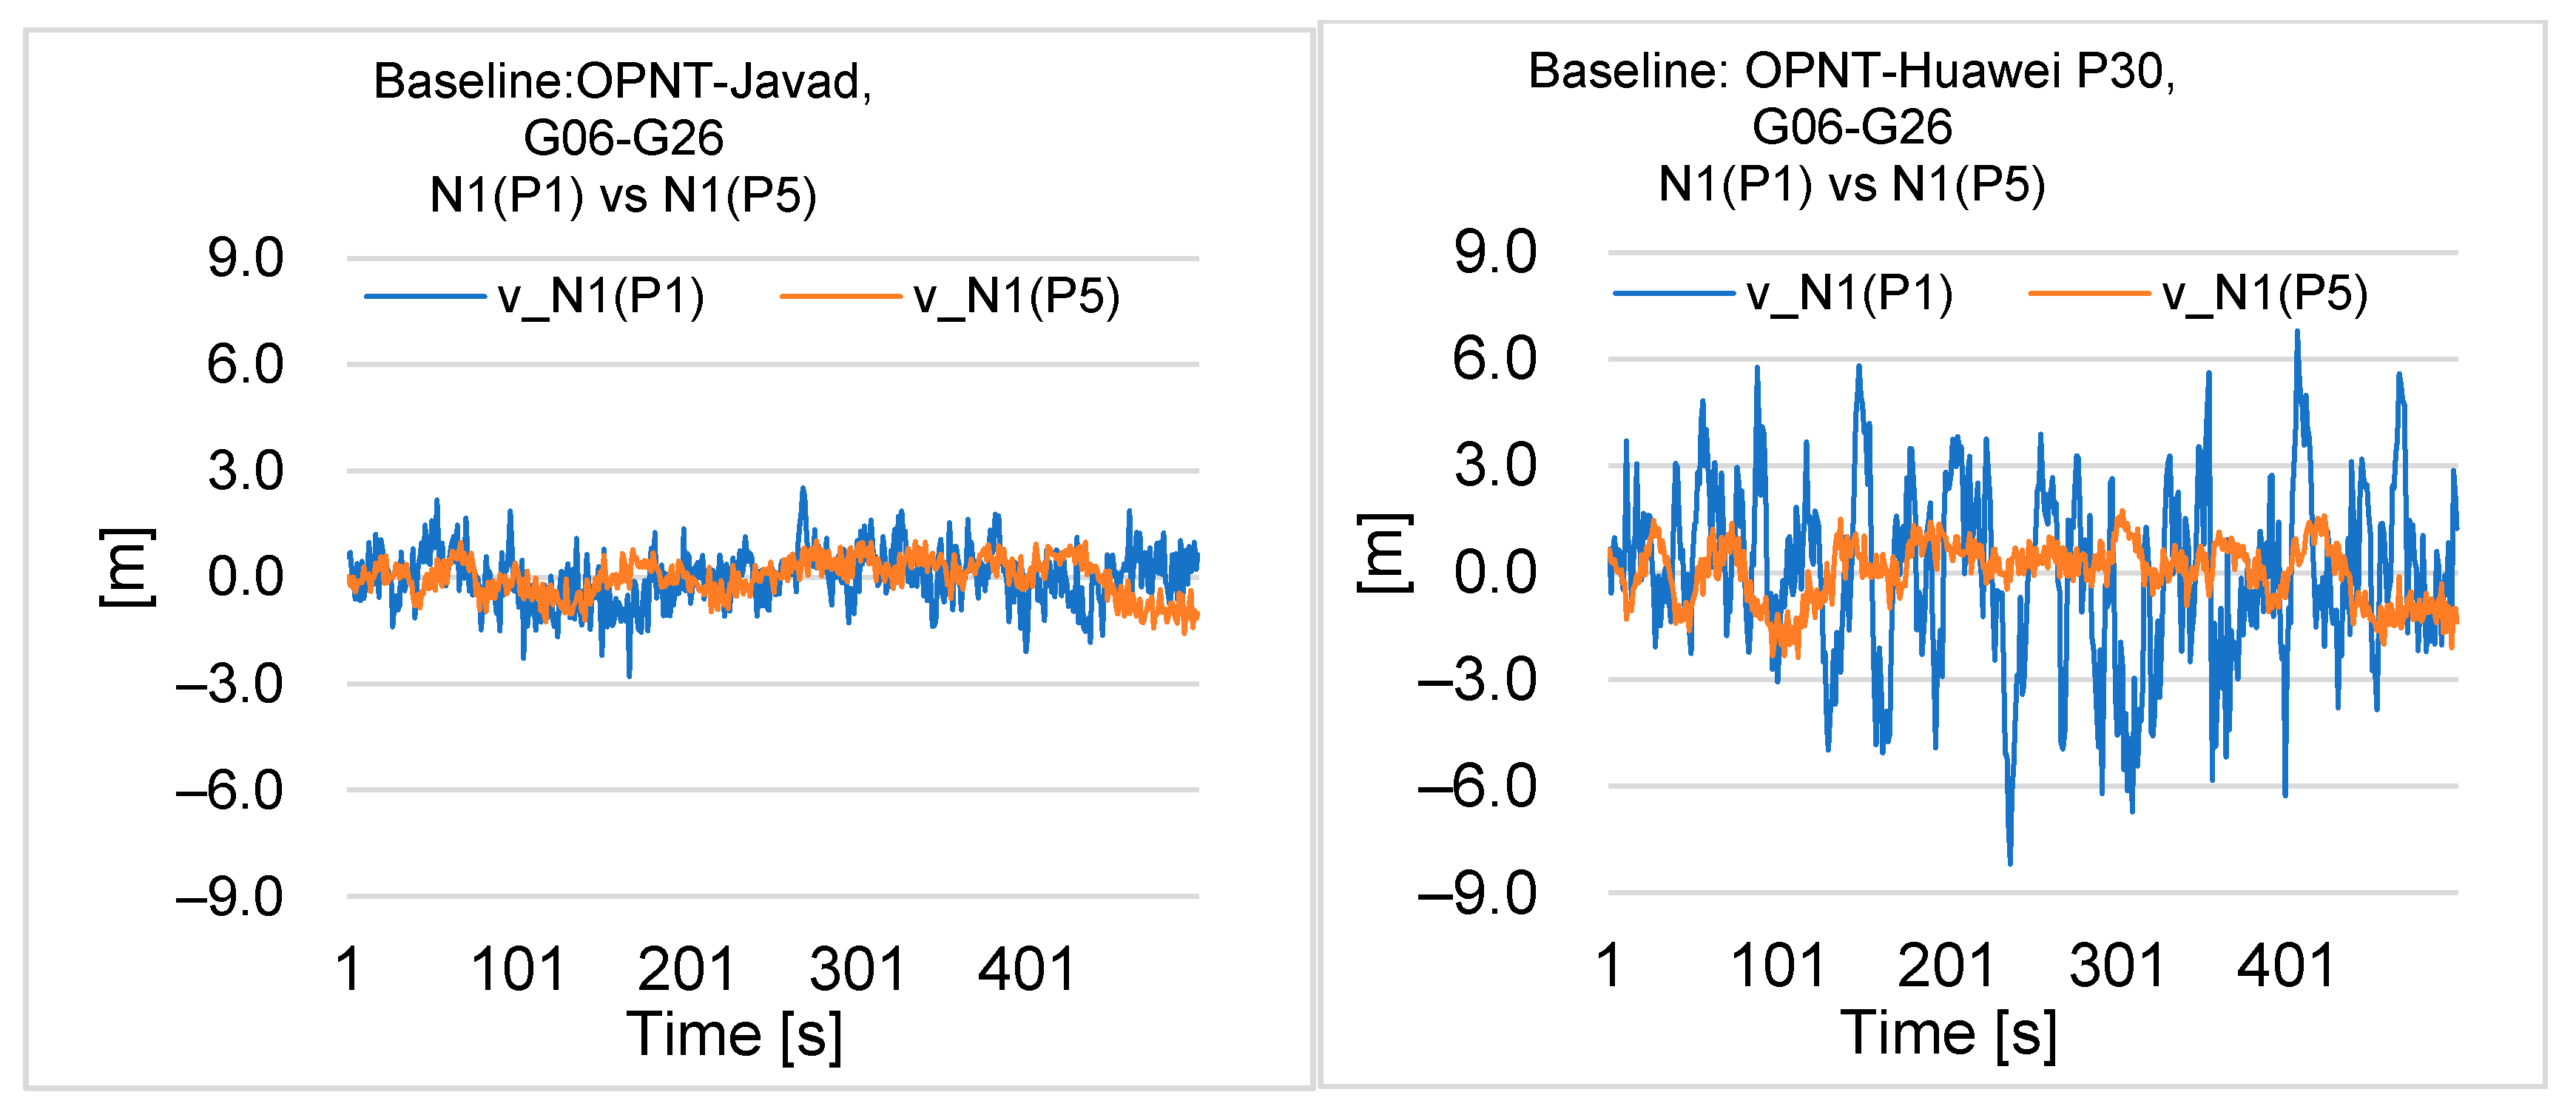
Figure 23.
Time series of double-difference residuals for float N1(P1) and N1(P5) solutions from single measurement epochs based on the use of only one pair of G06–G26 satellites (500 epochs).
Figure 23.
Time series of double-difference residuals for float N1(P1) and N1(P5) solutions from single measurement epochs based on the use of only one pair of G06–G26 satellites (500 epochs).
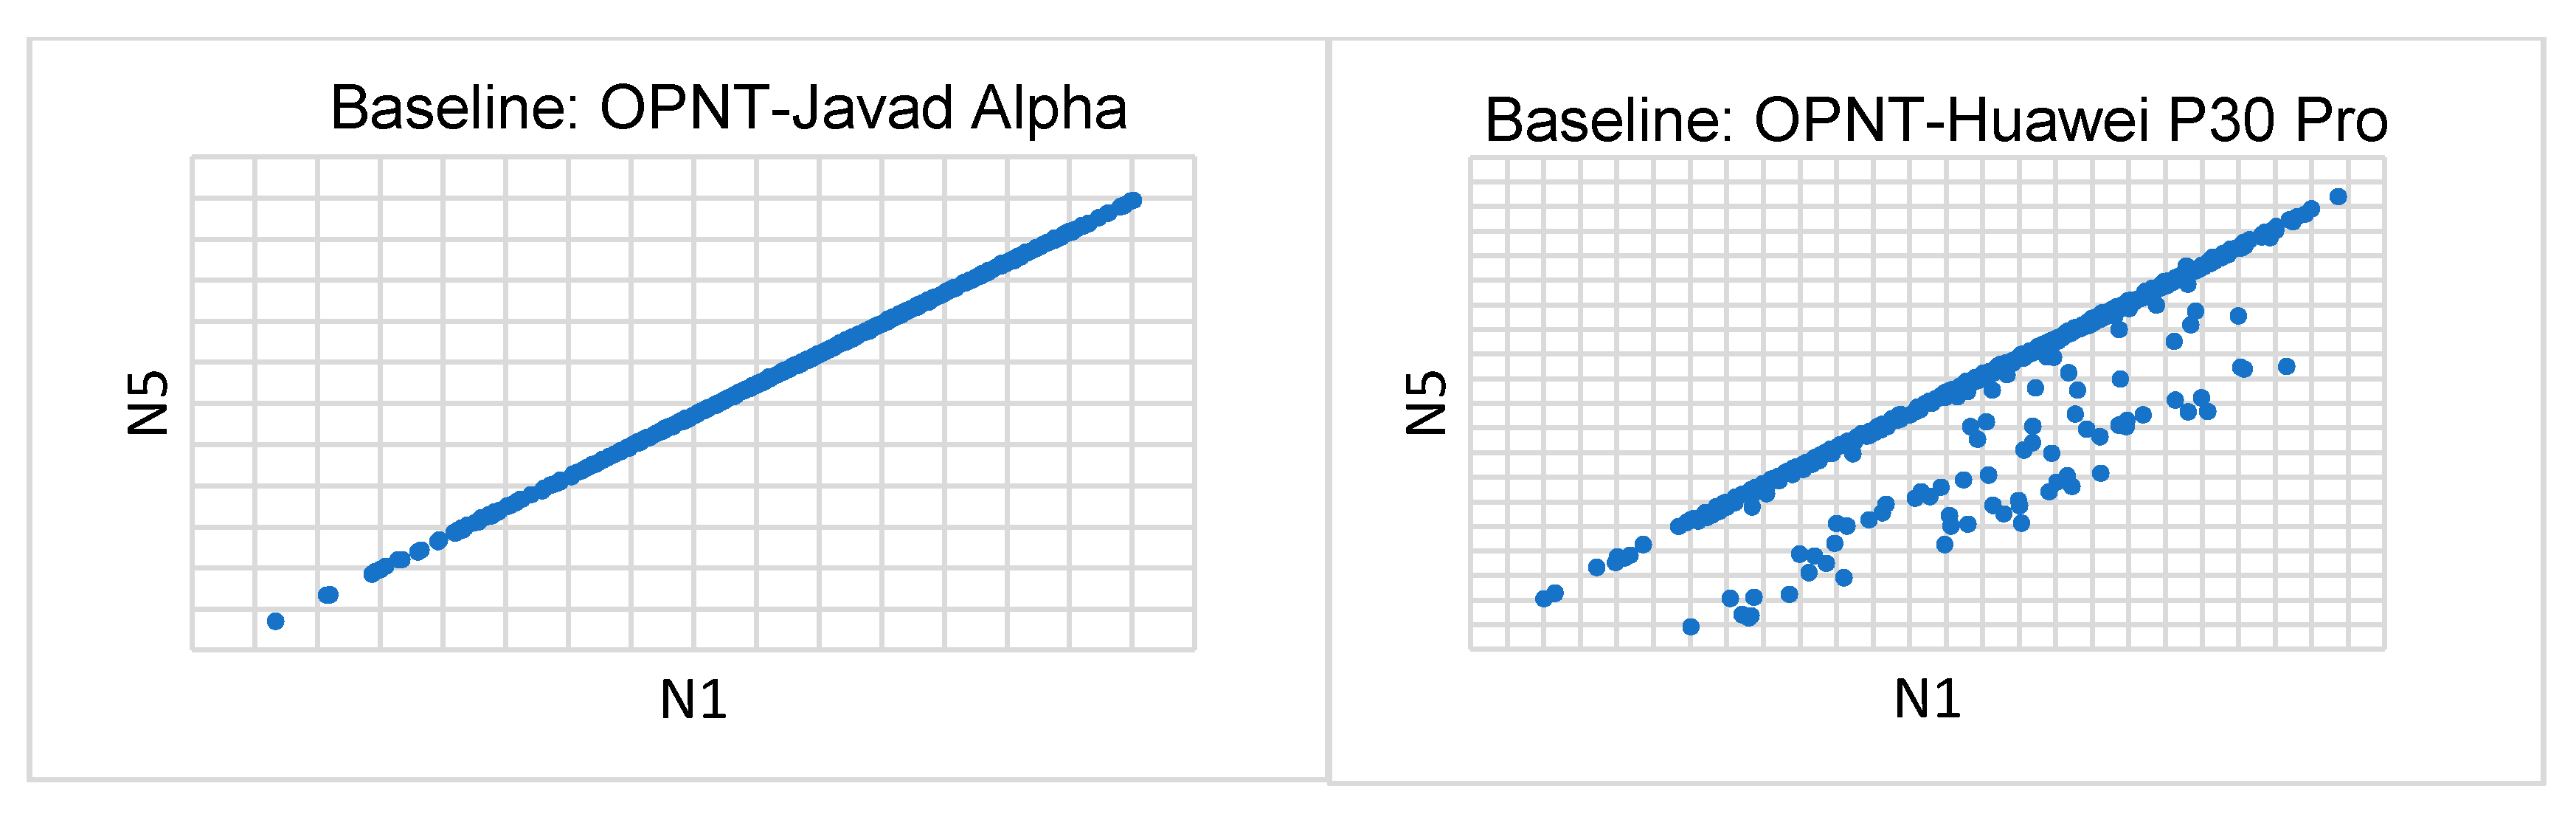
Figure 24.
Time series of correlated double-difference float single epoch N1–N5 solutions for a pair of G06–G26 satellites (500 epochs).
Figure 24.
Time series of correlated double-difference float single epoch N1–N5 solutions for a pair of G06–G26 satellites (500 epochs).
Table 1.
10 min sub-session positioning results summary, baseline OPNT–P30Pro (4 km).
Table 1.
10 min sub-session positioning results summary, baseline OPNT–P30Pro (4 km).
| Minutes | dx (m) | dy (m) | dh (m) |
|---|
| 0–10 | 0.006 | 0.026 | −0.025 |
| 10–20 | −0.004 | 0.024 | −0.022 |
| 20–30 | −0.534 | 0.038 | 0.094 |
| 30–40 | 0.205 | −0.348 | −0.006 |
| 40–50 | 0.020 | 0.005 | −0.022 |
| 50–60 | −0.457 | −0.290 | 0.466 |
| min | −0.534 | −0.348 | −0.025 |
| max | 0.205 | 0.038 | 0.466 |
| SD | 0.296 | 0.178 | 0.194 |
Table 2.
15 min sub-session positioning results summary, baseline OPNT–P30Pro (4 km).
Table 2.
15 min sub-session positioning results summary, baseline OPNT–P30Pro (4 km).
| Minutes | dx (m) | dy (m) | dh (m) |
|---|
| 0–15 | 0.005 | 0.025 | −0.027 |
| 15–30 | 0.055 | 0.078 | 0.413 |
| 30–45 | 0.002 | 0.018 | −0.018 |
| 45–60 | 0.019 | 0.002 | −0.016 |
| min | 0.002 | 0.002 | −0.027 |
| max | 0.055 | 0.078 | 0.413 |
| SD | 0.025 | 0.033 | 0.217 |
Table 3.
20 min sub-session positioning results summary, baseline OPNT–P30Pro (4 km).
Table 3.
20 min sub-session positioning results summary, baseline OPNT–P30Pro (4 km).
| Minutes | dx (m) | dy (m) | dh (m) |
|---|
| 0–20 | 0.000 | 0.024 | −0.028 |
| 20–40 | −0.007 | 0.019 | −0.006 |
| 40–60 | 0.013 | 0.009 | −0.021 |
| min | −0.007 | 0.009 | −0.028 |
| max | 0.013 | 0.024 | −0.006 |
| SD | 0.010 | 0.008 | 0.011 |
Table 4.
30 min sub-session positioning results summary, baseline OPNT–P30Pro (4 km).
Table 4.
30 min sub-session positioning results summary, baseline OPNT–P30Pro (4 km).
| Minutes | dx (m) | dy (m) | dh (m) |
|---|
| 0–30 | −0.001 | 0.023 | −0.015 |
| 30–60 | 0.013 | 0.003 | −0.014 |
| min | −0.001 | 0.003 | −0.015 |
| max | 0.013 | 0.023 | −0.014 |
| SD | 0.010 | 0.014 | 0.001 |
Table 5.
60 min session positioning results summary, baseline OPNT–P30Pro (4 km).
Table 5.
60 min session positioning results summary, baseline OPNT–P30Pro (4 km).
| Minutes | dx (m) | dy (m) | dh (m) |
|---|
| 0–60 | 0.0007 | 0.017 | −0.012 |
Table 6.
10 min sub-session positioning results summary, baseline OPNT–P30Pro (4 km).
Table 6.
10 min sub-session positioning results summary, baseline OPNT–P30Pro (4 km).
| Minutes | dx (m) | dy (m) | dh (m) |
|---|
| 0–10 | −0.504 | −0.032 | 0.591 |
| 10–20 | 0.002 | −0.022 | −0.003 |
| 20–30 | 0.001 | −0.009 | −0.022 |
| 30–40 | −0.369 | 0.108 | 0.074 |
| 40–50 | −0.507 | 0.107 | 0.767 |
| 50–60 | −0.097 | −0.209 | 0.208 |
| min | −0.507 | −0.209 | −0.022 |
| max | 0.002 | 0.108 | 0.767 |
| SD | 0.243 | 0.116 | 0.332 |
Table 7.
15 min session positioning results summary, baseline OPNT–P30Pro (4 km).
Table 7.
15 min session positioning results summary, baseline OPNT–P30Pro (4 km).
| Minutes | dx (m) | dy (m) | dh (m) |
|---|
| 0–15 | −0.281 | 0.057 | 0.545 |
| 15–30 | 0.002 | −0.010 | −0.021 |
| 30–45 | 0.320 | 0.102 | 0.068 |
| 45–60 | 0.026 | −0.010 | −0.050 |
| min | −0.281 | −0.010 | −0.050 |
| max | 0.320 | 0.102 | 0.545 |
| SD | 0.246 | 0.055 | 0.278 |
Table 8.
20 min sub-session positioning results summary, baseline OPNT–P30Pro (4 km).
Table 8.
20 min sub-session positioning results summary, baseline OPNT–P30Pro (4 km).
| Minutes | dx (m) | dy (m) | dh (m) |
|---|
| 0–20 | 0.227 | −0.207 | −0.421 |
| 20–40 | 0.006 | −0.008 | −0.024 |
| 40–60 | 0.011 | −0.003 | −0.066 |
| min | 0.006 | −0.207 | −0.421 |
| max | 0.227 | −0.003 | −0.024 |
| SD | 0.126 | 0.116 | 0.218 |
Table 9.
30 min sub-session positioning results summary, baseline OPNT–P30Pro (4 km).
Table 9.
30 min sub-session positioning results summary, baseline OPNT–P30Pro (4 km).
| Minutes | dx (m) | dy (m) | dh (m) |
|---|
| 0–30 | −0.002 | −0.016 | −0.013 |
| 30–60 | −0.010 | 0.112 | 0.103 |
| min | −0.010 | −0.016 | −0.013 |
| max | −0.002 | 0.112 | 0.103 |
| SD | 0.006 | 0.091 | 0.082 |
Table 10.
60 min session positioning results summary, baseline OPNT–P30Pro (4 km).
Table 10.
60 min session positioning results summary, baseline OPNT–P30Pro (4 km).
| Minutes | dx (m) | dy (m) | dh (m) |
|---|
| 0–60 | −0.002 | −0.014 | −0.028 |
Table 11.
10 min sub-session positioning results summary, baseline OPNT–P30Pro (4 km).
Table 11.
10 min sub-session positioning results summary, baseline OPNT–P30Pro (4 km).
| Minutes | dx (m) | dy (m) | dh (m) |
|---|
| 0–10 | 0.139 | −0.310 | −0.291 |
| 10–20 | −0.068 | −0.384 | −0.048 |
| 20–30 | 0.268 | −0.713 | −0.287 |
| 30–40 | −0.121 | −0.237 | −0.057 |
| 40–50 | −0.066 | −0.285 | −0.012 |
| 50–60 | −0.071 | −0.128 | 0.082 |
| min | −0.121 | −0.713 | −0.291 |
| max | 0.268 | −0.128 | 0.082 |
| SD | 0.154 | 0.200 | 0.153 |
Table 12.
15 min sub-session positioning results summary, baseline OPNT–P30Pro (4 km).
Table 12.
15 min sub-session positioning results summary, baseline OPNT–P30Pro (4 km).
| Minutes | dx (m) | dy (m) | dh (m) |
|---|
| 0–15 | 0.018 | 0.011 | 0.021 |
| 15–30 | 0.119 | −0.624 | −0.322 |
| 30–45 | 0.015 | −0.286 | −0.161 |
| 45–60 | −0.011 | −0.024 | −0.028 |
| min | −0.011 | −0.624 | −0.322 |
| max | 0.119 | 0.011 | 0.021 |
| SD | 0.057 | 0.294 | 0.154 |
Table 13.
20 min sub-session positioning results summary, baseline OPNT–P30Pro (4 km).
Table 13.
20 min sub-session positioning results summary, baseline OPNT–P30Pro (4 km).
| Minutes | dx (m) | dy (m) | dh (m) |
|---|
| 0–20 | 0.007 | 0.015 | 0.007 |
| 20–40 | −0.036 | −0.357 | −0.146 |
| 40–60 | −0.042 | −0.120 | −0.040 |
| min | −0.042 | −0.357 | −0.146 |
| max | 0.007 | 0.015 | 0.007 |
| SD | 0.027 | 0.188 | 0.078 |
Table 14.
30 min sub-session positioning results summary, baseline OPNT–P30Pro (4 km).
Table 14.
30 min sub-session positioning results summary, baseline OPNT–P30Pro (4 km).
| Minutes | dx (m) | dy (m) | dh (m) |
|---|
| 0–30 | 0.003 | 0.016 | −0.001 |
| 30–60 | −0.011 | 0.009 | −0.042 |
| min | −0.011 | 0.009 | −0.042 |
| max | 0.003 | 0.016 | −0.001 |
| SD | 0.010 | 0.005 | 0.029 |
Table 15.
60 min session positioning results summary, baseline OPNT–P30Pro (4 km).
Table 15.
60 min session positioning results summary, baseline OPNT–P30Pro (4 km).
| Minutes | dx (m) | dy (m) | dh (m) |
|---|
| 0–60 | −0.001 | 0.016 | −0.008 |


