Article

Secondary Breakup Characteristics and Mechanism of Single Electrified Al/N-Decane Nanofluid Fuel Droplet in Electrostatic Field

1
College of Materials and Environmental Engineering, Hangzhou Dianzi University, Hangzhou 310018, China
2
Department of Physics, Institute of Energy, Hangzhou Dianzi University, Hangzhou 310018, China
*
Authors to whom correspondence should be addressed.
Appl. Sci. 2020, 10(15), 5332; https://doi.org/10.3390/app10155332
Submission received: 21 June 2020 / Revised: 24 July 2020 / Accepted: 29 July 2020 / Published: 1 August 2020
(This article belongs to the Special Issue Nanofluids: The Frontier Trends and Application)

Abstract

:
The combustion characteristics of nanofluid fuels have been widely investigated, but rare studies on the atomization were reported. Atomization is an imperative and crucial step to improve the combustion performance of nanofluid fuels, and the secondary breakup of droplets is an important segment for atomization to produce uniform fine droplets and distribute nanoparticles in each droplet. This paper firstly presents the secondary breakup characteristics of single electrified Al/n-decane nanofluid fuel droplets and revealed the mechanism of the secondary breakup. The results demonstrated that fine droplets could be produced in the electrostatic field and Al nanoparticles were distributed in each droplet. Before the breakup, the single electrified droplets experienced surface charge transportation, deformation, and Taylor cone formation. A gradient of the electric field deformed the droplet to produce the Taylor cone. As the Taylor cones were stabilized, the fluid was extruded from the tips of stable Taylor cones to produce jet filament parallel to the electric field direction and correspondingly broke up into fine sub droplets. At the nanoparticle concentration range of 1.0~10 mg/mL, the minimum average diameter of breakup sub droplets could achieve ~55.4 μm at 6.0 mg/mL. The Al nanoparticle concentration had a significant effect on the breakup performance by influencing the physical properties and charging. The order of the Charge-to-Mass ratio magnitude was 10−7~10−5 C/kg. Furthermore, the secondary breakup mechanism of single electrified nanofluid fuel droplets in the uniform electrostatic field was revealed by analyzing the droplet surface charge, deformation, Taylor cone formation, and nanoparticle concentration effect.

1. Introduction

Nanofluid fuels are a novel type of supplementary fuel family, which were defined as colloidal suspensions of high energetic nanoparticles in liquid fuels [1]. Their combustion characteristics have been widely investigated, indicating high energy density [2,3], ignition probability [4], combustion efficiency [5,6], and low pollutant emissions, etc. [7,8].
Atomization is an imperative and crucial step to improve the combustion performance of nanofluid fuels. The electrostatic atomization is a liquid fuel atomization technique relying solely on electrical charging and has been widely investigated [9,10]. It is of ever-increasing importance in an extensive range of industrial and scientific processes as it is in principle suitable to a variety of technological applications [11,12]. The secondary breakup of droplets is an important segment for atomization. The importance of secondary breakup of nanofluid fuel droplets lies in distributing nanomaterials in each droplet to make the subsequent combustion step more efficient, and possibly reducing the effect and probability of agglomeration on compaction and sintering. This triggers our motivation to investigate the characteristics of the secondary breakup of nanofluid fuel droplets and deeply recognize the process and mechanism.
Electrostatic atomization of pure liquid fuel has been widely investigated, and the mechanism shows that the electrification and the physical properties are crucial to produce excellent breakup performance. As the electric field force is greater than the surface tension, the pure droplet will coulombically break up [13,14]. For binary or trinary mixtures adding necessary additives, due to the changes of physical properties like the surface tension, viscosity, and density, the atomization performance is significantly influenced. Ejim et al. [15] reported that the viscosity has a contribution of ~90% to lead to the change in Sauter mean diameter (SMD), whereas the density causes only less than 2% change. For nanofluid fuels, their physical properties are significantly different from host liquid fuel [16,17]. Herein, the key point is that the change in the physical properties of nanofluid fuels containing different nanoparticle concentrations can potentially alter the atomization characteristics. Besides physical properties, electric field conditions are crucial to influence atomization performance.
The electrostatic atomization performance of nanofluid fuel mainly depends on: (1) Nanoparticles; nanoparticles can change the physical properties of the original base fuel, including thermal conductivity, heat transfer coefficient [18,19], density, viscosity, conductivity, and surface tension, etc. [16,17]. Our previous work demonstrated that Al nanoparticle concentration had a significant effect on the physical properties of Al/n-decane nanofluid fuel [20]. Such changes in the physical properties will result in a corresponding change in the gravity, surface tension, viscous force, and electric field force to influence the electrostatic breakup performance of nanofluid fuel. (2) Charging; in the electrostatic field, nanofluid fuel droplets will be subjected to the combined action of gravity, surface tension, viscous forces, and electric field force. When the electrical force overcomes the surface tension, the droplet will be disintegrated [21,22]. Electrical force can exist only if the charge is present, and the value of electrical force is proportional to the charge in a uniform electrostatic field. The charge of droplets will affect the breakup mode and the size of breakup droplets. The literature has shown the key factors influencing the secondary breakup characteristics of pure liquid fuel, including the surface tension, charge-to-mass ratio, droplet size, but the impact of adding nanoparticles on the secondary breakup of the host liquid has been scarcely reported. To reveal the secondary breakup mechanism and to obtain uniformly distributive fine droplets, this paper proposes to carry out the study on the secondary breakup of single electrified Al/n-decane nanofluid fuel droplet in the electrostatic field.
The objectives of the present work will be: (1) to study the charging and deformation as well as the Taylor cone formation of single Al/n-decane nanofluid fuel droplet in the electrostatic field; (2) to obtain the Charge-to-Mass ratio of single Al/n-decane nanofluid fuel droplet in an electrostatic field and then to analyze the charging mechanism, and (3) to evaluate the concentration effect of Al nanoparticle on the secondary breakup performance by characterizing the formation of Taylor cone and the diameter of breakup sub droplets, and to understand in-depth electrostatic breakup mechanism by analyzing the characteristic parameters with nanoparticle concentration effect and electrification effect.

2. Materials and Methods

2.1. Preparation of Al/n-Decane Nanofluid Fuel

Al nanoparticles (Dk Nanotechnology Co., Ltd., Beijing, China.) were synthesized by the plasma vapor deposition method. The nanoparticle surface was covered with a thin layer of Al2O3 (3–5 nm) by passivated treatment to prevent Al nanoparticle from being oxidized. The median particle size of Al nanoparticles was ~50 nm determined by a laser particle size analyzer. The n-decane, purchased from Macklin Biochemical Co., Ltd., Shanghai, China, was selected as the base fluid. Its density, surface tension, viscosity, and relative permittivity are 0.735 g/cm3 (20 °C), 23.8 × 10⁻³ N/m (25 °C), 0.92 × 10⁻³ Pa·s (20 °C) and 2.0, respectively. Nonionic sorbitan monooleate (SP-80, Macklin Biochemical Co., Ltd., Shanghai, China) was selected as a surfactant to improve the dispersion and stability performances of Al nanoparticle in n-decane. The density and viscosity of SP-80 are 0.994 g/cm3 (20 °C) and 1.0~2.0 Pa·s (20 °C), respectively.
The two-step method was used to prepare the Al/n-decane nanofluid fuels: (1) SP-80 was firstly added into a certain amount of base fluid n-decane according to the volume ratio of 1:99 (SP-80:n-decane), and the mixture of n-decane and SP-80 was stirred to make them compatible. Then a certain amount of Al nanoparticles was weighed and added into the mixture to produce the Al/n-decane nanofluid fuel suspensions with the Al nanoparticle concentration ranging from 1.0~10.0 mg/mL with an interval of 1.0 mg/mL. (2) These suspensions were exposed to an ultrasound field for 30 mins to reduce the coagulation of Al nanoparticles in n-decane. The stability observation experiments revealed that the nanofluid fuels as prepared could keep stable for 2 h, which was long enough to conduct the secondary breakup of each Al/n-decane nanofluid fuel suspension in the electric field (30 mins). The properties of Al/n-decane nanofluid fuels as prepared have been measured accurately and can be found in our previous work [20].

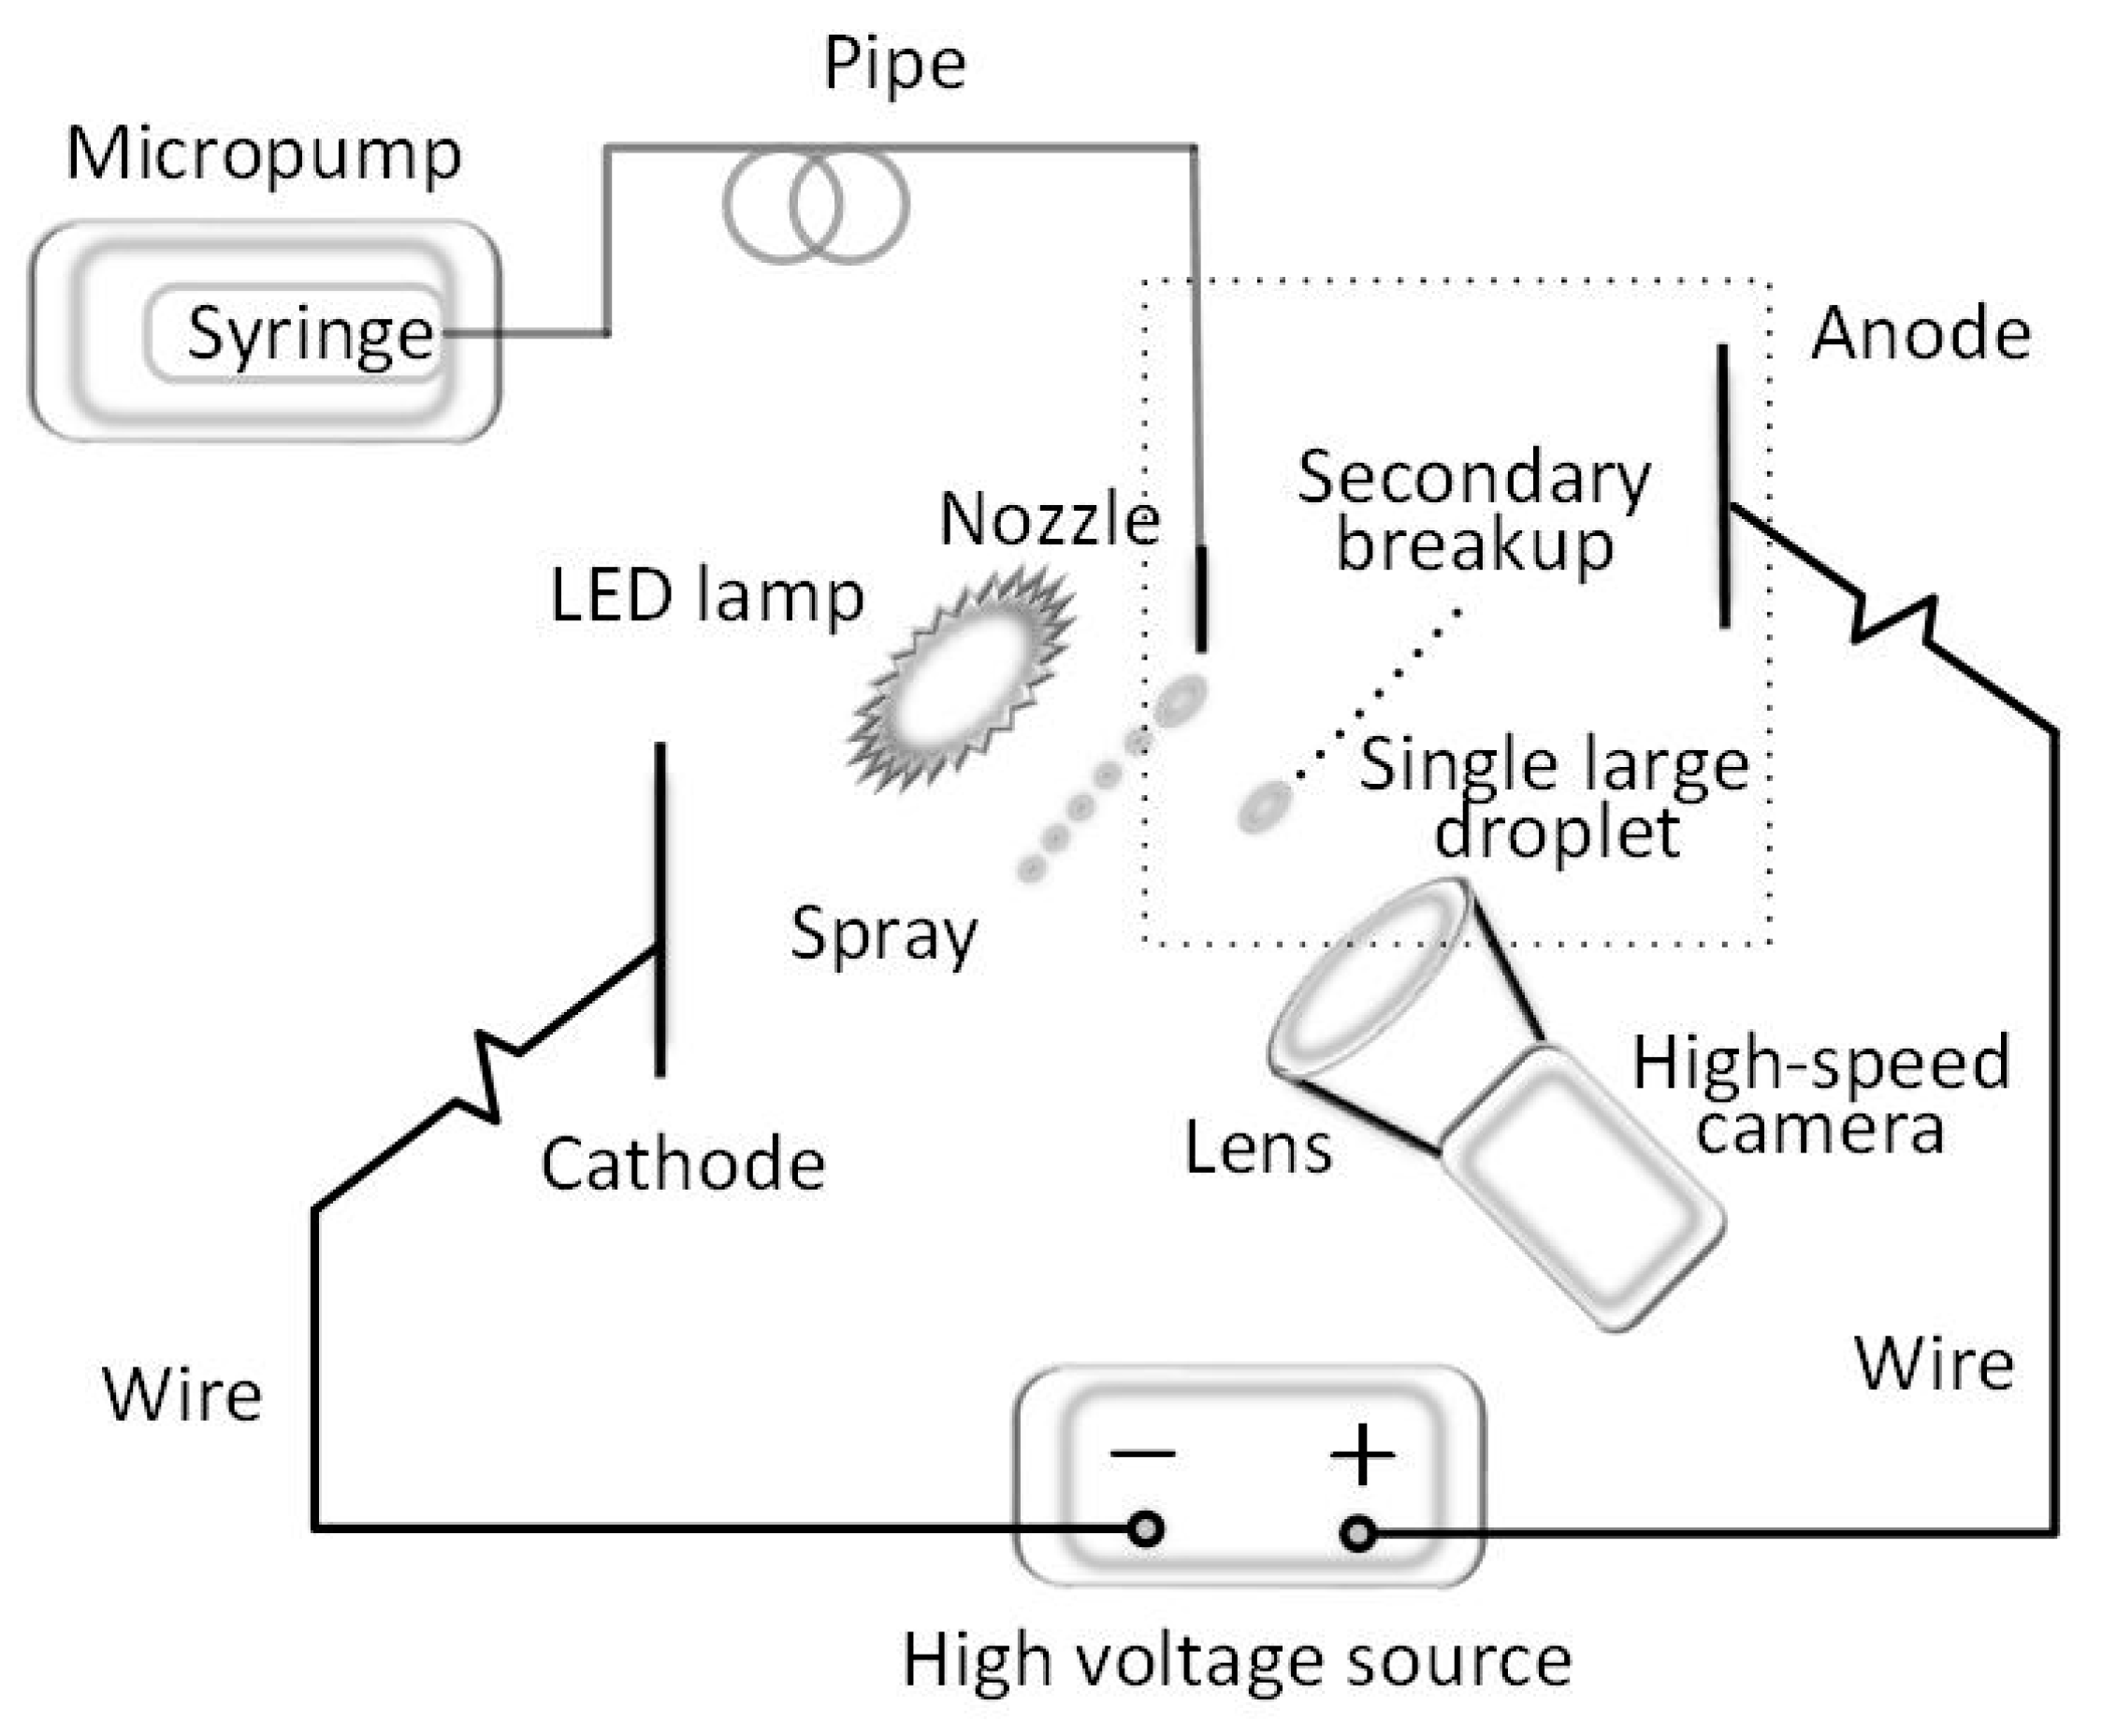
2.2. Experimental Setup

Figure 1 shows the schematic of an experimental setup for producing a single electrified droplet of Al/n-decane nanofluid fuel and characterizing the performance of the electrostatic secondary breakup. The nanofluid fuel was pumped into a nozzle to produce a spray. The syringe micropump can control the volume flow with an accuracy of ±2%. The inner and outer radii of the nozzle are di = 1.0 mm and do = 1.3 mm, respectively. The nozzle was placed into a uniform and stable transverse electric field provided by a high voltage source connected with two parallel plate electrodes. The electric field intensity can be adjusted by tuning the electric voltage or by changing the spacing of the two plate electrodes. In this work, the voltage was set to 28 kV, the current was ~5 μA, the spacing of two electrodes was 4.5 cm, thus the power and electric field intensity can be calculated as 0.14 W and 6.22 × 10⁵ V/m, respectively.
The high-speed camera (i-SPEED 720, iX Cameras, UK) with a lens (AT-X M100 AF PRO, Tokina, Japan) was used to record the secondary breakup of the nanofluid fuel droplets in an electrostatic field. The recording frame was set to 30,000 fps. An LED lamp was illuminated to provide a bright view field for the clear imaging of high-speed cameras. All the pictures were treated by the self-programming digit imaging treatment method in our previous work [23].

3. Results and Discussion

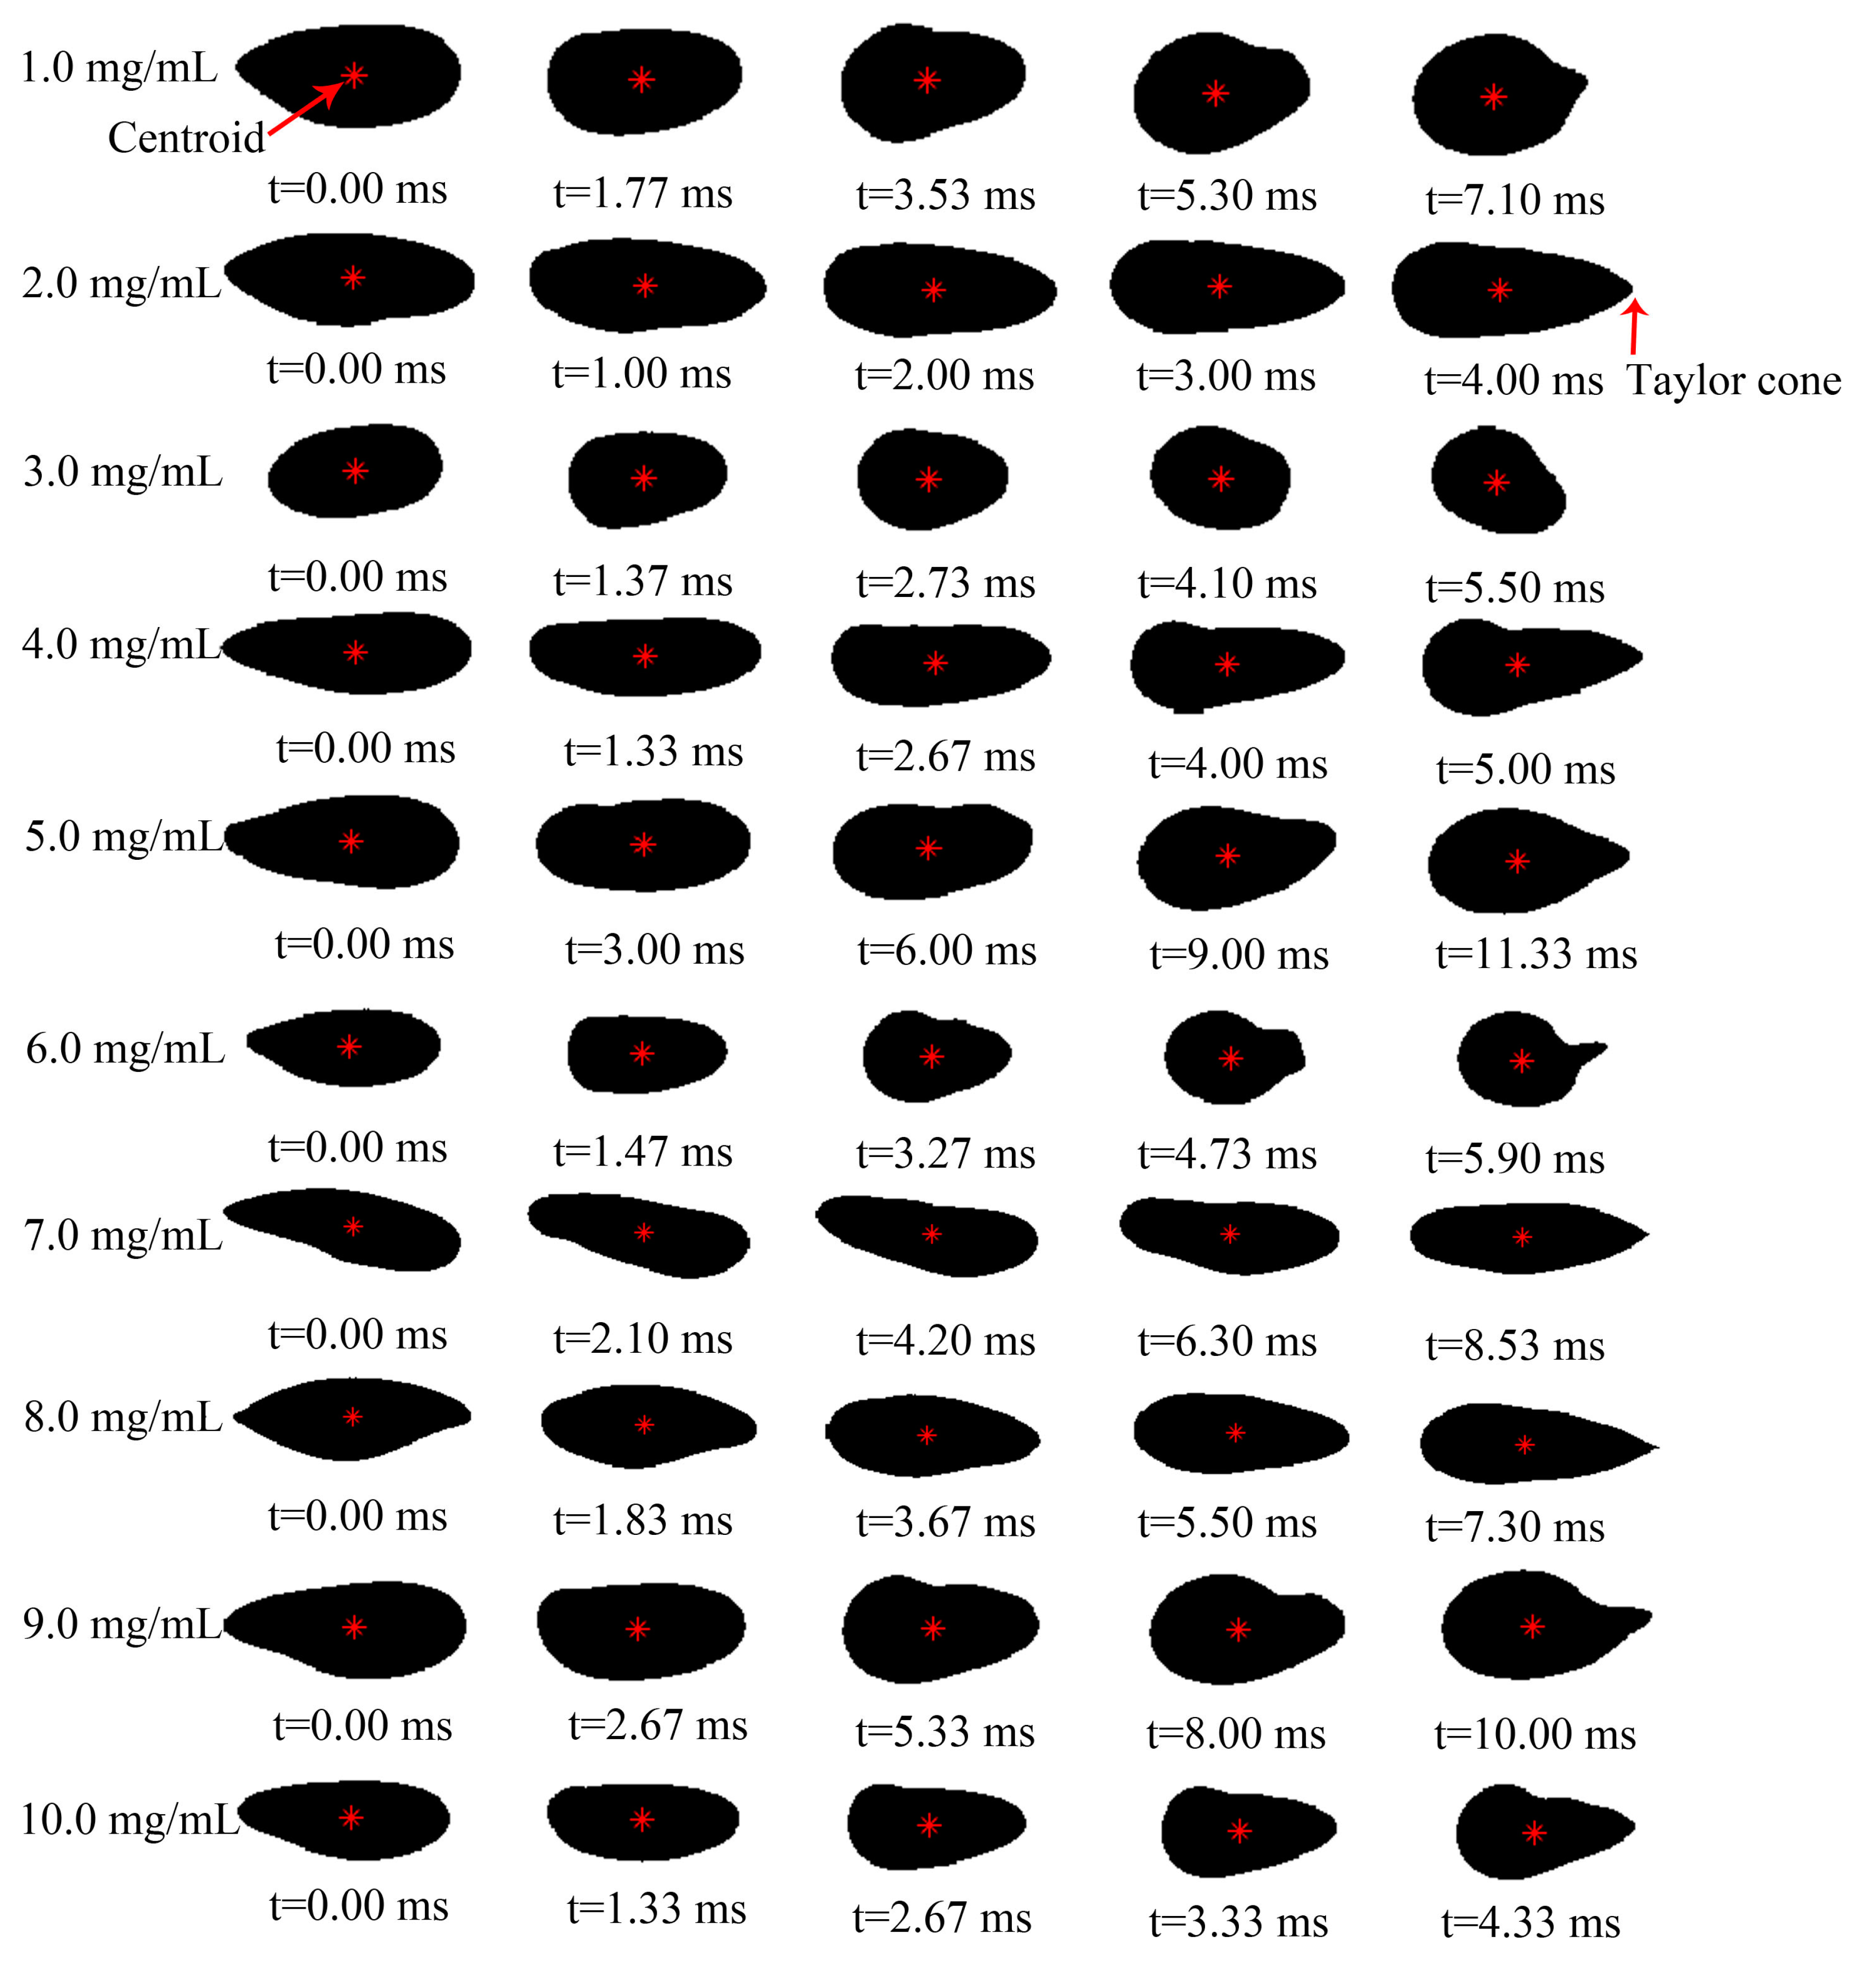
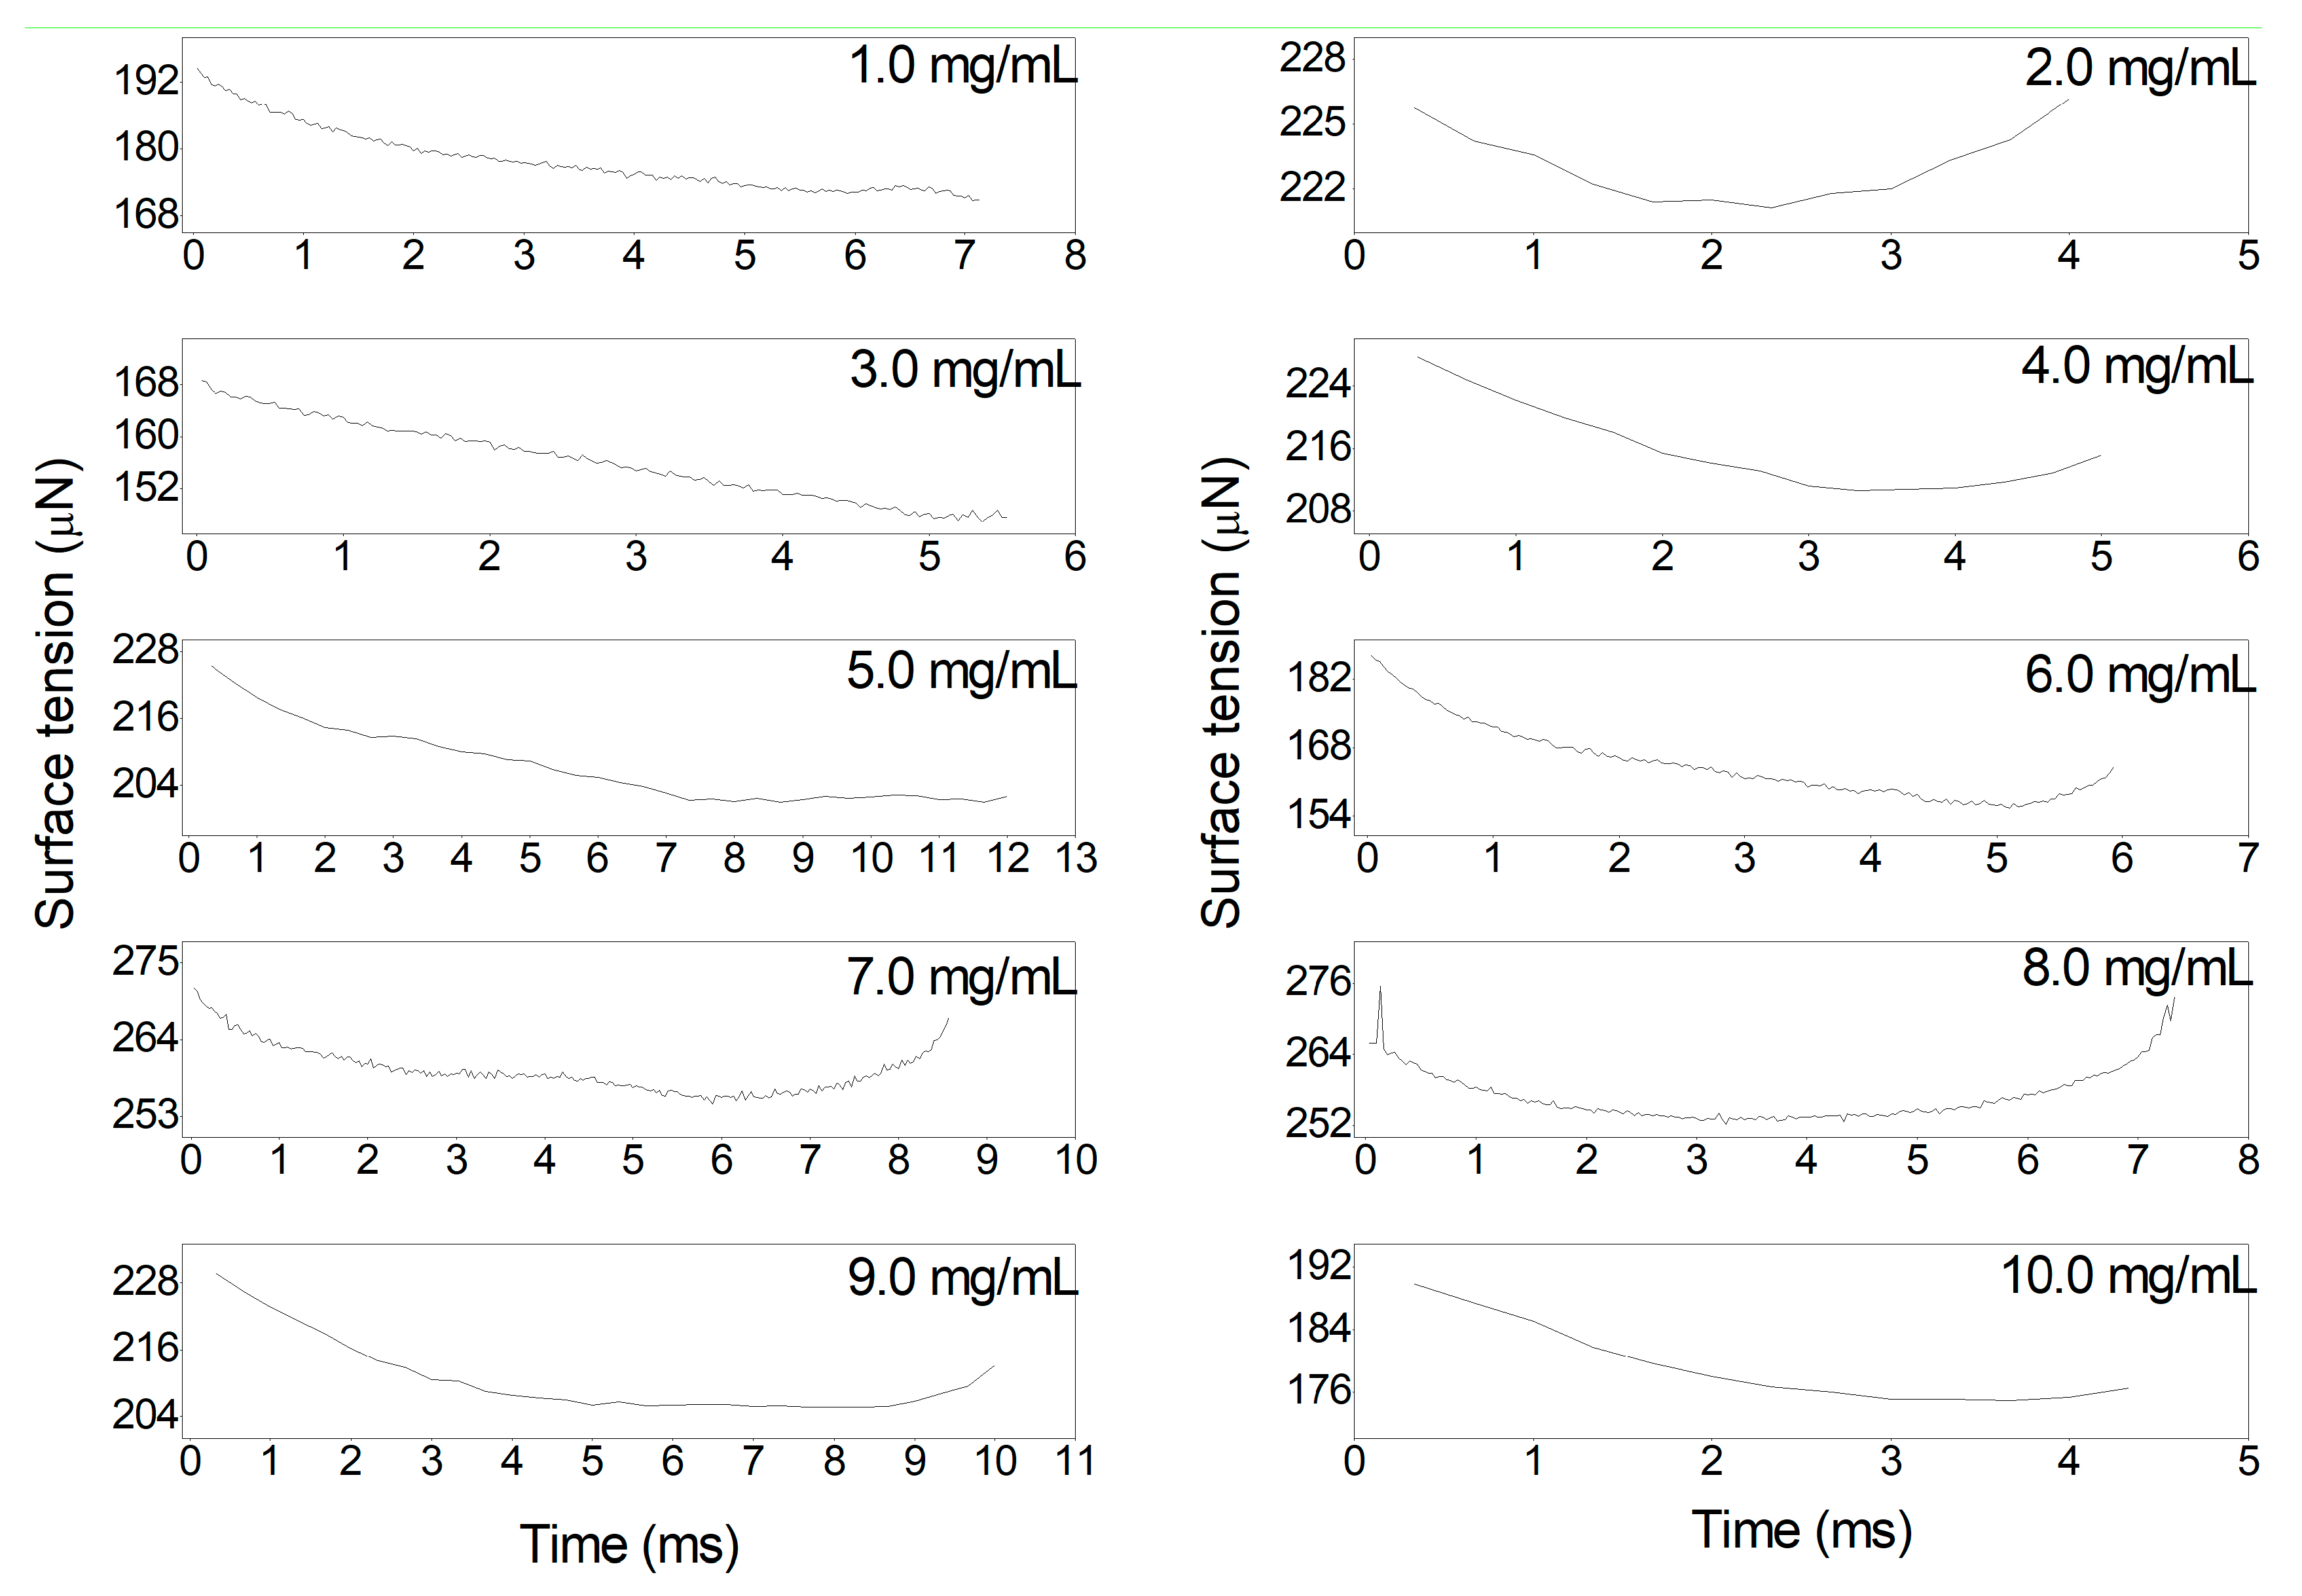
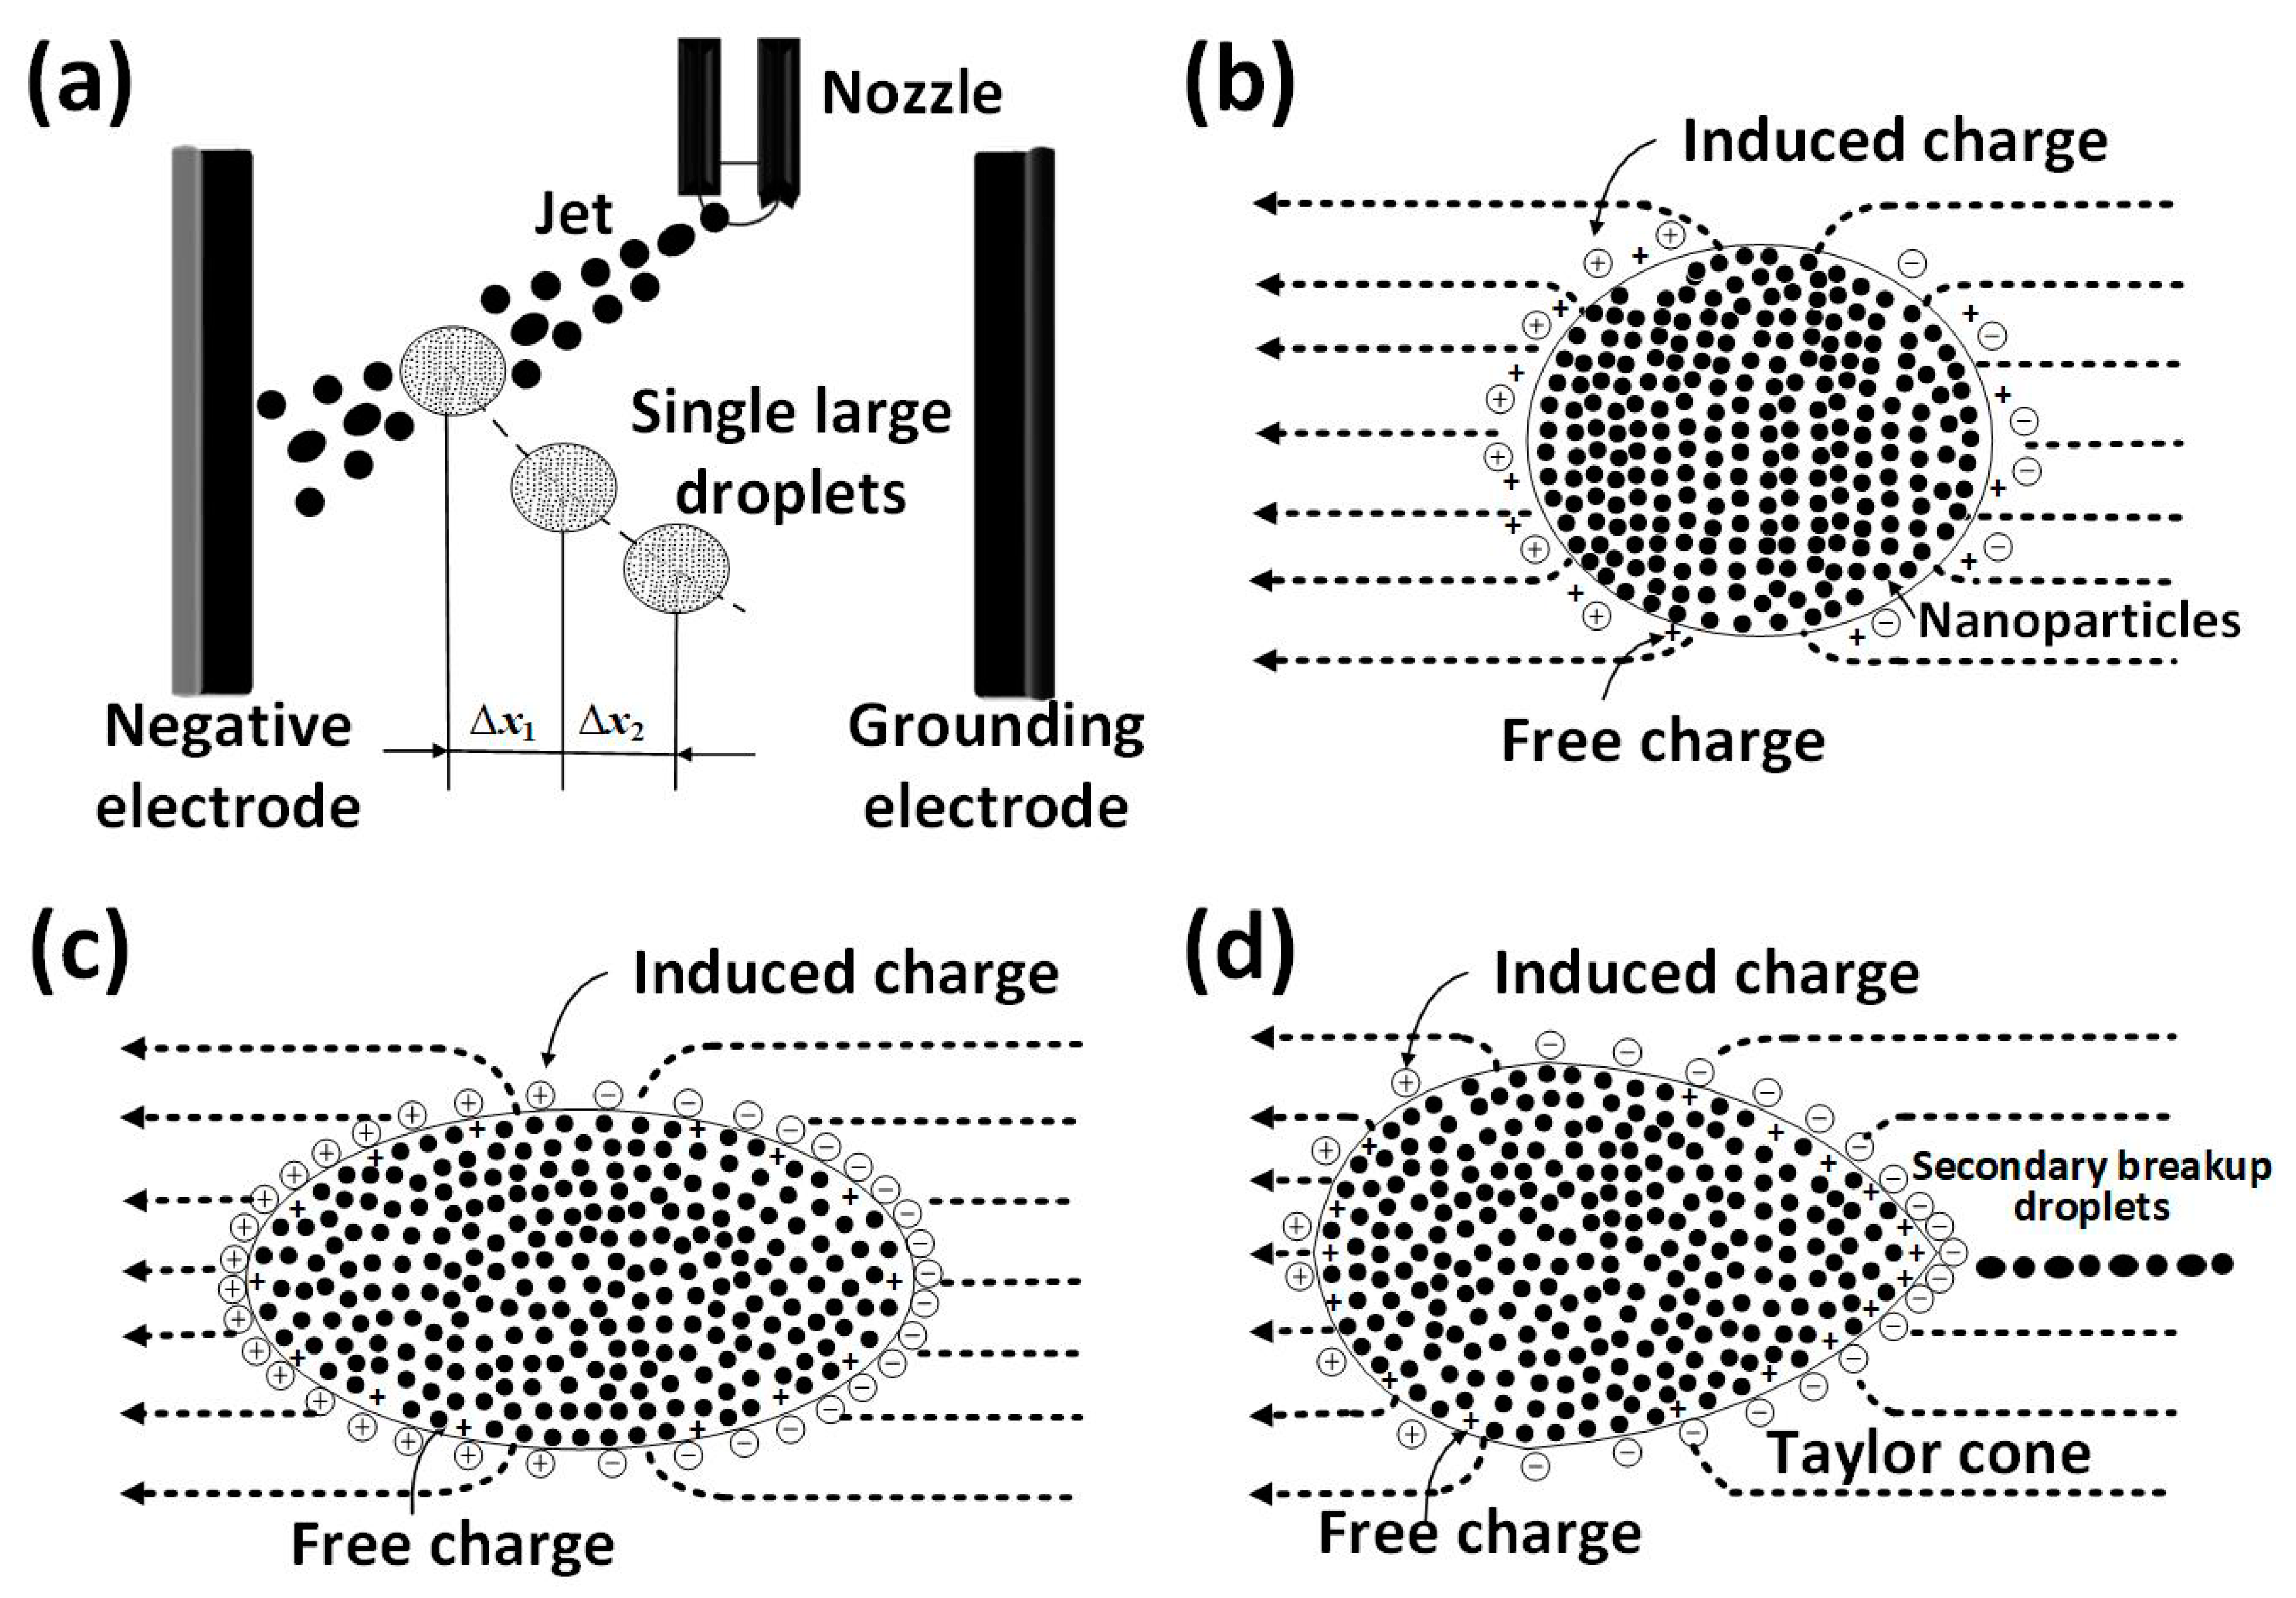
3.1. Taylor Cone Formation of Single Electrified Al/N-Decane Nanofluid Fuel Droplets

A spray was first produced by pumping the nanofluid fuel into the nozzle in a uniform transverse electric field. During spraying, some of the single large electrified droplets possibly took secondary breakup. Before the breakup, these electrified droplets deformed to resist its breakup behavior, but eventually, it was obliged to produce a Taylor cone and take possibly secondary breakup. Figure 2 illustrates the Taylor cone formation of representative single electrified Al/n-decane nanofluid fuel droplets at different Al nanoparticle concentrations. At each concentration, the single large droplets reproductively deformed and even break up. As the single large droplets separated from the adjacent fine droplets, the moments were considered as t = 0.00 ms. The droplets then moved solely in the electric field. During falling, the large droplets continuously electrified to reach the maximum Charge-to-Mass ratio and simultaneously transformed. At any nanoparticle concentration, the transformations were similar. The tip surfaces at the left of the droplets gradually shaped to spherical surfaces, and the droplets became the ellipsoids. Finally, the surfaces on the right were gradually squeezed to the cones. As the cones at the right side, called the Taylor cones, met the requirement of coulomb fragmentation, the droplets would produce cone-jetting. The transformations made the centroids of the droplets change, which were marked by the red stars.
During the Taylor cone formation, it can be inferred that the induced charges on the surface transferred and rearranged to make the droplet surface deform and produce the Taylor cone. The charges were mainly concentrated on the tip of Taylor cones at the right side. In the cases of present work, these induced charges on the right were negative, which were opposite to the polarity of the right electrode.
The deformations of single droplets primarily attribute to the contribution of electric field force, surface tension, and aerodynamic force acting on the droplet surface. The evolution of the surface tension of single droplets at different Al nanoparticle concentrations is shown in Figure 3. Herein, the surface tension was obtained by calculating the products of the surface tension coefficient and the perimeter of droplets. At different concentrations, the surface tension of droplets, two order polynomial formula to time, gradually decreased to the minimum and then increased slightly. It suggests that the breakup of droplets did not occur when their surface tension reached a minimum, whereas it occurred when the Taylor cones were destabilized. It is astonishingly found that the single electrified droplets at the concentrations of 1.0 mg/mL and 3.0 mg/mL did not be disintegrated, indicating that the breakup probability at low concentration (<4.0 mg/mL) is further smaller than that at high concentrations (>4.0 mg/mL).
The formation time and the angles of Taylor cones at different concentrations are listed in Table 1. It demonstrates that the average formation time of these Taylor cones ranged from 4.17 ms to 13.00 ms, and the average cone angles ranged from 35.1° to 88.4°. The formation time and the angle of Taylor cones depended on the Al nanoparticle concentration, but not monotonously.

3.2. Charge-to-Mass Ratio of Single Electrified Al/N-Decane Nanofluid Fuel Droplets

The dripping single droplets primarily suffered from the gravity force, the electric field force, and the drag force. The drag force is negligible, compared to the electric field force, thus in the horizontal direction following correlation can be obtained according to Newton’s Second Law:
q E = m a
where E is the electric field intensity; q and m represent the charge and mass of an individual droplet, respectively; a is the acceleration in the horizontal direction.
While
E = U L
where U and L represent the voltage and electrode spacing, respectively. Thus, the Charge-to-Mass ratio can be expressed as
q m = a L U
In this work, the X-direction displacement (sx) of droplet centroids (see Figure 2) is defined as the X-direction distance of droplet centroids between any moment (t) and initial zero time. The displacement data were extracted and plotted in Figure 4. It demonstrates that the X-direction displacement was quadratic polynomial related to time, i.e., s x = A t 2 + B t + C . The fitting results are listed in Table 2. The correlation coefficients are almost close to 1.0. Therefore, the acceleration (ax) can be obtained by finding the second derivative of the displacement (sx), i.e., a x = d 2 ( s x ) / d t 2 , which is equal to 2A. During dripping, the accelerations are possibly positive or negative, which depends on the polarity of the large droplet residual charge as separated from the adjacent fine droplets. In these cases, the accelerations at Al nanoparticle concentrations of 1.0 mg/mL and 3.0 mg/mL were negative constant during dripping, suggesting that the droplets at 1.0 mg/mL and 3.0 mg/mL took uniformly retarded motion. While at other concentrations, the single droplets were taking uniformly accelerated motion in the electrostatic field.
The Charge-to-Mass of multiple large droplets were calculated for each nanoparticle concentration. According to the Equation (3), if the charge polarity was not considered, the average Charge-to-Mass ratio and the error of single droplets can be solved by q / m ¯ = 1 n 1 n ( q i / m i ) and u ( q / m ¯ ) = 1 n ( q i / m i q / m ¯ ) 2 ( n 1 ) , where n is the droplet number (4 ≤ n ≤ 7 in this work). The calculated results are listed in Table 2. The order of magnitude of the Charge-to-Mass ratio reached 10−7~10−5 C/kg. At any concentration, these single droplets have been completely electrified with saturated charge value till breakup. Despite the volumetric charges of single droplets were saturated, the surface charges transferred freely at the surface of single droplets in the electrostatic field. The transportation of the charges made the distribution of surface charge nonuniform, resulting in the local deformation of single droplets and producing the Taylor cones.

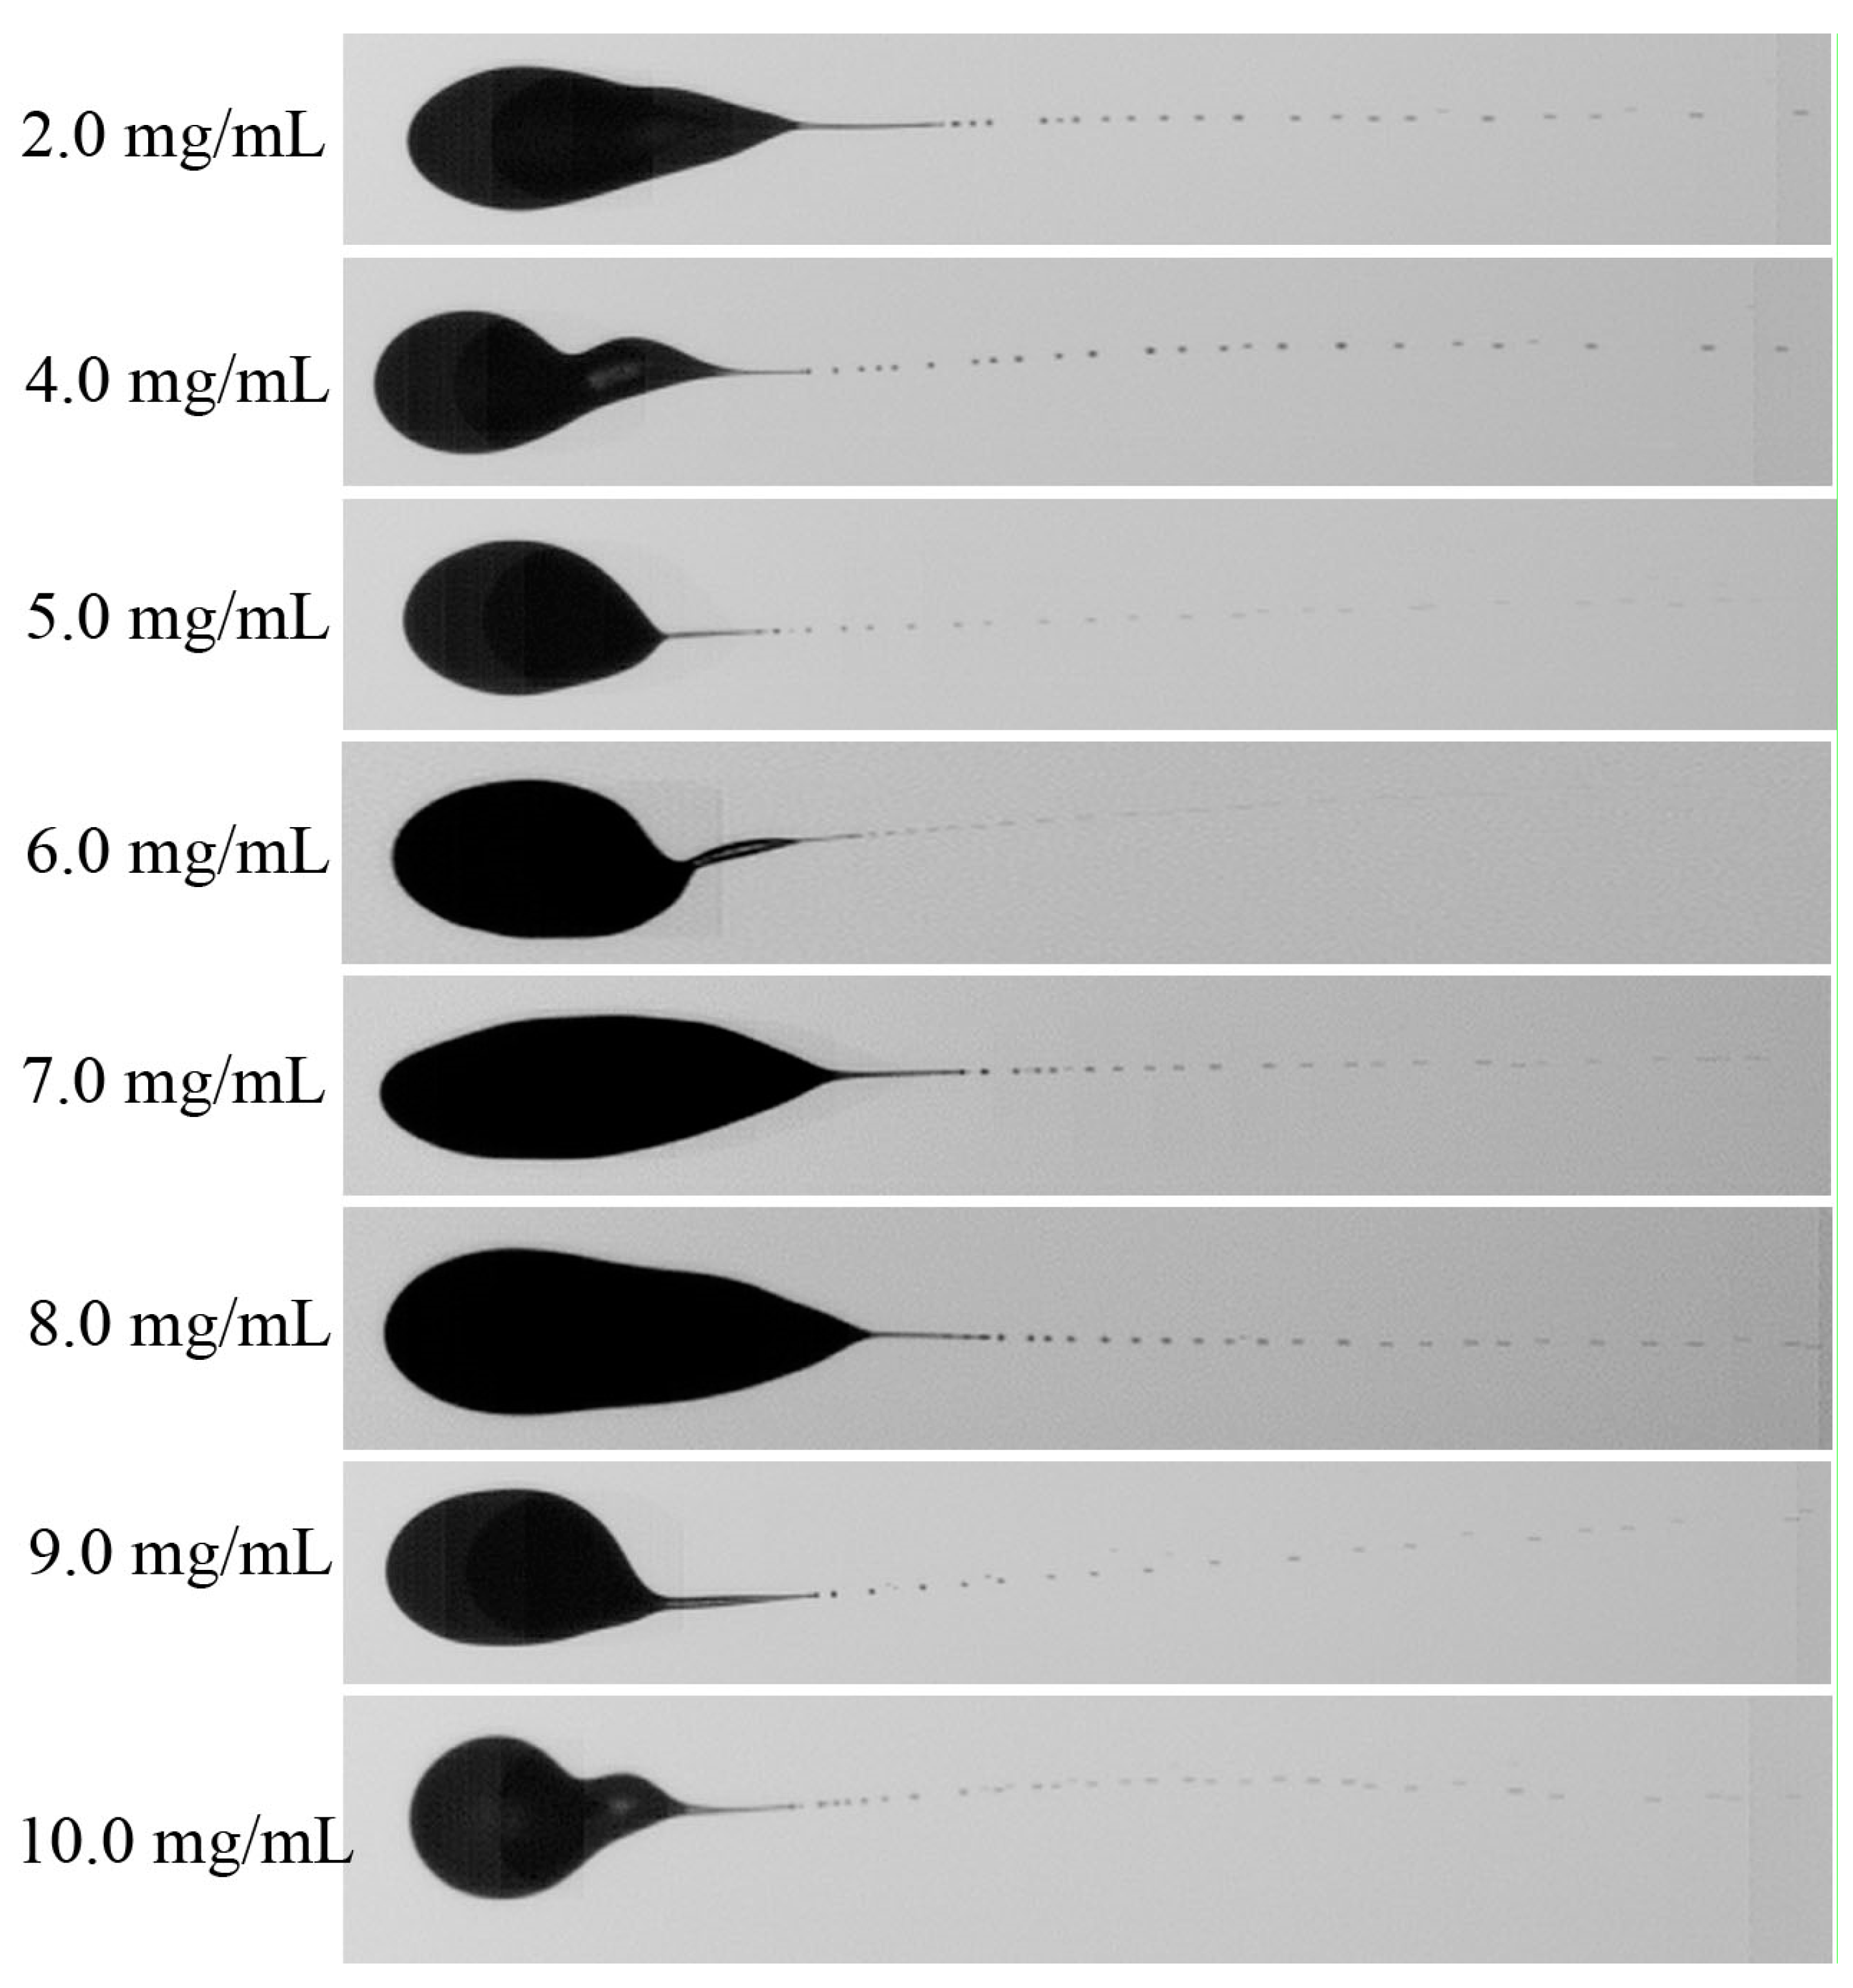
3.3. Secondary Breakup of Single Electrified Al/N-Decane Nanofluid Fuel Droplets

Figure 5 shows the secondary breakup photography of single Al/n-decane nanofluid fuel droplets except for 1.0 mg/mL and 3.0 mg/mL. It demonstrates that the breakup mode belonged to the cone-jetting mode. The cone-jetting mode of the single electrified nanofluid fuel droplets can be explained by comparing the charge relaxation time and the hydrodynamics relaxation time. The charge relaxation time τ c can be expressed as [21]:
τ c = ε n f 4 π σ n f
in which εnf and σnf are the permittivity and the electrical conductivity of Al/n-decane nanofluid fuel, respectively.
And the hydrodynamics relaxation time τ H can be expressed as
τ H = μ n f D n f 2 γ n f
in which Dnf is the diameter of the single electrified droplet, μnf and γnf are the viscosity and the surface tension of Al/n-decane nanofluid fuel, respectively.
According to the properties of nanofluid fuels, for different Al nanoparticle concentrations, the ratio of the charge relaxation time τ c to the hydrodynamics relaxation time τ H was much greater than 1 ( τ c / τ H > > 1 ) by calculating the order of magnitude relaxation time. It reveals that the surface charge transfer rate was much lower than that of the capillary wave induced by the surface tension. Therefore, the motion of the capillary wave was seriously damped by charge transfer, resulting in the breakup of low conductivity fluids, which is easy to form cone-jetting mode [21].
The average diameters of secondary breakup sub droplets are illustrated in Figure 6, ranging from 55.4 µm (at 6.0 mg/mL) ~90.4 µm (at 7.0 mg/mL). It means that fine and uniform secondary breakup sub droplets were obtained by electrostatic atomization.
From experimental observations, Taylor [24] suggested that, for an uncharged drop in a uniform electric field, at the point of disintegration, the following correlation seemed to hold:
D n f 2 γ n f = C / E
In this work, the C/E values were calculated and listed in Table 3. It demonstrates that the C/E fluctuated from a minimum value of 0.180 at 6.0 mg/mL to a maximum value of 0.208 at 8.0 mg/mL with different concentrations. The fluctuation magnitude reached 13.7%. But for most cases, the C/E values kept constant of ~0.20. Therefore, for the Al/n-decane nanofluid fuel, the correlation also seemed to hold, testifying that the reasonability of equilibrium dominated by the electrical force and the surface tension.

3.4. Mechanism of the Secondary Breakup of Single Electrified Al/N-Decane Nanofluid Fuel Droplets

In electrostatic field, the secondary breakup mechanism of single electrified nanofluid fuel droplet focuses on: (1) charge transportation at the droplet surface, (2) deformation and breakup of the droplet, (3) nanoparticle concentration effect on charge transportation, droplet deformation and breakup.
Figure 7a demonstrates a pattern of inductive charging. The left electrode connects with the negative pole of the high-voltage source, whereas the right electrode connects with the ground. The direction of the electric field directs towards the left side. The single droplets sprayed from the nozzle are electrified in the uniform strong electric field. Since the permittivity of the droplet fluid is finite and low, an electric field could have existed inside the droplet owing to the presence of the external strong electric field. It causes polarization of the droplet medium due to the realignment of the molecules in the droplet with the electric field, resulting in the presence of induced charges on the droplet boundary [25]. Therefore, for electrically charged droplets of dielectric liquids, in the external electric field, there will exist both “free” and “induced” charge at the droplet surface. Supposing the single large electrified droplet is ellipsoidal, the free charges and induced charges uniformly distribute at its surface, as shown in Figure 7b.
In the uniform electric field, these charges transfer towards the two opposite polarity electrodes, resulting in a negative gradient of charge density from the center to the two sides of a single droplet. On the left boundary, the positive ends of the molecules are aligned, and similarly the negative ends of the molecules on the right boundary. The induced charges significantly increase the total surface charges on one side of the droplet and simultaneously reduces it on the opposite side [26]. At the apexes of two sides, the charge density reaches maximum. The charge density gradient would oblige the droplet to suffer the non-uniform electrical force. However, the surface tension would adjust to resist the non-uniform electrical force, leading to the deformation of the droplet (See Figure 7c). Finally, the deformation of the droplet gradually forms the Taylor cone. It can be testified by observing the experimental results shown in Figure 2.
Overall, the droplet is unstable, and the location of the point of maximum surface charge density is a function of the free charges, the induced charges, and the direction of the external electric field [27]. The induced polarization charges and free charges at the droplet surface can contribute towards the fission of the droplet. If the local electric field force exerted on the Taylor cone was over the surface tension, the liquid within the droplet would be extruded from the tip of the Taylor cone and break into the Rayleigh limit and take secondary breakup (See Figure 7d).
The breakup of the droplet relates to the dielectric (conductivity) ratios between the droplet and continuum fluids, e.g., εdg (σd/σg), and liquid viscosity [28]. For a perfectly conducting droplet in a vacuum, εdg→∞, then a conical point forms, as predicted by Taylor, and the charge and mass may issue from this point [24]. Generally, the conductivity is finite, i.e., there exists an electric field inside the droplet, then the droplet will have to deform. If providing εdg ≥ 20, the conical point still forms, although the apex is different from the ‘Taylor-Cone’ angle of 49.3°. If the permittivity ratio εdg < 20, the conical point does not form, and the droplet will elongate along the electric field direction to form a cylindrical shape to accommodate any field strength, then fluid inertia will cause the droplet to oscillate [29,30]. In this work, although the permittivity ratio of n-decane/air (~2.0) is further lower than the reference value of 20, the secondary breakup of single nanofluid fuel droplets presented the cone-jetting mode and produced uniformly distributive sub droplets (See Figure 2 and Figure 5). This indicates that the Al nanoparticles contribute to the charge distribution and breakup characteristics of the droplets. According to our experimental observation, for pure n-decane, the Taylor cone did not form and the secondary breakup would not occur in air. For low Al nanoparticle concentrations of 1.0~3.0 mg/mL, the breakup probability of single nanofluid fuel droplets is also low. It suggests that, as there are abundant free electrons in the outer layer of aluminum, the addition of a small amount of Al nanoparticles into n-decane increases the free charge density. Adding the induced charges under the action of the external electric field, they together produce an electric field within the droplet and oblige to form the Taylor cone, but it is not strong enough to overcome the surface tension. At high concentrations of 4.0~10.0 mg/mL, the electric field formed by charge transfer within the droplets makes the single droplet break up into finer sub droplets. The electrification of droplets relates to the Al nanoparticle concentration, moreover, their physical properties also strongly depend on the Al nanoparticle concentration, resulting in a corresponding change in electric field force and surface tension, etc., and influencing the secondary breakup performance.
For ”large” nanofluid fuel droplets, their theoretical charge may be defined by the Rayleigh Limit [31,32] and expressed as
Q c ( φ ) = 8 π 2 ε 0 γ n f ( φ ) D n f 3
The surface charges can generate an electric field, normal to the surface [31,32], and be defined as
Q f i e l d = π ε 0 E s D n f 2
where Es is the electric field strength due to the surface charges. A critical crossover diameter of the droplet where the Rayleigh limit Equation (7) and the breakdown limit Equation (8) should be equal, which can be defined as
D n f = 8 γ n f ( φ ) ε 0 E s 2
However, in practice, the Rayleigh limit is scarcely reached since the external electrical or aerodynamic forces deform the drop away from the perfect electrical and physical symmetry. Therefore, the droplet is partly electrified in practice, and its real surface charges of qs(φ) are fractional to QC(φ) [25].
Shrimpton [33,34] established the magnitude of charge required to destabilize a given droplet in a given electric field. The fluid motion was driven by the surface electric field, occurring inside dielectric droplets [35]. The droplet stability condition is still the Rayleigh Limit, and at the droplet surface, the surface charge density can be given as
q s ( φ ) Q c ( φ ) = ( ε g 2 ε g 1 ) { 1 3 2 E D n f ε 0 2 ε g γ n f ( φ ) ( ε n f ( φ ) ε g ε n f ( φ ) + 2 ε g ) }
In these cases, the charges depend on the Al nanoparticle concentration, but further less than the Rayleigh limit. According to our estimation, the maximum surface charge density was 24.0% at 6.0 mg/mL, and the minimum value was only 20.7% at 8.0 mg/mL. Figure 6 demonstrated that, at a corresponding concentration of 6.0 mg/mL and 8.0 mg/mL, the average diameters of secondary breakup sub droplets almost reached minimum and maximum. It suggests that the larger the surface charge density, the finer the average diameters breakup sub droplets are.
According to the Weber and Ohnesorge number correlations published by Hinze [36], Cerkanowicz [37] extended the Rayleigh limit to non-stationary droplets. It demonstrated that the surface charge may reduce the effective surface tension. For spheroidal deformation of non-stationary charged droplets, its effect will be magnified by spheroidal eccentricity at the poles of a prolate ellipsoid. Assuming an ellipsoid of the major and minor axis a and b and eccentricity of e, the ellipticity parameter I 1 = 1 2 e ln ( 1 + e 1 e ) . The behavior of charged non-stationary droplet could be assessed:
( 1 ( a b ) 1 / 3 ) { 1 ( q s 2 ( φ ) 8 π 2 ε 0 γ n f ( φ ) D n f 3 ) ( N I 1 4 ) 2 } = K ρ n f ( φ ) u n f 2 D n f γ n f ( φ )
where N 2 = 2 e ^ 2 / 3 ( 2 e ^ 1 / 2 e ^ 3 / 2 ) 1 e ^ and e ^ = 1 e 2 ; K = 0.0850 for Oh ≤ 1, K = 0.0475 for Oh ≥ 1 [37]. In this work, Oh ≤ 1, thus K = 0.0850. Therefore, the dimensionless effective electrical Reynolds number (ReE(φ)), Weber number (WeE(φ)), and Ohnesorge number (OhE(φ)) can be more effective to evaluate the charge contribution for the secondary breakup of droplet.
For most of the cases in this work, only one Taylor cone formed and towards the grounding electrode, and thus one cone jet produced (See Figure 5). Occasionally, two Taylor cones formed and faced the two electrodes respectively, illustrating two jets. Figure 8 demonstrates the producing process of two Taylor cones and two jets along the direction of the electric field at Al nanoparticle concentration of 8.0 mg/mL. In the current case, the two jets were produced in a sequence, i.e., the jet at the left side sprayed from the single droplet is slightly earlier than that on the right. It means that the charge polarity and numbers at the surface were a little asymmetrical to the droplet center. The charges of sub droplets on the left presented positive, while negative on the right. The average diameter of secondary breakup sub droplets on the left (100.22 μm) is slightly larger than that on the right (87.08 μm).
Inculet et al. [38] demonstrated similar phenomena. For conducting droplet breakup like water/alcohol immersed in a neutral density oil, large droplets with a diameter of 10~16 mm elongated, and at a critical tip field strength, the surface deformed identically at both ends. Jet filaments were produced and broke up into fine droplets. As the droplet was displaced nearer to one electrode and jet formation only occurred at one end. At the other end, part of the droplet broke off to form a small satellite droplet. This was mainly caused by the difference in the droplet charging and their surface charge transfer and asymmetrical electrode position. In the symmetrical case, emission was almost simultaneous from both ends.

4. Conclusions

The secondary breakup characteristics and mechanism of single electrified Al/n-decane nanofluid fuel droplet in the electrostatic field were investigated in detail. The charge transportation, droplet deformation, Taylor cone formation, and secondary breakup were characterized by analyzing quantities of images and key data, some conclusions can be made as follows:
1
The charge distribution is non-uniform at the droplet surface, resulting in a gradient of the electric field within the droplet and locally deforming the droplet to produce the Taylor cone. The Charge-to-Mass ratio ranges from 10−7~10−5 C/kg. Overall, one cone was formed, occasionally two cones at Al nanoparticle concentration of 8.0 mg/mL.
2
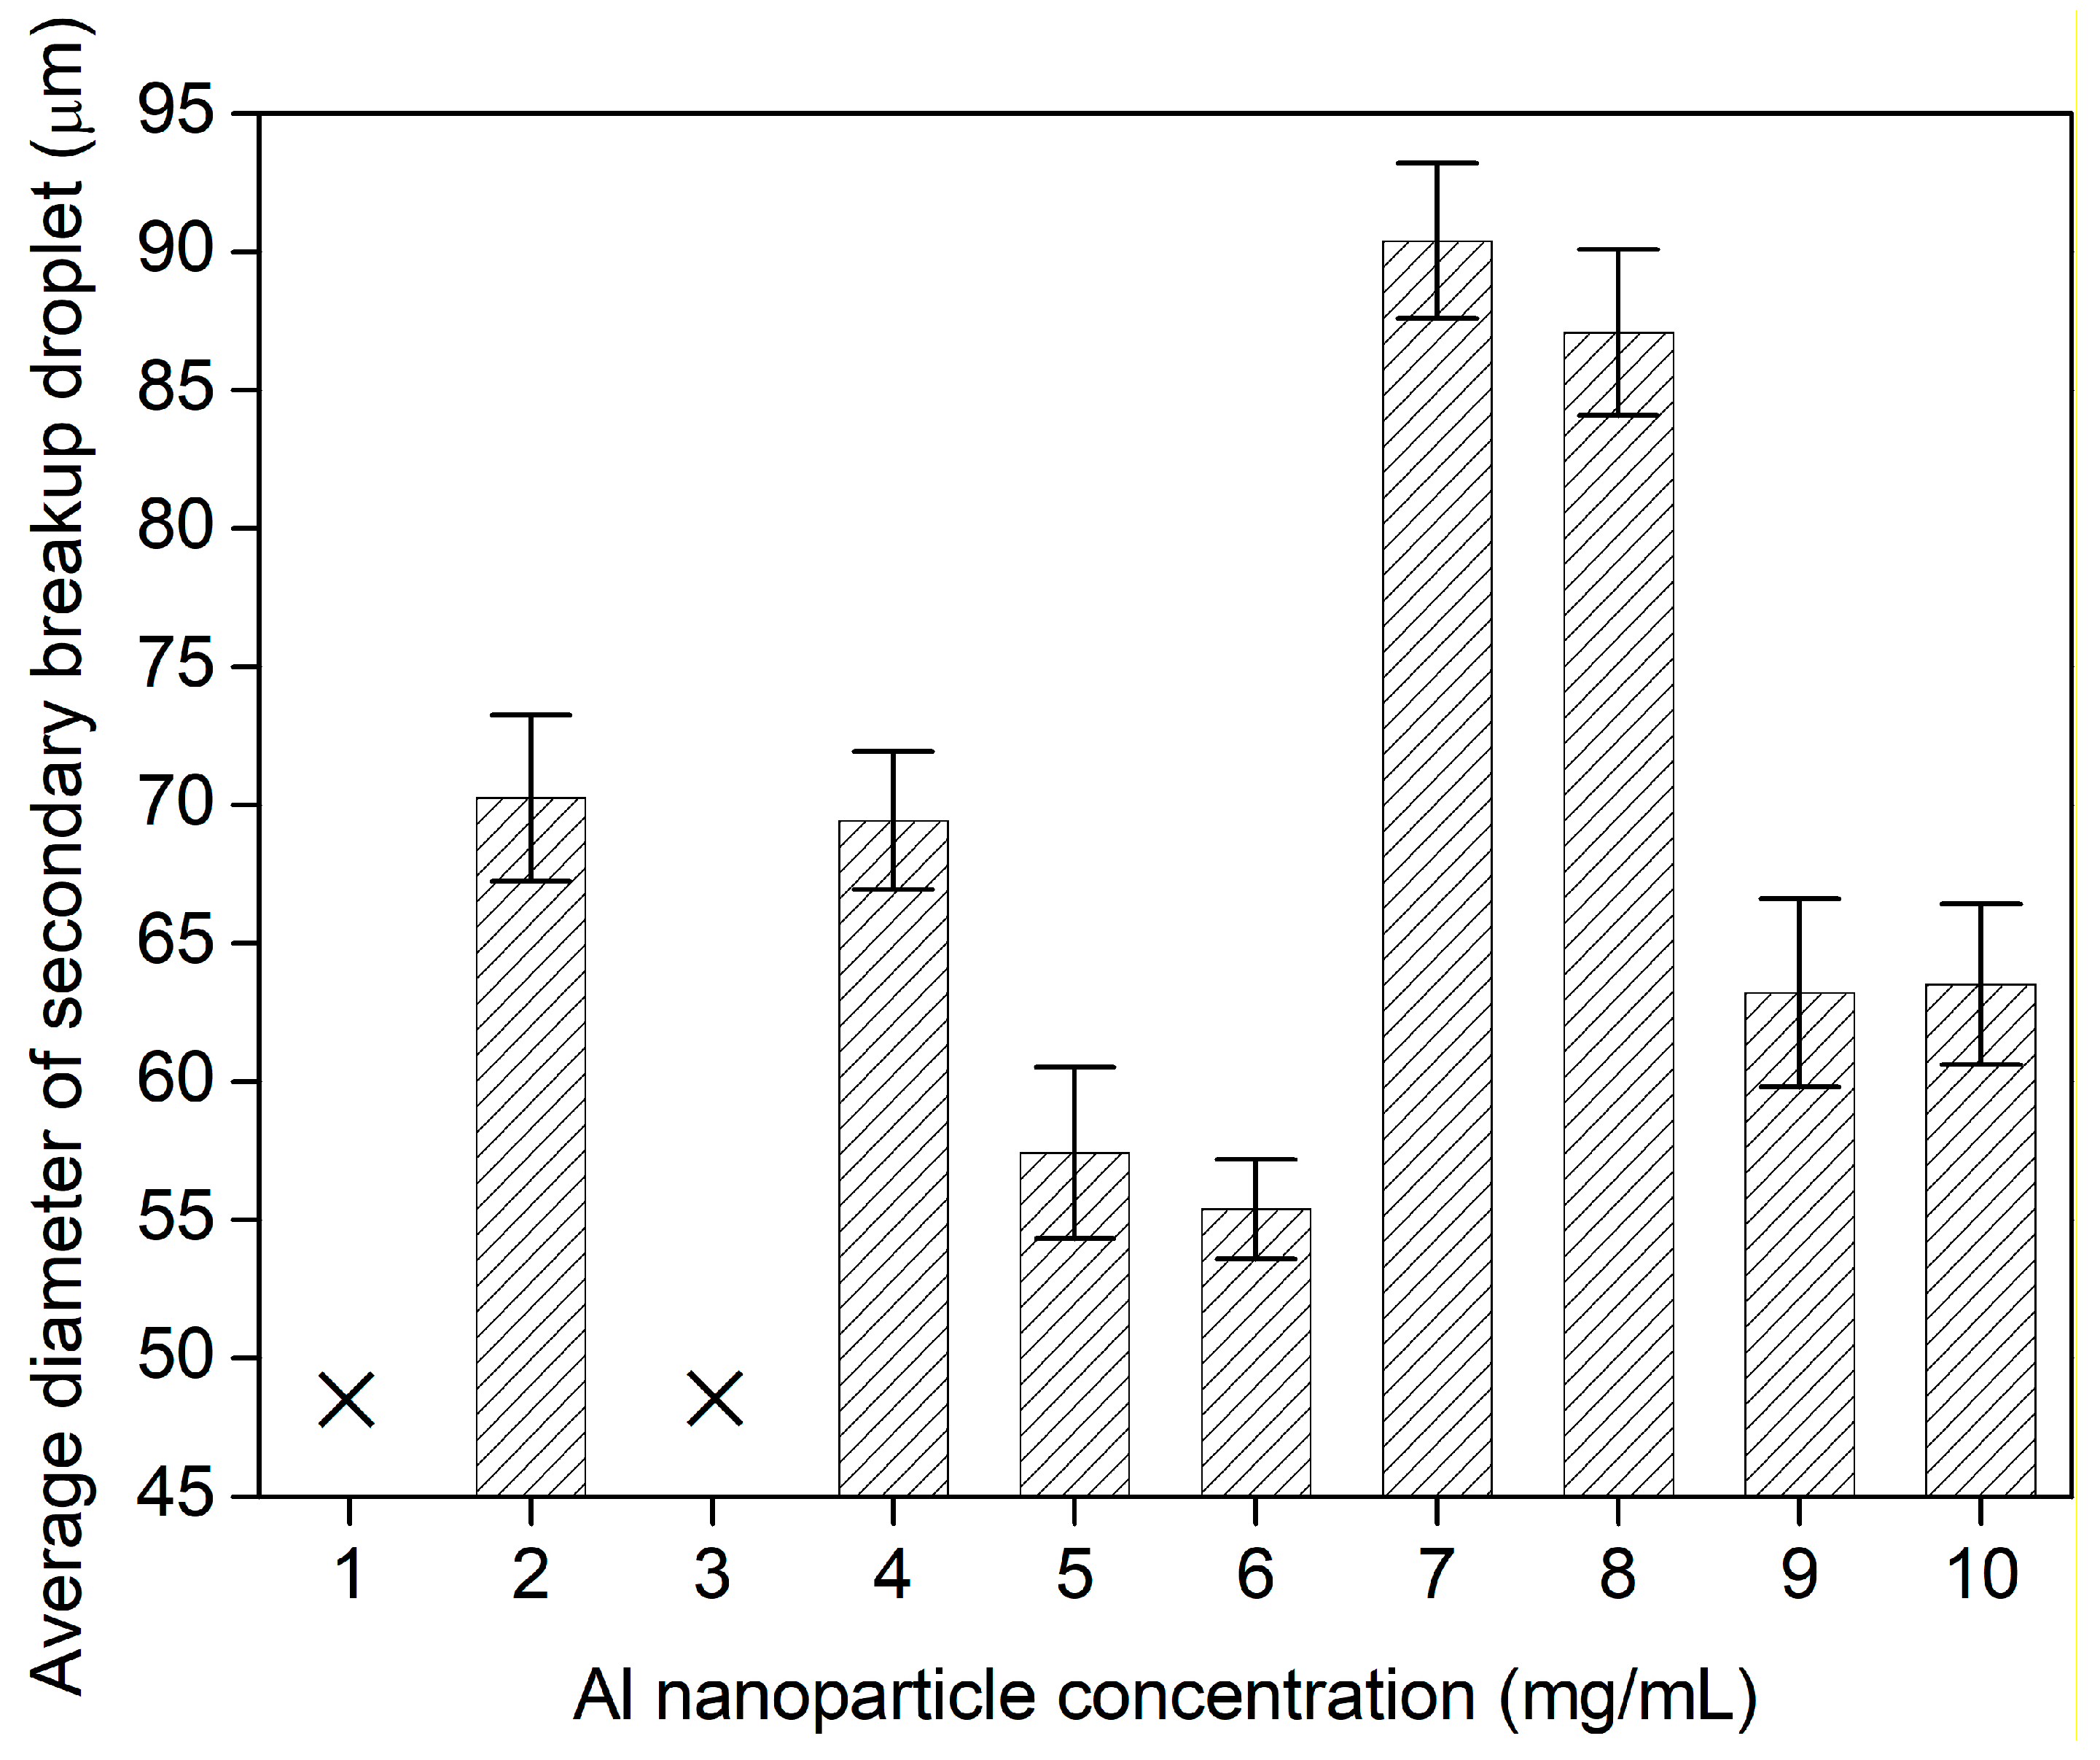
The C’/E values keep constant of~0.20 at most of Al nanoparticle concentrations, testifying that the reasonability of equilibrium dominated by the electrical force and the surface tension. On breakup, the surface charges are saturated but much less than the Rayleigh limit. At 6.0 mg/mL, the surface charge density reaches a maximum of 24.0%. The average diameters of secondary breakup sub droplets almost reached a minimum, suggesting that the large surface charge density achieves better breakup performance of single droplets.
3
Nanoparticle concentration has a significant effect on the charging of droplets, and the secondary breakup performance. At dilute concentrations below 3.0 mg/mL, the jet possibly does not produce, while at dense concentrations of 4.0~10.0 mg/mL, the jet filaments are formed and break up into uniform fine sub droplets. The minimum average diameter of secondary breakup droplets is 55.4 µm at 6.0 mg/mL.

Author Contributions

Conceptualization, S.L. and X.H.; methodology, H.L. and H.D.; experiments, H.L. and Y.L.; data treatment and software, Y.L. and H.D.; mechanism and analysis, S.L. and X.H.; writing—original draft preparation, review and editing, S.L. and X.H. All authors have read and agreed to the published version of the manuscript.

Funding

This research was funded by the Natural Science Foundation of Zhejiang Province (LY20E060004), the National Natural Science Foundation of China (51976050) and the Fundamental Research Funds for the Provincial Universities of Zhejiang (GK209907299001-004).

Conflicts of Interest

The authors declare no conflict of interest.

References

  1. Basu, S.; Miglani, A. Combustion and heat transfer characteristics of nanofluid fuel droplets: A short review. Int. J. Heat. Mass Trans. 2016, 96, 482–503. [Google Scholar] [CrossRef]
  2. Saidur, R.; Leong, K.Y.; Mohammad, H.A. A review on applications and challenges of nanofluids. Renew. Sust. Energ. Rev. 2011, 15, 1646–1668. [Google Scholar] [CrossRef]
  3. Wen, D. Nanofuel as a potential secondary energy carrier. Energ. Environ. Sci. 2010, 3, 591–600. [Google Scholar] [CrossRef]
  4. Tyagi, H.; Phelan, P.E.; Prasher, R.; Peck, R.; Lee, T.; Pacheco, J.R.; Arentzen, P. Increased hot-plate ignition probability for nanoparticle-laden diesel fuel. Nano Lett. 2008, 8, 1410–1416. [Google Scholar] [CrossRef] [PubMed]
  5. Sabourin, J.L.; Dabbs, D.M.; Yetter, R.A.; Dryer, F.L.; Aksay, I.A. Functionalized Graphene Sheet Colloids for Enhanced Fuel/Propellant Combustion. ACS Nano 2009, 3, 3945–3954. [Google Scholar] [CrossRef] [PubMed]
  6. Liu, G.N.; Liu, D. Treatment of efficiency for temperature and concentration profiles reconstruction of soot and metal-oxide nanoparticles in nanofluid fuel flames. Int. J. Heat. Mass Trans. 2019, 133, 494–499. [Google Scholar] [CrossRef]
  7. Mandal, S.; Kanagaraj, S. Reduction of emission in a diesel engine using nanofuel–ceria nanoparticle dispersed diesel. J. ASTM Int. 2012, 9, 1–9. [Google Scholar] [CrossRef]
  8. Mehta, R.N.; Chakraborty, M.; Parikh, P.A. Nanofuels: Combustion, engine performance and emissions. Fuel 2014, 120, 91–97. [Google Scholar] [CrossRef]
  9. Salata, O.V. Tools of nanotechnology: Electrospray. Curr. Nanosci. 2005, 1, 25–33. [Google Scholar] [CrossRef]
  10. Jaworek, A.; Sobczyk, A.T. Electrospraying route to nanotechnology: An overview. J. Electrostat. 2008, 66, 197–219. [Google Scholar] [CrossRef]
  11. Takáts, Z.; Wiseman, J.M.; Gologan, B.; Cooks, R.G. Mass spectrometry sampling under ambient conditions with desorption electrospray ionization. Science 2004, 306, 471–473. [Google Scholar] [CrossRef] [PubMed] [Green Version]
  12. Agathou, M.S.; Kyritsis, D.C. Electrostatic atomization of hydrocarbon fuels and bio-alcohols for engine applications. Energ. Convers. Manag. 2012, 60, 10–17. [Google Scholar] [CrossRef]
  13. Ganan-Calvo, A.M. On the general scaling theory for electrospraying. J. Fluid Mech. 2004, 507, 203–212a. [Google Scholar] [CrossRef]
  14. Collins, R.T.; Sambath, K.; Harris, M.T.; Basaran, O.A. Universal scaling laws for the disintegration of electrified drops. Proc. Natl. Acad. Sci. USA 2003, 110, 4905–4910. [Google Scholar] [CrossRef] [Green Version]
  15. Ejim, C.E.; Fleck, B.A.; Amirfazli, A. Analytical study for atomization of biodiesels and their blends in a typical injector: Surface tension and viscosity effects. Fuel 2007, 86, 1534–1544. [Google Scholar] [CrossRef]
  16. Chinnam, J.; Das, D.K.; Vajjha, R.S.; Satti, J.R. Measurements of the surface tension of nanofluids and development of a new correlation. Int. J. Therm. Sci. 2015, 98, 68–80. [Google Scholar] [CrossRef]
  17. Sharma, T.; Sangwai, J.S. Silica nanofluids in polyacrylamide with and without surfactant: Viscosity, surface tension, and interfacial tension with liquid paraffin. J. Petrol. Sci. Eng. 2017, 152, 575–585. [Google Scholar] [CrossRef]
  18. Maheshwary, P.B.; Handa, C.C.; Nemade, K.R. A comprehensive study of effect of concentration, particle size and particle shape on thermal conductivity of titania/water based nanofluid. Appl. Therm. Eng. 2017, 119, 79–88. [Google Scholar] [CrossRef]
  19. Żyła, G.; Fal, J. Viscosity, thermal and electrical conductivity of silicon dioxide–ethylene glycol transparent nanofluids: An experimental studies. Thermochim. Acta 2017, 650, 106–113. [Google Scholar] [CrossRef]
  20. Zhuo, Z.; Li, S.; Lu, Y.; Huang, X. Synergetic effects of nanoparticle concentration and electrification on the breakup performance of nanofluid fuel. Int. J. Heat. Mass Trans. 2019, 137, 940–950. [Google Scholar] [CrossRef]
  21. Cloupeau, M.; Prunet-Foch, B. Electrostatic spraying of liquids in cone-jet mode. J. Electrostat. 1989, 22, 135–159. [Google Scholar] [CrossRef]
  22. Ivancsy, T.; Suda, J.M. Behavior of polydisperse dust in electrostatic predipitators. J. Electrostat. 2005, 63, 923–927. [Google Scholar] [CrossRef]
  23. Li, S.; Zhuo, Z.; He, L.; Huang, X. Atomization characteristics of nano-Al/ethanol nanofluid fuel in electrostatic field. Fuel 2019, 236, 811–819. [Google Scholar] [CrossRef]
  24. Taylor, G.I. Disintegration of water drops in an electric field. Proc. Royal Soc. A 1964, 280, 383–397. [Google Scholar]
  25. Rigit, A.R.H.; Shrimpton, J.S. Electrical Performance of charge injection electrostatic atomizers. At. Spray. 2006, 16, 401–419. [Google Scholar] [CrossRef]
  26. Ganan-Calvo, A.M.; Davila, J.; Barrero, A. Current and droplet size in the electrospraying of liquids. Scaling laws. J. Aerosol Sci. 1997, 28, 249–275. [Google Scholar] [CrossRef]
  27. Raut, J.S.; Akella, S.; Singh, A.K.; Naik, V.M. Catastrophic Drop Breakup in Electric Field. Langmuir 2009, 25, 4829–4834. [Google Scholar] [CrossRef]
  28. Kourmatzis, A.; Ergene, E.L.; Shrimpton, J.S.; Kyritsis, D.C.; Mashayek, F.; Huo, M. Combined aerodynamic and electrostatic atomization of dielectric liquid jets. Exp. Fluids 2012, 53, 221–235. [Google Scholar] [CrossRef]
  29. Watson, P.K.; Chadband, W.G.; Sadeghzadeh-Araghi, M. The Role of Electrostatic and Hydrodynamic Forces in the Negative-Point Breakdown of Liquid Dielectrics. IEEE Trans. Dielect. Electr. Insul. 1991, 26, 543–559. [Google Scholar] [CrossRef]
  30. Fernandes De La Mora, J. On the Outcome of the Coulombic Fission of a Charged Isolated Drop. J. Colloid Interface Sci. 1996, 178, 109–218. [Google Scholar] [CrossRef]
  31. Bailey, A.G. Theory and practice of electrostatic spraying. At. Spray. 1986, 2, 95–134. [Google Scholar]
  32. Atten, P. Electrohydrodynamic instability and motion induced by injected space charge in insulating liquids. IEEE Trans. Dielect. Electr. Insul. 1996, 3, 1–17. [Google Scholar] [CrossRef]
  33. Shrimpton, J.S. Dielectric Charged Drop Break up at Sub-Rayleigh Limit Conditions. IEEE Trans. Dielect. Electr. Insul. 2005, 12, 573–578. [Google Scholar] [CrossRef]
  34. Shrimpton, J.S. Charge Injection Systems: Phycical Principles, Experimental and Theoretical Work; Springer: Berlin/Heidelberg, Germany, 2009. [Google Scholar]
  35. Okuda, H.; Kelly, A.J. Electrostatic atomization-Experiment, theory and industrial applications. Phys. Plasmas 1996, 3, 2191–2196. [Google Scholar] [CrossRef]
  36. Hinze, J.O. Fundamentals of the hydrodynamic mechanism of splitting in dispersion processes. AIChE J. 1955, 1, 289–295. [Google Scholar] [CrossRef]
  37. Cerkanowicz, A.E. Rayleigh limit for nonstationary drops. In Proceedings of the IEEE-IAS Conference Record, New York, NY, USA, 28 September–3 October 1980; Institute of Electrical and Electronics Engineers: New York, NY, USA, 1980; pp. 1161–1165. [Google Scholar]
  38. Inculet, I.I.; Kromann, R. Break up of Large Water Droplets by Electric Fields. IEEE Trans. Ind. Appl. 1989, 25, 945–948. [Google Scholar] [CrossRef]
Figure 1. Schematic of the experimental setup for the electrostatic secondary breakup.
Applsci 10 05332 g001
Figure 2. Formation of Taylor cones.
Applsci 10 05332 g002
Figure 3. Surface tension during Taylor cone formation.
Applsci 10 05332 g003
Figure 4. The X-direction displacement versus time before breakup.
Applsci 10 05332 g004
Figure 5. The secondary breakup at different Al nanoparticle concentrations.
Applsci 10 05332 g005
Figure 6. The average diameters of secondary breakup sub droplets at different Al nanoparticle concentrations.
Applsci 10 05332 g006
Figure 7. Mechanism of the secondary breakup of an individual electrified nanofluid fuel droplet in uniform electrostatic field, (a) production and movement of single droplets, (b) initial single spheroidal droplet with uniform charge distribution, (c) charge transfer and droplet deformation, (d) formation of Taylor cone and secondary breakup.
Applsci 10 05332 g007
Figure 8. The secondary breakup of both sides of single electrified Al/n-decane nanofluid fuel droplet at the concentration of 8.0 mg/mL.
Applsci 10 05332 g008
Table 1. The formation time and the angles of Taylor cones at different concentrations.
Concentration (mg/mL)Time (ms)Average Time and Error (ms)Taylor Cone Angle (°)Average Taylor Cone Angle and Error (°)
1.07.107.05 ± 0.0775.877.0 ± 1.6
2.04.004.17 ± 0.2360.863.5 ± 0.6
3.05.505.60 ± 0.1486.888.4 ± 1.6
4.05.005.15 ± 0.2153.658.9 ± 7.5
5.011.3311.83 ± 0.7154.552.4 ± 2.1
6.05.905.95 ± 0.0736.035.1 ± 1.3
7.08.538.60 ± 0.1050.853.3 ± 3.5
8.07.307.30 ± 0.2146.548.3 ± 2.5
9.010.0013.00 ± 4.240.839.0 ± 2.5
10.04.334.50 ± 0.2361.858.3 ± 5.0
Table 2. The Charge-to-Mass ratio at each concentration.
Concentration (mg/mL) s x = A t 2 + B t + C ( μ m ) q/m in These Cases (×10−6 C/kg)Average q/m (×10−6 C/kg) Error (×10−6 C/kg)
ABCR2
1.0−2.97−84.9010.510.999−9.558.051.13
2.01.90−76.627.370.9996.154.460.64
3.0−1.70−174.144.151.000−5.475.492.93
4.04.57−46.31−1.120.99514.76.4062.05
5.01.22−99.6716.801.0003.922.170.80
6.02.90−39.8646.890.9829.3211.40.05
7.04.82−182.3313.551.00015.57.482.04
8.00.23−77.759.541.0000.742.441.70
9.00.19−63.914.6109980.613.922.42
10.03.56−13.630.780.94211.411.41.67
Table 3. The C/E value at the point of disintegration.
Concentration (mg/mL)C/E (m/N1/2)Concentration (mg/mL)C/E (m/N1/2)
2.00.206 ± 0.0067.00.203 ± 0.006
4.00.193 ± 0.0058.00.208 ± 0.006
5.00.203 ± 0.0069.00.203 ± 0.006
6.00.180 ± 0.00510.00.189 ± 0.005

