Article

Measuring Gait-Event-Related Brain Potentials (gERPs) during Instructed and Spontaneous Treadmill Walking: Technical Solutions and Automated Classification through Artificial Neural Networks

1
Department of Applied Emotion and Motivation Psychology, Institute of Psychology and Education, Ulm University, 89081 Ulm, Germany
2
Department of Medical Engineering and Mechatronics, Ulm University of Applied Sciences, 89075 Ulm, Germany
*
Authors to whom correspondence should be addressed.
Appl. Sci. 2020, 10(16), 5405; https://doi.org/10.3390/app10165405
Submission received: 18 June 2020 / Revised: 26 July 2020 / Accepted: 27 July 2020 / Published: 5 August 2020

Abstract

:
The investigation of the neural correlates of human gait, as measured by means of non-invasive electroencephalography (EEG), is of central importance for the understanding of human gait and for novel developments in gait rehabilitation. Particularly, gait-event-related brain potentials (gERPs) may provide information about the functional role of cortical brain regions in human gait control. The purpose of this paper is to explore possible experimental and technical solutions for time-sensitive analysis of human gait ERPs during spontaneous and instructed treadmill walking. A solution (hardware/software) for synchronous recording of gait and EEG data was developed, tested and piloted. The solution consists of a custom-made USB synchronization interface, a time-synchronization module, and a data-merging module, allowing the temporal synchronization of recording devices, time-sensitive extraction of gait markers for the analysis of gERPs, and the training of artificial neural networks. In the present manuscript, the hardware and software components were tested with the following devices: A treadmill with an integrated pressure plate for gait analysis (zebris FDM-T) and an Acticap non-wireless 32-channel EEG system (Brain Products GmbH). The usability and validity of the developed solution was investigated in a pilot study (n = 3 healthy participants, n = 3 females, mean age = 22.75 years). The recorded continuous EEG data were segmented into epochs according to the detected gait markers for the analysis of gERPs. Finally, the EEG epochs were used to train a deep learning artificial neural network as classifier of gait phases. The results obtained in this pilot study, although preliminary, support the feasibility of the solution for the application of gait-related EEG analysis.

1. Introduction

The rehabilitation of patients with gait-related health problems plays an important role in medical health care [1,2]. Stroke, aging, overweight, medication, and diseases such as diabetes mellitus type II or mild cognitive impairments, as well as other life circumstances such as accidents at work or at home can lead to impairments in human gait [3,4]. Therefore, problems in gait control are not always diagnosed properly because the factors contributing to changes in human gait patterns are multi-factorial. Importantly, subtle impairments in gait are often not detected in traditional clinical assessments and observations of gait. The physical symptoms of impaired gait can be diagnosed by health professionals including physiotherapists, neuropsychologists or doctors by means of well-validated behavioral tools and neuropsychological tests [5]. However, examinations based on the neural correlates of human gait are still not included in sufficient detail in the rehabilitation routine. Lately, there has been a huge interest in the neural correlates of human locomotion [6]. Methodologically, the analysis of event-related brain potentials (ERPs) and the analysis of changes in oscillatory neural activity, as measured via electroencephalography (EEG), have become important non-invasive methods for investigating human locomotion, including gait [7]. The EEG, and the analysis of ERPs in particular, allows for the investigation of changes in brain activity related to certain external or internal sensory events in the time range of milliseconds (ms). The electrophysiological correlates of arm, finger, or limb movements, or the recognition of own vs. other-generated movements, for example, have been well investigated [8,9,10,11,12,13,14]. Moreover, processes involved in movement control during motor imagery have been investigated intensively [13]. For human motion and movement control, two types of EEG measures are of particular interest. First, the modulation of event-related brain potentials (ERPs, [7,10]) and, second, the modulation of changes in oscillatory activity, such as changes in event-related (de)synchronization (ERDS/ERS) [15]. Whereas ERPs are phase-locked to a particular event of interest, event-related (de)synchronization describes frequency band-specific changes in EEG rhythms that appear due to changes in externally or internally paced cognitive, affective, and motor activity. Locomotion-related changes in ERD/ERS are well investigated in the literature [15,16]. However, studies investigating the modulation of gait- event-related potentials (gERPs) during walking are still underrepresented in the literature. Regarding ERP measurement during walking or running, previous studies used dual task paradigms (e.g., solving a cognitive task (primary task)) while walking or running on a treadmill (secondary task). However, these studies aimed at analyzing ERPs of the primary task while simultaneously canceling out brain activity from the secondary task (e.g., walking or running) as a source of noise elicited by the movement of walking or running [10,17,18]. Research that looks at gait-specific ERP modulation elicited during spontaneous or instructed walking is still sparse. This research, however, is of relevance for clinical research interested in improving the diagnosis and treatment of gait disorders with a primarily neural origin (e.g., stroke patients, Parkinson’s disease) or secondary neural origin (e.g., amputees, traumatic injuries, mentally disabled patients, elderly people with a risk of falls, or overweight people with diabetes type II disorder). These disorders can be accompanied by CNS-related cortical gait impairments. One of the main reasons for this lack of research about gait-specific neural correlates is due to technical reasons. Another reason concerns physiological movement artifacts produced by the gait itself [18]. Yet, another reason concerns assumptions about the control of highly automated movement in the human brain. The analysis of gERPs requires—as does the analysis of ERPs in general—the precise timing and triggering of the events of interest. In the case of gERPs, technical solutions are needed that capture (a) the different periods of the human gait cycle (for a graphical illustration of the human gait cycle, see Figure 1) and (b) the concomitant EEG activity, time-locked to the onset of the different periods of the gait cycle (e.g., initial contact, etc.). The events must be recorded with temporally high precision (in the millisecond range (ms)). Importantly, the gait events need to be synchronized with the EEG recordings without the loss of temporal information and without data errors due to jittering in the trigger signal caused by imprecise data interfacing or uncertainty in the signal and data transfer from one device to the other. Second, any bodily movement produces movement artifacts in the EEG signal that can overlay the gait event or signal of interest. As far as gERPs are concerned, such movement artifacts are temporally confounded with the gait event and the EEG signal of interest. For instance, the initial contact (IC), i.e., one of the most prominent events of the gait cycle can produce movement artifacts when the feet touch the ground (see Figure 1). Such gait-related movement artifacts occur with limited variability when controlled in the laboratory, for instance, during treadmill walking at a constant pace (see Figure 2). Finally, the human gait is highly automatic. However, this does not mean that the human gait cycle is not under the control of higher-order cortical brain regions, including cortical motor and attention networks. Studies have shown that even in conditions in which walking is highly autonomous (walking on a treadmill at a constant speed and pace) and therefore only under limited attentive control, it can interfere with the performance of a number of mental cognitive tasks [17,19,20,21].

Aim of the Present Study

As outlined above, the investigation of the neural correlates of human gait is challenged by a number of technical restrictions. Therefore, the aim of the present study was to explore possible technical solutions for the time-sensitive analysis of human gERPs during spontaneous and instruction-guided treadmill walking. To realize these solutions, several hardware and software components are necessary for time-sensitive synchronous gait and ERP data interfacing and recording. In the present study, the technical solution chosen was tested and piloted in three healthy volunteers from whom continuous EEG data was recorded with an electrically shielded high-density 32-channel EEG system with active electrodes during uninstructed and instructed treadmill walking. Gait was recorded via a pressure plate implemented in the treadmill. Next, the gait cycle and corresponding gait markers were determined according to guidelines for the standardized classifications of human gait [23]. Two key questions were explored:
  • Can gait-event-related brain potentials (gERPs) be analyzed based on human gait markers decoded by force plates?
  • Can the analysis of gERPs be automated by applying machine learning approaches based on artificial neural networks (ANNs), especially long short-term memory cells (LSTM) [24]?

2. Materials and Methods

2.1. Structural Design and System Overview

Figure 3 provides an overview of the structural design, the technical devices, and systems used in the present study. The arrows between the different devices or systems illustrate the interfaces for data recording and data transfer established by the technical solution. The structural design used in the present study mirrors those of many previous EEG studies that analyze EEG during treadmill walking. The design comprises four independent systems whose data flow is combined and temporally synchronized. (A) The stimulation unit, which consists of a computer and the software for the presentation of stimuli and tasks (e.g., cognitive tasks, instructions, etc.) during treadmill walking. (B) The recording units. These consist of two different computers: one of the computers is connected via a parallel port to the stimulation unit, and is used for timely precise EEG recordings; the other computer is connected to the treadmill and pressure plate via a USB cable and to the treadmill software for gait recording. In addition, in the present technical solution, a third device capturing data from inertial sensors (IMUs, for whole body motion capture) is implemented. The IMUs provide the possibility for an automatic analysis of gait events and gait patterns without the use of video-based systems or force plates. To integrate the IMUs, the trigger from the simulation software is split and sent to a third recording device (notebook, personal computer) that is used for the motion capture examined via the inertial sensor systems. The participants receive the instructions sent from the stimulus PC. To this end, the stimulus PC connects with a television screen located in front of the treadmill at the eye level of the participants. The instructions and stimuli are sent by the stimulus presentation software to the EEG system and used as markers/triggers for the later identification of each of the walking conditions, and the epochs of the gait events.

2.2. EEG System

The EEG system used in the present study is an active non-wireless high-density EEG system frequently used in scientific studies (Brain Products GmbH, Gilching, Germany). The actiCAP electrodes of the EEG system are connected with a multichannel BrainAmp amplifier and a computer with recording software (Brain Vision Recorder, Brain Products GmbH, Gilching, Germany). The active electrode EEG system uses a hardware solution that leads to lower noise compared to passive electrodes. The EEG recording systems and EEG recording computer is connected via a linear parallel port (LPT) and a USB splitter box to the stimulus PC, which allows precise triggering in the range of < 2 ms without signal jittering. The stimulation PC was used for the synchronization of the gait and EEG data (see Figure 3). The EEG data were recorded with a sampling rate of 1000 Hz. The standard 10–20 system channel montage was used for EEG recording. Impedance was controlled and kept constant across electrodes below 10 kOhm.

2.3. Pressure Plate and Treadmill

The pressure plate records the ground reaction force of the human gait while walking on the treadmill. The pressure plate used in the present study is a Zebris FDM-T® (Zebris Medical GmbH, Isny, Germany), which is integrated into a Pluto® treadmill produced by h/p/cosmos® (h/p/cosmos sports and medical GmbH, Nussdorf-Traunstein, Germany). The sampling rate of the raw data was 100 Hz. Data were sampled continuously and data preprocessing and analysis were done offline. Since it is not yet possible to extract the preprocessed reaction force curves of the feet from the Zebris FDM-T recording and analysis software, the recorded data were extracted as raw data and preprocessed offline (see Section 2.6 for details).

2.4. Temporal Synchronization Unit and Data Merging

Since the recording systems (EEG and pressure plate) are independent devices and not coupled or synchronized during recording (see structural design in Figure 2), the time synchronization between the two devices has to be realized with a custom technical solution. As shown in Figure 2, the stimulus PC was used for the triggering of the recording systems. The stimulus PC runs the software Presentation® (Neurobehavioral Systems) which is capable of sending various trigger output signals via a series of possible ports. In the present study, the EEG system and stimulus PC were connected via an LPT port to avoid jittering of the marker signal, typically occurring with serial ports that exceed the necessary temporal precision for EEG recordings of less than 1–2 milliseconds (ms). The pressure plate and the IMU system are triggered directly by the stimulus PC. The devices receive start and stop markers from Presentation, the stimulation software. The trigger interfacing between the stimulus PC and the pressure plate (and, if included, the inertial sensor system) was realized by a custom-made microcontroller-based USB synchronization device. This device allows for synchronization of the recording devices with the existing set-up. Finally, the different recording files need to be written into one output file for data merging and data fusion. The EEG data file was used for data merging and all other data were written to and synchronized with this output file using MATLAB® routines.
The reliability and validity of the results relies on the precision and accuracy with which the data are recorded by the different devices and software can be temporally synchronized and merged. To minimize the error in the time delay between all recorded datasets, several validation steps were taken into consideration to estimate the different time delays of the different interfaces and the custom-made USB communication device. This synchronization device sends the trigger signals from the stimulus PC to the treadmill at the same time the trigger signal is sent to the EEG system. The time delay was explored using the following method: The analog output of the USB synchronization device comprises an LED. The LED lights up every time an analog trigger signal is created. The LED, as well as the PC display, are simultaneously recorded with a camera. The accuracy of this method depends on the sampling rate of the camera, which in the present study comprised a frame rate of 120 Hz. The estimation and validation of the time delay for later data synchronization were investigated prior to the pilot study based on test signals. The tests were performed 10 times by triggering the devices in different frequencies. During all tests, the time delay between EEG and treadmill triggers was below td1 = 8.33 ms, and therefore within one time frame of the treadmill (sampling frequency of 120 Hz). There was no jittering. Therefore, it is possible to correct for the time delay and align the detected gait events as onset markers for ERP analysis during the step of data merging and data fusion (see Section 2.6 for details).

2.5. Experimental Design and Set-Up

The pilot study as well as its experimental set-up were approved by the ethics committee of Ulm University, Germany (https://www.uni-ulm.de/einrichtungen/ethikkommission-der-universitaet-ulm/). The criteria for the inclusion of participants were defined as follows: Healthy young adults (e.g., students from Ulm University, Germany, or from Ulm University of Applied Sciences, Ulm, Germany) with no history of drug abuse, medication, somatic injuries, or somatic, physiological, or neurological diseases could take part in the pilot study. The participants had to fill in a pre-study questionnaire to confirm these parameters and give oral and written informed consent for voluntary participation. In total, three volunteers (three females, age: 22–24 years) were included for pilot testing. All participants wore glasses, since all three were short-sighted. Participants were asked to walk on the treadmill with bare feet. The experiment was conducted in the EEG-FNIRS Brain Imaging Lab of the Department of Applied Emotion and Motivation Psychology at Ulm University, Germany. Furthermore, the interface solutions were tested in the Motion Lab of the Research Group for Biomechatronics of Ulm University of Applied Sciences, Germany.
Upon arrival at the laboratory, the participants received detailed instructions about the experiment and were debriefed about its purpose. They were accustomed to the treadmill and the EEG recording (see Figure 2 for an overview). They received practice trials to determine individual preferences for walking on the treadmill at their own preferred pace. Next, participants were familiarized with the procedure of the experimental psychological walking paradigm. The paradigm was developed to standardize and control the participants’ gait cycles in different conditions of spontaneous and instructed treadmill walking. In total, seven different experimental conditions were created. These conditions were experimentally designed in a manner such that they manipulated the participants’ selective attention to gait. This allowed us to produce reliable and reproducible alterations in the gait cycles and to explore gERP components across varying degrees of voluntary attention. While walking on the treadmill at the velocity of their own pace, the participants received detailed written instructions on the TV screen. They were told to walk spontaneously without any specific attention focus (task 1). Next, they received the instruction to take big steps (task 2), small steps (task 3), to concentrate on the left initial contact (task 4) or the right initial contact (task 5), on the left toe-off (task 6) or the right toe-off (task 7). Tasks and walking conditions were randomized, and they were counterbalanced across participants. Each task lasted about 30 s and was repeated four times in a randomized order. Between each task condition, 30 s of normal walking were included. At the start and the end of the experiment, the participants were asked to walk for about 4 min without any task to have additional data for the training of the artificial network (see Section 2.9). None of the three participants stated any problems with the tasks given. All participants independently chose to walk with a pace of 3.5 km/h.

2.6. Data Fusion and Data Preprocessing

Data preprocessing and data fusion of the different datasets were performed with MATLAB®. For the pressure plate, preprocessing of the data included the following steps. First, the raw data comprising the pressure measurements of each cell of the plate over time are preprocessed to get the vertical ground reaction force (vGRF) curve for each foot. The segmentation of the pressure measurements into the left foot and right foot is provided by the FDM-T software. Therefore, the vGRF can be calculated by simply summing up the corresponding pressure measurements of the left and right foot over time.
From this vGRF measurement, it is possible to extract gait-related events. As shown in Figure 4, any of the standardized events of the stance phase of the human gait cycle can be detected from the preprocessed pressure plate data, although in the present pilot study, only initial contact (IC) and toe-off (TO) are used as markers.
For the analysis of gERPs, the IC as a prominent gait event was considered as marker. In total, 3750 (for each person, about 1256) events related to the left IC and the right IC could be identified across the seven experimental conditions, resulting in a total of 7500 gait markers for EEG data analysis. The EEGlab toolbox and the Brain Vision Analyzer software were used for EEG data preprocessing and gait-related EEG analysis. The EEG data were filtered with an Infinite Impulse Response (IIR) filter (order 2) from 0.1–100 Hz and line noise was discarded with a notch filter at 50 Hz. The 0.1 Hz filter setting was chosen to attenuate slow frequency drifts. The upper cut-off of 100 Hz (instead of more conservative cut-offs of, e.g., 30 Hz) was chosen to include ERP characteristics with high frequency proportions (for a discussion of EEG filter settings see [25]). The filters were applied to the continuous raw EEG data. The filtered continuous EEG data were visually inspected for artifacts and artifacts were removed before the data were segmented into epochs. In addition to visual and manual artifact removal, independent component analysis (ICA) was also used for EEG decomposition to separate and correct EEG signals from signals elicited by e.g., eye movements, movement artifacts, and other artifacts. Artifact-corrected data were then segmented into epochs, baseline corrected, and averaged to inspect gERPs elicited by the left IC or the right IC, respectively.

2.7. Data Evaluation and Marker Extraction

EEG epochs were segmented using the gait events “IC left” and “IC right” as onset markers that were synchronized with the EEG recordings (see Section 2.4 for details). EEG epochs were cut into segments from 1000 ms before until 1000 ms after the event (IC left or IC right) and the epochs were baseline corrected using the −1000–0 ms time window before the IC onset as a baseline. The length of the individual epochs (−1000–1000 ms) was chosen to include the whole gait cycle (left foot and right foot) within one epoch. As described above, each participant walked at a pace of 3.5 km/h. Two consecutive ICs of the same foot have a time lag of at least 1000 ms, ICs of different feet at least 490 ms. There were no breaks, stops, or inter-trial periods of “no activity” between gait cycles, which could have been used as a baseline. Thus, so as to not confound ERPs elicited by the left IC with the activity elicited by the preceding right IC and vice versa, baseline correction included the average time window of the previous gait cycle. This attenuated any systematic and temporal baseline differences between the left and right IC, respectively. Similar procedures of using the whole pre-stimulus trial time window for baseline corrections are common in so called rapid serial (visual) presentation designs, in which stimuli are presented at rates of 1 Hz, 3 Hz, or even faster to avoid the effects of component overlap [26,27]. The baseline-corrected epochs were then averaged across all available epochs for each subject for sufficient data quality and a good signal to noise ratio. It is principally possible to split the EEG epochs into the different seven walking conditions. It is also possible to analyze the data separately for left and right initial contact (IC) or other gait events (e.g., TO). The analysis of gERPs reported here was first performed for all available epochs, irrespective of the different walking conditions (spontaneous or instruction guided). Next, single analyses were performed for each of the walking conditions and the results are reported descriptively for the averaged data of a single subject and the grand averaged data of the three volunteers.

2.8. Data Analysis

Event-related brain potentials were analyzed from the averaged epochs for each single subject and for the grand averaged EEG data of all three volunteers. Electrodes of interest were chosen in line with the somatotopic representation of movement in the motor cortex and in line with previous EEG research. Due to the small sample size, the EEG results are reported descriptively only and are illustrated in the Figure 5 and Figure 6. Moreover, in addition to ERP analysis, event-related spectral power (ERSP) measures were also descriptively analyzed to determine changes in the amplitudes of the EEG frequency spectrum across time. ERSP maps were analyzed relative to the onset of the initial contact.

2.9. Neural Networks and Data Classification

This set-up should later be able to be used for machine learning applications. Those applications can cover, but are not limited to, the classification of gait phases, the detection of gait events, and the detection of gait disorders based on EEG data. To show the principle applicability, we chose the following classification problem as a proof of concept: the network should classify gait phases of single and double support times, i.e., time intervals where only the left or the right foot is on the ground (single support) or both (double support). As the EEG data were highly patient-specific, we trained a neural network for each patient separately. The networks were trained using Mathworks MATLAB® R2019b, Deep Learning Toolbox. We used the fused data from the EEG and pressure plate, preprocessed as described above using EEGLab. The channel data of C3, C4, CP1, and CP2 were selected as input (cf. above). The events of the pressure plate were used as labels, leading to the three classes:
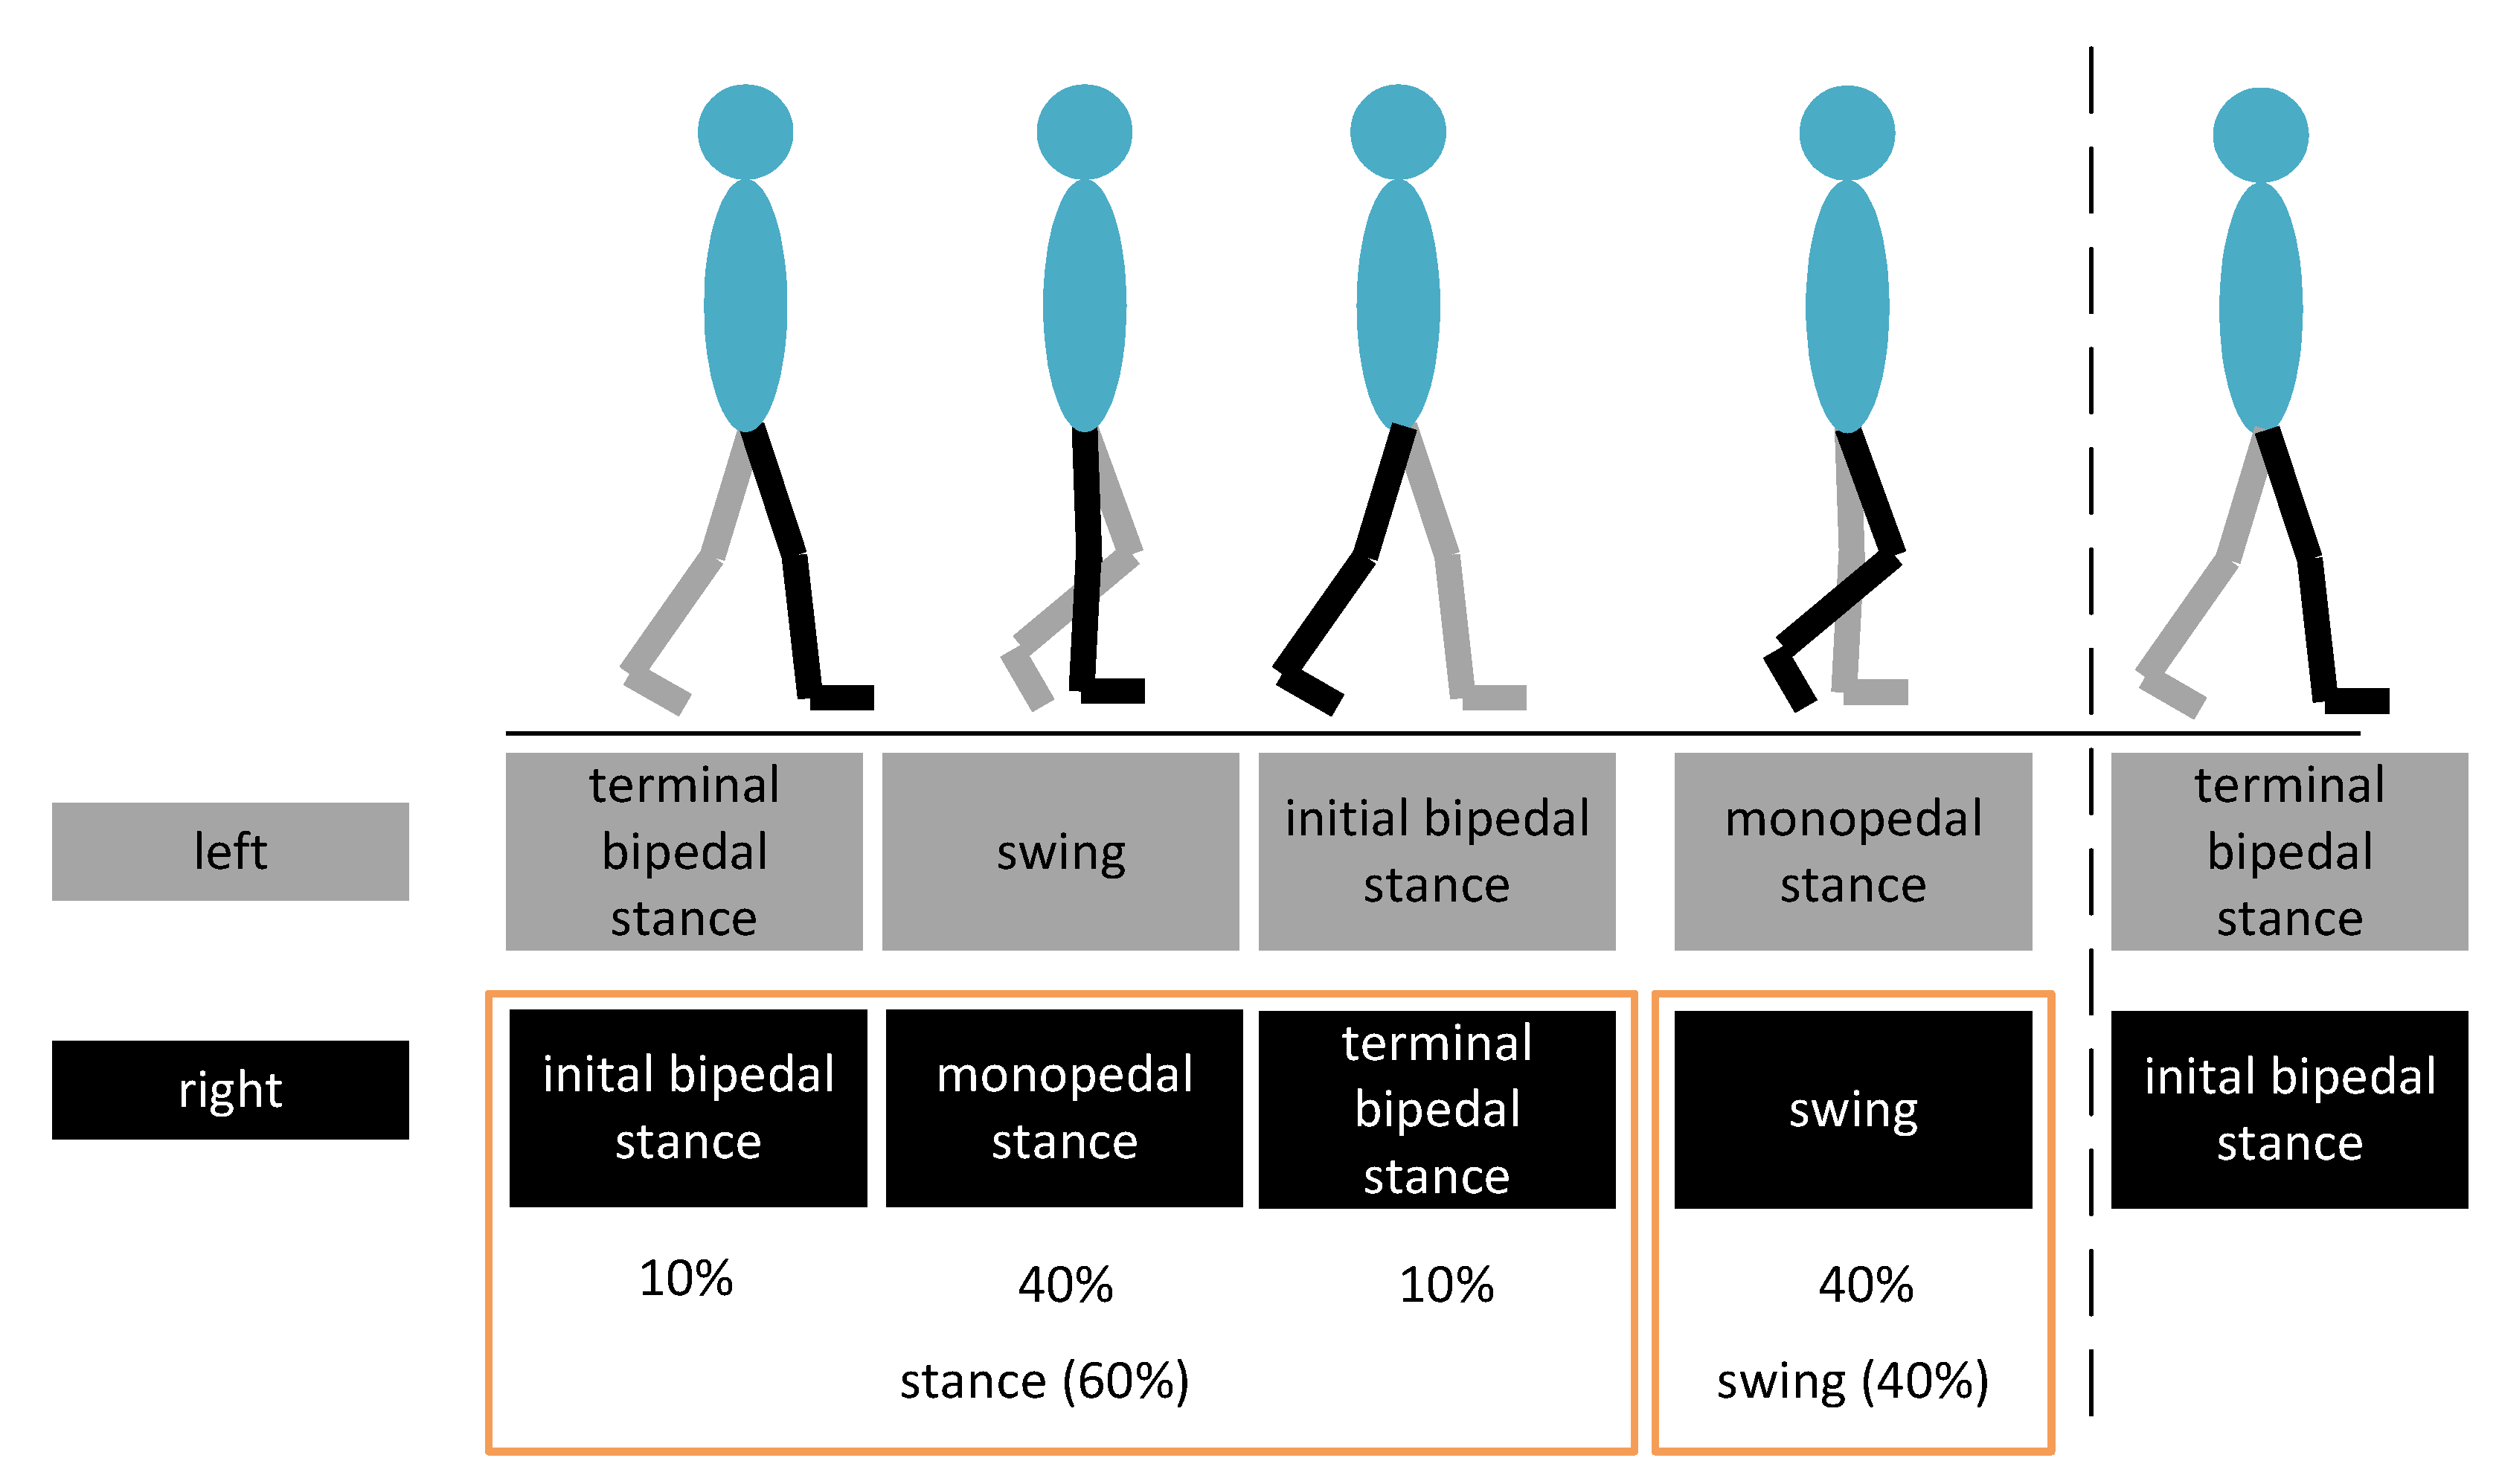
  • class 1: left single support
  • class 2: right single support
  • class 3: double support
A total of approx. 1250 IC events were contained in each sequence. A sliding window of 1100 samples was moved over the whole EEG data with an increment of 10 samples. The size of the window resembled the duration of one gait cycle. In order to split data into disjoint training, validation, and test data, the data were split into multiple segments prior to sliding the window. Each window had a size of 10 * window size (11,000 samples). Afterwards, those segments were randomly assigned to training (70%), validation (10%), and test sets (20%). All windows were randomly shuffled before the training of each epoch.
We chose a recurrent deep learning approach because this end-to-end learning strategy requires no manual feature extraction step, which itself is a separate optimization problem. A simple but effective network architecture based on long short-term memory cells (LSTMs) [24] was chosen, which is often applied to time sequence classification and regression problems in many different areas [28,29,30]. This approach was chosen to resemble the time dependency of the EEG data, which provide important information for the classification of each sequence.
We chose the following layer architecture of the network:
  • Input layer of size 2 × 1100 (according to the number of EEG channels and window size)
  • LSTM layer with 10 LSTM units (returning whole sequence)
  • LSTM layer with 10 LSTM units (returning only the last value of the sequence)
  • Dense layer with 64 neurons
  • Dense layer with three neurons (according to the number of classes)
  • Softmax layer
  • Classification layer
Each layer was followed by a dropout layer with dropout probability of 0.2. Training was done using a maximum of 30 epochs and a mini-batch size of 1000. As an optimizer, Adam (adaptive moment estimation) was used and a learning rate of 0.01.
An LSTM network has multiple hyper parameters, which can be optimized based on the dataset. We empirically chose the abovementioned hyper parameters. However, they may be systematically optimized with different approaches, like grid search or random search, in further work.

3. Results

3.1. Gait-Event-Related Brain Potentials (gERPs)

Figure 5 (right column) shows the grand mean average of the participants for the averaged IC epochs. Figure 5 (left column) shows the same time plot of a single subject. As can be seen in Figure 5, the grand mean average of the gERP is time-locked to the onset of the initial contact (IC). The event-related potential shows a positive deflection in the time window from −400–0 ms before the start of the IC and an increase in amplitude (negative in voltage) starting immediately at IC onset (see yellow shaded area in Figure 5 and Figure 6). This increase in amplitude reaches its maximum across participants at about 100–200 ms post IC onset and lasts for about 400 ms until the start of a second negativity. This ERP modulation, triggered by the IC, is found across subjects (Figure 5, right column) and at the single subject level (Figure 5, left column). As shown in Figure 5, the amplitude of the potential was modulated by instruction, e.g., whether participants attended to the movement, or made large or small steps. The potential was most pronounced at centroparietal electrode sites, CP1 and CP2. It was observed at central and frontocentral electrodes as well. Topographic plots show a focus on the central and centroparietal electrode sites (C3 and CP1) of the left hemisphere, see Figure 6 (top right column). Exploratory source imaging plots comprising the time period from 0–400 ms post IC onset are illustrated in Figure 6. The plots confirm neural activity changes starting in BA 6 (motor cortex) immediately at IC onset, extending to the somatosensory cortex (BA 5) and the inferior parietal cortex (BA 40).

3.2. Frequency Analysis (ERSP)
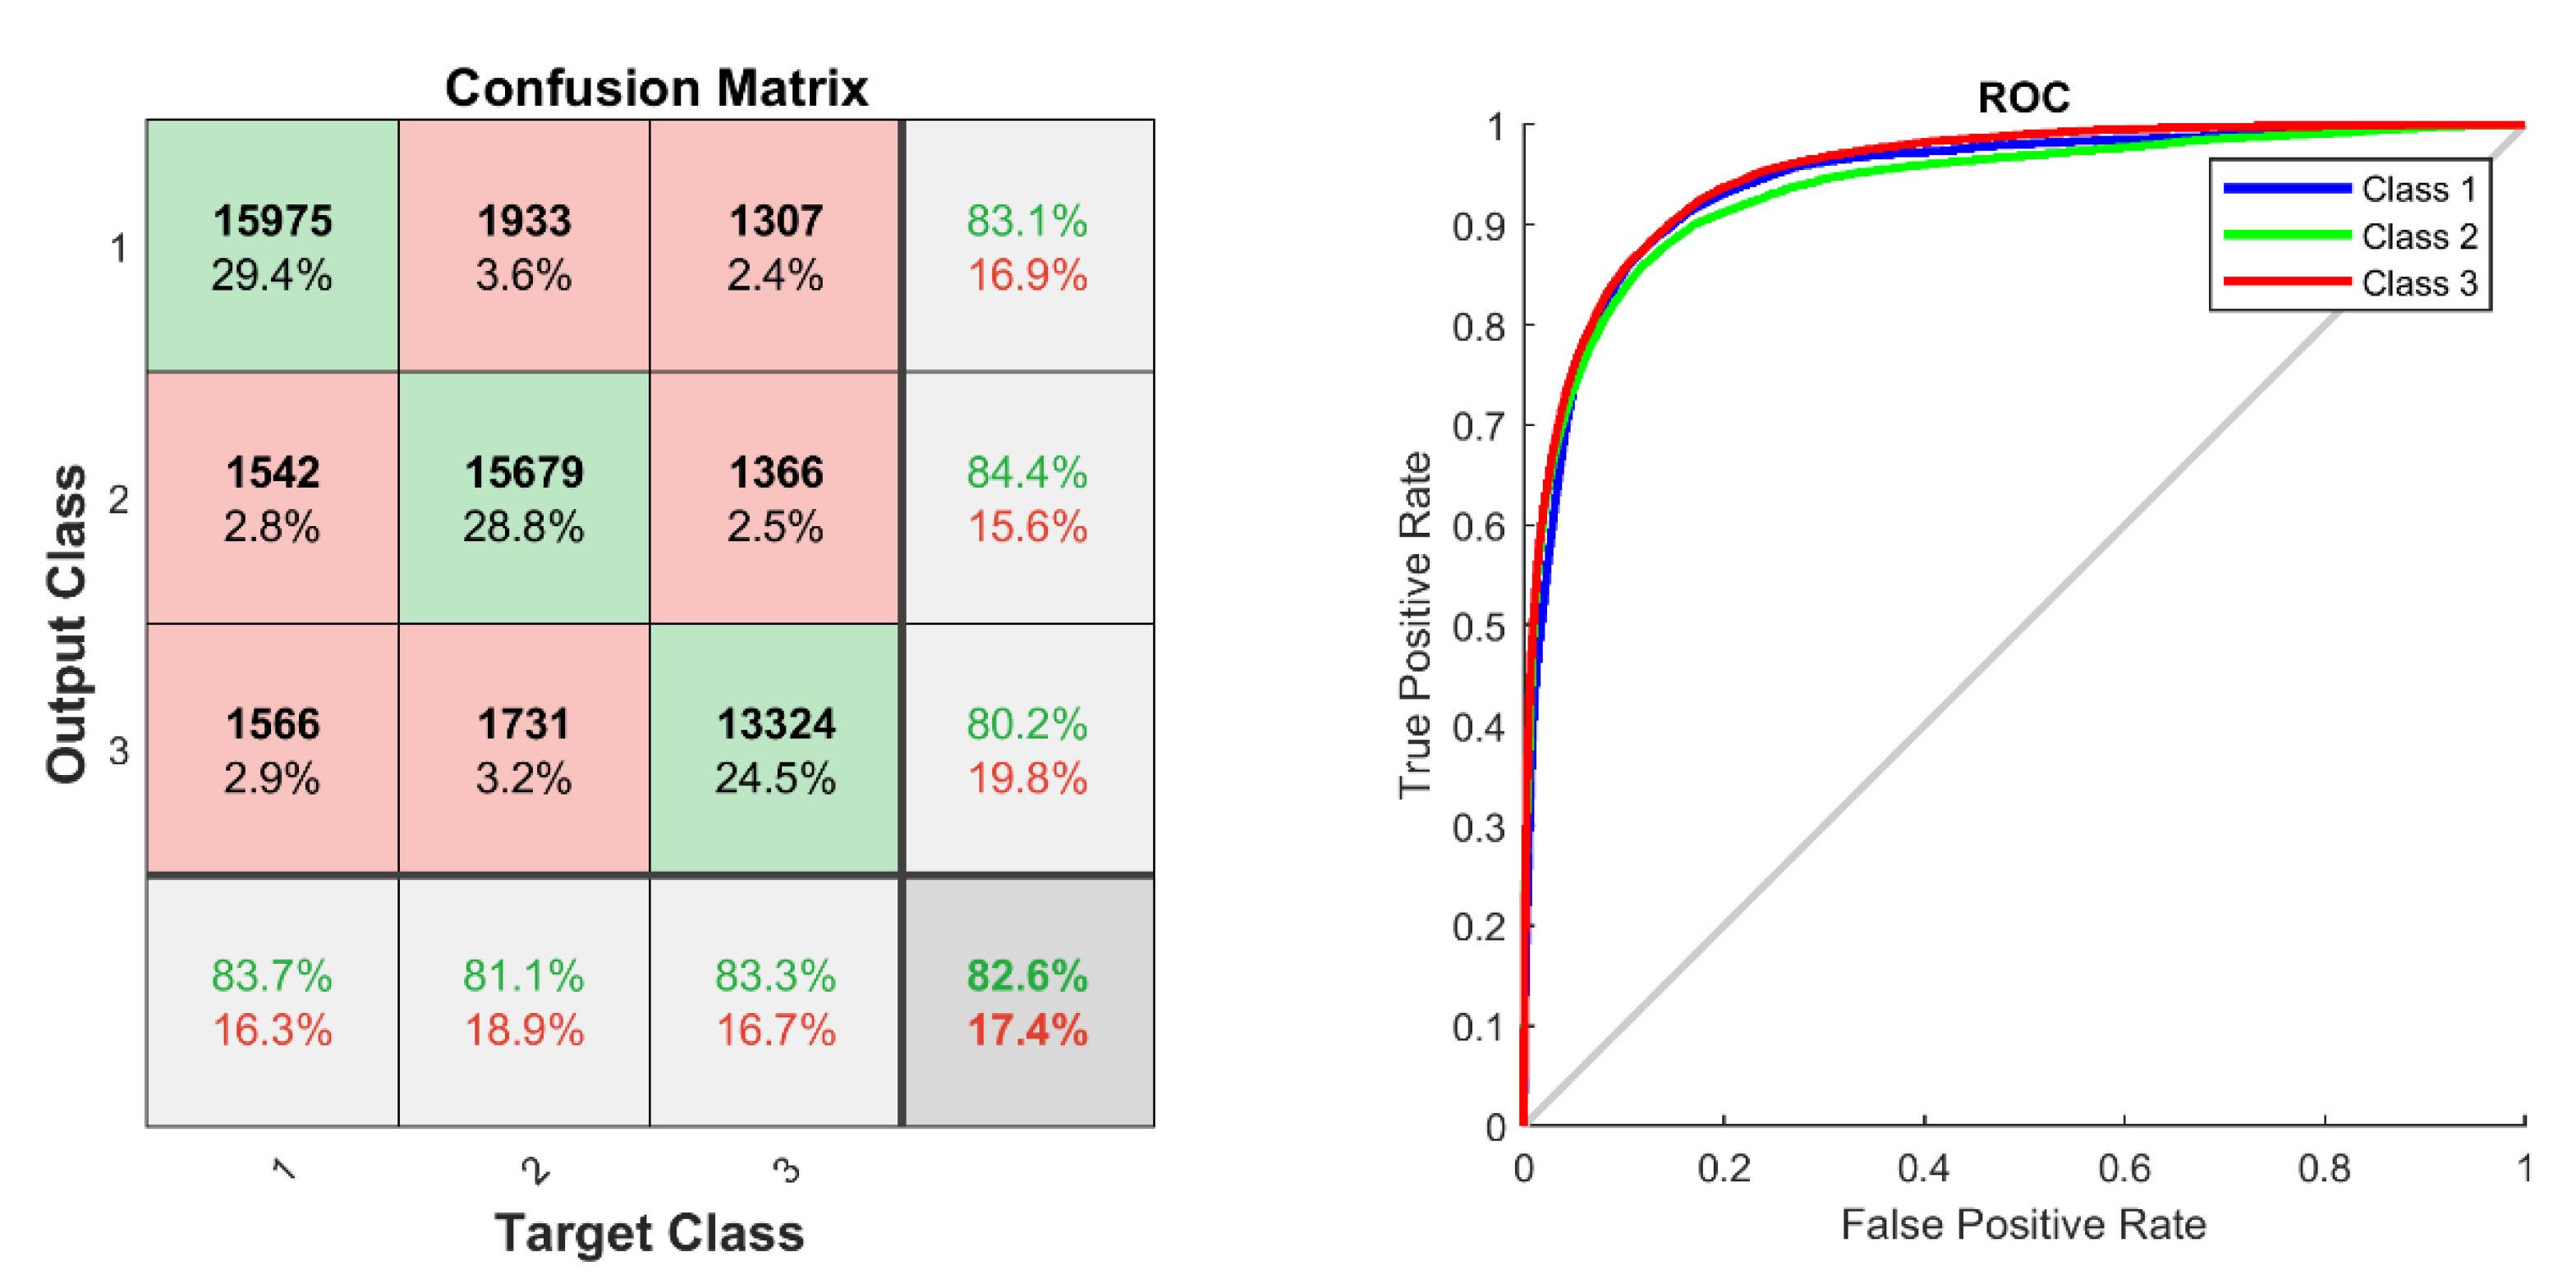
Furthermore, to explore the neural correlates of the gait cycle in the frequency domain, ERSP plots were calculated with EEGlab toolbox to determine overall changes in frequency patterns across participants. This revealed a change in the frequency power spectrum starting at around 400 ms before IC onset. This change can best be described as a decrease in the alpha band/mu rhythm (event-related desynchronization), whereas a prominent increase in the alpha power (event-related synchronization) was seen in the time window from 0–300 ms post IC onset. These patterns were observed for the left and right IC events, see Figure 7.

3.3. Neural Network

The trained gait phase classifier achieved an overall accuracy of 82.5% (subject 1), 82.6% (subject 2) and 86.0% (subject 3) on the test dataset. The confusion matrices in Figure 8, Figure 9 and Figure 10 show that the network is able to distinguish between left and right single support phases (classes 1 and 2) and between the double support phase (class 3) with a high precision. The networks for all three subjects show similar results. Confusion between the classes occur with approximately the same frequency. Figure 8, Figure 9 and Figure 10 show the receiver operating characteristics (ROC) curve for all classes for the individual subjects. In all three subjects, the ROC curves are well separated from the diagonal and rise fast, confirming the above findings about the classifier performance.

4. Discussion and Conclusions

This pilot study explored the experimental and technical solutions for the analysis of gait-event-related brain potentials (gERPs) during treadmill walking based on gait markers taken from pressure plates implemented in the treadmill. Although the attempt to evaluate the neural correlates of human gait by means of EEG is not new, the approach of the present study aimed to investigate open key questions that will now be discussed in detail.
The technical solution investigated in this study allows for the synchronization of gait and EEG data from different recording devices and from different recording software installed on different computers. While parallel ports are the best way to avoid jittering and produce precise triggering, the problem is that today these ports are no longer available in customized computers and are instead replaced by serial ports or by Bluetooth. These solutions, however, do not reach the accuracy of data transfer of parallel ports. As observed in the validation tests performed in the present study, the custom-made USB synchronization interface—connecting the stimulation unit and the pressure plate—produced a temporal delay of the trigger signal of >2 ms. This temporal delay is intolerable for ERP analysis because ERPs are measured time-locked to the onset of the event of interest. Therefore, the data streams recorded need to be synchronized, such that the gait events of interest can be used as reliable markers for EEG epoching and ERP averaging. In the present solution, the custom-built USB interface was developed. The interface controls signal transfer from one device to the other and allows for determining the temporal delay elicited during data transfer and uses this information for data synchronization. Whereas the first step included a hardware solution, the second step included a software solution using MATLAB as a programming platform. Moreover, a parallel port was used for sending triggers from the stimulation unit to the EEG recording unit. These triggers were used as jitter-free references to which triggers sent from the stimulation unit to the force plate were later aligned.

4.1. Analysis of gERPs Using Gait Markers

As described in detail in the Methods, the individual events of the human gait cycle were taken from the data recorded by the pressure plate. After the preprocessing of the raw data, prominent gait events, i.e., the initial contact (IC) of the left foot and right foot, respectively, were clearly identified from the recorded data and were used for EEG epoching and ERP averaging. As a gait event, the IC is characterized by distinct periods of motor preparation and motor execution and, therefore, most likely elicits specific motor cortical potentials probably even during spontaneous walking. In the present study, IC-related ERP analysis included both spontaneous and instructed treadmill walking. As illustrated in Figure 5 and Figure 6, this elicited a prominent increase in negativity, starting immediately after the initial contact (IC) and peaking within the first 100 ms post IC onset, clearly visible in all conditions of instructed and spontaneous walking. These motor-related changes in cortical activity were observed in all three individual participants, as well as in the grand average waveforms including all participants. Descriptively, as illustrated in Figure 5 and Figure 6, the amplitude of the potential was differentially pronounced during spontaneous as compared to, e.g., instructed walking. Asking participants, for instance, to make small or large steps modulated the amplitude of the potential compared to spontaneous walking. This suggests that walking is under the control of cognition and attention [10,21]. This assumption, that in the present pilot study can only be reported descriptively, should be validated in future studies that use the same experimental set-up but include more volunteers than in the present study for statistical testing. Topographic plots, as well as source imaging plots, revealed another interesting finding. Although the motor potential was most pronounced at the left and right frontocentral and centroparietal electrodes, it was topographically most pronounced at the left central and centroparietal electrodes, C3 and CP1. In the 10-20 EEG system, the electrodes C3 and C4, as well as CP1 and CP2, are close to the primary motor and primary somatosensory cortex. Given that the motor potential was found in all walking conditions, this also suggests the participation of the motor cortex during spontaneous walking. In addition, gait control seems to be more under the control of the left compared to the right cortical hemisphere. This may have implications for clinical observations of gait asymmetry and brain lesions in stroke patients [31]. Moreover, activity changes extended to the inferior parietal cortex (BA40), forming part of the cortex’s fronto-parietal attention network [32]. However, the assumptions of a stronger involvement of the left hemisphere in walking, as well as the assumptions about the role of attention, should be tested statistically and validated in future studies that include more volunteers for statistical testing.
Taken together, the present results, although preliminary, suggest that ERPs of the human gait cycle (such as the IC) can be reliably detected in EEG recordings after temporal synchronization with the gait event and after standardized preprocessing of the EEG data. Moreover, the use of active electrodes seems helpful to obtain data with a sufficient signal to noise ratio. Future studies, using the structural design and experimental set-up of the present study, could provide further evidence for gERPs and their modulation during spontaneous and instructed treadmill walking. As shown in Figure 7, motor potential modulation was accompanied by a decrease in the alpha/mu rhythm prior to the IC and an increase in alpha band activity immediately after the onset of the IC. This is in line with other findings, suggesting event-related desynchronization (ERDS) and event-related synchronization (ERS) before and after movement execution [15]. Given that, so far, little is known about the neural correlates of human gait, future studies should include both measures, ERPs and ERDS/ERS, to further elucidate the cortical control of human gait.

4.2. Implications for the Rehabilitation of Gait

The possibility to record ERPs related to human gait in real time offers novel ways for the treatment of people with various gait impairments. The present study suggests that gait-related motor potentials are reliably elicited during treadmill walking and can be analyzed by EEG recordings time-locked to the gait-marker derived from gait recordings via force plates. Regarding the technological solutions, these analyses can be extended to IMU systems in future studies.

4.3. Can Gait-Related EEG Data be Trained and Classified by an ANN?

The answer to this question has implications for the development of novel brain–computer interface (BCI) applications and neurofeedback training. So far, BCIs for movement control are largely based on the motor imagery of leg, arm, or finger movements. Such applications are quite helpful, if the aim is to substitute real movements with imagined movements in patients who have lost their limbs, arms, etc. In the present study, data were trained by an artificial neural network to discriminate EEG activity by classifying gait phases. A gait phase change corresponds to a toe-off or initial contact event. Although preliminary, it was possible to classify events from non-events with high accuracy. This is very promising, as the chosen architecture is simple compared to other time series classification approaches. One possible extension could be the application of ConvLSTM networks, i.e., a combination of convolutional neural networks (CNNs) and LSTM networks. Those networks have been shown to outperform simple LSTM networks due to complex features extracted from the convolutional layers. Besides changes in the architecture, there are number of additional ways of improving the network results, which have not been applied in this work, because the network served as a proof of concept of the applicability of the framework.

Author Contributions

Conceptualization, C.H. and M.M.; methodology, C.H. and M.M.; software, M.M.; experimental set-up and paradigm, C.H.; validation, C.H. and M.M.; formal analysis, C.H. and M.M.; investigation, C.H.; resources, C.H.; data curation, C.H.; writing—original draft preparation, C.H. writing—review, editing and revision, C.H. and M.M.; visualization, C.H. and M.M.; supervision, C.H. and M.M.; project administration, C.H. All authors have read and agreed to the published version of the manuscript.

Funding

This research received no external funding.

Acknowledgments

The authors like to thank the subjects who voluntarily supported this study during the measurements and our master’s student, J.N.

Conflicts of Interest

The authors declare no conflict of interest.

Data Availability Statement

The data supporting the conclusions of this manuscript can be made available by the corresponding authors, without undue reservation, to any qualified researcher upon request. Due to the informed consent form in which the possibility of raw data being published online was not explicitly stated, the raw data cannot be made accessible in online repositories.

References

  1. Belda-Lois, J.-M.; Mena-del Horno, S.; Bermejo-Bosch, I.; Moreno, J.C.; Pons, J.L.; Farina, D.; losa, M.; Molinari, M.; Tamburella, F.; Ramos, A.; et al. Rehabilitation of gait after stroke: A review towards a top-down approach. J. Neuroeng. Rehabil. 2011, 8. [Google Scholar] [CrossRef] [PubMed] [Green Version]
  2. Mirelman, A.; Shema, S.; Maidan, I.; Hausdorff, J.M. Gait. Handb. Clin. Neurol. 2018, 159, 119–134. [Google Scholar] [PubMed]
  3. Ambrose, A.F.; Cruz, L.; Paul, G. Falls and Fractures: A systematic approach to screening and prevention. Maturitas 2015, 82, 85–93. [Google Scholar] [CrossRef]
  4. Amboni, M.; Barone, P.; Hausdorff, J.M. Cognitive contributions to gait and falls: Evidence and implications. Mov. Disord. Off. J. Mov. Disord. Soc. 2013, 28, 1520–1533. [Google Scholar] [CrossRef]
  5. Enright, P.L.; Sherrill, D.L. Reference equitations for the six-minute walk in healthy adults. Am. J. Respir. Crit. Care Med. 1998, 158, 1384–1387. [Google Scholar] [CrossRef] [Green Version]
  6. Allali, G.; Blumen, H.M.; Devanne, H.; Pirondini, E.; Delval, A.; van de Ville, D. Brain imaging of locomotion in neurological conditions. Neurophysiol. Clin. 2018, 48, 337–359. [Google Scholar] [CrossRef]
  7. Babiloni, C.; Carducci, F.; Cincotti, F.; Rossini, P.M.; Neuper, C.; Pfurtscheller, G.; Babiloni, F. Human movement-related potentials vs. desynchronization of EEG alpha rhythm: A high-resolution EEG study. NeuroImage 1999, 10, 658–665. [Google Scholar]
  8. Pfurtscheller, G.; Neuper, C.; Krausz, G. Functional dissociation of lower and upper frequency mu rhythms in relation to voluntary limb movement. Clin. Neurophysiol. Off. J. Int. Fed. Clin. Neurophysiol. 2000, 111, 1873–1879. [Google Scholar] [CrossRef]
  9. Cassim, F.; Szurhaj, W.; Sediri, H.; Devos, D.; Bourriez, J.; Poirot, I.; Derambure, P.; Defebvre, L.; Guieu, J. Brief and sustained movements. Differences in event-related (de)synchronization (ERD/ERS) patterns. Clin. Neurophysiol. Off. J. Int. Fed. Clin. Neurophysiol. 2000, 111, 2032–2039. [Google Scholar] [CrossRef]
  10. Debener, S.; Minow, F.; Emkes, R.; Gandras, K.; de Vos, M. How about taking a low-cost, small, and wireless EEG for a walk? Psychophysiology 2012, 49, 1617–1621. [Google Scholar] [CrossRef] [PubMed]
  11. Böcker, K.B.E.; Brunia, C.H.M.; Cluitmans, P.J.M. A spatio-temporal dipole model of the readiness potential in humans. II. Foot movement. Electroencephalogr. Clin. Neurophysiol. 1994, 91, 286–294. [Google Scholar]
  12. Boschert, J.; Deecke, L. Cerebral potentials preceding voluntary toe, knee and hip movements and their vectors in human precentral gyrus. Brain Res. 1986, 376, 175–179. [Google Scholar] [CrossRef]
  13. Pfurtscheller, G.; Brunner, C.; Schlogl, A.; Lopes da Silva, F.H. Mu rhythm (de)synchronization and EEG single-trial classification of different motor imagery tasks. NeuroImage 2006, 31, 153–159. [Google Scholar] [CrossRef] [PubMed]
  14. Justen, C.; Herbert, C. Snap your fingers! An ERP/sLORETA study investigating implicit processing of self-vs. other-related movement sounds using the passive oddball paradigm. Front. Hum. Neurosci. 2016, 10, 465. [Google Scholar] [CrossRef] [PubMed] [Green Version]
  15. Pfurtscheller, G.; Lopes da Silva, F.H. Event-related EEG/MEG synchronization and desynchronization: Basic principles. Clin. Neurophysiol. 1999, 110, 1842–1857. [Google Scholar] [CrossRef]
  16. Neuper, C.; Klimesch, W. (Eds.) Advances in genetics: V. 159. In Event-Related Dynamics of Brain Oscillations; Academic Press: Amsterdam, The Netherlands; Boston, MA, USA, 2006. [Google Scholar]
  17. Beurskens, R.; Steinberg, F.; Antoniewicz, F.; Wolff, W.; Granacher, U. Neural Correlates of Dual-Task Walking: Effects of Cognitive versus Motor Interference in Young Adults. Neural Plast. 2016, 8032180. [Google Scholar] [CrossRef] [Green Version]
  18. Arad, E.; Bartsch, R.P.; Kantelhardt, J.W.; Plotnik, M. Performance-based approach for movement artifact removal from electroencephalographic data recorded during locomotion. PLoS ONE 2018, 13, e0197153. [Google Scholar] [CrossRef]
  19. Montero-Odasso, M.; Verghese, J.; Beauchet, O.; Hausdorff, J.M. Gait and cognition: A complementary approach to understanding brain function and the risk of falling. J. Am. Geriatr. Soc. 2012, 60, 2127–2136. [Google Scholar] [CrossRef] [Green Version]
  20. Woollacott, M.; Shumway-Cook, A. Attention and the control of posture and gait: A review of an emerging area of research. Gait Posture 2002, 16, 1–14. [Google Scholar] [CrossRef]
  21. Yogev-Seligmann, G.; Hausdorff, J.M.; Giladi, N. The role of executive function and attention in gait. Mov. Disord. Off. J. Mov. Disord. Soc. 2008, 23, 329–342. [Google Scholar] [CrossRef] [Green Version]
  22. Perry, J. Gait Analysis, 2nd ed.; SLACK Incorporated: Thorofare, NJ, USA, 2010. [Google Scholar]
  23. Whittle, M.W. Clinical gait analysis: A review. Hum. Mov. Sci. 1996, 15, 369–387. [Google Scholar] [CrossRef]
  24. Hochreiter, S.; Schmidhuber, J. Long short-term memory. Neural Comput. 1997, 9, 1735–1780. [Google Scholar] [CrossRef] [PubMed]
  25. Widmann, A.; Schröger, E.; Maess, B. Digital filter design for electrophysiological data—A practical approach. J. Neurosci. Methods 2015, 250, 34–46. [Google Scholar] [CrossRef] [PubMed] [Green Version]
  26. Junghöfer, M.; Bradley, M.M.; Elbert, T.R.; Lang, P.J. Fleeting images: A new look at early emotion discrimination. Psychophysiology 2001, 38, 175–178. [Google Scholar] [CrossRef] [PubMed]
  27. Herbert, C.; Junghofer, M.; Kissler, J. Event related potentials to emotional adjectives during reading. Psychophysiology 2008, 45, 487–498. [Google Scholar] [CrossRef]
  28. Saleh, K.; Hossny, M.; Nahavandi, S. Driving behavior classification based on sensor data fusion using LSTM recurrent neural networks. In Proceedings of the 2017 IEEE 20th International Conference on Intelligent Transportation Systems (ITSC), Yokohama, Japan, 16–19 October 2017; pp. 1–6. [Google Scholar]
  29. Fawaz, H.I.; Forestier, G.; Weber, J.; Idoumghar, L.; Muller, P.A. Deep learning for time series classification: A review. Data Min. Knowl. Discov. 2019, 33, 917–963. [Google Scholar] [CrossRef] [Green Version]
  30. Zhang, Q.; Wang, H.; Dong, J.; Zhong, G.; Sun, X. Prediction of sea surface temperature using long short-term memory. IEEE Geosci. Remote Sens. Lett. 2017, 14, 1745–1749. [Google Scholar] [CrossRef] [Green Version]
  31. Alexander, L.D.; Black, S.E.; Patterson, K.K.; Gao, F.; Danells, C.J.; McIlroy, W.E. Association between gait asymmetry and brain lesion location in stroke patients. Stroke 2009, 40, 537–544. [Google Scholar] [CrossRef] [Green Version]
  32. Ptak, R. The frontoparietal attention network of the human brain: Action, saliency, and a priority map of the environment. Neuroscientist 2012, 18, 502–515. [Google Scholar] [CrossRef]
Figure 1. Monopedal (single support) and bipedal (double support) phases of gait over one gait cycle (based on [22]), with corresponding average percentages of gait cycle. Each initial bipedal stance phase begins with initial contact (IC), followed by loading response (LR). Monopedal stance covers mid-stance (MS), and terminal bipedal stance begins with terminal stance (TS) and ends with toe-off (TO), directly leading to the swing phase.
Applsci 10 05405 g001
Figure 2. The participant is wearing the 32-channel EEG cap with active electrodes while walking on the treadmill and while gait events are recorded by a force plate implemented in the treadmill. In addition, the gait of the participants can be tracked by inertial sensor units (IMUs). The inertial sensors are blue and fixed with black straps. Clearly visible are the units at the hip and the thighs. Participants wore no shoes during treadmill walking to avoid heavy concussions. Picture with permission and copyright of University Ulm, Department of Applied Emotion and Motivation Psychology, Germany.
Applsci 10 05405 g002
Figure 3. Structural design of the technical solution developed in this study. The solution includes the interfaces between the subsystems and recording devices. The stimulus PC can send triggers to the EEG, the pressure plate (treadmill), and the recording software of the inertial sensors (IMUs). Each system sends the recorded data to a corresponding PC.
Applsci 10 05405 g003
Figure 4. Vertical ground reaction force (vGRF) for left and right foot calculated from a pressure plate for gait event extraction. Green vertical lines show the extracted initial contact (IC) events, in black, toe-off events (TO).
Applsci 10 05405 g004
Figure 5. Grand mean event-related potential (ERP )waveforms averaged across the three participants time-locked to the left initial contact of the gait cycle (right column) at the left hemisphere EEG electrode position CP1 for the different walking conditions of spontaneous (gray) and instructed (small steps (red), large steps (blue)) treadmill walking. Grand average ERP waveforms of a single subject, time-locked to the left initial contact of the gait cycle (left column) at the left hemisphere EEG electrode position CP1 for the different walking conditions of spontaneous (black) and instructed (small steps (red), large steps (blue)) treadmill walking. Yellow shaded parts, please see explanation in the text.
Applsci 10 05405 g005
Figure 6. Gait-event-related potential (gERP) elicited by the left initial contact (IC), plotted as grand average (including data of all three volunteers) with BrainVison Analyzer software at the left hemisphere electrode CP1 for the different walking conditions of spontaneous (black) and instructed (small steps (red), large steps (blue)) treadmill walking. Yellow shaded part, please see explanation in the text. Topography of the gERP elicited by the left initial contact in the time window from 0-100 ms after the IC onset (right column). Source imaging plots (averaged across the different walking conditions) from BrainVison Analyzer software for the time course of the gERP from 0–200 ms, 200–300 ms, and from 300–400 ms after left IC onset.
Applsci 10 05405 g006
Figure 7. Frequency analysis performed with EEGlab software showing mean power spectrum and mean event-related spectral perturbation (ERSP) for the time-period from −400 ms before until 400 ms after left initial IC onset for the left hemisphere EEG channel C3, averaged over the datasets of all three volunteers.
Applsci 10 05405 g007
Figure 8. Confusion matrix (left) and ROC curve (right) of classifier for subject 1 on test data.
Applsci 10 05405 g008
Figure 9. Confusion matrix (left) and ROC curve (right) of classifier for subject 2 on test data.
Applsci 10 05405 g009
Figure 10. Confusion matrix (left) and ROC curve (right) of classifier for subject 3 on test data.
Applsci 10 05405 g010

